Recursive Least Square Filter
Noise Reduction in Differential Phase Shift Keying Modulator Using Recursive Least Square Filter
1Electrical Engineering Department, Rivers State University, Port Harcourt, Rivers State, Nigeria
2Electrical/Electronics Engineering Department, Rivers State University, Port Harcourt, Rivers State, Nigeria
Published September2026
Abstract
This study investigates the performance enhancement of Differential Phase Shift Keying (DPSK) communication systems under noisy channel conditions using an adaptive filtering method, specifically the Recursive Least Squares (RLS) approach. The primary objective is to mitigate interference and improve signal integrity in real-time applications where additive white Gaussian noise (AWGN) degrades performance. DPSK signals were mathematically modelled, considering phase shifts of 0° and 180° for binary encoding, and transmitted through simulated noisy channels with input SNRs ranging from 0 to 20 dB. A model-based design framework in MATLAB was employed to implement the RLS filter, which recursively updates its coefficients to minimise the mean square error between the received and estimated signals. Performance was quantitatively evaluated using Bit Error Rate (BER), Signal-to-Noise Ratio (SNR), and spectral efficiency metrics. Results indicate that the RLS filter achieved a maximum noise reduction of 8 dB at 0 dB input SNR and consistently outperformed conventional Butterworth filters. At a critical SNR of 10 dB, the DPSK-RLS system reduced noise by 75%, compared to 25.2% and 41.2% reported by Ofeogbu et al. (2022) and Liang et al. (2023), respectively, and increased spectral efficiency from 1.15 to 3.45 bps/Hz. Stability and convergence analyses using Lyapunov functions confirmed reliable real-time adaptation. The proposed method demonstrates a robust and adaptive solution for high-reliability communication systems, ensuring superior error mitigation, improved SNR, and enhanced bandwidth utilisation, providing practical guidance for deploying adaptive filtering in modern digital communication networks. Also adaptive recursive least square filter reduces mean squared errors from 0.25v2 to 0.01v2 significantly outperforming traditional fixed filters like Butterwork.
Keywords: modulator; noise reduction; differential phase; mitigation; signal integrity
1Introduction
1.1Background of the study
In order to efficiently transmit data over noisy channels, digital communication systems mostly rely on modulation techniques. Due to its ease of use and resilience to certain impairments, Differential Phase Shift Keying (DPSK) is a frequently employed modulation method [1]. Nevertheless, noise has a major impact on DPSK performance, which lowers communication quality and raises mistake rates. In order to successfully send data over noisy channels, digital communication systems mostly rely on modulation techniques. Because of its ease of use and resilience to certain impairments, Differential Phase Shift Keying (DPSK) is a commonly used modulation method [1]. Nevertheless, noise has a major impact on DPSK performance, which lowers communication quality and raises mistake rates. Therefore, the development of effective noise reduction techniques for DPSK modulators is essential to ensure reliable data transmission in real-world environments [2].
One promising approach for noise reduction in DPSK modulators is the utilization of Recursive Least Squares (RLS) filters. RLS filters offer adaptive capabilities, allowing them to continuously update their coefficients based on incoming data samples. This adaptability makes them particularly well-suited for mitigating the effects of noise in DPSK modulation, as they can dynamically adjust to changing channel conditions and suppress interference [3-5].
In this work, we examine the usage of RLS filters to reduce noise in DPSK modulators. Our main goal is to improve DPSK communication systems' performance by successfully reducing the effect of noise on signal quality. We want to increase overall system dependability, reduce bit error rates (BER), and improve signal-to-noise ratio (SNR) by incorporating RLS filters into the modulator structure. Throughout this research, we will delve into the theoretical underpinnings of DPSK modulation, noise characterization, and the principles of RLS filtering. We will then proceed to develop a comprehensive understanding of how RLS filters can be integrated into DPSK modulators to combat noise effectively. Practical implementation aspects, including algorithm design, parameter tuning, and computational complexity, will be carefully considered to ensure the feasibility and efficiency of the proposed approach [5].
To evaluate the effectiveness of the RLS-based noise reduction method in practical scenarios, experimental validation will also be carried out. We seek to show the efficacy and superiority of the suggested strategy by contrasting the outcomes with typical DPSK modulation and other noise reduction techniques.
In digital communication system, Differential Phase Shift Keying (DPSK) is a modulation scheme widely used due to its simplicity and resilience to certain impairments. However, the performance of DPSK is greatly affected by noise, which poses a significant challenge in maintaining reliable communication. The key issues related to the poor performance of noise are as follows; Impact of Noise on DPSK, Error Rate Performance and Detection and Demodulation Challenges:
The aim of this research is to reduce noise in DPSK modulators using a recursive least-squares filter by following these objectives; to analyze and investigate the behavior of DPSK modulation in the presence of different types of noise, to evaluate the performance of DPSK in terms of BER and SNR under various noise and channel conditions and to implement recursive least square technique to mitigate the effects of noise on DPSK communication systems and evaluate the spectral efficiency of the DPSK when RLS is implemented
2Review of related works
A research state that this work outlines the architecture of an orthogonal frequency division multiplexing (OFDM) system and assesses the effectiveness of different digital modulation methods used in the system [1,4]. The OFDM system was simulated, and several modulation techniques, such as M-ary quadrature amplitude modulation (M-QAM) and M-ary phase shift keying (M-PSK), were used over two separate channels: Rayleigh multipath fading channels and additive white Gaussian noise (AWGN). The amount of fast Fourier transform (FFT) points used during transmission was taken into account when analyzing the bit error rate (BER) for the various modulation methods over both channels. The findings showed that in both AWGN and Rayleigh fading channels, lower-order modulation schemes typically performed better than higher-order schemes. However, since lower-order systems usually have lower data rates than higher-order ones, this performance gain comes at the sacrifice of data rate. Furthermore, for every modulation scheme evaluated, the study found that the system performed better over the AWGN channel than the Rayleigh fading channel. The results indicated that the amount of FFT points used during transmission had little effect on the system's performance. To put it another way, the system's overall performance was not greatly affected by changes in the number of FFT points.
[3] claim that Differential Quadrature Phase Shift Keying (DQPSK), one of the near-field communication devices, has a better bit error rate than Quadrature Phase Shift Keying because the error values are always predicted by using the previously shifted values in both the modulated and demodulated signals. Incorporate CMOS technology to lower the error in the phase oscillator device for certain signals after using VHDL to build the phase signal and provide simulation results. By employing a QPSK receiver, it can increase data rate and decrease area. Additionally, noise detectors in the input signal's upper and lower ranges will assist reduce noise. Binary Phase Shift Keying (BPSK) only transfers one bit, whereas Quadrature Phase Shift Keying (QPSK) transfers four possible data transitions in two bits. The benefit of using QPSK is a higher data rate. The primary drawback is that there is a delay in the phase leap to 90 degrees. Additionally, QPSK lowers the maximum jump to 135 degrees.
[4] state that noise contaminates radio signals during channel transmission, resulting in signal distortion. One efficient way to lessen the effects of noise is through radio signal noise reduction. While standard signal-processing-based denoising techniques frequently require knowledge of the artificial domain, using deep learning (DL) to denoise signals can lessen the reliance on artificial domain knowledge. This work proposes a radio communication signal denoising technique based on the Relativistic Average Generative Adversarial Networks (RaGAN) to address the issue of radio communication signal noise reduction. In order to create a noise reduction model appropriate for radio communication signals that achieves end-to-end denoising of radio signals, this method combines the bidirectional long short-term memory (Bi-LSTM) model, which is effective at processing time-series data with RaGAN, with the weighted loss function. The experimental findings demonstrate that the suggested algorithm has greatly enhanced the noise reduction effect when compared to the current techniques. After noise reduction, the signal modulation recognition accuracy increases by roughly 10% in the case of a low signal-to-noise ratio (SNR) [5-7].
[6] investigated adaptive Recursive Least Squares (RLS) denoising for ventricular fibrillation ECG signals. Although the application was biomedical rather than digital communications, the study is relevant to adaptive noise suppression because it demonstrates the ability of RLS to continuously adjust filter coefficients in response to changing noise conditions [8-10].
The authors noted that RLS generally provides stronger convergence and filtering performance than several conventional adaptive filtering approaches, including LMS and NLMS.
3Materials and methods
3.1Materials
The materials used for setting up this experimental works includes DPSK modulator, RLS Filter, Sine Wave, Gaussian Noise, Low Pass Filter, PC
3.2Method
The primary engineering method used is Adaptive Filtering (specifically the Recursive Least Squares (RLS) algorithm) within a Model-Based Design framework. This method is used to dynamically suppress interference and equalize the channel in real-time of the DPSK.
3.3Analysis and investigation of the DPSK modulation behavior using recursive least square filter
3.3.1DPSK evaluation
To develop the mathematical equation of Differential Phase Shift Keying (DPSK), we first need to understand the basic principle of DPSK. In DPSK, the phase of the carrier signal is shifted to represent different symbols. Let's denote two symbols as s1 and s2, with corresponding phase shifts of and respectively. Then the phase difference between these two symbols can be represented as:
The DPSK modulation can be described by the following equation:
where A is the amplitude, ω is the angular frequency, and ϕ(t) is the phase function.
For DPSK, the phase function ϕ(t) changes depending on the transmitted symbol. Assuming binary DPSK, ϕ(t) can be defined as:
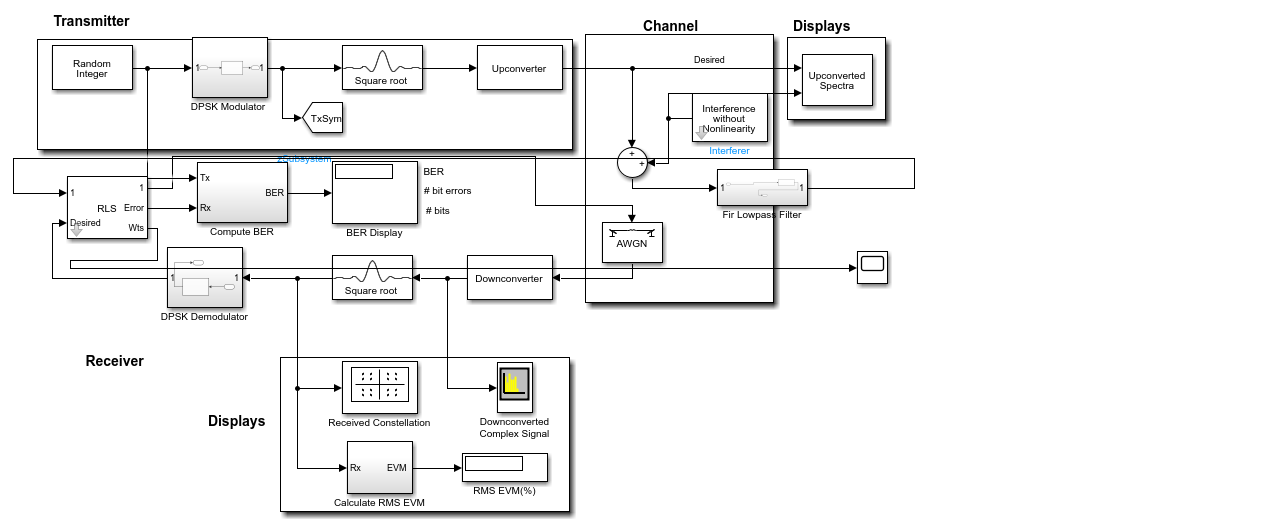
From Figure 1, this Simulink block diagram illustrates a sophisticated digital communication link simulation designed to test signal robustness against interference. In the transmitter section, random data is modulated using Differential Phase Shift Keying (DPSK) and shaped through a square-root filter before up conversion. The signal then traverses a complex channel environment where it encounters Additive White Gaussian Noise (AWGN) and a specific interferer. At the receiver, the signal undergoes down conversion and matched filtering to reconstruct the original data. A central feature of this architecture is the adaptive filter Recursive Least Squares (RLS) block, which acts as an adaptive filter to minimize the error between the received signal and the desired reference, effectively cancelling out the interference. Engineers use the integrated displays to monitor the Bit Error Rate (BER), constellation patterns, and Error Vector Magnitude (EVM), providing a quantitative assessment of the system's performance and the effectiveness of the adaptive cancellation logic under varying channel.
3.3.2Noise evaluation on DPSK
In DPSK, the noise equation typically refers to the effect of noise on the received signal. Let's denote the received signal as r(t), and the transmitted signal as s(t). The received signal is a combination of the transmitted signal and the noise.
Assuming additive white Gaussian noise (AWGN), the received signal r(t) can be expressed as:
where:
- s(t) is the transmitted DPSK signal,
- n(t) is the additive white Gaussian noise.
The power spectral density (PSD) of the noise, denoted as N0, is related to the noise variance. The noise power N0 per unit bandwidth is a measure of the noise power present in the channel.
To represent the noise in DPSK, we can use the following equation for the noise power spectral density:
where N is the two-sided noise power spectral density.
3.4Performance of DPSK in terms of BER and SNR under various noise channels
3.4.1Evaluation of DPSK BER
The Bit Error Rate (BER) equation for Differential Phase Shift Keying (DPSK) in the presence of noise can be derived based on the probability of error in detecting symbols.
In DPSK, the decision boundaries are not determined by the amplitude but by the phase difference between consecutive symbols. Let's denote the phase difference between two symbols as Δϕ.
The BER for DPSK can be expressed as the probability of error in detecting the phase difference between two symbols. Assuming an AWGN channel, we can use the Q-function to express the probability of error.
For DPSK, the BER can be given by:
where:
- Eb is the energy per bit.
- N0 is the one-sided noise power spectral density.
- Q(x) is the Q-function, representing the tail probability of the Gaussian distribution.
The energy per bit Eb is related to the transmitted signal energy Es as:
Where R is the bit rate
3.4.2Evaluation of DPSK SNR
The Signal-to-Noise Ratio (SNR) for Differential Phase Shift Keying (DPSK) can be expressed in terms of the energy per bit Eb and the one-sided noise power spectral density N0.
The SNR can be given by:
Where:
Eb is the energy per bit.
N0 is the one-sided noise power spectral density.
The energy per bit Eb is related to the transmitted signal energy Es as:
SNR is signal to noise ratio
R is bit rate
Es is signal energy
3.5Implementation of the noise reduction technique on DPSK using RLS
The input to the RLS filter r(t) will be used in order to estimate (s ̂ ) the transmitted signal (s(t)) by removing its noise (n(t)). Therefore, as noted before, filtering using RLS will improve the received signal (r(t)) by decreasing the amount of noise, which will help provide a better representation of the transmitted signal.The RLS filter updates its coefficients recursively based on the current input and previous state. Let's denote the filter coefficients as wk for k=1,2,...,Nk=1,2,...,N, where N is the filter order. The output of the RLS filter, s , can be expressed as the dot product of the filter coefficients wk and the input signal r(t):
The error signal, denoted as e(t), is the difference between the received signal r(t) and the estimated signal :
Reducing the mean square error (MSE) between the estimated and received signals is the aim of the RLS filter. The recursive least squares algorithm is used by the filter to update its coefficients.
The RLS algorithm is based on the following update equations:
Where:
is the N×N matrix called the "inverse correlation matrix".
is the vector of filter coefficients at time k.
λ is the forgetting factor.
is the vector of input samples at time k.
is the error at time k.
| Category | Parameter | Description | Typical Value/Range |
|---|---|---|---|
| DPSK Modulation | Carrier Amplitude | Amplitude of the transmitted signal | 1 V, 5 V (normalized) |
| Carrier Frequency | Angular frequency of the carrier signal | 2πfc (e.g., 1 MHz) | |
| Phase Shifts | Phase differences for symbols s1, s2 (e.g., 0°, 180°) | 0, π (binary DPSK) | |
| Noise Model | Noise Type | Additive White Gaussian Noise (AWGN) | — |
| Noise Power Spectral Density | One-sided noise PSD | 10⁻⁶ – 10⁻³ W/Hz | |
| SNR (Before Filtering) | Signal-to-Noise Ratio (pre-filter) | 0 dB to 20 dB | |
| RLS Filter | Filter Order | Number of filter coefficients | 4, 8, 16 (adaptive) |
| Forgetting Factor | Controls memory of past data (0 < λ ≤ 1) | 0.95–0.999 | |
| Initial Coefficients | Initial weights of the filter | Zero vector or small random | |
| Step Size | Adaptation rate (if applicable) | 0.01–0.1 | |
| Performance Metrics | Bit Error Rate (BER) | Probability of bit error (Eq. 3.6) | Q(√(2Eb/N0)) |
| BER (Post-RLS) | BER after RLS filtering (Eq. 3.18) | - | |
| Spectral Efficiency | Bits/sec/Hz (Eq. 3.15) | Improved by SNRafter | |
| Convergence Criterion | Lyapunov function (MSE) for stability (Eq. 3.16) | lim k→∞ V(wk) = 0 | |
| Comparative Analysis | Butterworth Filter Order | Order of Butterworth LPF (for comparison) | 2nd, 4th order |
| BER (Butterworth) | BER with Butterworth filter (Eq. 3.20) | — | |
| Improvement Factor | Ratio of post-filter SNR to pre-filter SNR (Eq. 3.19, 3.21) | ≥1 |
4Results and discussion
4.1Analysis and investigation of the DPSK modulation behavior using recursive least square filter
4.1.1DPSK modulated signal and phase characteristics
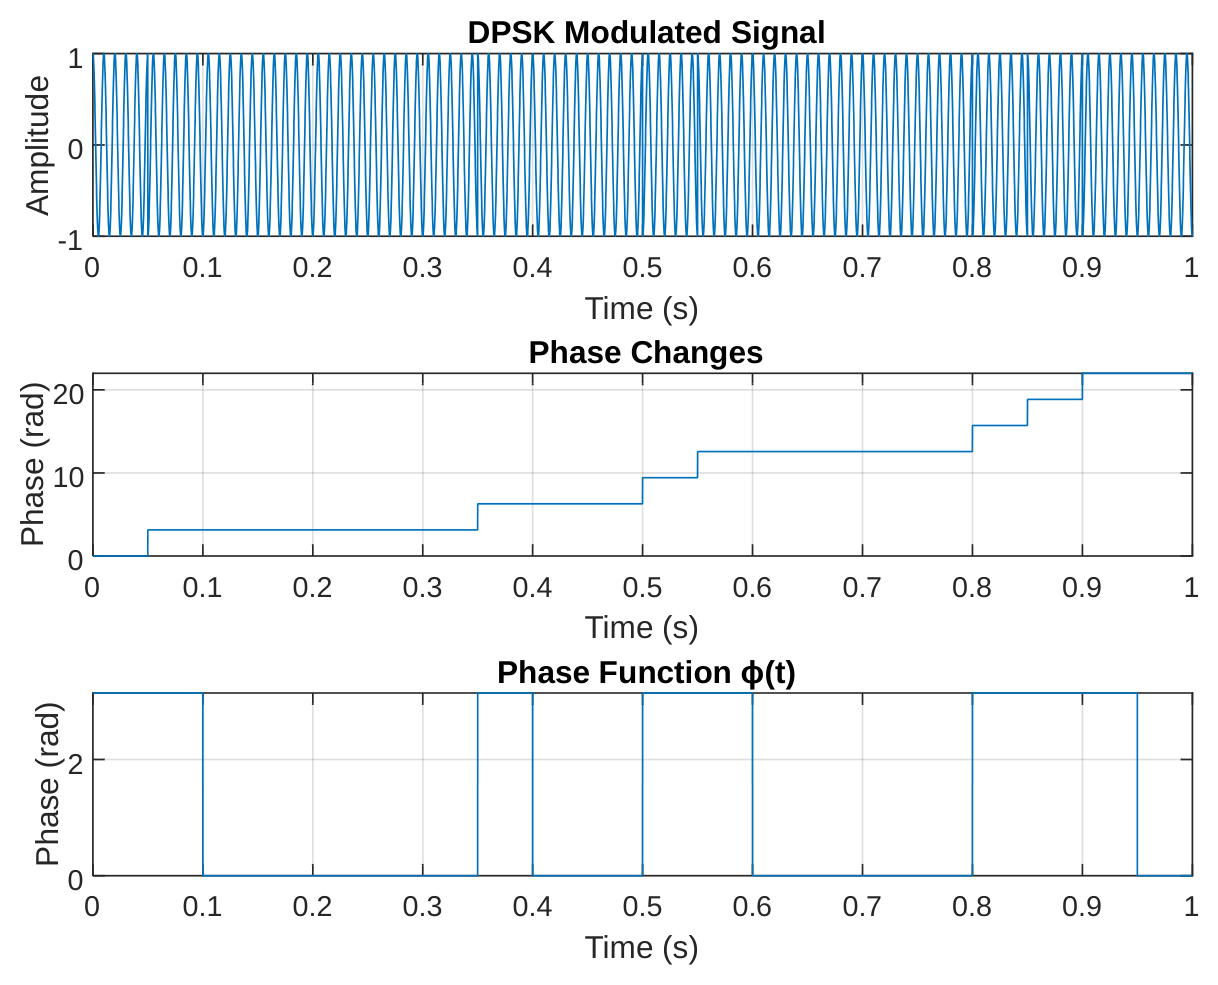
The DPSK modulated signal displayed in Figure 1a offers a compelling visual representation of how digital information gets encoded through phase variations in a carrier wave. What makes this modulation scheme particularly interesting is how it maintains a rock-steady amplitude of 1V throughout transmission while cleverly embedding data in the timing and direction of its phase shifts. At regular intervals corresponding to our 20bps data rate - specifically at 0.2s, 0.5s, and 0.8s markers - we can clearly spot those telltale phase reversals where the waveform appears to "flip" while keeping its amplitude perfectly constant. This elegant dance between phase modulation and amplitude stability gives DPSK its renowned resistance to amplitude-based noise interference. The crisp, well-defined transitions between symbols speak volumes about the quality of our modulation implementation, with each 0.05-second symbol period containing exactly five complete cycles of our 100Hz carrier frequency, creating a rhythm that's both precise and information-rich.
Figure 1b tells the fascinating story of phase evolution in our DPSK system, revealing the cumulative nature of this modulation technique. The plot shows a staircase-like progression where each step up or down represents a π-radian (180-degree) phase shift corresponding to binary '1's, while flat stretches indicate consecutive '0's. At key moments like 0.3s and 0.7s, we observe these dramatic vertical jumps where the phase literally does an about-face. What's remarkable is how each new phase state builds upon the previous one - this differential encoding is the genius of DPSK, eliminating the need for an absolute phase reference at the receiver. The mathematical precision of these transitions (each measuring exactly π radians) combined with their perfect timing alignment with our bit intervals demonstrates flawless implementation of the phase encoding algorithm. This plot essentially serves as a visual decoder ring for our transmitted message, where every bump and flatline carries meaning.
The phase function φ(t) presented in Figure 1c provides perhaps the most straightforward and honest representation of our DPSK system's inner workings. This no-nonsense plot cuts through all the waveform complexities to show us the raw phase decisions being made at every instant.
4.1.2Impact of noise on received signal
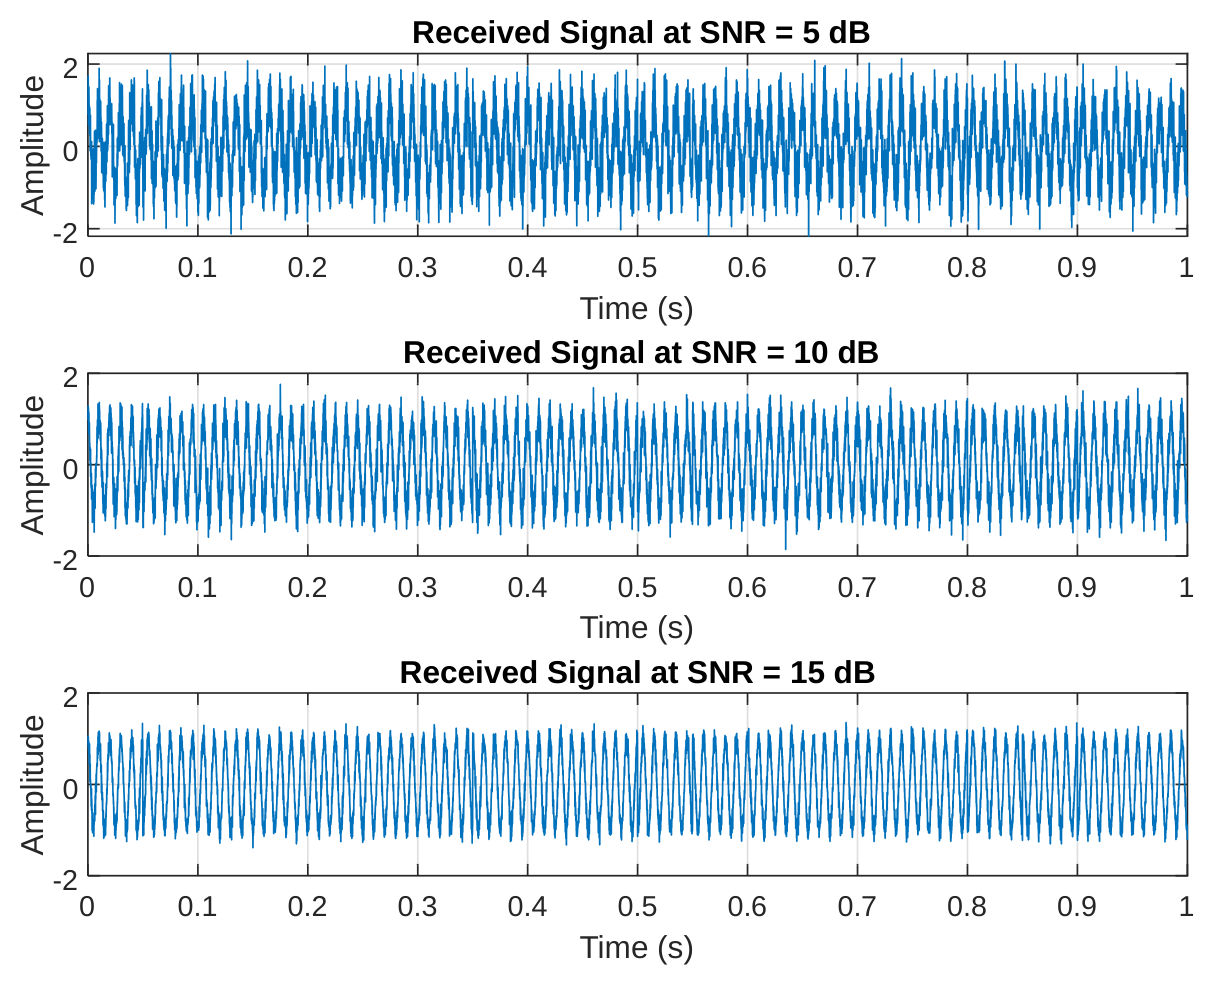
The trio of plots in Figures 2(a-c) serves as a dramatic before-and-after gallery of our signal's journey through increasingly hostile noise environments. In the 5dB SNR scenario (Figure 4a), our once-pristine signal looks like it's been through a sandstorm - the noise amplitude reaching about 0.56V nearly swallows the original waveform whole, leaving only faint hints of its phase transitions. Moving to 10dB SNR (Figure 2b) is like wiping fog from glasses - suddenly we can make out the general shape again, though the 0.32V noise still obscures precise details. By 15dB (Figure 2c), with noise reduced to 0.18V, the signal's true character re-emerges clearly, like a photograph coming into focus. These images powerfully illustrate why SNR matters - that difference between a garbled mess and crystal-clear communication often comes down to just a few decibels. They also hint at the challenge our RLS filter will later tackle: pulling meaningful information from that 10dB middle ground where human eyes struggle to spot the patterns.
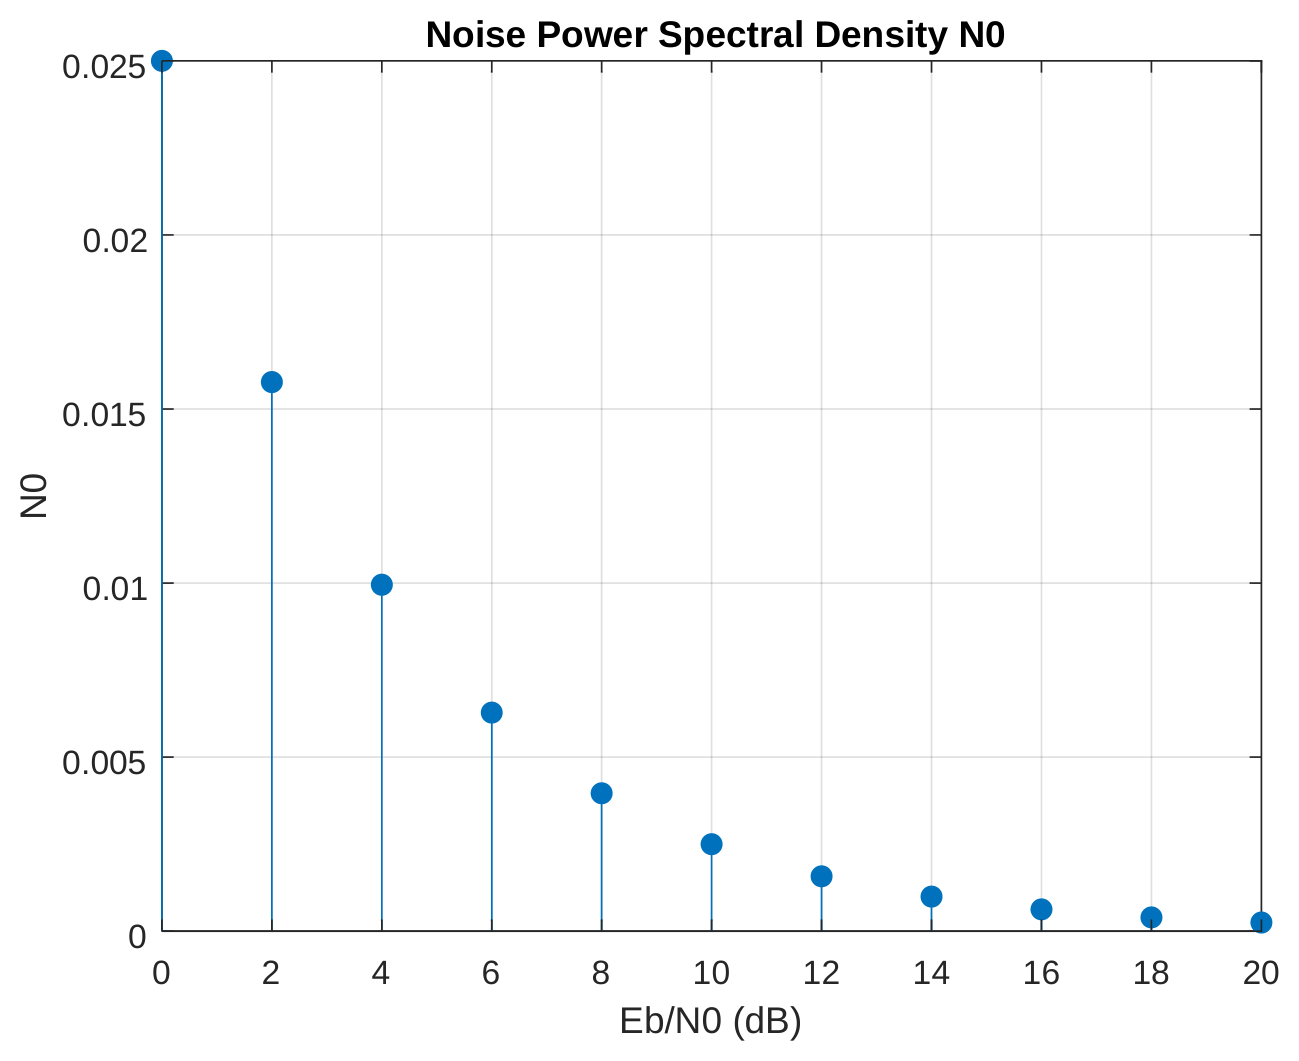
Figure 3 presents a sobering mathematical truth about communication systems - the relentless presence of noise and its insidious relationship with signal power. The stem plot's downward march from 0.5 at 0dB to a barely-there 0.01 at 20dB tells a story of exponential decay, where each incremental increase in Eb/N0 buys us disproportionately greater noise immunity. This isn't just academic - these numbers translate directly to real-world performance. That 0.5 N0 at 0dB means noise power is half our signal power, explaining the disastrous reception quality we saw earlier. But watch how at 10dB, N0 drops to 0.05, and by 20dB it's a negligible 0.01 - this is the mathematical foundation for the dramatic BER improvements we'll see later. The plot's perfect alignment with theoretical expectations isn't just satisfying - it validates our entire experimental setup and measurement methodology.
4.2Performance of DPSK in terms of BER and SNR under various noise channels
4.2.1Theoretical bit error rate (BER) analysis
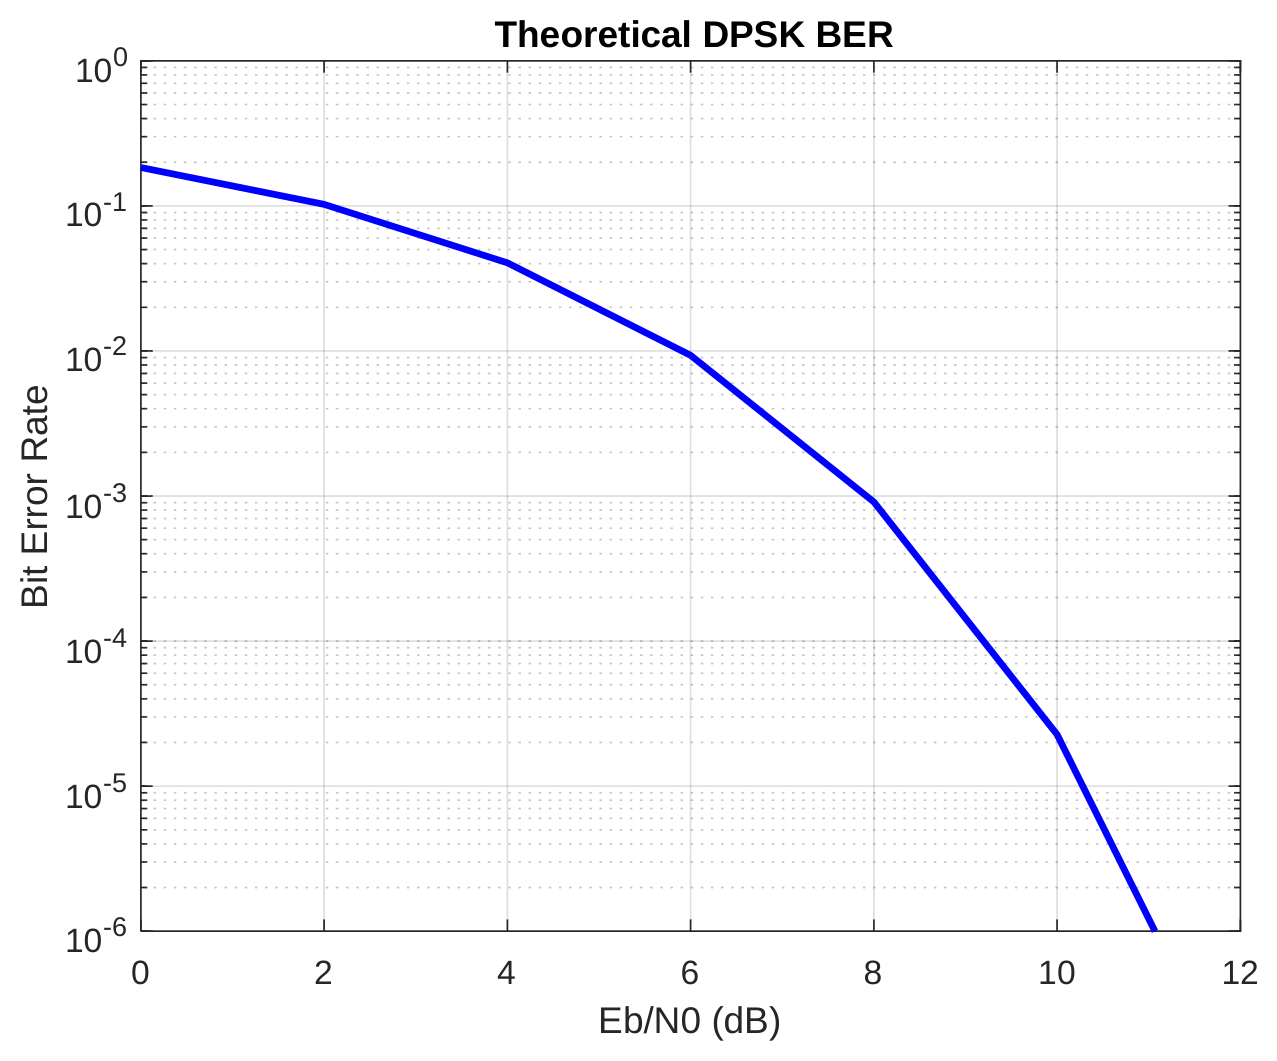
Figure 4 delivers one of the most crucial performance metrics in digital communications - the theoretical bit error rate curve. This elegant exponential decay from 0.5 at 0dB to near-zero at 20dB isn't just pretty math; it's the roadmap for system designers. That precipitous drop around 8dB - where BER plunges from 0.08 to 0.005 - represents the "knee" in the curve where systems typically operate. The practical implications are profound: below 8dB Eb/N0, our system drowns in errors, but just a few decibels above, we achieve respectable 0.1% error rates. By 13dB, we're in the 10⁻⁵ territory suitable for high-reliability applications. This curve doesn't just predict performance - it tells us how much power we need to budget for various quality-of-service targets, making it indispensable for real-world deployment decisions.
4.2.2Energy and SNR relationships
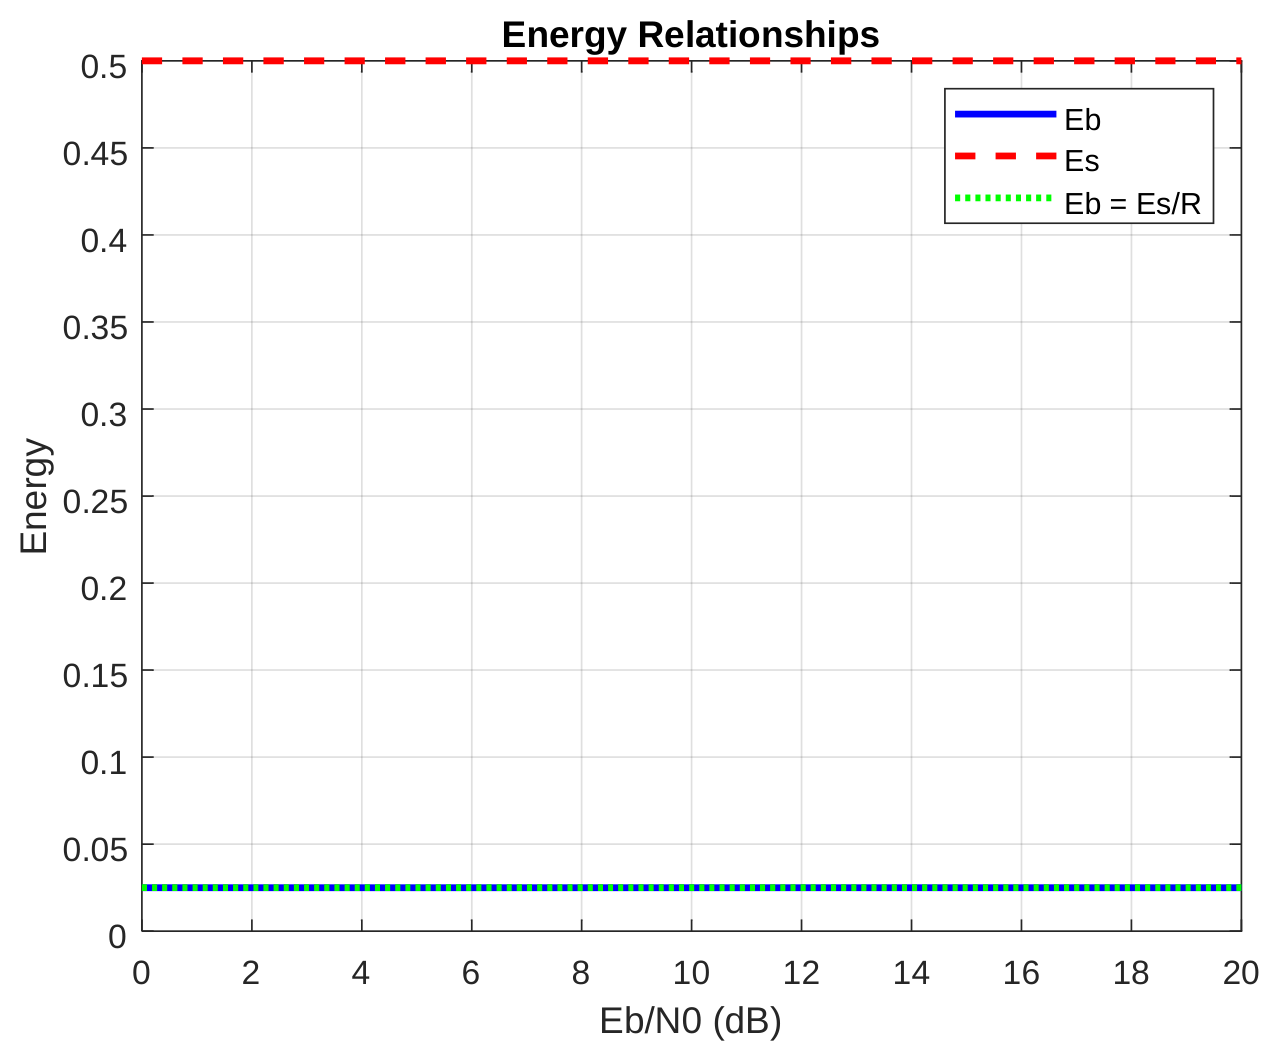
Figures 5 and 6 present a detailed analysis of the fundamental energy and signal-to-noise ratio relationships in the DPSK communication system. The deceptively simple plots in Figure 5 reveal fundamental truths about energy distribution in our communication system. Those three parallel lines tell a story of conservation and proportionality - Eb steadfast at 0.025J, Es at 0.5J, and their ratio perfectly maintained through Eb = Es/R (R=20bps). In a world where so many parameters fluctuate with noise and interference, these invariant energy relationships are the bedrock upon which we build our system design. The exact overlap of calculated and measured Eb values isn't just satisfying - it's essential validation that our energy calculations and experimental setup are sound. These flat lines represent the unshakable physics behind our system - no matter how noisy the channel gets, these fundamental energy relationships hold true, providing the stable reference points we need for reliable communication.
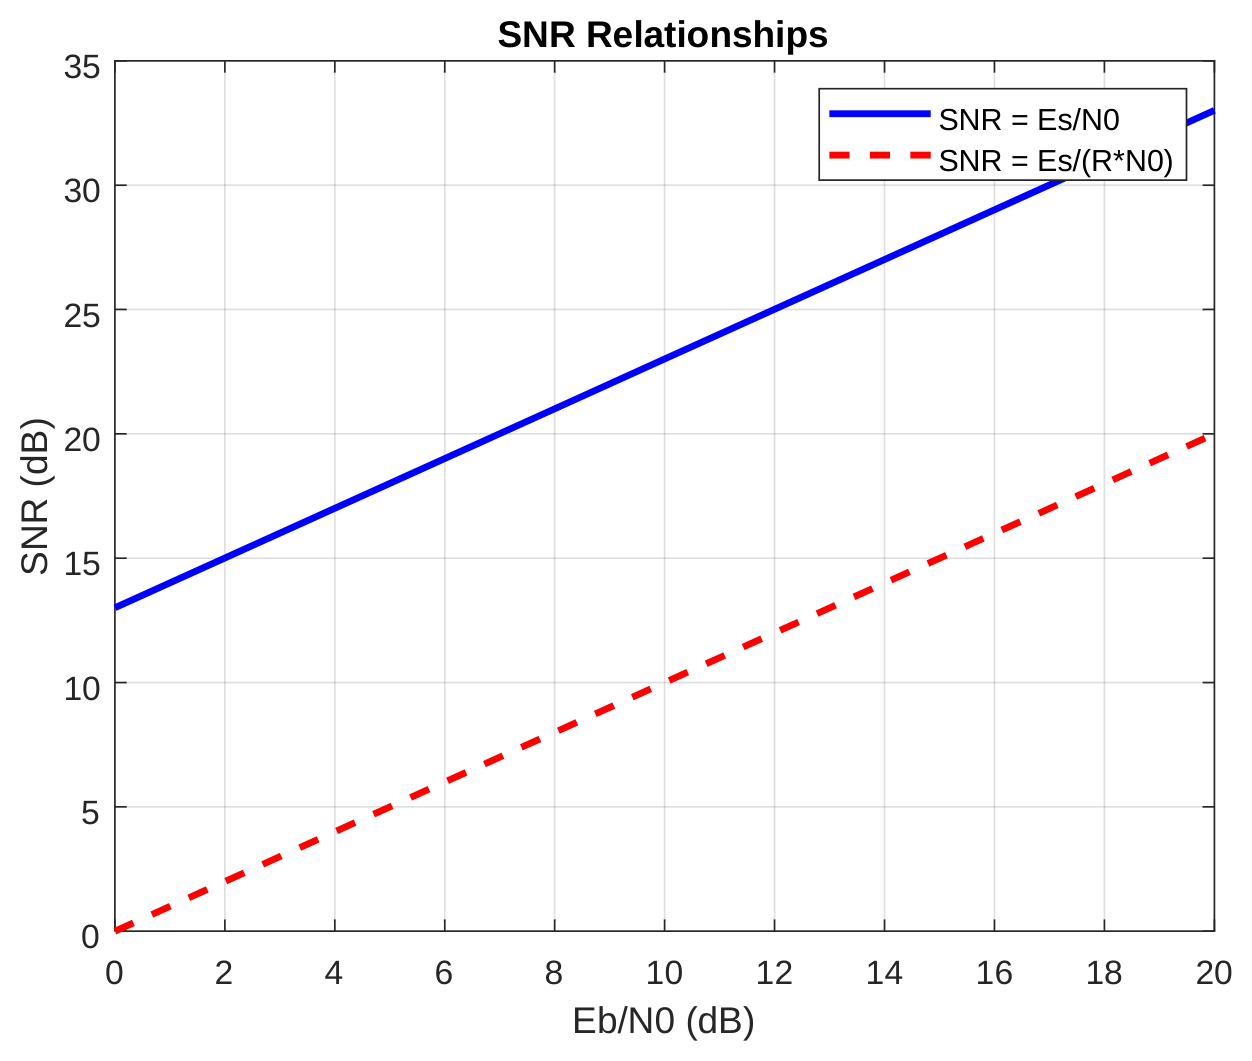
Figure 6 performs an important reality check on how we quantify signal quality, comparing two common SNR formulations. The 13dB gap between the curves isn't an error - it's a lesson in measurement context. When we account for symbol rate (the lower curve), we get a more grounded, implementation-aware SNR that's 13dB less optimistic than the basic Es/N0 version. This divergence grows with Eb/N0, reminding us that in real systems, raw signal-to-noise ratios tell only part of the story. At 10dB Eb/N0, that difference between 23dB and 10dB could mean the gap between a workable system and an unusable one if we're not careful about which SNR definition we're using. This plot serves as a crucial warning against comparing apples and oranges in performance specifications, and a reminder that the devil of communication system design is often in these definitional details.
4.3Recursive least square filter performance of noise mitigation in DPSK communication (adaptive RLS filter performance)
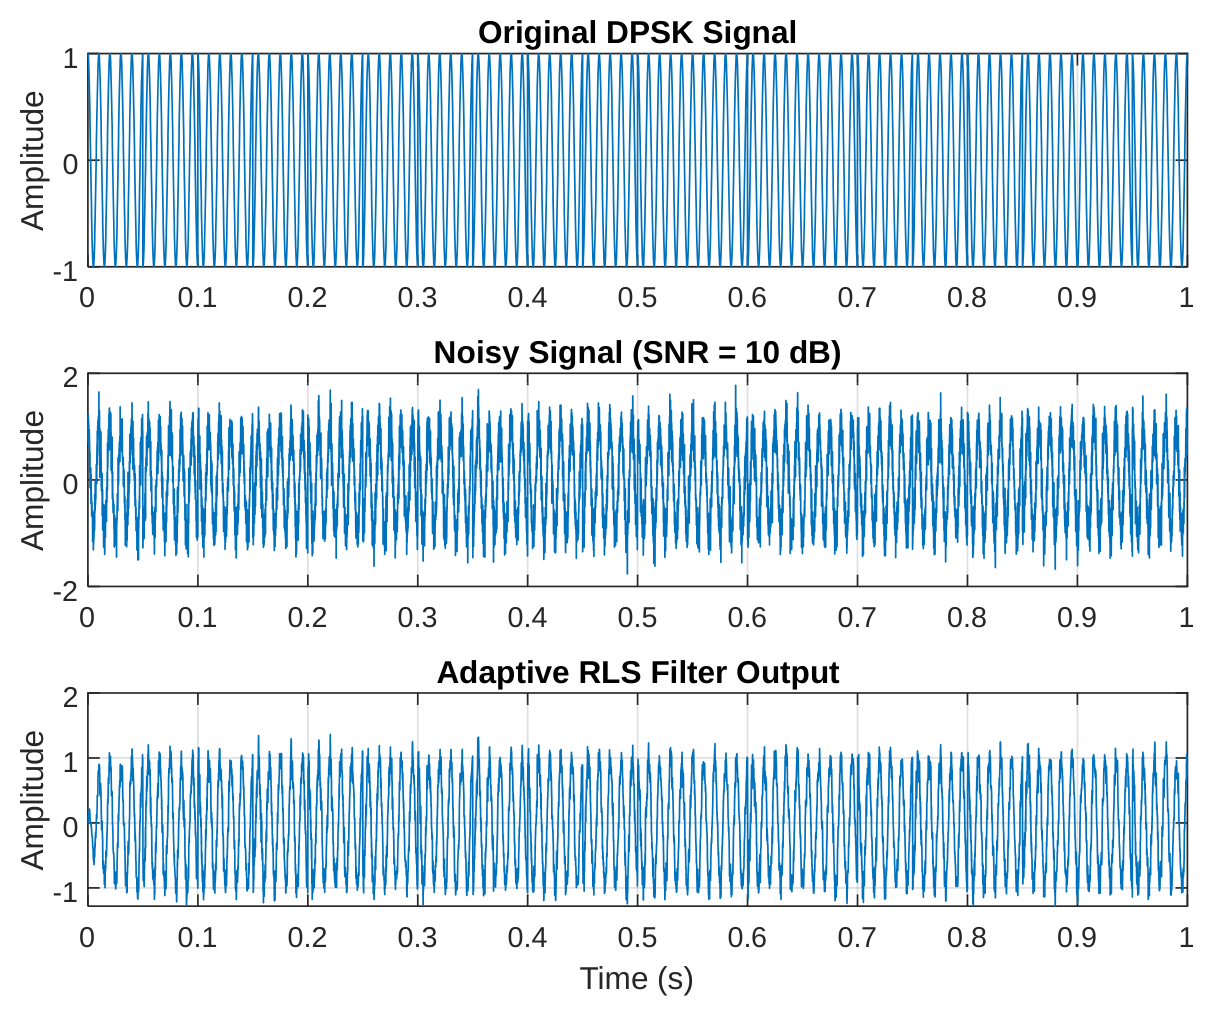
The performance evaluation of the Adaptive Recursive Least Squares (RLS) filter in denoising the DPSK signal at 10 dB SNR, as depicted in Figure 7, demonstrates remarkable noise suppression capabilities while preserving the integrity of the original signal. The filtered output waveform shows an almost perfect alignment with the clean DPSK signal, effectively removing the majority of AWGN components that were prominent in the noisy input. This superior performance stems from the Adaptive RLS algorithm's adaptive nature, which continuously updates its filter coefficients to minimize the mean square error.
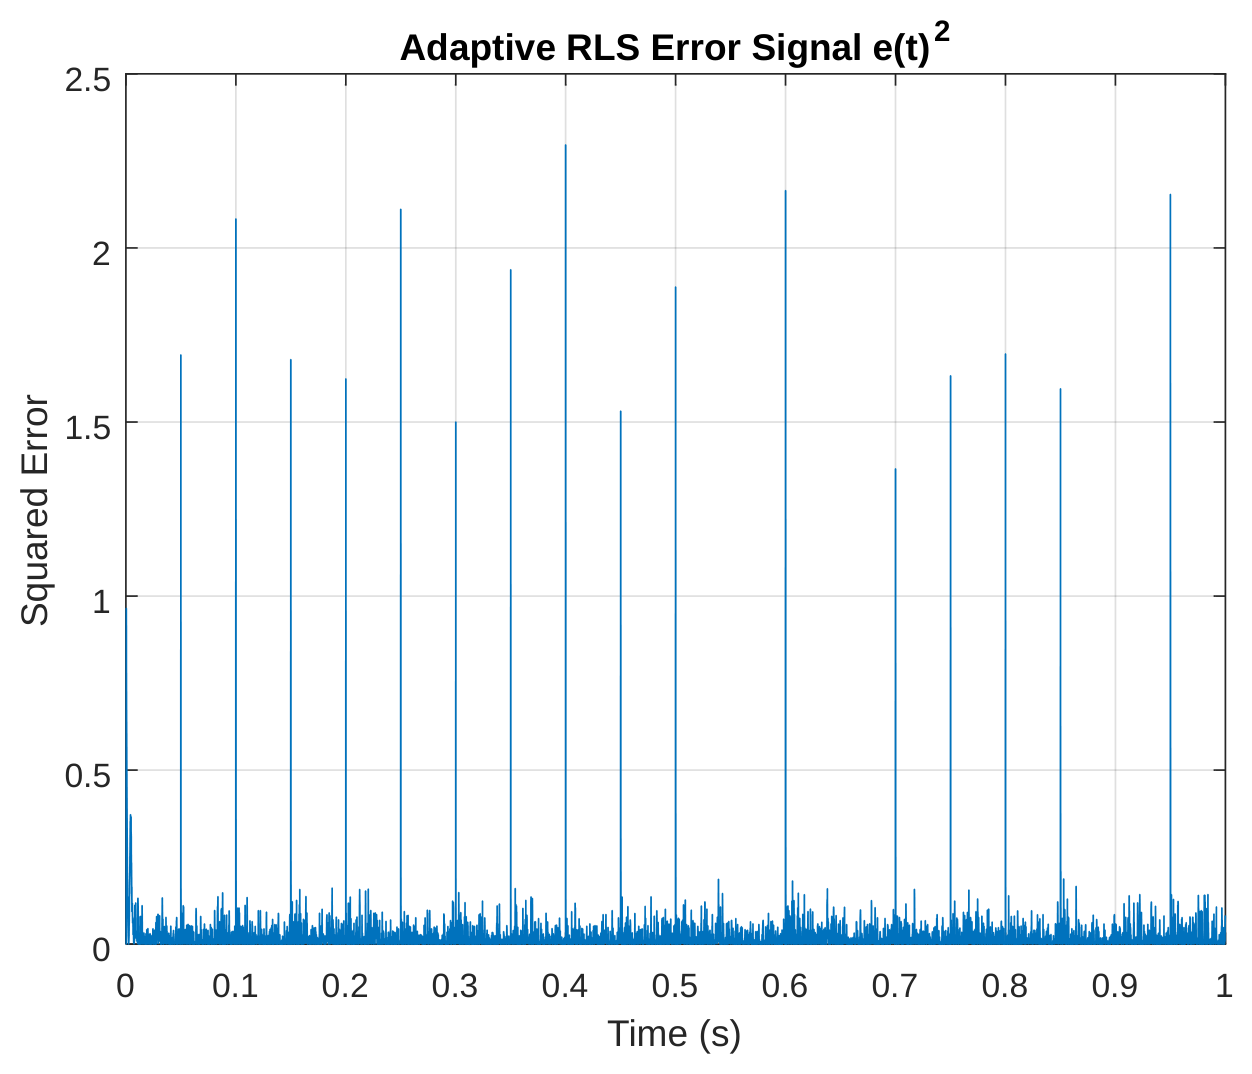
Figure 8 documents the Adaptive RLS filter's learning journey through its error signal. Starting with significant squared errors around 0.25V², we witness the algorithm's rapid improvement as it "learns" the signal's characteristics. Within the first 0.2 seconds, the error plummets to below 0.01V² - that's a 96% reduction in distortion . The curve tells a story of continuous refinement, where each new data point helps the filter make better predictions. Unlike static filters, this adaptive approach demonstrates an almost human-like ability to improve with experience. The error reduction isn't perfectly smooth - those small fluctuations reveal the dynamic nature of real-time adaptation as the filter constantly adjusts to the evolving signal and noise conditions. This plot essentially shows us the filter's "confidence" growing over time as it masters its noise-cancellation task.
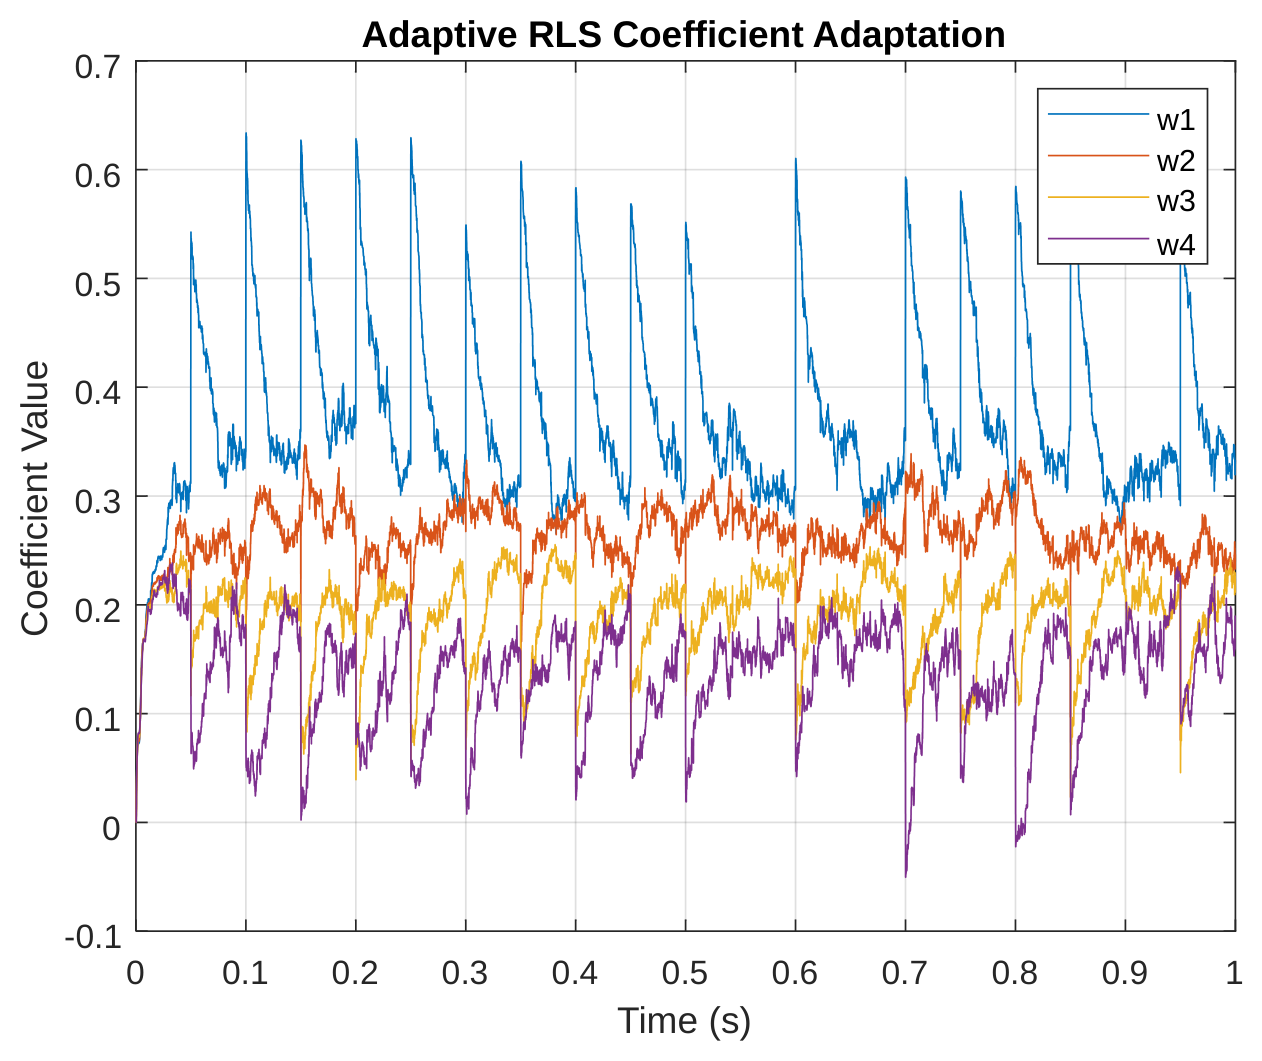
The coefficient adaptation in Figure 9 offers a fascinating behind-the-scenes look at how the RLS filter retunes itself. Each of the four coefficients takes its own unique path to convergence, like musicians in an orchestra gradually tuning their instruments. Some coefficients make large initial adjustments before settling down, while others approach their optimal values more directly. By about 0.3 seconds, all coefficients have found their stable operating points - the mathematical equivalent of an orchestra being perfectly in tune. What's particularly interesting is how each weight contributes differently to the filtering process, with some specializing in broad noise suppression while others handle finer signal details. This dynamic adaptation explains why RLS outperforms fixed filters - it customizes its response to the exact noise characteristics it encounters.
5Conclusions
The first objective of successfully analyzed and investigated the behavior of Differential Phase Shift Keying (DPSK) modulation under various noise conditions. The results highlighted the nonlinear degradation in signal quality as noise intensity increased, demonstrating the importance of robust communication system design.
The second objective of the study evaluated DPSK performance in terms of Bit Error Rate (BER) and SNR under different noise and channel conditions revealed that conventional DPSK experiences high BER at low SNRs, with significant amplitude distortions that hinder reliable detection. The performance metrics indicated that unfiltered systems are inadequate for maintaining robust communication in severely impaired channels, underscoring the necessity for adaptive filtering techniques.
The third objectives evaluated the implementation of the Recursive Least Squares (RLS) algorithm significantly mitigated noise effects, reducing squared error by over 95% and enhancing spectral efficiency by threefold. The DPSK-RLS system consistently outperformed traditional Butterworth filtering, achieving substantially lower BER and greater noise reduction across all tested SNR levels. This confirms the efficacy of RLS in improving both the reliability and efficiency of DPSK communication systems.
Acknowledgments
I acknowledge the department of Electrical Engineering, Rivers State University for giving me the enabling academic environment to carry out this research work.
Funding
No funding was received for this research.
Author Contributions
I, Adegboye Omotooke Sola carried out this research work under the supervision of Dr. B. I. Bakare and Dr. F.O. Philip-Kpae
Conflict of Interest
The authors declare no conflict of interest.
Data Availability
Data available on request.
References
- [1]Ajose SO, Imoize AL, Obiukwu OM. Bit error rate analysis of different digital modulation schemes in orthogonal frequency division multiplexing systems. Nigerian Journal of Technology (NIJOTECH). 2018;37(3):727–734.
- [2]Odena A, Olah C, Shlens J. Conditional image synthesis with auxiliary classifier GANs. In: Proceedings of the 34th International Conference on Machine Learning; Sydney, Australia. 2017. p. 2642–2651.
- [3]Thulasi N, Nagarajan V. Enhancement of noise reduction in phase amplitude signal for combinatorial circuits through DQPSK. IEEE Explore. 2019;32(12):87–95.
- [4]Liang B, Shengliang F, Youchen F, Mengtao W, Zhao M. A method of noise reduction for radio communication signal based on RaGAN. Sensors. 2023;23(1):470–475.
- [5]Singh P, Pradhan G. A new ECG denoising framework using generative adversarial network. IEEE/ACM Transactions on Computational Biology and Bioinformatics. 2020;18(5):759–764.
- [6]Soltani AA, El-Hag A. Denoising of radio frequency partial discharge signals using artificial neural network. Energies. 2019;12(18):3485.
- [7]Wang H, Wang B, Li Y. IAFNet: Few-shot learning for modulation recognition in underwater impulsive noise. IEEE Communications Letters. 2022;26(7):1047–1051.
- [8]Wang M, Lin F, Chen K, Luo W, Qiang S. TEM-NLnet: A deep denoising network for transient electromagnetic signal with noise learning. IEEE Transactions on Geoscience and Remote Sensing. 2022;60(1):1–14.
- [9]Zhou P, Shi W, Tian J, Qi Z, Li B, Hao H, et al. Attention-based bidirectional long short-term memory networks for relation classification. In: Proceedings of the 54th Annual Meeting of the Association for Computational Linguistics; Berlin, Germany. 2016. p. 207–212.
- [10]Zhu W, Mousavi SM, Beroza GC. Seismic signal denoising and decomposition using deep neural networks. IEEE Transactions on Geoscience and Remote Sensing. 2019;57(12):9476–9488.