Medical Imaging and Healthcare Technology
Liver Tumor Detection Using Deep Learning
Department of Computer Science Engineering, Rajiv Gandhi Institute of Technology, Bengaluru, India
Published October 2026
Abstract
Liver cancer remains one of the most serious health challenges across the world, with a high mortality rate largely due to late diagnosis. Detecting tumors at an early stage is critical for improving survival chances, yet traditional methods depend heavily on manual analysis of medical images. This process is not only time-consuming but also subject to human error and variation between specialists. With the rise of artificial intelligence, especially deep learning, there has been a significant shift toward automating the solutions in medical imaging. These technologies offer faster and more consistent analysis, making them highly valuable in clinical settings. Among various imaging techniques, computed tomography (CT) scans are widely used because they provide detailed views of liver structures and abnormalities. In this research, a deep learning-based approach is proposed for detecting liver tumors from CT images. The model is built using a 3D U-Net architecture, which is well-suited for capturing spatial relationships in volumetric data. Unlike traditional 2D models, the 3D approach analyzes multiple image slices together, leading to more accurate segmentation of tumor regions. One of the key challenges in deep learning models is selecting the right hyperparameters, such as learning rate and batch size. Instead of relying on manual tuning, this study incorporates the Bat Algorithm, a nature-inspired optimization technique. This method helps automatically find the best parameter settings, improving both the efficiency and performance of the model. The dataset used in this work includes annotated CT images, which are preprocessed through normalization, resizing, and augmentation. These steps ensure better data quality and help the model generalize well to new cases. Experimental results show that the proposed method achieves high accuracy and reliable performance in tumor detection. It also maintains a good balance between identifying tumors and avoiding false detections. Overall, this study demonstrates how combining deep learning with optimization techniques can significantly enhance liver cancer detection. The approach has strong potential to support doctors in making faster and more accurate diagnoses, ultimately improving patient care.
1Introduction
Liver cancer is one of the most serious health problems affecting people around the world today. It is a leading cause of cancer-related deaths, mainly because it is often detected at a late stage. Early diagnosis plays a very important role in improving treatment outcomes and survival rates. However, detecting liver tumors at an early stage remains a challenging task. The liver is a vital organ responsible for many important functions in the body. It helps in detoxifying harmful substances and supports metabolism. Any abnormal growth in the liver can disrupt these functions and lead to serious complications. Liver tumors can be benign or malignant, with malignant tumors being more dangerous. Several factors contribute to liver cancer, including hepatitis infections and alcohol consumption. Lifestyle factors such as obesity and poor diet also increase the risk. Due to these reasons, liver cancer cases are increasing worldwide. This makes early detection and accurate diagnosis more important than ever. Medical imaging techniques are commonly used to detect liver tumors. computed tomography scans are widely preferred for their detailed imaging capability. These scans help doctors understand the size and position of tumors. They also assist in planning appropriate treatment methods. Despite their usefulness, analyzing CT images manually is not easy. It requires expertise and can take a significant amount of time. Different doctors may interpret the same scan differently. This can sometimes lead to inconsistent results. To overcome these challenges, automated systems are being developed. Deep learning has shown great potential in medical image analysis. It allows machines to learn patterns and detect normalities effectively. Models like U-Net are widely used for image segmentation tasks. Recent approaches use 3D models to improve accuracy further. These models analyze multiple image slices together. This helps in better identification and segmentation of tumor regions. Overall, combining deep learning with advanced techniques offers promising results.
2Problem statement and objectives
The system addresses the following problems:
- Time-consuming and difficult manual analysis of CT scan images.
- Difficulty in accurately identifying the size, shape, and location of liver tumors.
- Possibility of variations in tumor identification due to differences in expert interpretation.
- Difficulty in detecting small or early-stage tumor regions from CT images.
- Challenges in accurately segmenting tumor regions from surrounding healthy liver tissue.
- Limited automation in the detection and visualization of liver tumor regions.
The principal objectives are:
- Automate liver tumor detection using deep learning techniques.
- Process CT scan images for accurate identification of abnormal liver regions.
- Use 3D U-Net for effective volumetric tumor segmentation.
- Apply pixel/voxel-based segmentation to distinguish tumor tissue from normal liver tissue.
- Use the Bat Algorithm to optimize important model parameters.
- Incorporate YOLO for efficient tumor detection and localization.
- Provide visualized results showing the detected tumor region, size, and location.
- Develop a user-friendly system for uploading CT scans and generating an analysis report.
3Literature survey
Liver tumor detection has been studied using medical imaging techniques such as Computed Tomography (CT), Magnetic Resonance Imaging (MRI), ultrasound, and other imaging modalities. CT scans provide detailed anatomical information and are commonly used for identifying liver abnormalities. Traditional image-processing approaches use techniques such as thresholding, edge detection, and region-based segmentation to identify tumor regions. However, these methods can be affected by image quality, intensity variations, and the complex structure of the liver. Deep learning approaches have provided significant improvements in medical image analysis. U-Net is widely used for medical image segmentation because it can identify and segment regions of interest from medical images. 3D U-Net extends this concept by processing multiple CT slices together, allowing the model to learn spatial relationships within volumetric data. Pixel/voxel-based segmentation can further distinguish tumor tissue from normal liver tissue and background regions. Recent approaches also incorporate object-detection models such as YOLO for identifying and localizing tumor regions efficiently. The proposed project follows a practical implementation approach by combining multiple techniques rather than depending on a single algorithm. The system uses CT scan images as input and applies preprocessing before performing tumor analysis. 3D U-Net is used for volumetric segmentation, while pixel/voxel segmentation helps identify the tumor region. The Bat Algorithm is incorporated for optimizing relevant model parameters, and YOLO is used for tumor detection and localization. This combination shifts the focus from simple tumor classification to an integrated system capable of detecting, segmenting, and visualizing liver tumor regions.
4Proposed system
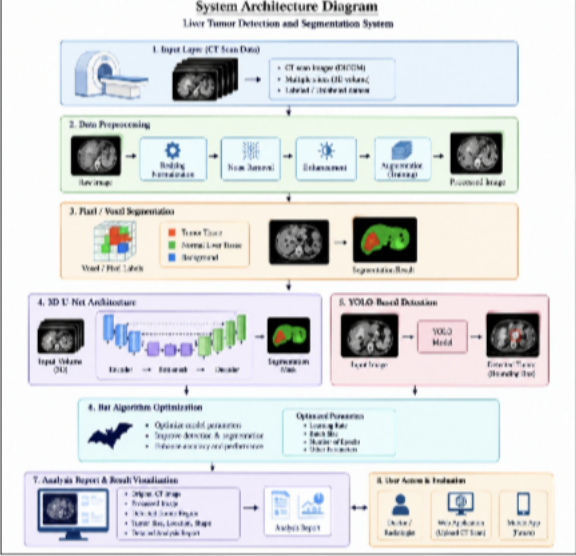
The proposed system contains five logical layers: user interface layer, image preprocessing layer, tumor detection and segmentation layer, optimization layer, and database and reporting layer. The user interface allows users to upload CT scan images and view analysis results. Image preprocessing prepares the input images for further analysis. The detection and segmentation layer uses 3D U-Net, pixel/voxel segmentation and YOLO to identify and localize liver tumor regions. The Bat Algorithm is used as an optimization technique for improving relevant model parameters. The final results are stored and presented through an analysis report.
4.1Complete liver tumor detection ecosystem
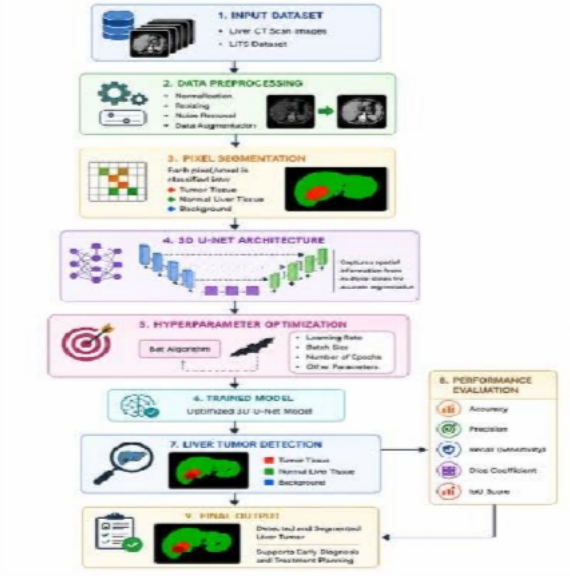
The final system is organized around a complete workflow in which the user uploads a CT scan image and the system automatically performs preprocessing, tumor detection, segmentation and result generation. The system combines 3D U-Net, pixel/voxel segmentation, YOLO and the Bat Algorithm to provide an integrated approach to liver tumor analysis. This reduces the need for separate manual processing steps.
4.2CT scan upload and image preprocessing
Users can upload CT scan images through the web-based interface. The uploaded images undergo preprocessing operations such as resizing, normalization, noise reduction and image enhancement. These steps improve the quality and consistency of the input data before it is provided to the deep learning models. Multiple CT slices can also be processed together to preserve important spatial information.
4.3Tumor detection and segmentation
The system performs tumor analysis using multiple complementary techniques. 3D U-Net processes volumetric CT data and identifies the liver and tumor regions. Pixel/voxel-based segmentation distinguishes tumor tissue from normal liver tissue and background regions. YOLO is incorporated to detect and localize tumor regions efficiently. The combined approach provides information about the position, shape and affected region of the detected tumor.
4.4Optimization and model processing
The Bat Algorithm is incorporated to optimize relevant parameters of the detection and segmentation process. The optimized parameters help improve the model's ability to identify tumor regions from CT scan images. The system processes the input through the trained models and generates the corresponding detection and segmentation results. This provides a structured automated workflow for liver tumor analysis.
4.5Analysis report and result visualization
After processing the CT scan, the system displays the analysis results through a user-friendly dashboard. The report can present the original CT image, processed image, detected tumor region and relevant tumor information. The system can also provide visual comparisons between the input and processed images. These results help users understand the detected abnormal region and support further clinical evaluation.
5Methodology
5.1CT scan data collection and registration
The data collection phase provides the medical images required for liver tumor analysis. CT scan images containing normal and tumor-affected liver regions are collected from suitable medical imaging datasets. The images are organized according to the required training and testing categories. Patient-identifying information is excluded from the processing workflow, and the collected images form the reference dataset for training and evaluating the proposed detection and segmentation models.
5.2Image preprocessing
When a CT scan is provided to the system, the input image undergoes preprocessing before tumor analysis. The preprocessing stage includes image resizing, normalization, noise reduction and enhancement to improve image quality and maintain consistency across the dataset. Data augmentation can also be applied during training to increase the variation of input samples. For volumetric CT data, multiple adjacent slices are processed together so that spatial information between slices is preserved.
5.3Liver and tumor segmentation
The segmentation stage identifies the liver and abnormal tumor regions from the processed CT images. The proposed system uses 3D U-Net to analyze volumetric CT data and segment the relevant regions. Pixel/voxel-based segmentation is used to distinguish tumor tissue from normal liver tissue and background regions. This process provides detailed information about the location, size and shape of the detected tumor region.
5.4YOLO-based tumor detection
YOLO is incorporated as an object-detection component for identifying and localizing tumor regions within the CT images. The model analyzes the processed images and provides the location of suspected tumor regions. The YOLO detection results can be combined with the segmentation output to provide a more comprehensive analysis. This allows the system to identify the tumor region and visually indicate its location in the input image.
5.5Bat Algorithm optimization
The Bat Algorithm is incorporated as an optimization technique to improve the performance of the proposed detection and segmentation workflow. Relevant model parameters can be optimized using the search capability of the algorithm. The optimized parameters are then used during model training or processing to improve the identification of tumor regions. This optimization stage supports the development of an efficient and accurate automated analysis system.
5.6Analysis report and result generation
After the CT scan has been processed, the system generates an analysis report containing the detection and segmentation results. The interface can display the original CT image, processed image and highlighted tumor region. The detected tumor information can include its location, size and visual characteristics obtained from the analysis. The generated results are presented through a user-friendly dashboard to support further medical evaluation.
The proposed system presents an intelligent and automated liver tumor detection and segmentation solution using deep learning and optimization techniques. Based on existing research in medical image analysis, conventional manual interpretation and traditional image-processing approaches can require considerable expertise and processing time. To address these challenges, the proposed system combines 3D U-Net, pixel/voxel-based segmentation, YOLO and the Bat Algorithm to perform automated CT scan analysis. The methodology is organized into major stages including CT scan data collection, image preprocessing, tumor segmentation, tumor detection, parameter optimization and result visualization. The 3D U-Net model analyzes volumetric CT
5.7System architecture diagram
5.8System flowchart
5.8.1Hardware requirements
The system requires suitable hardware components for processing CT scan images and running deep learning models, including:
- Computer/Laptop with multi-core processor.
- Minimum 8 GB RAM.
- Dedicated GPU for efficient deep learning model training and processing.
- Minimum 256 GB storage.
- Monitor (Screen).
- Keyboard and Mouse.
- Stable Internet Connection.
5.8.2Software requirements
The system uses multiple software tools and frameworks for efficient implementation:
- Python for model development and application programming.
- Flask/Django for web application development.
- OpenCV for CT image processing.
- TensorFlow/Keras or PyTorch for deep learning model implementation.
- 3D U-Net for volumetric liver tumor segmentation.
- YOLO for liver tumor detection and localization.
- NumPy and Pandas for data processing.
- Matplotlib for image visualization and analysis.
- SQLite/MySQL for storing application and analysis information.
5.8.3User access and analysis feature
A key feature of the proposed system is the integration of an automated CT scan analysis module that provides users with a simple and interactive interface. Users can securely access the web application and upload CT scan images for analysis. The system performs preprocessing, pixel/voxel segmentation, 3D U-Net-based tumor segmentation and YOLO-based tumor detection. The Bat Algorithm is incorporated to optimize relevant model parameters and improve the analysis process. After processing, the system displays the original CT image, processed image, detected tumor region and analysis results through an interactive dashboard. The generated report provides information about the detected tumor region, including its location, size and visual characteristics, and can support further medical evaluation by qualified healthcare professionals.
6Software implementation
The proposed system is implemented as a Python-based web application for automated liver tumor detection and segmentation. OpenCV is used for CT image-processing operations, while TensorFlow/Kera's or Py Torch supports the development and execution of deep learning models. The 3D U-Net model performs volumetric tumor segmentation; YOLO provides tumor detection and localization, and the Bat Algorithm is used for optimization. NumPy supports numerical operations, Pandas supports data handling and analysis, Matplotlib supports visualization, and SQLite provides persistent storage for application and analysis records.
- 1. Python – application development and control logic.
- 2. Flask/Django – web interface and application layer.
- 3. OpenCV – CT image processing and preprocessing.
- 4. 3D U-Net – volumetric liver and tumor segmentation.
- 5. YOLO – tumor detection and localization.
- 6. Bat Algorithm – optimization of relevant model parameters.
- 7. NumPy – numerical operations and array processing.
- 8. Pandas – dataset handling and analysis.
- 9. Matplotlib – CT image visualization and result analysis.
- 10. SQLite – local relational database for application and analysis records.
7Database design and security
The current database contains tables for users, CT scan images, tumor detection results, segmentation results, optimization records, and analysis reports. CT scan records contain important fields such as patient/sample ID, scan image path, scan date, preprocessing status, tumor detection status, and analysis result. The segmentation structure stores information related to the liver and tumor regions, including segmented image paths, tumor location, size, and shape. The analysis-report structure maintains the final detection and segmentation results generated by the system. For the enhanced system, the data model should be extended with 3D U-Net model records, YOLO detection results, Bat Algorithm optimization parameters, pixel/voxel segmentation details, preprocessing information, and result-verification fields. A normalized analysis record can therefore be represented conceptually as: Patient/Sample + CT Scan + Preprocessing + 3D U-Net Segmentation + Pixel/Voxel Segmentation + YOLO Detection + Bat Algorithm Optimization + Tumor Result + Analysis Report. Sensitive medical and imaging information should be protected through appropriate access controls, secure storage, controlled data retention, and secure transmission mechanisms during real deployment.
8Role-based workflow
Patient/User: Uploads a CT scan, selects the required analysis option and submits the scan for processing.
The system performs preprocessing, tumor detection and segmentation, and displays the analysis result.
Medical/Authorized User: Logs in to the assigned system account, uploads CT scans, views tumor detection and segmentation results, examines tumor location, size and shape, and generates analysis reports.
Department Head: Views department-level analysis records, including CT scans, detection results, segmentation outcomes and reports, and reviews system analytics and audit information.
Administrator: Registers and manages users, maintains CT scan and patient/sample records, manages system settings, reviews analysis results, monitors model performance, and maintains security and system logs.
9Security and anti-proxy measures
The system combines several detection and validation techniques rather than relying on a single model. 3D U-Net analyzes multiple CT slices together to identify and segment tumor regions, while pixel/voxel-based segmentation provides detailed identification of tumor and surrounding liver tissue. YOLO supports tumor detection and localization, and the Bat Algorithm helps optimize relevant model parameters. Preprocessing and multi-stage analysis improve the consistency of the input and reduce errors caused by image noise or variations. The analysis database maintains detection results, segmentation information and system activity logs for traceability. Together, these techniques provide a structured approach to automated liver tumor detection and segmentation, although the system is intended as a decision-support tool and should not replace professional medical diagnosis.
10Result and discussion
The developed system provides a user-friendly graphical interface using Flask, allowing users to upload CT scan images and perform automated liver tumor analysis. The system mainly consists of three modules: user login, CT scan upload and analysis, and analysis report generation. In the login module, users
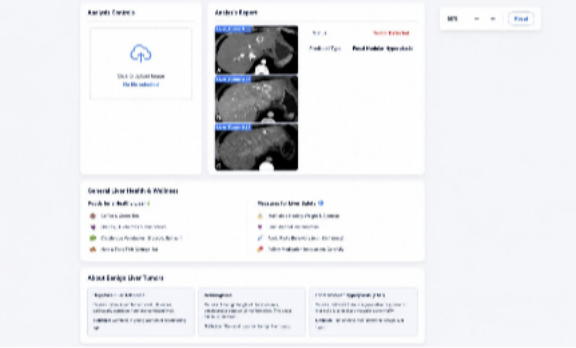
The analysis results are presented in a structured and easy-to-understand format. The report displays the detected tumor region along with the prediction confidence and classification result. In the developed interface, the system can display results such as “Tumor Detected” and a predicted type such as Adenoma or Focal Nodular Hyperplasia (FNH), depending on the model output. The dashboard also provides a General Liver Health & Wellness section containing general information related to healthy lifestyle practices and foods. An additional About Benign Liver Tumors section provides basic information about different benign tumor types. The detailed result presentation is illustrated in Figure 3.
Overall, the developed system demonstrates an integrated implementation of CT image processing, 3D U-Net segmentation, pixel/voxel segmentation, YOLO-based tumor detection, and Bat Algorithm optimization for automated liver tumor analysis. It provides a convenient interface for uploading CT scans and viewing processed results in a single dashboard. The system helps identify and visualize suspected tumor regions and presents the analysis in an organized manner. Its performance can be influenced by factors such as CT image quality, dataset characteristics, preprocessing quality, and model accuracy. The system is intended to support medical image analysis and should be used as a decision-support tool alongside professional medical evaluation.
11Advantages
- 1. Automated Tumor Detection – Automatically detects suspected liver tumors from CT scan images, reducing manual effort.
- 2. Accurate Tumor Segmentation – 3D U-Net and pixel/voxel segmentation help identify and segment tumor regions.
- 3. Fast Analysis – Processes CT images efficiently and provides analysis results in a shorter time.
- 4. Tumor Localization – YOLO helps identify and locate suspected tumor regions within CT images.
- 5. User-Friendly Interface – Provides a simple dashboard for uploading CT scans and viewing detection and segmentation results.
12Limitations
- 1. Dataset Dependency – The performance of the system depends on the quality, size, and diversity of the CT scan dataset.
- 2. Image Quality Issues – Low-resolution, noisy, or unclear CT images may reduce detection and segmentation accuracy.
- 3. False Detection – The system may sometimes identify normal regions as tumors or fail to detect very small or unclear tumors.
- 4. Computational Requirements – 3D U-Net and YOLO processing may require high computational resources, especially for large CT datasets.
- 5. Training Time – Training deep learning models and optimizing parameters using the Bat Algorithm can require considerable time.
- 6. Generalization Limitations – A model trained on a particular dataset may not perform equally well on CT scans from different hospitals, scanners, or patient populations.
- 7. Dependence on Preprocessing – Incorrect resizing, normalization, noise removal, or enhancement can affect the final detection and segmentation results.
- 8. Not a Replacement for Medical Diagnosis – The system provides automated analysis for decision support and requires verification by qualified medical professionals before clinical decisions are made.
13Future enhancement
Future work will focus on improving the liver tumor detection system by developing a mobile-friendly application for convenient CT scan analysis and extending the system to support multiple CT scan formats and larger datasets. The database can be enhanced to store detailed tumor segmentation, detection, optimization, and analysis information. Further improvements can include advanced 3D U-Net architectures, improved YOLO models, and enhanced Bat Algorithm optimization to strengthen tumor detection and segmentation. Additional work may investigate cloud deployment, secure medical-data storage, integration with hospital management systems, automated analysis reports, and longitudinal patient-scan analysis. The system can also be extended to support additional medical imaging modalities such as MRI, subject to appropriate dataset availability and validation. These extensions should be experimentally evaluated before being presented as measured improvements in system performance.
14Conclusion
The proposed Liver Tumor Detection System provides an automated method for analyzing CT scan images. It combines 3D U-Net, pixel/voxel segmentation, YOLO, and Bat Algorithm optimization for tumor detection and analysis. The system processes CT images and identifies suspected tumor regions efficiently. The 3D U-Net helps analyze volumetric information from multiple CT slices. Pixel/voxel segmentation provides detailed identification of the tumor region. YOLO helps detect and localize suspected tumors in the scan. The web-based interface allows users to upload CT scans and view the analysis results easily. The system also provides processed images and a structured analysis report. It can reduce manual effort and support computer-assisted medical image analysis. However, the final diagnosis should always be confirmed by qualified medical professionals.
References
- [1]Manghi I, Pecchi A, Esposito G, Macheda M, Zanni E, Di Benedetto F, et al. Deep learning for automatic segmentation of hepatocellular carcinoma in contrast enhanced CT scans. Scientific Reports. 2025;15(1):42000.
- [2]Song Z, Wu H, Chen W, Slowik A. Improving automatic segmentation of liver tumor images using a deep learning model. Heliyon. 2024;10(7):e28538.
- [3]Wu C, Chen Q, Wang H, Guan Y, Mian Z, Ruan C, et al. A review of deep learning approaches for multimodal image segmentation of liver cancer. Journal of Applied Clinical Medical Physics. 2024;25(12):e14540.
- [4]Lee IC, Tsai YP, Lin YC, Chen TC, Yen CH, Chiu NC, et al. A hierarchical fusion strategy of deep learning networks for detection and segmentation of hepatocellular carcinoma from CT images. Cancer Imaging. 2024;24:43.
- [5]Wei D, Jiang Y, Zhou X, Wu D, Feng X. A review of advancements and challenges in liver segmentation. Journal of Imaging. 2024;10(8):202.
- [6]Wang J, Peng Y, Jing S, Han L, Li T, Luo J. A deep-learning approach for segmentation of liver tumors in magnetic resonance imaging using UNet++. BMC Cancer. 2023;23(1):1060.