Electrical Infrastructure
Strategic Cost Estimation and Bid Optimization for Electrical Infrastructure and Power System Projects: A Framework for Sustainable Project Delivery
Alfanar Projects, Riyadh, Saudi Arabia
Published October 2026
Abstract
This study develops a Strategic Cost Estimation and Bid Optimization Framework (SCEBOF) for electrical infrastructure and power system projects delivered through engineering, procurement, and construction (EPC) arrangements. The framework integrates scope definition, bottom-up cost engineering, resource planning, quantified risk assessment, procurement governance, market intelligence, strategic pricing, management approval, and post-bid learning. Its practical application is demonstrated through a representative Saudi utility substation and transmission-integration project with an estimated base cost of SAR 121.5 million. Scenario analysis compares aggressive, balanced, and conservative bidding positions, while sensitivity tests quantify exposure to material escalation, labor inflation, schedule delay, and exchange-rate variation. Major electrical equipment accounts for 51% of the project cost and produces the largest sensitivity effect: a 20% increase adds SAR 12.4 million. A four-month delay adds SAR 4.9 million, while a 10% adverse currency movement adds SAR 6.0 million. The results indicate that a balanced 8% markup offers the strongest practical trade-off between competitiveness and profitability, provided that contingency is linked to quantified risk and critical equipment is secured through early procurement and supplier-risk controls. SCEBOF gives utilities, EPC contractors, and infrastructure developers a repeatable method for improving estimate reliability, protecting margin, strengthening governance, and supporting sustainable project delivery. The framework is particularly relevant to Saudi Arabia’s grid modernization, localization, spending-efficiency, and infrastructure objectives under Vision 2030.
Keywords: bid optimization; cost estimation; electrical infrastructure; EPC projects; power systems
1Introduction
Electrical infrastructure and power system projects are capital intensive, technically interdependent, and exposed to uncertainty throughout tendering and delivery. Substations, transmission connections, protection systems, supervisory control and data acquisition (SCADA), civil works, testing, and commissioning must be estimated as one integrated scope even though their cost bases, lead times, suppliers, and risks differ materially. Small errors in quantities, specifications, productivity assumptions, or commercial conditions can therefore produce significant cost overruns or erode the margin embedded in a competitive bid. Traditional cost-plus bidding often treats the estimate as a static technical calculation and adds a standard markup. This approach is insufficient where imported equipment, currency exposure, volatile commodity prices, limited specialist resources, liquidated damages, approval dependencies, and aggressive competitor behavior affect both project cost and the probability of winning. A sustainable bid must be technically compliant, commercially competitive, executable within available resources, and capable of absorbing identified uncertainty without relying on excessive contingency. Saudi Arabia provides a particularly relevant setting. Expansion of generation, transmission, distribution, renewable-energy integration, industrial development, smart-grid capability, and utility reliability under Vision 2030 is creating a large pipeline of electrical infrastructure projects [8], [9]. The scale and pace of this investment increase the importance of transparent estimates, localization, supplier resilience, disciplined risk allocation, and efficient capital deployment. This study addresses that need by proposing SCEBOF, a staged framework connecting cost engineering with risk, procurement, market, and strategic-pricing decisions. The objectives are to identify the cost drivers that most strongly influence electrical EPC tenders; define a repeatable estimation and bid-governance process; demonstrate the framework through a Saudi utility case; quantify sensitivity to major uncertainties; and present a weighted assessment model for management approval. The contribution is practical rather than purely algorithmic: it provides a management structure that can be adapted to different project sizes, contracting strategies, and organizational risk appetites.
2Literature review
2.1Cost estimation in engineering projects
Engineering estimates develop progressively as information matures. Early conceptual estimates rely on capacity factors, historical benchmarks, and parametric relationships; tender estimates require detailed quantities, vendor quotations, construction methods, labor productivity, indirect costs, and contractual obligations. Estimate accuracy depends not only on calculation quality but also on scope completeness, basis-of-estimate documentation, assumptions, exclusions, escalation dates, interfaces, and the treatment of uncertainty [7]. In electrical projects, long-lead transformers, gas-insulated switchgear, cables, protection relays, control systems, and specialized testing resources require separate attention because they combine high value with constrained supply.
2.2Bid optimization concepts
Bid optimization seeks a price that maximizes expected commercial value rather than simply minimizing price or maximizing markup. The decision must consider the cost distribution, probability of winning, project capacity, strategic importance, client relationship, competitor behavior, and downside risk [11], [12]. An aggressive bid may increase win probability but leave insufficient margin for uncertainty; a conservative bid may protect profitability but fail commercially. Optimization therefore requires explicit scenarios and management-defined thresholds for minimum margin, risk exposure, cash flow, and resource loading [11], [12].
2.3Strategic pricing models
Strategic pricing extends the cost estimate through market and portfolio considerations. Relevant models include cost-plus pricing, target-return pricing, competitor-referenced pricing, value-based adjustments, expected-value analysis, and risk-adjusted margin [12], [13]. No single model is sufficient for all tenders. A practical approach begins with an auditable bottom-up estimate, adds quantified contingency, and then applies a controlled strategic adjustment reflecting market conditions and business value. This preserves the distinction between cost, risk allowance, profit, and deliberate commercial positioning.
2.4Relevance to Saudi Vision 2030
Vision 2030 emphasizes sustainable infrastructure, energy reliability, localization, private-sector participation, and efficient spending [9]. These priorities influence tender evaluation beyond initial price. Contractors are increasingly expected to demonstrate local content, supply-chain resilience, schedule certainty, quality, safety, and lifecycle value. A structured bid framework supports these objectives by making assumptions visible, linking contingency to risk, evaluating supplier security, and preventing unsustainably low bids that may generate claims, delays, or quality compromise during execution.
3Research methodology
The study adopts an applied conceptual framework and illustrative case-study methodology. Development of the framework was informed by established project-management, contracting, procurement, and risk-governance guidance [2], [3], [6], [10]. First, cost-engineering, project-risk, procurement, and infrastructure-delivery principles were synthesized into a common tender decision process. Second, the process was structured into six pre-submission stages and one post-bid learning stage. Third, a representative Saudi utility EPC project was modeled to test the framework using a cost breakdown, risk register, bid scenarios, and one-variable sensitivity analysis.
The analysis uses deterministic base costs supported by scenario testing. The base estimate is expressed as the sum of electrical materials and major equipment, labor, construction equipment, subcontracted work, logistics, overheads, and risk contingency. Bid price is then derived by adding profit and an explicit strategic pricing adjustment. Sensitivity is measured by changing one key variable while holding the remaining assumptions constant. This approach makes the effect of each uncertainty understandable to tender committees and allows decision makers to compare exposures on a common monetary basis.
The case is representative and uses normalized project information rather than confidential data from a named contractor or utility. Values are intended to demonstrate the framework and should not be interpreted as a forecast for a specific live tender. The case assumes a competitive EPC procurement process, defined technical requirements, imported high-value electrical equipment, and management review of technical, commercial, contractual, and risk positions.
3.1Analytical procedure
The procedure comprised scope decomposition; work-breakdown and cost-code mapping; quantity and resource estimation; supplier quotation normalization; risk identification and impact assessment; contingency development; competitor and market review; bid-scenario construction; weighted management evaluation; and post-bid feedback. Cross-functional review is essential because engineering validates quantities and compliance, procurement validates source and lead time, construction validates productivity, finance validates cash and currency assumptions, contracts validates obligations, and management approves strategic positioning.
4Cost drivers in electrical infrastructure projects
4.1Electrical materials and major equipment costs
Electrical materials and major equipment costs typically dominate utility-project estimates. Transformers, switchgear, cables, busbars, control panels, relays, batteries, communication equipment, and earthing systems must be priced against an exact technical specification [14], [15]. The estimator should normalize quotations for scope, Incoterms, taxes, warranties, spares, testing, validity, escalation, and delivery. Commodity-linked inputs such as copper, aluminum, and steel require an escalation basis and a clearly defined pricing date, while current grid-supply evidence also highlights elevated transformer and cable prices and extended procurement lead times [14].
4.2Labor costs
Labor estimates depend on crew composition, productivity, working hours, mobilization, accommodation, supervision, safety requirements, and access restrictions. Specialized cable-jointing, protection, SCADA, and commissioning work should not be averaged into general installation rates. Localization requirements and the availability of certified specialists can also affect both cost and schedule.
4.3Construction equipment costs
Construction equipment includes cranes, lifting accessories, cable-pulling systems, temporary generation, test instruments, vehicles, and site facilities. Ownership, rental, mobilization, standby, utilization, and demobilization costs should be modeled separately. Heavy-lift requirements and restricted outage windows can create concentrated cost and execution risk.
4.4Supply chain costs
Supply-chain cost includes freight, insurance, customs handling, storage, inspection, expediting, local transport, and the financing effect of advance payments and long manufacturing periods. The lowest quoted purchase price may not represent the lowest total delivered cost. Supplier capacity, approved-vendor status, geopolitical exposure, quality history, and recovery options should be assessed alongside price.
4.5Risk factors
Key risks include incomplete scope, design change, delayed approvals, material inflation, exchange movements, supplier delay, interface failure, low productivity, rework, access constraints, outage restrictions, and contractual damages. Consistent with ISO 31000 and AACE guidance, contingency should be traceable to identified and assessed risks rather than applied as an undocumented percentage [1], [5]. High-impact risks may require avoidance or mitigation actions in addition to a monetary allowance.
5Strategic cost estimation and bid optimization framework (SCEBOF)
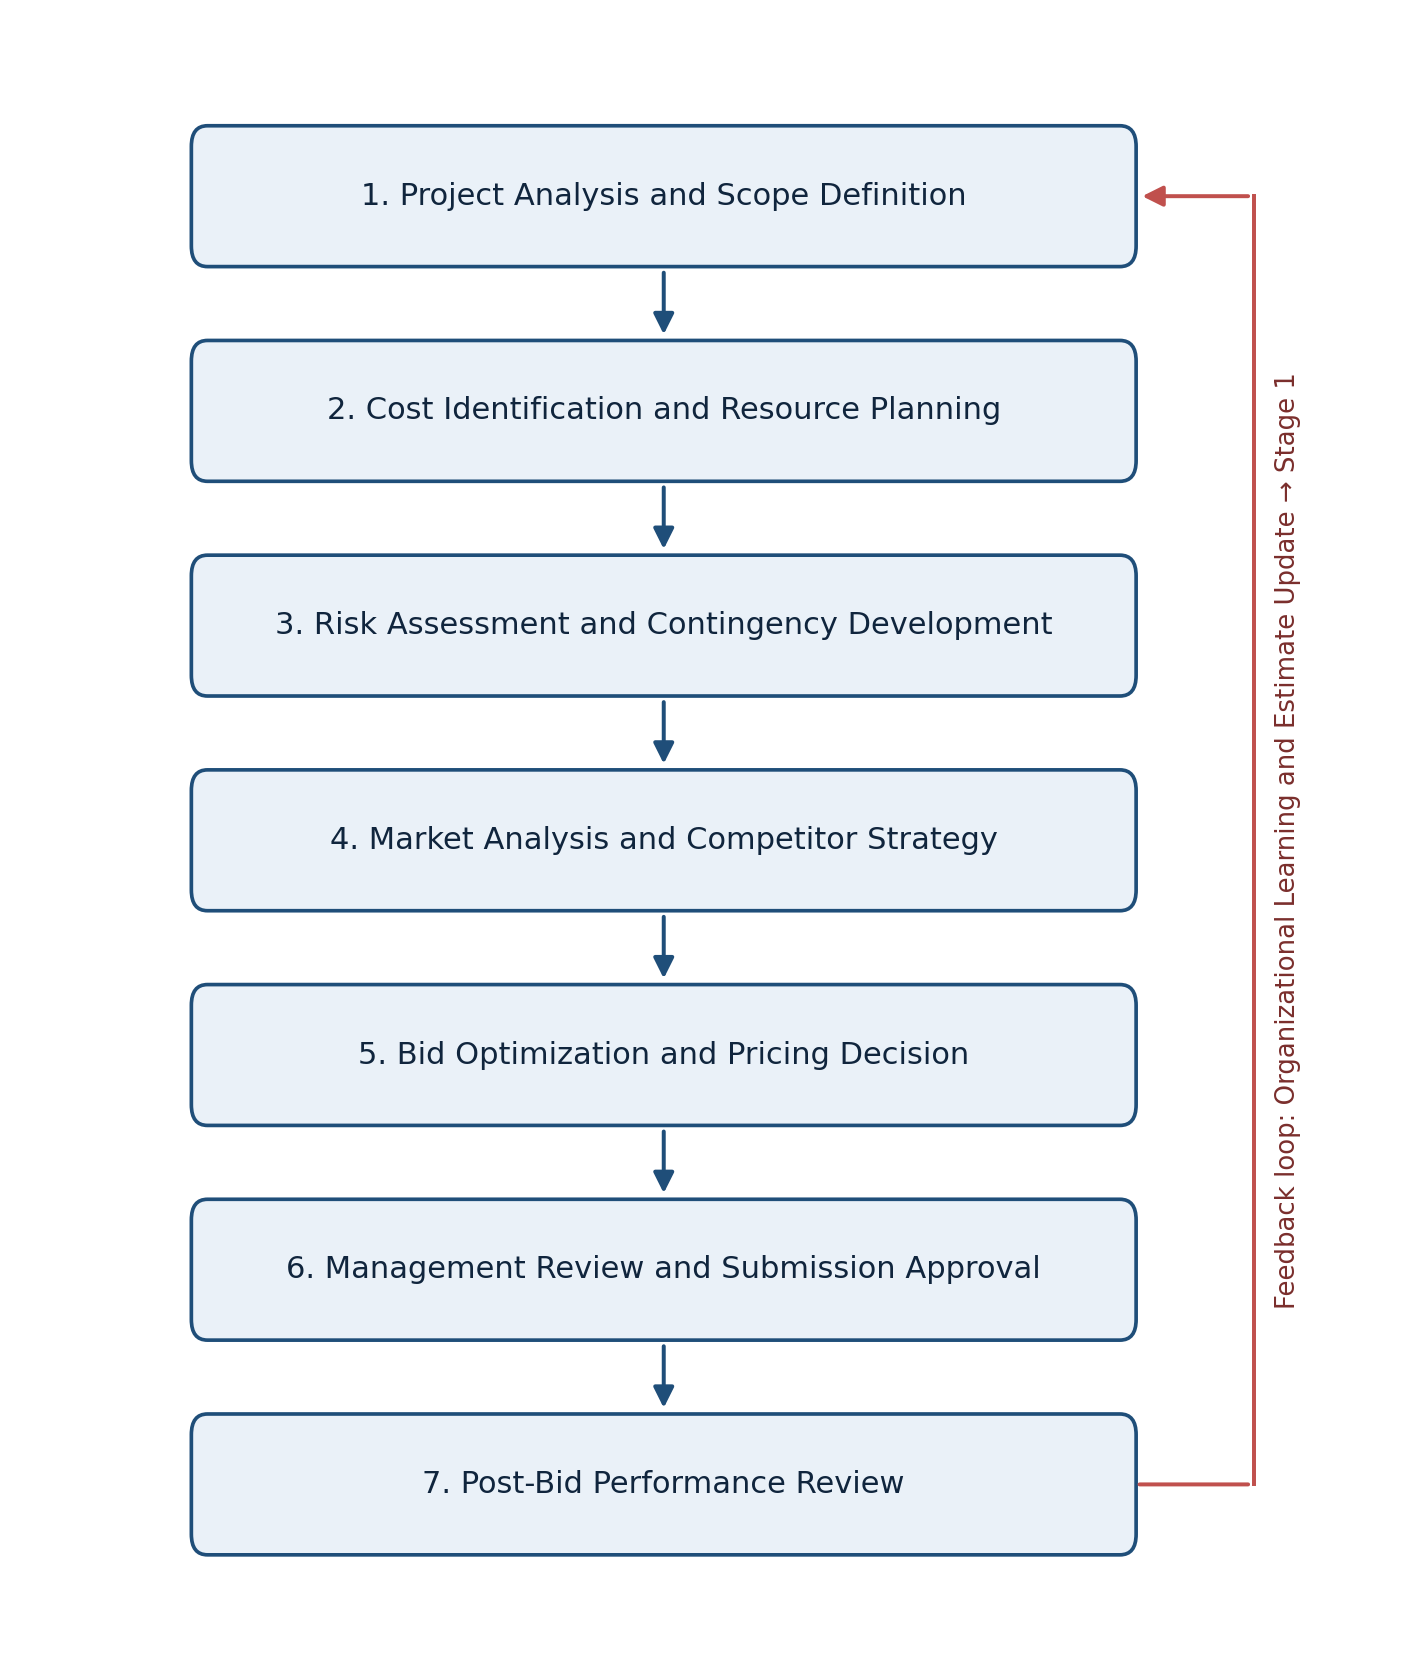
Figure 1 presents SCEBOF as a gated process. Each stage produces a defined output for the next stage and an auditable basis for approval. The seven stages and the post-bid learning loop are detailed immediately below the figure.
5.1Stage 1: Project analysis and scope definition
The tender team converts employer requirements into a structured scope, work-breakdown structure, responsibility matrix, assumptions register, exclusions, and interface map. Ambiguities are raised through clarifications before they become hidden allowances or unpriced obligations.
5.2Stage 2: Cost identification and resource planning
Quantities, resources, work methods, supplier packages, construction equipment, indirect costs, and cash-flow requirements are estimated against cost codes. Vendor quotations are normalized and benchmarked, while resource plans are checked against organizational capacity and the proposed schedule.
5.3Stage 3: Risk assessment and contingency development
Technical, contractual, schedule, procurement, commercial, and external risks are recorded with probability, impact, ownership, response, and residual exposure. Contingency is derived from quantified exposure and kept separate from profit. Critical risks receive mitigation actions, not merely monetary allowances.
5.4Stage 4: Market analysis and competitor strategy
The team assesses client priorities, likely competitor positions, market capacity, recent award behavior, procurement conditions, and differentiators such as localization, delivery certainty, engineering capability, and supplier access. Intelligence is documented with confidence levels to avoid unsupported price cutting.
5.5Stage 5: Bid optimization and pricing decision
Alternative bid positions are generated by varying markup and strategic adjustment, then comparing expected profitability, win probability, risk, cash exposure, and portfolio value. The preferred scenario must remain executable under reasonable adverse conditions.
5.6Stage 6: Management review and submission approval
A cross-functional tender committee reviews compliance, estimate completeness, resource availability, supply security, residual risk, contractual departures, profitability, and strategic fit. Approval conditions and delegated authorities are recorded before submission.
5.7Stage 7: Post-bid performance review
After award or loss, the organization compares submitted price with competitor outcomes where available. Awarded projects transfer assumptions and risks to delivery teams, and actual costs are compared with the estimate. Lessons update productivity norms, supplier data, risk allowances, and future bid strategy.
6Saudi utility infrastructure case study
6.1Project background
A representative Saudi utility infrastructure project was selected to demonstrate SCEBOF. The scope comprised a new utility substation, transmission-network integration, protection and control systems, SCADA implementation, and testing and commissioning. The competitive EPC tender required coordinated technical, commercial, and contractual evaluation. The project combined imported long-lead equipment with locally executed engineering, civil, installation, and commissioning activities. Table 1 summarizes the resulting base-cost structure.
6.2Project cost structure
| Cost Component | Cost (SAR Million) | Percentage |
|---|---|---|
| Major Electrical Equipment | 62.0 | 51% |
| Civil Works | 18.0 | 15% |
| Construction & Installation | 14.5 | 12% |
| Engineering & Design | 7.5 | 6% |
| Testing & Commissioning | 4.5 | 4% |
| Logistics | 5.0 | 4% |
| Project Management | 3.5 | 3% |
| Contingency | 6.5 | 5% |
| Total | 121.5 | 100% |
As shown in Table 1, major electrical equipment represented the dominant cost contributor. It therefore required the strongest quotation validation, escalation review, supplier due diligence, delivery planning, and currency controls. The SAR 6.5 million contingency represents approximately 5% of the base estimate and is used as an illustrative risk allowance for the representative case rather than as the output of a full probabilistic cost-risk analysis. In a live tender, the allowance should be derived from the quantified risk register, including probability, cost impact, mitigation effects, and residual exposure, consistent with risk-based contingency guidance [1], [5].
6.3Risk assessment results
| Risk Category | Impact Level | Primary Response |
|---|---|---|
| Transformer Lead-Time Delays | High | Early order, schedule float, expediting |
| Material Price Inflation | High | Quotation validity, indexed allowance, early commitment |
| Logistics Constraints | Medium | Route survey, alternative carrier, delivery sequencing |
| Currency Fluctuation | Medium | Currency clause, hedging review, pricing reserve |
| Regulatory Approvals | Medium | Approval matrix, early submission, accountable owner |
Table 2 identifies transformer lead-time delays and material price inflation as the two high-impact project risks, while logistics constraints, currency fluctuation, and regulatory approvals are assessed as medium-impact risks. The risk review also showed that mitigation decisions had to be made before submission, because several responses—such as quotation locking, supplier reservation, and route planning—could not be added efficiently after award [2], [14].
6.4Bid optimization scenarios
| Scenario | Markup | Bid Value (SAR Million) | Win Probability |
|---|---|---|---|
| Aggressive | 4% | 126.4 | High |
| Balanced | 8% | 131.2 | Medium-High |
| Conservative | 12% | 136.1 | Medium |
Table 3 compares the aggressive, balanced, and conservative bid positions. The aggressive position maximized competitiveness but offered limited capacity to absorb unmodeled exposure. The conservative position protected nominal margin but reduced commercial attractiveness. The balanced scenario produced the most favorable combined position because it retained an 8% markup while remaining within a credible competitive range. This conclusion assumes that the identified contingency is preserved and that high-impact procurement risks are actively mitigated. The qualitative win-probability ratings are management-judgment inputs rather than statistically estimated probabilities; they should be calibrated against historical tender outcomes when sufficient organizational data are available [11], [12].
7Sensitivity analysis
Sensitivity analysis examined how major uncertainties change the SAR 121.5 million base estimate. Each variable was changed independently while all other assumptions were held constant. Material escalation was applied to the SAR 62.0 million major electrical equipment base, and labor inflation was applied to the SAR 14.5 million construction and installation base. Currency movement was modeled against an assumed SAR 60.0 million foreign-currency exposure. Schedule-delay impacts represented modeled increases in project management, supervision, site facilities, equipment standby, financing, and resource-utilization costs. Tables 4–7 report the material, labor, schedule-delay, and exchange-rate scenarios, respectively, while Figure 2 summarizes their maximum modeled impacts. These deterministic scenarios illustrate decision thresholds and are not probability-weighted forecasts.
7.1Material cost escalation
| Material Cost Increase | Additional Cost (SAR Million) |
|---|---|
| +5% | 3.1 |
| +10% | 6.2 |
| +15% | 9.3 |
| +20% | 12.4 |
Table 4 shows that electrical materials and major equipment escalation was the highest cost-risk driver. The sensitivity values apply the stated percentage changes to the SAR 62.0 million major electrical equipment cost base. At 20%, the additional cost exceeded the value of the base contingency, demonstrating the need for current vendor quotations, clear validity periods, escalation clauses, and early procurement of critical packages [14], [15].
7.2Labor cost sensitivity
| Labor Cost Increase | Additional Cost (SAR Million) |
|---|---|
| +5% | 0.7 |
| +10% | 1.5 |
| +15% | 2.2 |
| +20% | 2.9 |
Table 5 indicates that labor changes had a lower absolute effect than equipment movements, but the result should not lead to complacency. Productivity loss, rework, overtime, or delayed access can compound labor cost with schedule and supervision effects.
7.3Schedule delay analysis
| Delay Duration | Additional Cost (SAR Million) |
|---|---|
| 1 Month | 1.1 |
| 2 Months | 2.3 |
| 3 Months | 3.6 |
| 4 Months | 4.9 |
As reported in Table 6, extended duration increased project management, supervision, site facilities, equipment standby, financing, and contractor resource-utilization costs. The nonlinear rise reflects cumulative overhead and inefficiency as delay extends.
7.4Currency fluctuation analysis
| Exchange Variation | Cost Impact (SAR Million) |
|---|---|
| +3% | 1.8 |
| +5% | 3.0 |
| +10% | 6.0 |
Table 7 shows the modeled exchange rate exposure. Imported transformers, switchgear, protection relays, and control systems were particularly exposed. Currency assumptions should therefore identify the foreign-currency portion, quotation currency, payment timing, and available contractual or financial protection.
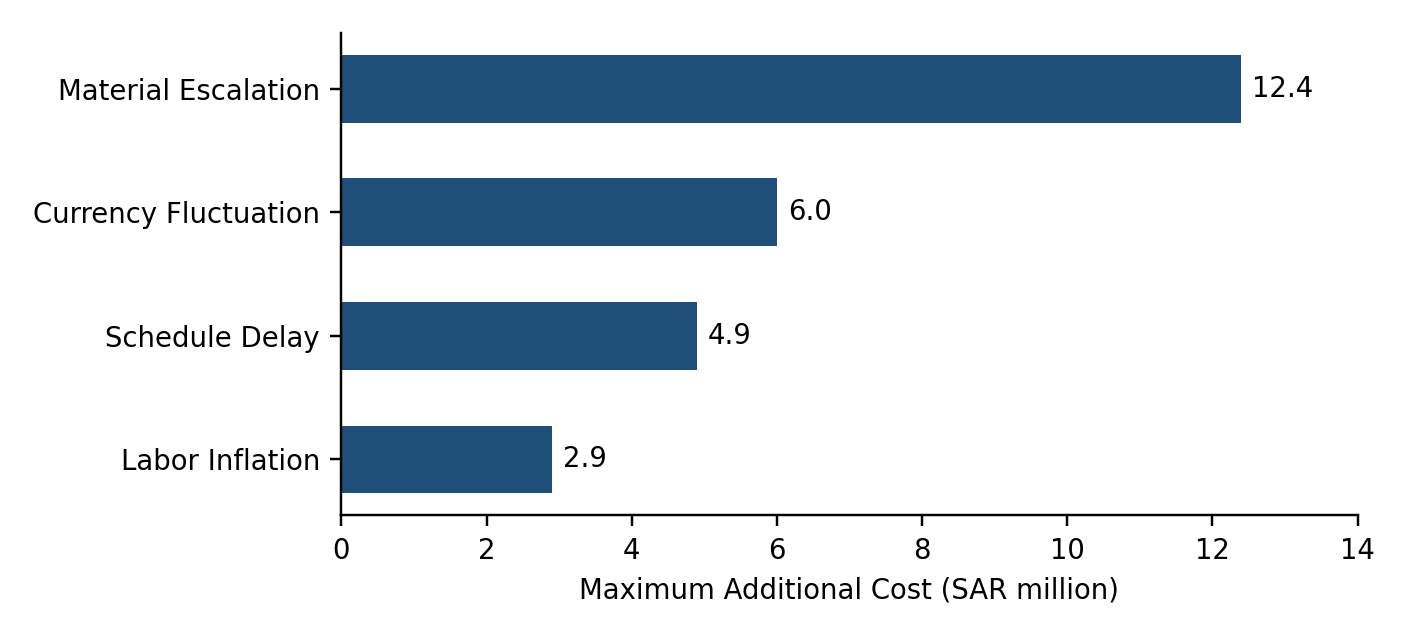
The ranking in Figure 2 confirms that procurement strategy is central to bid quality. Material escalation is the dominant single-variable exposure, followed by currency fluctuation, schedule delay, and labor variation. The scenarios are not additive without adjustment because some effects may overlap; however, they provide clear thresholds for mitigation and management approval.
8Proposed bid evaluation and profitability model
The final pricing position should be assessed through a weighted matrix rather than markup alone. Table 8 defines the evaluation areas and weights. Each area is scored from 1 to 5, where 1 indicates an unacceptable position and 5 indicates a fully supported position. The weighted score for each area equals its score divided by 5 and multiplied by its percentage weight; the overall result is the sum of all weighted scores and is expressed on a 100-point scale. Management should establish the minimum approval threshold before evaluating the tender. Any mandatory technical or contractual failure remains a gate regardless of the total score.
| Evaluation Area | Weight (%) | Management Test |
|---|---|---|
| Technical Compliance | 20 | Complete, compliant, and deliverable scope |
| Cost Accuracy | 15 | Auditable quantities, rates, quotations, and assumptions |
| Resource Availability | 10 | Confirmed engineering, construction, and specialist capacity |
| Supply Chain Security | 10 | Approved sources, viable lead times, and recovery options |
| Risk Management | 15 | Quantified exposure, funded contingency, and accountable actions |
| Commercial Competitiveness | 15 | Credible position against market and client priorities |
| Project Profitability | 10 | Margin, cash flow, and downside resilience |
| Strategic Business Value | 5 | Portfolio, relationship, capability, and localization value |
| Total | 100 | Weighted approval basis |
8.1Cost and bid formulation
The strategic adjustment may be positive or negative, but it must be explicitly approved and must not conceal an underfunded risk. Management should also review expected commercial value, expressed conceptually as win probability multiplied by risk-adjusted contribution, while recognizing that strategic value and capacity constraints may alter the final decision.
9Results and discussion
The case study demonstrates that estimate reliability is governed by cost concentration as much as by arithmetic accuracy. As shown in Table 1, 51% of the base estimate is concentrated in major electrical equipment; quotation age, technical compliance, manufacturing capacity, delivery, and foreign-currency exposure therefore become decisive [14], [15]. A general contingency cannot compensate for weak procurement intelligence when the dominant cost package is uncertain.
The scenario comparison in Table 3 also supports risk-adjusted rather than purely cost-plus pricing [11]–[13]. The aggressive 4% markup improves apparent win probability but provides less protection against residual exposure. The conservative 12% position increases nominal margin while reducing competitiveness. The balanced 8% scenario offers a stronger practical trade-off because it retains commercial credibility without abandoning margin discipline.
The sensitivity results in Tables 4–7 provide decision thresholds. A 10% increase in electrical materials and major equipment costs adds SAR 6.2 million, almost equal to the SAR 6.5 million contingency. A 20% increase adds SAR 12.4 million and could eliminate the margin in an aggressive bid. A four-month delay adds SAR 4.9 million, while a 10% adverse currency movement adds SAR 6.0 million. Figure 2 consolidates these maximum modeled impacts. These results show why tender approval should test downside exposure rather than rely on a single-point estimate [1], [5].
The findings confirm five integrated capabilities: cost engineering provides the auditable base; procurement governance validates equipment and supplier assumptions; risk management converts uncertainty into mitigation and contingency; market intelligence informs the competitive position; and strategic pricing connects expected return with win probability and business value. Separating these functions creates blind spots, while integrating them through SCEBOF strengthens accountability.
For practitioners, the framework suggests several actions: maintain a structured cost database; require quotation-normalization sheets; establish risk-based contingency rules; include supply-chain and currency gates in tender reviews; compare multiple price scenarios; record management assumptions; and complete post-bid and post-project reviews. These measures improve organizational learning and reduce repeated estimation error.
The study is limited by its illustrative single-case design and deterministic sensitivity inputs. Future research should test SCEBOF across a portfolio of completed tenders, calibrate probability-of-win models using historical outcomes, apply probabilistic cost-risk simulation, and compare results by project type, contract form, and market condition.
10Relevance to Saudi Arabia and Vision 2030
Saudi Arabia’s expansion of transmission, distribution, renewable integration, industrial utility systems, and smart-grid capability requires delivery models that are both rapid and financially sustainable [4], [8]. SCEBOF supports Vision 2030 by improving spending efficiency, procurement transparency, delivery certainty, and lifecycle value [9]. Its supplier-security and resource criteria reinforce localization and capability development, while post-bid learning supports stronger institutional knowledge. The framework can also help utilities and EPC contractors identify where local sourcing reduces exposure and where imported technology requires currency, logistics, or lead-time protection. By discouraging unsustainably low bidding, it reduces the risk that competition transfers into claims, delay, compromised quality, or incomplete scope during execution.
11Conclusion
SCEBOF provides a structured methodology for moving from scope definition to an approved, risk-adjusted, and strategically positioned bid. It prevents the estimate from being treated as an isolated spreadsheet by integrating engineering, procurement, construction, contracts, finance, risk, and management decisions. The framework also creates a feedback loop through post-bid and post-project review. The Saudi utility infrastructure case demonstrated its practical applicability. Major electrical equipment represented 51% of the SAR 121.5 million cost base, making equipment pricing and procurement assurance the primary determinants of estimate reliability. The sensitivity analysis identified electrical materials and major equipment escalation, currency movement, and schedule delay as the most significant quantified exposures. A 20% increase in electrical materials and major equipment costs added SAR 12.4 million; a 10% adverse currency movement added SAR 6.0 million; and a four-month delay added SAR 4.9 million. These values show that fixed-percentage contingency and undifferentiated markup are not sufficient. Among the three pricing positions, the balanced 8% markup produced the strongest trade-off between competitiveness and profitability. Its suitability, however, depends on preserving quantified contingency, securing critical equipment, and actively managing residual risk. The weighted bid matrix translates these requirements into a transparent approval basis. Overall, the framework gives utility companies, EPC contractors, and infrastructure developers a repeatable method for improving estimation accuracy, strengthening bid governance, protecting profitability, and supporting sustainable infrastructure delivery. Its emphasis on spending efficiency, localization, supply resilience, and grid investment aligns with the practical objectives of Saudi Vision 2030. Further empirical testing across completed projects can refine the weights, calibrate win-probability assumptions, and validate the framework under different contracting and market conditions.
References
- [1]AACE International. Risk analysis and contingency determination using expected value. Recommended Practice No. 44R-08. 2021.
- [2]Chartered Institute of Procurement and Supply. Managing supply chain risk (CORE). 2nd ed. 2024.
- [3]International Federation of Consulting Engineers. Conditions of contract for EPC/turnkey projects. 2nd ed. 2017.
- [4]International Energy Agency. Electricity grids and secure energy transitions. Paris: IEA; 2023.
- [5]International Organization for Standardization. ISO 31000: Risk management — Guidelines. Geneva: ISO; 2018.
- [6]International Organization for Standardization. ISO 21502: Project, programme and portfolio management — Guidance on project management. Geneva: ISO; 2020.
- [7]Project Management Institute. A guide to the project management body of knowledge (PMBOK Guide). 7th ed. Newtown Square, PA: PMI; 2021.
- [8]Saudi Electricity Company. Annual report 2024. Riyadh, Saudi Arabia; 2024.
- [9]Saudi Vision 2030. Vision 2030 annual report 2023. Riyadh, Saudi Arabia; 2023.
- [10]World Bank. Procurement regulations for IPF borrowers. Washington, DC: World Bank; 2023.
- [11]Leśniak A. Statistical methods in bidding decision support for construction companies. Applied Sciences. 2021;11(13):5973. https://doi.org/10.3390/app11135973
- [12]Zaqout IS, Islam MS, Hadidi LA, Skitmore M. Modeling bidding decisions and bid markup size for construction projects: A fuzzy approach. Engineering Applications of Artificial Intelligence. 2022;113:104982. https://doi.org/10.1016/j.engappai.2022.104982
- [13]Helmold M. Value-based and cost-based pricing concepts. In: Performance excellence in marketing, sales and pricing. Cham: Springer; 2022. p. 75–85. https://doi.org/10.1007/978-3-031-10097-0_7
- [14]International Energy Agency. Building the future transmission grid: Strategies to navigate supply chain challenges. Paris: IEA; 2025.
- [15]Energy Sector Management Assistance Program. Understanding the cost of transmission infrastructure: Insights from World Bank Group-financed transmission projects. ESMAP Papers. Washington, DC: World Bank; 2026. https://doi.org/10.1596/44729