Cyber Security
Modeling Enterprise Behavior for Anomaly Discovery in Security Event Data
1The Median Hybrid Agency Ltd, Abuja, Nigeria
2School of Computing, Engineering & Digital Technologies, Teesside University, Middlesbrough, England, United Kingdom
3Foyer Du Chef, Libreville, Estuaire, Gabon
4Department of Electrical & Computer Engineering, Southern University and A&M College, Baton Rouge, Louisiana, United States
Published October 2026
Abstract
This research presents and assesses a reproducible framework for detecting behavioral anomalies in enterprise security event logs through unsupervised machine learning. Because access to authentic security telemetry is often limited, a synthetic enterprise log dataset was constructed to represent authentication events, user activity patterns, session behavior, and simulated adversarial activities. The resulting dataset consists of 6,244 security events, including 5,874 normal records and 370 injected attack records covering credential stuffing, privilege misuse, abnormal session duration, and lateral movement. Behavioral and temporal characteristics were derived through rolling activity metrics, statistical deviation measures, user-specific behavioral indicators, and a composite risk score. Five unsupervised anomaly-detection techniques—Isolation Forest, Local Outlier Factor (LOF), One-Class SVM, Autoencoder, and Gaussian Mixture Model (GMM)—were developed using Python, scikit-learn, and PyTorch. Attack labels were intentionally withheld during model training and subsequently used only for post hoc performance assessment based on precision, recall, F1-score, accuracy, ROC-AUC, and PR-AUC. The evaluation indicates that Isolation Forest obtained the strongest fixed-threshold F1-score (0.4422) and PR-AUC (0.4608), whereas GMM recorded the highest ROC-AUC (0.8227). LOF demonstrated the lowest overall effectiveness, while One-Class SVM and the Autoencoder showed moderate performance across the evaluated measures. These results indicate that unsupervised learning techniques can identify useful anomaly patterns within engineered security-event features; however, their effectiveness is influenced considerably by feature representation, underlying algorithmic assumptions, and the selected evaluation measures. The proposed framework offers a controlled and reproducible basis for examining behavioral anomaly detection in security-monitoring environments where sufficiently labeled datasets are unavailable or limited.
1Introduction
1.1Background
Modern computing environments rely heavily on logging mechanisms to record system activities, authentication attempts, resource access, user sessions, and other operational events. These logs provide critical visibility into the behavior of applications, systems, and networks, making them essential for monitoring, troubleshooting, auditing, and cybersecurity analysis [1].
As enterprise systems grow in complexity and scale, the task of manually analyzing security logs becomes increasingly difficult and inefficient. Traditional rule-based and signature-driven detection methods are effective for identifying known attack patterns, but they often fail to detect previously unseen or evolving threats [2].
Anomaly detection (AD), sometimes referred to as outlier or novelty discovery, is a method used to identify unusual occurrences or data points within a collection. These abnormalities can provide important information across several fields, including cybersecurity, healthcare, and telecommunications [10].
Machine learning has emerged as a promising approach for anomaly detection in cybersecurity. In particular, unsupervised learning methods are attractive because they do not require labeled training data, which is often scarce in real-world environments [3].
Because real enterprise security logs are often restricted by privacy and confidentiality constraints, this study adopts a synthetic data approach. Synthetic datasets enable controlled experimentation while allowing the simulation of realistic user behavior, security events, and adversarial scenarios [9].
Specifically, this research investigates the comparative effectiveness of Isolation Forest, Local Outlier Factor (LOF), One-Class Support Vector Machine (One-Class SVM), Autoencoder, and Gaussian Mixture Model (GMM) approaches for behavioral anomaly detection in security event logs. By combining synthetic security-log generation, attack-scenario injection, temporal and behavioral feature engineering, statistical analysis, multiple unsupervised anomaly-detection models, and visual analytics, the study develops a reproducible framework for evaluating machine-learning-based security monitoring techniques in environments where labeled security data are limited.
1.2Significance of the study
The significance of this study lies in its contribution to the development and evaluation of intelligent approaches for security monitoring and behavioral anomaly detection. As cyber threats continue to evolve, security teams increasingly require analytical methods that extend beyond manual inspection, predefined rules, and signature-based detection. Behavioral anomaly detection provides an alternative approach by identifying activities that deviate from established patterns of normal system and user behavior.
This study is significant in several ways. First, it contributes to research on the application of unsupervised machine learning to cybersecurity analytics, particularly in situations where labeled security data are limited. Second, it provides a comparative evaluation of five different anomaly-detection approaches—Isolation Forest, Local Outlier Factor (LOF), One-Class SVM, Autoencoder, and Gaussian Mixture Model (GMM), within a common experimental framework.
Third, the use of a high-fidelity synthetic enterprise security-log dataset provides a controlled environment in which normal behavioral patterns and adversarial scenarios can be systematically generated and evaluated. This approach addresses some of the practical challenges associated with restricted access to real-world security telemetry while allowing attack scenarios to be explicitly represented for post hoc evaluation.
Finally, the study provides a reproducible experimental framework for examining how different unsupervised learning approaches respond to behavioral deviations in security event data. The findings may provide useful insights for future research into threat detection systems, Security Operations Center (SOC) workflows, and behavioral monitoring solutions designed to identify anomalous activity in enterprise environments.
1.3Statement of the problem
Security monitoring environments face multiple operational challenges. Large-scale enterprise systems generate substantial volumes of security event logs, making manual analysis inefficient and potentially error-prone. In addition, labeled cybersecurity datasets suitable for supervised machine learning are often limited in availability, difficult to obtain, and constrained by privacy and confidentiality considerations.
Traditional rule-based and signature-driven detection systems are generally effective at identifying known attack patterns but may be less capable of detecting previously unseen, evolving, or behaviorally subtle threats. Furthermore, malicious activity can sometimes resemble legitimate but unusual user behavior, making it difficult to distinguish genuine threats from normal behavioral variation.
These challenges create a need for automated approaches capable of identifying unusual behavioral patterns without relying exclusively on predefined attack signatures or large collections of labeled training data. Unsupervised machine learning provides a potential approach because models can learn representations or distributions of behavioral data without using attack labels during training.
This study therefore addresses the following central problem: How effectively can anomalous behavioral patterns in enterprise security event logs be detected and distinguished from normal behavioral variation using unsupervised machine learning techniques within a controlled and reproducible experimental environment?
1.4Hypothesis
Alternative Hypothesis (H₁). Unsupervised machine learning models, including Isolation Forest, Local Outlier Factor, One-Class SVM, Autoencoder, and Gaussian Mixture Model, can identify meaningful behavioral anomalies in synthetic enterprise security event logs.
Null Hypothesis (H₀). Unsupervised machine learning models do not identify behavioral anomalies in synthetic enterprise security event logs at performance levels meaningfully different from those expected from random or non-informative anomaly scoring.
1.5Research questions
This study seeks to answer the following questions:
- 1. Can a high-fidelity synthetic enterprise security-log dataset effectively simulate normal behavioral patterns and adversarial scenarios for anomaly-detection research?
- 2. How effectively can unsupervised machine learning models detect anomalous behavioral patterns in simulated enterprise security event logs?
- 3. How do Isolation Forest, Local Outlier Factor, One-Class SVM, Autoencoder, and Gaussian Mixture Model compare in their ability to identify injected attack observations?
- 4. How does model performance vary across different evaluation criteria, including precision, recall, F1-score, ROC-AUC, and PR-AUC?
1.6Delimitations
This study is limited to a controlled experimental environment based on synthetically generated enterprise security logs. Although the dataset is designed to represent authentication activity, user behavior, session characteristics, and adversarial activity, it does not fully capture the complexity, diversity, and operational characteristics of real-world enterprise environments.
The study focuses on four selected adversarial scenarios: credential stuffing, privilege misuse, abnormal session duration, and lateral movement. Other forms of malicious behavior, including attack types not represented in the synthetic dataset, are outside the scope of this research.
The research evaluates five selected unsupervised anomaly-detection approaches: Isolation Forest, Local Outlier Factor, One-Class SVM, Autoencoder, and Gaussian Mixture Model. Other anomaly-detection algorithms and alternative model architectures are outside the scope of the study.
The models are evaluated using a common engineered feature space derived from behavioral and temporal security-event characteristics. Attack labels are not used during model training; instead, the injected attack labels are retained for post hoc evaluation of model predictions.
Finally, the project adopts an offline analytical framework rather than a real-time streaming deployment. The emphasis is therefore placed on reproducible experimentation, comparative model evaluation, statistical and behavioral analysis, and interpretation of anomaly-detection performance rather than deployment as a live operational security-monitoring system.
2Review of related literature
2.1Anomaly detection in general
Anomaly detection is a major area of research in machine learning and data mining and has been widely applied across domains such as cybersecurity, finance, healthcare, and telecommunications [3]. Its central objective is to identify observations or patterns that differ substantially from expected behavior within a dataset. Depending on the application, such deviations may indicate fraud, system faults, security attacks, abnormal user activity, or other events of interest.
A foundational perspective in anomaly detection literature defines an anomaly as an observation that deviates markedly from other observations and consequently raises suspicion about the mechanism that generated it. This perspective remains particularly relevant to cybersecurity, where abnormal activity may indicate misuse, compromise, or an attack rather than simply statistical rarity.
Researchers commonly distinguish among three major forms of anomalies: point anomalies, contextual anomalies, and collective anomalies. Point anomalies are individual observations that differ significantly from the expected behavior of the dataset. Contextual anomalies are observations that are considered abnormal only within a particular context, such as a specific time period, user, location, or operating condition. Collective anomalies occur when a collection or sequence of observations exhibits anomalous behavior, even when individual observations may appear normal when considered independently.
This classification is particularly important in security-event analysis because malicious behavior may develop over a sequence of related events rather than appearing as a single obviously abnormal record. For example, repeated authentication failures, followed by successful access and subsequent unusual activity, may collectively provide stronger evidence of suspicious behavior than any individual event considered in isolation.
2.2Log files as a basis for security analytics
Log files record application, system, network, authentication, and other operational events over time. They are widely used for diagnostics, debugging, auditing, incident investigation, and security monitoring. In cybersecurity environments, logs provide valuable evidence about system states, user behavior, authentication activity, resource access, and other operational events. Such information can support the identification of suspicious activities including repeated failed authentication attempts, unauthorized access attempts, unusual session behavior, and abnormal resource utilization.
Despite their importance, security logs present significant analytical challenges. Enterprise log data can be large-scale, high-volume, semi-structured, heterogeneous, and noisy. The continuous generation of security events can make manual inspection impractical, particularly when analysts must distinguish genuine threats from legitimate but unusual behavior.
These challenges have motivated research into automated approaches for log parsing, log mining, behavioral analysis, and anomaly detection. Automated analysis can assist security analysts by identifying patterns that warrant further investigation and by reducing the volume of events requiring manual examination.
Log-based anomaly detection research commonly considers authentication logs, network logs, application logs, system logs, and other sources of operational telemetry. Such approaches are particularly relevant to enterprise security monitoring because suspicious activities such as credential abuse, privilege misuse, abnormal sessions, and lateral movement may manifest through changes in behavioral patterns across multiple security events. Recent research has similarly applied behavioral machine-learning and deep-learning techniques specifically to insider-threat scenarios such as privilege misuse and lateral movement, reinforcing the relevance of behavioral analysis to these attack types [16].
2.3Supervised, semi-supervised, and unsupervised anomaly detection
Machine learning approaches to anomaly detection are commonly categorized as supervised, semi-supervised, and unsupervised methods. Supervised approaches rely on labeled datasets containing examples of both normal and anomalous behavior. While supervised methods can provide effective detection when representative and sufficiently comprehensive labels are available, their application to cybersecurity is constrained by the difficulty of obtaining high-quality labeled security data that adequately represents evolving attack behaviors.
Semi-supervised approaches typically learn a representation of normal behavior using predominantly or exclusively normal observations and subsequently identify deviations from the learned representation. Such approaches can be useful when normal operational data are available and sufficiently representative of legitimate system behavior.
Unsupervised anomaly detection techniques seek to identify unusual observations or behavioral patterns without using attack labels during model training [10]. This characteristic makes unsupervised approaches particularly relevant to security-event analysis, where attack labels may be scarce, incomplete, unavailable, or difficult to obtain. Rather than relying on predefined examples of every possible attack, these approaches attempt to identify deviations based on the structure, distribution, density, or learned representation of the observed data.
However, unsupervised anomaly detection also presents an important challenge: not every statistical or behavioral deviation represents malicious activity. Legitimate users may exhibit unusual behavior, while some attacks may closely resemble normal activity. Consequently, the effectiveness of an unsupervised detector depends strongly on the quality of the behavioral representation, the characteristics of the data, the assumptions of the selected algorithm, and the criteria used to determine whether an observation should be classified as anomalous.
Given these characteristics, unsupervised learning provides an appropriate methodological foundation for the present study. The research therefore evaluates multiple unsupervised approaches within a common experimental framework, using engineered behavioral and temporal features derived from synthetic enterprise security-event logs. Attack labels are excluded from model training and retained for post hoc evaluation, allowing the detection capabilities of the different approaches to be compared under controlled experimental conditions.
2.4Statistical and classical approaches
Traditional anomaly-detection methods include statistical, threshold-based, distance-based, and density-based techniques. These approaches remain useful as analytical and comparative baselines, although they may face limitations when applied to high-dimensional, nonlinear, noisy, or complex datasets [3].
Before the widespread adoption of advanced machine learning approaches, anomaly detection was commonly addressed using statistical thresholds and distribution- or distance-based techniques. Threshold-based methods are relatively simple and computationally efficient, but they generally require domain-specific threshold selection and may not adapt effectively to changing behavioral patterns.
Statistical approaches commonly rely on assumptions about the underlying data distribution and may use techniques such as z-score analysis, probability estimation, and hypothesis testing to identify unusual observations. These methods can provide useful statistical baselines, particularly in controlled environments, but their effectiveness may decrease when the underlying data distribution is nonlinear, noisy, highly skewed, or multimodal.
Distance-based approaches identify observations that are unusually distant from other observations or from a learned region of the feature space. Although such methods can be effective for structured datasets, their computational requirements and sensitivity to feature representation can become challenging as dimensionality increases.
Density-based methods instead examine the concentration of observations within local regions of the feature space. Local Outlier Factor (LOF) is an example of this approach, estimating the local density of an observation relative to the densities of its neighboring observations. This allows LOF to identify observations that may be anomalous within their local behavioral context even when they are not extreme according to global statistical measures.
In the present study, statistical techniques including z-score analysis, moving averages, and temporal aggregation are incorporated as baseline analyses before the evaluation of the machine learning models. These analyses provide additional insight into the statistical and temporal characteristics of the synthetic security-event dataset.
2.5Isolation Forest
Isolation Forest is an unsupervised anomaly-detection algorithm that identifies anomalies through recursive partitioning of the feature space [4]. The underlying principle is that anomalous observations are generally easier to isolate than normal observations because they occur less frequently or occupy relatively sparse regions of the data space.
Isolation Forest is computationally efficient and can be applied to high-dimensional datasets, making it suitable for large-scale anomaly-detection tasks. It has been applied in areas including network traffic analysis, intrusion detection, fraud detection, and log-based anomaly detection. Its relatively low computational cost and ability to identify globally unusual observations make it an important baseline for behavioral analysis of enterprise security telemetry.
Isolation Forest can be particularly useful when abnormal observations differ substantially from the dominant behavioral patterns. However, its effectiveness depends on the representation of the underlying data and the configuration of parameters such as the number of trees and contamination level.
Variants such as Extended Isolation Forest have also been proposed to address limitations associated with conventional axis-aligned partitioning by introducing more flexible splitting strategies. These developments demonstrate the continued relevance of isolation-based methods within anomaly-detection research.
In this study, Isolation Forest is evaluated as the primary isolation-based approach and is compared with density-based, boundary-based, reconstruction-based, and probabilistic anomaly-detection methods.
2.6Local Outlier Factor
Local Outlier Factor (LOF) detects anomalies by comparing the local density of an observation with the local densities of its neighboring observations [5]. Observations located in substantially less-dense regions than their neighbors receive higher anomaly scores.
LOF is particularly valuable in situations where anomalies are locally sparse but may not be globally distant from the majority of observations. This characteristic makes the method relevant to behavioral security analysis, where suspicious activity may resemble legitimate behavior in some dimensions while exhibiting unusual characteristics within a local behavioral context.
Previous research has applied LOF to areas including network traffic analysis, intrusion detection, and adaptive anomaly monitoring. However, its performance can be sensitive to neighborhood-size parameters and feature representation. Its computational requirements may also become more demanding as dataset size increases.
Despite these limitations, LOF provides an important comparative perspective because it approaches anomaly detection from a local-density perspective, unlike Isolation Forest, which focuses on the ease with which observations can be isolated.
2.7One-Class Support Vector Machine
One-Class Support Vector Machine (One-Class SVM) is an unsupervised or novelty-detection approach that learns a decision boundary around observations considered representative of normal behavior [6]. Observations falling outside the learned boundary can subsequently be identified as anomalous.
One-Class SVM has been applied in areas such as network security, fraud detection, system monitoring, and other anomaly-detection applications. Its ability to learn a boundary around normal observations makes it particularly relevant to scenarios where examples of anomalous behavior are limited or unavailable during model training.
However, One-Class SVM performance can depend substantially on kernel selection and hyperparameter configuration. Its scalability can also become a consideration when applied to very large datasets.
In this study, One-Class SVM is included to provide a boundary-based perspective on behavioral anomaly detection alongside the isolation-based approach of Isolation Forest and the density-based approach of LOF.
2.8Deep learning for log analysis
Deep learning has expanded the scope of anomaly detection by enabling models to learn complex nonlinear relationships and latent representations from data. Neural-network-based approaches have been applied to security logs and other forms of sequential or high-dimensional telemetry [7].
Deep learning is a sub-field of machine learning that uses neural networks containing multiple processing layers to learn increasingly complex representations from data [10]. In log analysis, sequence-based and neural-network-based approaches can model relationships that may be difficult to capture using conventional statistical or distance-based techniques.
Prior work such as DeepLog demonstrated the application of Long Short-Term Memory (LSTM) networks to log analysis by learning normal sequences of log events and identifying deviations from expected patterns. Other neural approaches have explored sequence modeling, attention mechanisms, and learned representations of log events, including transformer-based models such as LogBERT, which apply self-supervised masked-language-model training to detect deviations in log sequences [17], and log-text analysis approaches designed specifically for insider-threat detection [18].
Deep learning approaches are attractive because they can model nonlinear relationships and latent structures within complex datasets. However, they may also introduce additional computational requirements and can require substantial amounts of representative data. Furthermore, the scarcity and diversity of anomalous cybersecurity events create challenges for approaches that depend heavily on labeled attack examples.
For this reason, unsupervised reconstruction-based methods such as autoencoders provide an important alternative for learning behavioral representations without requiring attack labels during model training.
2.9Autoencoders for anomaly detection
Autoencoders are neural-network-based models that learn to reconstruct their input data. In anomaly-detection applications, the model is generally trained to represent normal behavioral patterns, and the reconstruction error can subsequently be used as an anomaly score [8].
The use of autoencoders for anomaly identification has increased substantially because of their ability to learn compressed representations of complex data. An autoencoder consists primarily of an encoder and a decoder. The encoder transforms the input into a lower-dimensional latent representation, while the decoder attempts to reconstruct the original input. The difference between the original input and its reconstruction provides a measure of reconstruction error [10].
When an observation resembles the patterns learned during training, the model may reconstruct it relatively accurately. Conversely, observations that differ from the learned representation may produce larger reconstruction errors and can therefore be considered potential anomalies.
This property makes autoencoders suitable for anomaly detection in complex and high-dimensional datasets, including network telemetry, industrial data, and security-event features. Compared with simple statistical approaches, autoencoders can learn nonlinear relationships among multiple behavioral features.
However, reconstruction error does not inherently indicate maliciousness. Legitimate but unusual behavior may also produce a high reconstruction error, while attacks that closely resemble normal behavioral patterns may be reconstructed relatively well. Therefore, autoencoder performance depends strongly on the quality and representativeness of the training data and feature space.
In the present study, the Autoencoder provides a neural reconstruction-based perspective for comparison with the classical and probabilistic approaches.
2.10Gaussian Mixture Models
Gaussian Mixture Models (GMMs) provide a probabilistic approach to unsupervised anomaly detection by modeling the observed data as a weighted combination of multiple Gaussian probability distributions. Rather than assuming that all observations originate from a single homogeneous distribution, GMM represents the data using multiple mixture components, each characterized by a mixture weight, mean vector, and covariance matrix. This allows the model to represent different regions or behavioral patterns within a multivariate feature space.
For a data vector x, the probability density of a Gaussian mixture with K components can be expressed as:
p(x) = ∑k=1K πk · N(x | μk, Σk) (1) where K denotes the number of Gaussian components, πk represents the mixing weight of component k, μk is its mean vector, Σk is the corresponding covariance matrix, and N(x | μk, Σk) denotes the multivariate Gaussian density associated with that component. The mixture weights represent the relative contribution of each component to the overall probability distribution.
In anomaly detection, GMM can identify observations that have relatively low probability under the learned data distribution. Observations located in low-density regions of the fitted mixture can therefore be assigned higher anomaly scores. This density-based formulation is particularly useful when normal observations exhibit multiple behavioral patterns or clusters rather than following a single distribution. Previous anomaly-detection research has similarly used GMM to model background or normal-data distributions and identify observations that do not conform to the learned probability structure, including intrusion-detection systems that model each engineered feature using multiple simple Gaussian mixtures combined through an asymmetric voting scheme [19].
The probabilistic nature of GMM provides a complementary perspective to the other anomaly detection approaches evaluated in this study. Isolation Forest identifies observations that are easily isolated, Local Outlier Factor evaluates local density deviations, One-Class SVM learns a boundary around the data distribution, and the Autoencoder evaluates reconstruction error. GMM instead evaluates how well each observation conforms to the learned probabilistic mixture distribution.
In the present study, a Gaussian Mixture Model with two Gaussian components and full covariance is applied to the six-dimensional engineered behavioral feature space consisting of risk_score, session_duration_min, login_freq_5, failed_attempts_rolling, session_zscore, and failed_zscore. The model is trained without access to the is_attack or attack_type labels, thereby maintaining the unsupervised learning setting.
The fitted model produces a negative log-likelihood-based anomaly score, where higher values indicate observations with lower likelihood under the learned mixture distribution and are therefore considered more anomalous. The resulting scores and predictions are subsequently compared with the known injected attack labels during post-hoc evaluation.
The use of GMM strengthens the comparative design of this study by introducing a probabilistic density-estimation perspective alongside isolation-based, local-density, boundary-based, and reconstruction-based approaches. This comparison is particularly relevant to behavioral security analytics because enterprise activity may consist of multiple overlapping behavioral patterns rather than a single clearly defined normal state. Research on unsupervised cyber-attack detection has likewise demonstrated the use of GMM density estimation as part of anomaly-detection frameworks for network and security data [11].
2.11Offline and online log anomaly detection
Log anomaly-detection approaches may also be categorized according to whether analysis is performed offline or online.
Offline anomaly detection processes previously collected log data, either as a complete dataset or through periodic analytical workflows. This approach is suitable for historical analysis, experimentation, parameter evaluation, and reproducible research [10].
Online anomaly detection, in contrast, processes incoming log events continuously or in near real time. Such approaches are designed to support immediate anomaly detection and alert generation in operational environments. However, online deployment introduces additional requirements involving processing latency, scalability, continuous adaptation, and real-time data ingestion.
This study adopts an offline anomaly-detection framework. This approach is appropriate because the research emphasizes synthetic dataset generation, controlled attack injection, feature engineering, statistical and temporal analysis, comparative model evaluation, and reproducibility rather than real-time operational deployment.
2.12Synthetic data in cybersecurity research
Due to privacy, confidentiality, accessibility, and data-sharing constraints, synthetic datasets provide a practical approach for cybersecurity research involving security-event data [9]. Synthetic data allow researchers to construct controlled environments in which normal behavior and adversarial scenarios can be explicitly represented and evaluated.
Synthetic data generation can simulate user behavior, authentication activity, event timing, session characteristics, and adversarial scenarios. It also allows specific attack behaviors to be deliberately injected into an otherwise normal dataset, making it possible to evaluate anomaly-detection models against known ground-truth attack observations.
In the present study, the synthetic dataset represents enterprise security-event activity and incorporates four adversarial scenarios: credential stuffing, privilege misuse, abnormal session duration, and lateral movement. This controlled approach allows the behavioral characteristics of the simulated attacks to be examined while preserving a known ground-truth label for post hoc evaluation.
The use of deterministic random seeds in the final experimental pipeline also supports reproducibility of the generated dataset and subsequent model results. This is important because reproducibility allows the experimental workflow to be repeated under the same configuration and provides a consistent basis for comparing different anomaly-detection approaches.
For these reasons, the present study adopts a synthetic enterprise-log generation strategy to provide a controlled and reproducible environment for investigating unsupervised behavioral anomaly detection.
2.13Summary of related literature
The reviewed literature demonstrates that anomaly detection has evolved from statistical, threshold-based, distance-based, and density-based approaches toward increasingly sophisticated machine learning and deep learning methods. Security logs remain an important source of information for cybersecurity analytics, but their volume, complexity, heterogeneity, and behavioral variability create significant challenges for manual and rule-based analysis.
Unsupervised anomaly detection is particularly relevant to cybersecurity because representative labeled attack datasets can be difficult to obtain and may not adequately capture emerging attack behaviors. Different unsupervised approaches address this problem from different perspectives. Isolation Forest identifies observations that are easier to isolate, LOF examines local-density deviations, One-Class SVM learns a boundary around normal observations, Autoencoders identify deviations through reconstruction error, and GMM evaluates observations according to their likelihood within a learned probability distribution.
The literature also emphasizes the importance of distinguishing between point, contextual, and collective anomalies because suspicious security behavior may emerge through individual events or sequences of related events.
Synthetic datasets provide a controlled alternative for cybersecurity experimentation where access to real enterprise telemetry is restricted. When combined with controlled attack injection and deterministic experimental procedures, synthetic data can support reproducible evaluation of anomaly-detection techniques.
Overall, the literature provides a foundation for investigating behavioral anomaly detection using multiple unsupervised approaches. However, the differing assumptions of these models and the difficulty of distinguishing malicious behavior from legitimate behavioral variation indicate the need for controlled comparative evaluation. This study addresses this need by evaluating five unsupervised approaches within a common synthetic enterprise security-event environment.
2.14Related comparative studies
While the preceding sections reviewed the theoretical foundations of individual anomaly-detection algorithms, several recent studies have directly compared multiple unsupervised approaches within a single experimental framework, providing useful points of reference for the present research.
Kumar et al. [12] evaluated DBSCAN, Isolation Forest, One-Class SVM, Local Outlier Factor, and a neural network Autoencoder on the NSL-KDD network intrusion dataset, reporting that Isolation Forest achieved the strongest detection performance (F1-score of 0.993, accuracy of 99.6%), while density-based and neural approaches produced comparatively weaker results. This study's model selection closely parallels the present work, sharing four of the five evaluated algorithms; however, it relies on network-flow features from a long-established benchmark dataset rather than behaviorally engineered, user-centric security-event features, and does not incorporate a probabilistic Gaussian Mixture Model for comparison.
Agyemang [13] conducted a comparative evaluation of five unsupervised anomaly-detection algorithms—One-Class SVM, One-Class SVM with Stochastic Gradient Descent, Isolation Forest, Local Outlier Factor, and Robust Covariance
—using a synthetically simulated dataset, finding that Isolation Forest, One-Class SVM, and Robust Covariance were most effective while LOF underperformed. This study's use of synthetic data mirrors the methodological approach adopted in the present research; however, its synthetic dataset was not designed to represent enterprise authentication behavior, session characteristics, or adversarial scenarios specific to security operations, and its evaluation did not include reconstruction-based or probabilistic density-estimation models.
Benova and Hudec [14] applied Isolation Forest in combination with DBSCAN clustering and expert review to identify anomalous individual user activity within NGINX web server logs, demonstrating that isolation-based detection can surface subtle user-level behavioral anomalies when supplemented with qualitative analyst evaluation. This work shares the present study's focus on log-based, user-centric behavioral analysis; however, it evaluates only a single primary anomaly-detection algorithm rather than comparing multiple approaches, and depends on manual expert review rather than quantitative ground-truth labels for evaluation.
Gutierrez-Portela et al. [15] evaluated K-means++, DBSCAN, Local Outlier Factor, and Isolation Forest for intrusion detection using the BoT-IoT dataset under conditions of significant class imbalance, a challenge directly relevant to the present study's dataset, in which injected attack observations represent only approximately six percent of all records. Their findings emphasize that unsupervised clustering and isolation-based methods respond differently to imbalanced attack distributions; however, their evaluation does not include boundary-based, reconstruction-based, or probabilistic approaches, limiting direct comparison with the full range of model assumptions examined in the present study.
Das et al. [20] examined AI-driven threat detection across intrusion detection, malware classification, phishing detection, and insider-threat analysis, reporting that Isolation Forest and deep Autoencoders both produced useful anomaly signals when applied to network traffic. This study's use of Isolation Forest and Autoencoder models overlaps with two of the five approaches evaluated in the present research; however, it addresses four distinct security problem domains using different feature representations for each, rather than evaluating multiple unsupervised approaches against a single common behaviorally engineered feature space, and does not incorporate density-based, boundary-based, or probabilistic density-estimation methods for direct comparison.
Collectively, these studies demonstrate growing interest in comparative unsupervised anomaly-detection evaluation across network, log-based, and imbalanced security data. However, none of the reviewed studies jointly evaluates isolation-based, density-based, boundary-based, reconstruction-based, and probabilistic density-estimation approaches within a single experimental framework, nor do they combine synthetic enterprise-log generation with engineered behavioral and temporal features specific to authentication, session, and privilege-based adversarial scenarios. The present study addresses this gap by evaluating five methodologically distinct unsupervised approaches—Isolation Forest, Local Outlier Factor, One-Class SVM, Autoencoder, and Gaussian Mixture Model—against a common, behaviorally engineered feature space, using both fixed-threshold classification metrics and threshold-independent ranking measures to provide a more comprehensive comparative assessment than existing work.
3Methodology
This study adopts a modular and reproducible experimental framework for evaluating unsupervised machine-learning approaches to behavioral anomaly detection in synthetic enterprise security-event logs. Synthetic data generation enables controlled evaluation of anomaly-detection models in the absence of accessible real-world labeled datasets [9].
The overall workflow is organized as an interconnected pipeline in which each stage contributes to the construction and evaluation of the experimental environment. The framework consists of synthetic log generation, adversarial attack injection, preprocessing and feature engineering, statistical and temporal analysis, unsupervised machine-learning modeling, performance evaluation, and visualization.
The pipeline implementation uses deterministic random seeds for the data-generation and attack-injection processes. This allows the canonical experiment to be reproduced under the same configuration and provides a consistent dataset for model comparison.
The final dataset contains 6,244 security-event observations, consisting of 5,874 normal observations and 370 injected attack observations. The attack observations represent four scenarios: credential stuffing, privilege misuse, abnormal session duration, and lateral movement.
The implementation is organized as a reproducible software pipeline in Python, with separate modules responsible for raw data generation, attack injection, preprocessing and feature engineering, model training, evaluation, and visualization. Centralized configuration and consistent feature definitions are used to maintain comparability across the five evaluated models.
The machine-learning stage evaluates Isolation Forest, Local Outlier Factor, One-Class SVM, Autoencoder, and Gaussian Mixture Model using a common engineered feature space. Attack labels are excluded from model training and are retained for post hoc evaluation using classification and ranking-based performance measures.
The resulting framework supports controlled experimentation, reproducible model comparison, statistical analysis, and behavioral interpretation while maintaining a clear separation between data generation, anomaly detection, and performance evaluation.
3.1Research design
The study employs an experimental research design based on synthetic enterprise security telemetry. The design simulates normal user behavior and adversarial activity within a controlled environment, allowing the comparative evaluation of multiple unsupervised anomaly-detection methods while avoiding the privacy and accessibility constraints associated with sensitive real-world security logs.
The research is structured into the following stages:
- 1. Generation of baseline synthetic enterprise security logs
- 2. Injection of adversarial attack scenarios into the baseline logs
- 3. Extraction and construction of behavioral and temporal features from the event data
- 4. Application of statistical and temporal anomaly-analysis techniques
- 5. Implementation of five unsupervised machine-learning models
- 6. Evaluation of model outputs using classification and threshold-independent anomaly-detection metrics
- 7. Visualization and security interpretation of the resulting anomaly patterns
The final experimental dataset contains 6,244 security-event observations, comprising 5,874 normal observations and 370 injected attack observations. The injected scenarios represent credential stuffing, privilege misuse, abnormal session duration, and lateral movement.
The five unsupervised models evaluated in the study are:
- Isolation Forest
- Local Outlier Factor (LOF)
- One-Class Support Vector Machine (One-Class SVM)
- Autoencoder
- Gaussian Mixture Model (GMM)
Attack labels are excluded from model training and are retained for post hoc evaluation. This allows the study to simulate an unsupervised detection setting while still providing known ground truth for quantitative assessment.
The staged design begins with the generation of normal enterprise-like behavioral activity, followed by controlled injection of adversarial scenarios. Behavioral and temporal features are subsequently constructed from the resulting event data before statistical analysis and machine-learning-based anomaly detection are performed. The outputs of the five models are then evaluated and visualized to examine their ability to distinguish injected attack observations from normal behavioral variation.
The final data-generation and attack-injection pipeline uses deterministic random seeds, allowing the canonical experiment to be reproduced under the same configuration. This supports consistency across model evaluations and strengthens the methodological reproducibility of the study.
3.2Instruments and development environment
The study was implemented using Python as the primary programming language. Python was selected because of its extensive ecosystem for synthetic data generation, data preprocessing, statistical analysis, machine learning, and visualization.
The principal tools and libraries used in the project include:
| Tool / Library | Purpose |
|---|---|
| Python | Overall implementation and experimental pipeline |
| Faker | Synthetic identity and attribute generation |
| Pandas | Data manipulation, transformation, and tabular processing |
| NumPy | Numerical operations and deterministic sampling |
| Scikit-learn | Isolation Forest, LOF, One-Class SVM, GMM, preprocessing, and evaluation |
| PyTorch | Autoencoder implementation and neural-network modeling |
| Matplotlib | Statistical and model-result visualization |
| t-SNE / UMAP | Dimensionality reduction and feature-space visualization |
| Visual Studio Code | Software development and project management |
| Jupyter Notebook | Exploratory analysis and experimentation |
The project is organized as a modular software pipeline separating data generation, attack simulation, preprocessing and feature engineering, statistical analysis, model implementation, evaluation, and visualization. Raw security logs are maintained in data/raw/, processed datasets and model outputs are stored in data/processed/, and generated figures are maintained in the appropriate visualization/output directories.
The modular organization allows individual stages of the experimental workflow to be executed and evaluated independently while maintaining consistent data and feature definitions across the five anomaly-detection models. This structure supports traceability, controlled experimentation, and reproducibility throughout the study.
3.3Synthetic dataset generation
Due to the limited accessibility of real enterprise security logs, primarily because of privacy, confidentiality, and operational restrictions, this study uses a synthetic data-generation approach to create enterprise-like security event logs. Synthetic datasets provide a controlled environment for evaluating anomaly-detection techniques while allowing the deliberate inclusion of both normal and malicious behavioral patterns.
The data-generation process incorporates probabilistic mechanisms to simulate variability in user activity, event timing, session behavior, authentication outcomes, and resource access. However, the final experimental pipeline uses fixed random seeds to ensure deterministic and reproducible results under the same configuration. This allows the canonical experiment to be repeated while producing the same dataset and downstream model results.
The synthetic dataset was designed to represent enterprise authentication and session activity while incorporating behavioral differences across users, departments, privilege levels, operating schedules, and access patterns.
3.4User profile modeling
Synthetic users are generated to represent employees or system actors within an enterprise environment. Each user profile contains attributes that influence behavioral patterns within the generated log stream. These include:
- User identifier and username
- Department and role
- Privilege level
- Normal working-hour window
- Typical IP address range
- Geographic location
- Device type
These profile attributes provide the basis for modeling heterogeneous user behavior across departments, privilege levels, operational schedules, and access environments.
3.5Temporal activity simulation
The dataset incorporates time-series behavior by generating events across multiple days with varying activity windows. Each user is assigned typical operating hours, and event timestamps are generated according to these behavioral patterns to simulate normal daily activity.
This temporal structure is important because some security anomalies are contextual or collective in nature and may become more apparent when user activity is examined across time rather than as isolated events. Temporal characteristics are therefore incorporated into the feature-engineering and statistical-analysis stages of the study.
3.6Behavioral event construction
Each generated log entry contains fields describing user behavior and system interaction, including:
- Timestamp
- User identifier and profile attributes
- Source IP address
- Device type and location
- Resource accessed
- Action performed
- Login success status
- Number of failed authentication attempts
- Session duration
- Attack label
- Attack type
Resource access is generated probabilistically according to user department and privilege level so that baseline activity follows plausible organizational patterns. This provides a behavioral structure against which deviations introduced during the adversarial-injection stage can subsequently be evaluated.
3.7Baseline normal dataset
The first stage of data generation produces only normal security-event logs. At this stage, all records are assigned:
is_attack = 0
attack_type = "normal"
The baseline dataset provides the representation of normal enterprise-like behavioral activity from which the subsequent attack scenarios are constructed.
3.8Adversarial scenario injection
Following the generation of the baseline normal logs, adversarial scenarios are injected into the synthetic security-event stream to simulate anomalous behavior. This stage introduces attack-like behavioral deviations while preserving the overall schema and structure of the enterprise log data.
Rather than replacing the baseline dataset, anomalous events are added to the normal log stream so that the final dataset contains both benign and malicious behavioral patterns. The attack-injection process is implemented as a separate Python module, maintaining modularity within the overall pipeline.
The generated attack events retain the same general schema as the baseline logs, including timestamps, user identity, department, role, privilege level, source IP address, location, device type, resource accessed, action, login status, failed attempts, session duration, and attack labels. This allows normal and anomalous observations to be processed using the same downstream feature-engineering and anomaly-detection pipeline.
Four categories of adversarial behavior are simulated in this study:
3.8.1Credential stuffing
Credential stuffing is modeled through repeated failed login attempts occurring during unusual hours, typically outside normal working periods. These events are assigned elevated failed-attempt counts and short session durations to represent automated or repeated authentication abuse. External-looking IP ranges are also introduced to increase the behavioral distinction between these events and typical enterprise access patterns.
3.8.2Privilege misuse
Privilege misuse is simulated by selecting lower-privilege users and generating successful access events involving sensitive resources such as administrative consoles, financial systems, or security dashboards. This scenario represents unauthorized use of valid access privileges and is intended to demonstrate behavior that may appear legitimate at the individual event level while deviating from expected user-resource relationships.
3.8.3Abnormal session duration
Abnormal session behavior is modeled by assigning unusually short or unusually long session durations to selected successful activity records. These deviations represent suspicious sessions that differ substantially from normal usage patterns, such as automated access bursts or prolonged unauthorized activity.
3.8.4Lateral movement
Lateral movement is simulated through behavioral changes associated with access across systems or resources that would not typically form part of a user’s normal activity pattern. The scenario is intended to represent an attacker moving between enterprise resources after obtaining an initial foothold.
The inclusion of lateral-movement events allows the experiment to evaluate whether behavioral features can identify changes in resource-access patterns even when individual events may not appear inherently malicious.
3.9Final synthetic dataset
The completed synthetic dataset contains 6,244 security-event observations, consisting of:
- 5,874 normal observations
- 370 injected attack observations
The injected attack observations are distributed across the four adversarial scenarios:
| Attack Scenario | Number of Observations |
|---|---|
| Credential stuffing | 120 |
| Lateral movement | 100 |
| Privilege misuse | 80 |
| Abnormal session duration | 70 |
| Total attacks | 370 |
| Normal observations | 5,874 |
| Total dataset | 6,244 |
The attack labels are retained as ground truth for subsequent evaluation but are not provided to the unsupervised models during training. This preserves the unsupervised nature of the detection task while allowing the performance of each model to be quantitatively assessed after detection.
3.9.1Lateral movement
Lateral movement was simulated through short sequences of rapid resource-access events generated for the same user across multiple systems within a compressed time interval. These sequences were placed primarily during off-hours to represent suspicious traversal behavior across enterprise resources.
Each injected attack event was explicitly labeled using:
is_attack = 1
attack_type = <specific attack type>
Baseline normal events retained:
is_attack = 0
attack_type = "normal"
These labels were not used during model training, as the study focuses on unsupervised anomaly detection. Instead, they were preserved as ground-truth information for post hoc comparative evaluation and interpretation of model performance.
The final attack-injected dataset therefore contains both normal and anomalous observations, enabling controlled assessment of how different anomaly-detection approaches respond to multiple forms of simulated malicious behavior. The design supports the evaluation of both individual anomalous observations and temporally structured adversarial patterns.
3.10Feature engineering
Feature engineering plays a crucial role in transforming raw security-event data into meaningful representations that can improve the ability of anomaly-detection models to distinguish between normal and suspicious behavior. Rather than relying solely on the original event attributes, this study derives temporal, behavioral, and statistical indicators that expose patterns in user activity.
The feature-engineering stage was designed both to support anomaly-detection performance and to preserve interpretability. This allows anomalous observations to be related to understandable security-relevant signals such as repeated failed authentication attempts, unusual session duration, elevated login frequency, and off-hours activity.
The feature-engineering process was implemented as a multi-step transformation pipeline. Starting from the attack-injected log dataset, raw event records were progressively transformed into higher-level behavioral indicators through temporal extraction, rolling behavioral aggregation, statistical deviation analysis, user-baseline analysis, and composite risk scoring.
This staged approach allows the experimental framework to capture both event-level irregularities and broader behavioral deviations occurring over time.
3.11Temporal features
Temporal features were extracted from the timestamp field to capture when events occur and whether activity deviates from expected temporal behavior.
The derived temporal attributes include:
- hour — the hour of the day at which an event occurred.
- day — the day of the week associated with the event.
- is_night — a binary indicator representing whether the event occurred during defined nighttime hours.
These variables provide contextual information for behavioral analysis. They are particularly relevant to activity such as repeated authentication attempts or unusual resource access occurring outside a user’s expected operating period.
3.12Behavioral features
Behavioral features were engineered to capture short-term user activity patterns and repeated authentication behavior.
The principal behavioral features include:
- login_freq_5 — the rolling count of login attempts within the defined recent activity window.
- failed_attempts_rolling — the rolling mean of failed authentication attempts over recent events.
These features provide information about the intensity and repetition of user activity. They are particularly relevant to authentication-based anomalies such as credential stuffing and repeated login abuse, where suspicious behavior may become more apparent when multiple events are considered together rather than when individual records are examined independently.
3.13Statistical features
Statistical features were derived to quantify deviations from expected behavioral characteristics. These include:
- session_zscore — the standardized deviation of session duration from the relevant session-duration distribution.
- failed_zscore — the standardized deviation of failed authentication attempts from the relevant distribution.
- session_deviation — the difference between an observed session duration and the corresponding user-level session baseline.
These features provide numerical measures of behavioral deviation and allow observations that differ substantially from expected patterns to be represented within the model feature space.
3.14User baseline modeling
Because user behavior can vary across individuals, departments, and roles, user-level baseline modeling was incorporated into the feature-engineering process.
User baselines provide contextual information that allows an observation to be considered relative to expected user behavior rather than exclusively against global population-level statistics. This is particularly relevant to contextual anomalies, where an event may appear relatively normal across the entire dataset but represent unusual behavior for a particular user.
The user-baseline approach therefore provides additional behavioral context for interpreting deviations in session activity and other security-event characteristics.
3.15Composite risk scoring
A composite feature, risk_score, was constructed by combining multiple anomaly-relevant behavioral indicators into a single interpretable metric. The score incorporates signals associated with failed authentication attempts, nighttime activity, session irregularity, and short-term login frequency.
The purpose of the composite score is to provide an aggregated representation of behavioral risk that can be used for exploratory statistical analysis and as part of the downstream anomaly-detection feature space.
Higher risk-score values represent observations exhibiting a greater combination of the defined risk indicators. For example, an observation involving repeated failed authentication attempts, nighttime activity, unusual session characteristics, and elevated short-term login frequency can receive a higher composite score.
Absolute deviation is used where appropriate to capture deviations in both directions, including unusually high and unusually low behavioral values.
3.16Final model feature space
Following preprocessing and feature engineering, a common six-feature numerical representation was used for the five machine-learning models:
- risk_score
- session_duration_min
- login_freq_5
- failed_attempts_rolling
- session_zscore
- failed_zscore
Thus, the final model feature vector can be represented as:
Using a common feature space provides a consistent basis for comparing Isolation Forest, LOF, One-Class SVM, Autoencoder, and GMM.
Importantly, the is_attack and attack_type fields are not included in the model feature vector. They are retained solely as ground-truth labels for post hoc evaluation. This separation ensures that the models perform anomaly detection without directly receiving information about whether an observation represents an injected attack.
3.17Rationale for engineered features
The engineered features were selected to balance detection utility and interpretability. In cybersecurity settings, it is important not only to detect anomalous events but also to understand the behavioral characteristics that make an observation appear unusual. For this reason, the study emphasizes features that can be directly associated with authentication activity, session behavior, temporal patterns, and deviations from established behavioral baselines.
Several of the most informative variables in this project are derived rather than directly present in the raw logs. This is important because suspicious behavior is not always explicitly visible within individual event records. Instead, meaningful behavioral patterns may emerge through temporal aggregation, rolling activity measurements, statistical deviation, or comparison with typical user behavior.
The risk_score provides a composite representation of multiple behavioral signals, while the remaining variables preserve specific aspects of authentication frequency, failed authentication activity, session behavior, and statistical deviation. This combination provides the anomaly-detection models with both aggregated and feature-specific representations of user behavior.
3.18Preliminary observations
Initial inspection of the engineered features indicates that the feature set is particularly effective at highlighting authentication-related anomalies such as credential stuffing. This is primarily because credential-stuffing activity produces pronounced changes in failed authentication attempts, short-term login frequency, and related behavioral indicators.
Abnormal session behavior is also represented through session-duration and statistical-deviation features. However, the analysis indicates that more complex access-pattern anomalies, particularly privilege misuse and lateral movement, are less strongly represented by the current feature space. These attack types may require additional contextual features in future work, such as access diversity, privilege-resource relationships, resource traversal patterns, and user-resource interaction baselines.
The composite risk_score also provides useful separation between several behavioral categories. Credential-stuffing observations exhibit substantially higher risk scores than normal observations, while abnormal-session observations show a more moderate increase. In contrast, lateral-movement and privilege-misuse observations are less clearly separated from normal behavior using the current risk representation. This suggests that the effectiveness of a behavioral anomaly-detection system depends strongly on whether the engineered features adequately represent the characteristics of the attack scenarios being investigated.
Overall, the feature-engineering stage provides a richer representation of security-event behavior than the raw log attributes alone and establishes the feature space used for the subsequent statistical analysis and unsupervised machine-learning experiments.
3.19Statistical and temporal analysis
The statistical and temporal analysis component of this study was designed to examine the behavioral characteristics of the engineered security-event features before applying the unsupervised machine-learning models. These analyses provide descriptive and statistical baselines for understanding feature distributions, identifying unusual observations, and examining temporal changes in behavioral activity.
The statistical analysis also supports validation of the feature-engineering process by providing an initial assessment of whether the derived variables capture meaningful behavioral variation.
3.20Distribution analysis
Feature distributions were analyzed using histograms to understand the underlying behavior of the engineered variables. This analysis provides insight into:
- the central tendency and spread of feature values;
- skewness and long-tail behavior;
- the presence of extreme observations and potential outliers; and
- differences in the distribution of behavioral measurements.
Visual inspection of the distributions provides an initial indication of whether the engineered features capture meaningful deviations in user activity.
The risk_score distribution, in particular, exhibits a positively skewed pattern, with most observations concentrated toward lower values and a smaller number of observations producing substantially higher scores. This behavior is consistent with the presence of episodic high-risk activity within the simulated security environment.
3.21Z-score based analysis
Z-score standardization was used to quantify the degree to which observations deviate from the mean of a numerical feature. The z-score is calculated as:
where:
- x is the observed feature value;
- μ is the feature mean; and
- σ is the feature standard deviation.
Large absolute z-scores indicate observations that are substantially different from the feature’s average behavior. A commonly used threshold, such as |z| > 3, can be used to identify extreme statistical deviations.
In this project, z-score-based analysis also contributes to the engineered behavioral representation through features such as session_zscore and failed_zscore. These variables provide the machine-learning models with explicit measures of deviation in session duration and failed authentication behavior.
Because z-score analysis assumes that the mean and standard deviation provide a useful representation of the underlying distribution, its interpretation must be considered alongside distributional characteristics such as skewness and the presence of extreme values.
3.22Interquartile range (IQR) method
The Interquartile Range (IQR) method was used as a complementary approach for identifying statistical outliers, particularly where feature distributions may not conform well to a normal distribution.
The IQR is defined as:
where Q1 represents the 25th percentile and Q3 represents the 75th percentile.
Observations can be considered statistical outliers when they satisfy:
The IQR method is less dependent on the assumption of normality and therefore provides a useful complementary perspective when analyzing skewed behavioral features.
In the current experiment, IQR-based analysis was particularly useful for examining extreme values in the risk_score distribution and identifying observations that were statistically unusual relative to the broader dataset.
3.23Feature-level anomaly inspection
Statistical analysis was applied to important engineered behavioral features, including:
- risk_score
- session_duration_min
- login_freq_5
- failed_attempts_rolling
- session_zscore
- failed_zscore
Feature-level inspection provides an interpretable view of how individual behavioral characteristics vary across the dataset. It also helps distinguish between anomalies arising from authentication frequency, failed authentication activity, session behavior, and statistical deviation.
This analysis provides contextual support for the subsequent machine-learning experiments, where the six features are evaluated jointly rather than independently.
3.24Role in the pipeline
The statistical analysis stage serves several purposes within the overall research pipeline:
- provides a descriptive baseline for anomaly analysis;
- validates the behavior of the engineered features;
- identifies statistically unusual observations;
- highlights important behavioral deviations;
- supports interpretation of the synthetic dataset;
- provides temporal context for subsequent machine-learning analysis; and
- helps assess whether the engineered feature representation captures meaningful behavioral variation.
The statistical methods are therefore complementary to the unsupervised machine-learning models rather than replacements for them. The machine-learning stage evaluates the combined feature space using five different anomaly-detection approaches.
3.25Moving average features
To capture temporal trends in user behavior, rolling-window analysis was applied to behavioral variables such as risk score and login frequency.
A fixed window size of w = 5 was used to calculate moving averages. The rolling average reduces short-term fluctuations and provides a local representation of recent behavioral activity.
A deviation measure can then be derived by comparing an observation with its corresponding moving-average baseline:
where Xt represents the observed value at time t, and MAt represents the moving average calculated over the preceding window.
This approach provides a temporal baseline against which sudden increases or decreases in behavioral activity can be examined. For example, a sudden increase in risk score relative to recent observations may indicate an episodic change in behavior.
The moving-average analysis therefore complements the statistical distribution analysis by considering when behavioral deviations occur rather than only how extreme individual feature values are.
The analysis of the synthetic dataset indicates that risk behavior is characterized primarily by episodic spikes rather than strong, consistent seasonal patterns. Moving averages help smooth these short-term fluctuations and make such deviations easier to examine while preserving the temporal structure of the security-event data.
3.26Time-window aggregation
To further capture temporal behavior at a higher level of abstraction, user activity was aggregated into fixed time windows using a resampling approach. Events were grouped into 5-minute intervals, allowing short-term behavioral activity to be examined independently of individual event records.
The aggregation process included metrics such as the total number of login attempts, total number of failed authentication attempts, and mean risk score within each time window. These aggregated measures provide a compact representation of user activity over short time intervals.
This transformation converts event-level security logs into structured time-series observations, making it easier to identify burst-based activity and short-lived behavioral deviations that may not be apparent when individual events are examined in isolation.
Time-window aggregation is particularly useful for examining patterns associated with credential-stuffing bursts, rapid authentication attempts, and concentrated sequences of suspicious activity. By summarizing activity over short periods, the approach reduces the influence of individual-event fluctuations and emphasizes periods of increased behavioral intensity.
3.27Seasonal decomposition
To examine the temporal structure of the dataset, seasonal decomposition was applied to selected time-series features, including risk score and login frequency.
The decomposition separates a time series into three principal components:
- Trend component — represents the longer-term progression of the observed behavior.
- Seasonal component — represents repeating periodic patterns.
- Residual component — represents irregular variation that is not explained by the estimated trend or seasonal component.
Before decomposition, the event data were ordered chronologically and transformed into uniform time intervals to provide a consistent time-series structure. An additive decomposition approach was then used to examine the individual components of the selected signals.
This analysis provides a means of distinguishing relatively predictable temporal behavior from irregular deviations. The results indicate comparatively weak seasonal patterns within the analyzed features. This suggests that the behavioral anomalies represented in the synthetic dataset are more strongly characterized by episodic or burst-based deviations than by consistent periodic patterns.
The residual component is particularly useful for exploratory analysis because it represents variation that remains after accounting for the estimated trend and seasonal components. Such deviations may provide additional contextual information when investigating unusual behavioral activity.
3.28Machine learning methodology
This study applies five unsupervised machine-learning techniques to detect behavioral anomalies in synthetic enterprise security event logs. The objective is to identify observations that deviate from learned behavioral patterns without providing the models with the attack labels during training.
This approach reflects cybersecurity environments in which comprehensive labeled attack datasets may be difficult to obtain. The synthetic dataset provides controlled ground-truth labels for post hoc evaluation, while the machine-learning models operate without using those labels as input.
The machine-learning stage follows data generation, attack injection, preprocessing, feature engineering, and statistical/temporal analysis. The final model feature space consists of six numerical behavioral variables:
- risk_score
- session_duration_min
- login_freq_5
- failed_attempts_rolling
- session_zscore
- failed_zscore
The attack indicators is_attack and attack_type were excluded from the model feature vector and were retained only for subsequent evaluation.
Five complementary anomaly-detection approaches were evaluated:
- 1. Isolation Forest
- 2. Local Outlier Factor (LOF)
- 3. One-Class Support Vector Machine (One-Class SVM)
- 4. Autoencoder
- 5. Gaussian Mixture Model (GMM)
This model diversity allows the study to compare different assumptions about anomalous behavior, including isolation, local density, boundary-based detection, reconstruction error, and probabilistic likelihood.
3.29Isolation Forest implementation
Isolation Forest was selected as the first machine-learning model because of its suitability for unsupervised anomaly detection and its ability to identify observations that are relatively easy to isolate from the rest of the dataset.
The algorithm operates by recursively partitioning observations using randomly selected features and split values. Observations that require fewer partitions to become isolated are considered more anomalous than observations that remain embedded within larger groups.
The model was applied to the six engineered numerical features: risk_score, session_duration_min, login_freq_5, failed_attempts_rolling, session_zscore, and failed_zscore. The attack labels were not provided to the model during training.
The model was configured with a contamination level of 0.05, representing the expected proportion of observations to be classified as anomalous. After fitting, Isolation Forest produced both a binary anomaly classification and a continuous anomaly score for each observation.
3.29.1Model output and evaluation approach
Although Isolation Forest operates in an unsupervised manner, the synthetic dataset contains ground-truth labels identifying normal and injected attack observations. These labels were excluded from model training but retained for post hoc evaluation.
The model predictions were compared with the ground-truth attack indicators using a confusion matrix containing true positives, true negatives, false positives, and false negatives.
The continuous anomaly scores were also used for threshold-independent evaluation through ROC-AUC and PR-AUC analysis. Visualization was used to examine anomaly distributions, feature-space behavior, and temporal patterns.
The canonical evaluation showed that Isolation Forest identified a meaningful proportion of the injected attacks while also generating false positives among legitimate observations. At the selected operating point, it detected 151 of the 370 injected attack observations, corresponding to a recall of 0.4081 and an F1-score of 0.4422.
The results demonstrate that Isolation Forest can capture a substantial portion of the behavioral deviations represented in the current feature space, while also showing that some attack observations remain insufficiently distinguishable from normal behavioral variation.
3.29.2Interpretation of model behavior
The results indicate that Isolation Forest is particularly useful for identifying observations that exhibit relatively strong deviations within the engineered feature space. The model can respond to unusual combinations of elevated risk scores, abnormal session durations, increased login activity, failed authentication behavior, and statistical deviations.
However, not every injected attack necessarily produces sufficiently unusual values across the six-dimensional feature space. This is particularly relevant for attack scenarios whose distinguishing characteristics depend on contextual relationships that are not fully represented by the current features.
Consequently, attacks such as privilege misuse and lateral movement may remain difficult to distinguish when their individual event-level numerical characteristics overlap with legitimate activity.
3.29.3Role in the overall pipeline
Isolation Forest serves as the initial machine-learning benchmark against which the other four approaches are compared. Its role is to establish a baseline for global anomaly detection and to provide an initial assessment of how effectively the engineered feature space represents unusual behavioral activity.
The subsequent application of LOF, One-Class SVM, Autoencoder, and GMM provides additional perspectives on the same anomaly-detection problem. The Isolation Forest results therefore establish an important reference point for evaluating whether alternative modeling assumptions provide stronger detection or ranking performance.
3.30Local Outlier Factor implementation
Local Outlier Factor (LOF) was implemented as a density-based anomaly-detection model to complement the global isolation approach of Isolation Forest.
Unlike Isolation Forest, which attempts to isolate unusual observations through recursive partitioning, LOF evaluates the local density of an observation relative to the densities of its neighboring observations. An observation located in a substantially less dense region than its surrounding neighborhood can therefore receive a higher anomaly score.
The model was applied to the same six engineered numerical features used for Isolation Forest. Using the same feature space provides a consistent basis for comparing the behavior of different anomaly-detection algorithms.
The LOF model was configured with a neighborhood parameter and a contamination level of 0.05. It produced a binary anomaly classification together with a continuous density-based anomaly score.
As with Isolation Forest, the ground-truth attack labels were excluded during model fitting and were used only for post hoc evaluation.
3.30.1Model output and evaluation
LOF predictions were compared against the ground-truth attack indicators using the same evaluation framework applied to the other models.
The canonical results show that LOF detected only a small proportion of the injected attacks. It identified 21 of the 370 attack observations, producing:
- Precision: 0.0671
- Recall: 0.0568
- F1-score: 0.0615
- Accuracy: 0.8973
The model also generated 292 false positives, indicating that a considerable number of legitimate observations were classified as anomalous under the selected operating point.
The threshold-independent results were similarly weak, with a ROC-AUC of 0.5622 and a PR-AUC of 0.1028.
3.30.2Interpretation of model behavior
The observed performance suggests that local-density analysis was less well aligned with the attack patterns represented in the current synthetic dataset.
Many of the simulated attack observations appear to be characterized by global deviations in the engineered feature space rather than by sufficiently isolated local-density differences.
For example, an observation may exhibit a high risk score or unusual authentication behavior but still have neighboring observations with sufficiently similar feature values that its local density does not differ substantially from its surrounding region.
This can reduce LOF’s ability to identify attacks that are globally unusual but not sufficiently different from their immediate neighbors. The results therefore indicate that the neighborhood-based assumptions of LOF are less suitable for the current feature representation than the global isolation assumptions used by Isolation Forest.
3.30.3Role in the overall pipeline
LOF provides an important comparative perspective within the experimental design by testing whether local-density relationships provide useful anomaly signals in the synthetic security-event dataset.
Its relatively weak performance demonstrates that the effectiveness of an anomaly-detection algorithm depends not only on the presence of anomalous observations but also on how those observations are represented within the feature space. The LOF results therefore reinforce the importance of matching model assumptions to the structural characteristics of the behavioral data.
The analysis also provides a basis for comparing LOF with the subsequent One-Class SVM, Autoencoder, and GMM approaches, which use different mechanisms for representing abnormal behavior.
3.31One-Class Support Vector Machine implementation
One-Class Support Vector Machine (One-Class SVM) was implemented as a boundary-based anomaly-detection model to extend the comparative analysis of unsupervised learning techniques. Unlike Isolation Forest and Local Outlier Factor, which rely primarily on isolation and local-density relationships, respectively, One-Class SVM learns a decision boundary representing the region of the feature space associated with normal observations. Observations falling outside or sufficiently distant from this learned boundary are classified as anomalous.
The model was applied to the same six engineered numerical features used by the other models. Using a common feature representation ensured consistency across the experimental models and enabled direct comparison of their anomaly-detection performance.
The One-Class SVM was configured using a radial basis function (RBF) kernel to allow the model to represent non-linear relationships within the engineered feature space. The nu parameter was used to control the expected proportion of anomalies and the number of support vectors.
After training, the model generated a binary anomaly classification and a continuous decision score representing the relative position of each observation with respect to the learned normal-behavior boundary.
3.31.1Model output and evaluation
As with the other models, One-Class SVM was trained without access to the synthetic ground-truth attack labels. The is_attack and attack_type variables were retained only for post hoc evaluation.
The canonical evaluation produced the following results:
- True positives (TP): 85
- True negatives (TN): 5,646
- False positives (FP): 228
- False negatives (FN): 285
- Precision: 0.2716
- Recall: 0.2297
- F1-score: 0.2489
- Accuracy: 0.9178
- ROC-AUC: 0.6484
- PR-AUC: 0.2209
The model therefore detected 85 of the 370 injected attack observations, while 285 attack observations remained classified as normal.
The results indicate that One-Class SVM was able to identify some observations that deviated from the learned normal-behavior boundary. However, a substantial proportion of the injected attacks remained within or sufficiently close to the learned normal region.
3.31.2Interpretation of model behavior
The observed results indicate that One-Class SVM provides a moderate-to-low level of anomaly-detection capability within the current feature space.
The model was more effective than LOF at the selected operating point, achieving an F1-score of 0.2489 compared with 0.0615 for LOF. However, its performance remained below that of Isolation Forest and GMM, which achieved F1-scores of 0.4422 and 0.4305, respectively.
The model’s ROC-AUC of 0.6484 indicates that its continuous decision scores contained some useful information for ranking attack observations above normal observations. However, the substantially lower recall at the selected operating point indicates that many attack observations were not sufficiently separated from normal behavior by the learned decision boundary.
The presence of 228 false positives also demonstrates that some legitimate observations fell outside the learned representation of typical behavior.
These findings suggest that boundary-based detection can capture certain behavioral deviations but may be limited when attack and legitimate observations overlap within the engineered feature space.
3.31.3Role in the overall pipeline
The One-Class SVM model provides a boundary-based perspective within the comparative anomaly-detection framework. Its inclusion allows the study to evaluate whether defining a learned boundary around normal observations provides useful detection capability compared with isolation-based, density-based, reconstruction-based, and probabilistic approaches.
The results further demonstrate that model performance depends on the relationship between the algorithm’s underlying assumptions and the structure of the engineered feature space.
The One-Class SVM results therefore contribute to the final comparative evaluation by providing evidence regarding the effectiveness and limitations of boundary-based unsupervised anomaly detection for the simulated enterprise security environment.
3.32Autoencoder implementation
An autoencoder-based anomaly-detection model was implemented to examine whether non-linear representation learning and reconstruction error could capture behavioral deviations within the engineered feature space.
Unlike the previous approaches, which rely on isolation, local density, or a learned decision boundary, the autoencoder learns a compressed representation of the input data and attempts to reconstruct the original observations. Observations that produce relatively high reconstruction errors can be considered behaviorally unusual under the learned representation.
The autoencoder consists of two principal components:
- an encoder, which maps the input features into a lower-dimensional latent representation; and
- a decoder, which reconstructs the original feature representation from the latent representation.
The network was trained using a reconstruction objective based on the difference between the original input and reconstructed output. The model used the same six engineered numerical features applied throughout the machine-learning experiment.
Before training, the numerical features were standardized to provide a consistent scale across variables and support stable neural-network optimization.
The model was trained using mini-batch gradient-based optimization for a fixed number of training epochs. After training, reconstruction error was calculated for each observation. A selected upper-quantile threshold of the reconstruction-error distribution was then used to produce the binary anomaly classification.
3.32.1Model output and evaluation approach
The Autoencoder was trained without using is_attack or attack_type as training inputs. These labels were retained exclusively for post hoc evaluation.
The canonical evaluation produced:
- True positives (TP): 60
- True negatives (TN): 5,621
- False positives (FP): 253
- False negatives (FN): 310
- Precision: 0.1917
- Recall: 0.1622
- F1-score: 0.1757
- Accuracy: 0.9098
- ROC-AUC: 0.7385
- PR-AUC: 0.1712
The model detected 60 of the 370 injected attack observations, while 310 attack observations were not identified at the selected operating point.
The results indicate that reconstruction error contained useful information about behavioral differences, as reflected by the ROC-AUC of 0.7385. However, this ranking capability did not translate into equally strong performance at the selected classification threshold.
3.32.2Interpretation of model behavior
The results suggest that the Autoencoder captured some meaningful structure within the engineered behavioral feature space. Its ROC-AUC of 0.7385 indicates that the continuous reconstruction-error scores provided useful discrimination between attack and normal observations across different thresholds.
However, its fixed-threshold F1-score of 0.1757 was substantially lower than the scores obtained by Isolation Forest (0.4422), GMM (0.4305), and One-Class SVM (0.2489).
The model detected only 60 of the 370 injected attack observations, while producing 253 false positives. This indicates that elevated reconstruction error was not exclusively associated with malicious behavior. Legitimate observations exhibiting unusual combinations of behavioral features could also produce relatively high reconstruction errors.
Conversely, some injected attacks may have produced feature patterns sufficiently similar to observations represented in the learned reconstruction space, resulting in comparatively low reconstruction errors and consequently being classified as normal.
These findings demonstrate that non-linear representation learning can capture useful behavioral information, but the effectiveness of reconstruction-based anomaly detection remains dependent on the quality and discriminative capability of the input features.
3.32.3Role in the overall pipeline
The Autoencoder provides a neural reconstruction-based perspective within the comparative anomaly-detection framework. Its inclusion allows the study to evaluate whether non-linear representation learning provides advantages over classical unsupervised approaches using the same engineered feature space.
The results demonstrate that the Autoencoder achieved meaningful threshold-independent discrimination according to ROC-AUC, but its fixed-threshold and precision-recall performance was comparatively weaker.
Therefore, the results do not support describing the Autoencoder as the strongest model in the experiment. Instead, the Autoencoder provides an important experimental comparison by demonstrating that useful reconstruction-based anomaly signals can exist even when they do not translate into the strongest classification or precision-recall performance.
The Autoencoder therefore contributes to the broader objective of determining how different unsupervised modeling assumptions respond to behavioral anomalies in synthetic enterprise security event logs.
3.33Gaussian Mixture Model (GMM) implementation
A Gaussian Mixture Model (GMM)-based anomaly detection model was implemented to examine whether probabilistic density estimation could capture behavioral deviations within the engineered feature space.
Unlike the other approaches, which rely on isolation, local density, decision boundaries, or reconstruction error, the GMM models the feature space as a mixture of Gaussian probability distributions. Each Gaussian component represents a region of the learned data distribution, allowing observations to be evaluated according to their likelihood under the fitted mixture model.
The GMM consists of three principal parameters for each mixture component:
- a mixture weight, which represents the relative contribution of the component to the overall distribution;
- a mean vector, which represents the center of the component; and
- a covariance matrix, which represents the variance and relationships among the features within the component.
For an observation x, the probability density of the mixture can be represented as given in (1), where K represents the number of Gaussian components, πk represents the mixture weight, μk represents the mean vector, Σk represents the covariance matrix, and N(x | μk, Σk) represents the multivariate Gaussian density associated with component k.
In this study, a two-component Gaussian Mixture Model with full covariance was applied to the engineered behavioral feature space. The model used the same six engineered numerical features applied throughout the machine-learning experiment: risk_score, session_duration_min, login_freq_5, failed_attempts_rolling, session_zscore, and failed_zscore.
The GMM was trained without using the attack labels. After fitting the mixture distribution, a probability-based anomaly score was calculated for each observation using its negative log-likelihood under the learned distribution. Higher negative log-likelihood values indicate lower probability under the fitted model and therefore greater potential anomalousness.
3.33.1Model output and evaluation approach
The GMM was trained without using is_attack or attack_type as model inputs. These labels were retained exclusively for post hoc evaluation.
The canonical evaluation produced:
- True positives (TP): 147
- True negatives (TN): 5,708
- False positives (FP): 166
- False negatives (FN): 223
- Precision: 0.4696
- Recall: 0.3973
- F1-score: 0.4305
- Accuracy: 0.9377
- ROC-AUC: 0.8227
- PR-AUC: 0.3712
The model detected 147 of the 370 injected attack observations, while 223 attack observations were not identified at the selected operating point.
The ROC-AUC of 0.8227 represents the strongest threshold-independent ranking performance among the five evaluated models. However, its PR-AUC of 0.3712 and fixed-threshold F1-score of 0.4305 were slightly lower than the corresponding Isolation Forest values.
3.33.2Interpretation of model behavior
The results suggest that the GMM captured meaningful probabilistic structure within the engineered behavioral feature space. Its ROC-AUC of 0.8227 indicates that the continuous negative log-likelihood scores provided strong discrimination between attack and normal observations across different thresholds. This was the highest ROC-AUC obtained among the evaluated models.
The GMM also produced the second-highest fixed-threshold F1-score (0.4305), closely following Isolation Forest at 0.4422.
The model detected 147 of the 370 injected attack observations while producing 166 false positives. This indicates that observations with low likelihood under the learned Gaussian mixture were not exclusively malicious. Legitimate observations exhibiting unusual combinations of behavioral features could also occupy low-density regions of the learned distribution.
Conversely, some injected attacks may have produced behavioral patterns sufficiently similar to regions represented by the Gaussian components, resulting in relatively higher likelihood and consequently being classified as normal at the selected operating point.
The results therefore indicate that probabilistic density estimation can capture useful behavioral structure even when normal enterprise activity contains multiple overlapping patterns. However, the effectiveness of GMM-based anomaly detection remains dependent on how well the selected feature representation captures the behavioral characteristics of the simulated attacks.
3.33.3Role in the overall pipeline
The GMM provides a probabilistic density-estimation perspective within the comparative anomaly-detection framework. Its inclusion allows the study to evaluate whether modeling the probability distribution of behavioral observations provides advantages over:
- isolation-based detection using Isolation Forest;
- local-density analysis using LOF;
- boundary-based detection using One-Class SVM; and
- reconstruction-based detection using the Autoencoder.
The results demonstrate that the GMM provided the strongest threshold-independent discrimination, achieving a ROC-AUC of 0.8227, while also producing competitive fixed-threshold performance with an F1-score of 0.4305.
However, Isolation Forest achieved a slightly higher F1-score (0.4422) and a higher PR-AUC (0.4608) than GMM (0.3712). Therefore, the results do not support describing GMM as the universally strongest model in the experiment. Instead, GMM demonstrates the value of a probabilistic modeling perspective: it was particularly effective at ranking observations according to their conformity with the learned behavioral distribution, while Isolation Forest provided stronger performance under the selected fixed operating point and precision-recall evaluation.
The GMM therefore contributes an important complementary perspective to the overall experimental framework by demonstrating how probabilistic density estimation can identify behavioral observations that are less consistent with the learned distribution of enterprise security activity.
4Results and discussion
4.1Statistical analysis results
The statistical and temporal analysis provided an initial assessment of the behavioral characteristics represented by the engineered security-event features. The analysis showed that the feature space contains meaningful variation between routine activity and observations exhibiting unusual behavioral characteristics.
Distribution analysis indicated that several important variables, particularly risk_score, session duration, and login-frequency measures, do not follow simple uniform distributions. The presence of skewness and extended tails indicates that a relatively small proportion of observations exhibit substantially different behavioral characteristics from the majority of the dataset.
The distribution of the composite risk_score was particularly informative. Most observations were concentrated within a relatively low-risk region, while a smaller number of observations produced substantially higher values. This pattern indicates that the composite score successfully combines several behavioral indicators into a single interpretable measure of behavioral risk.
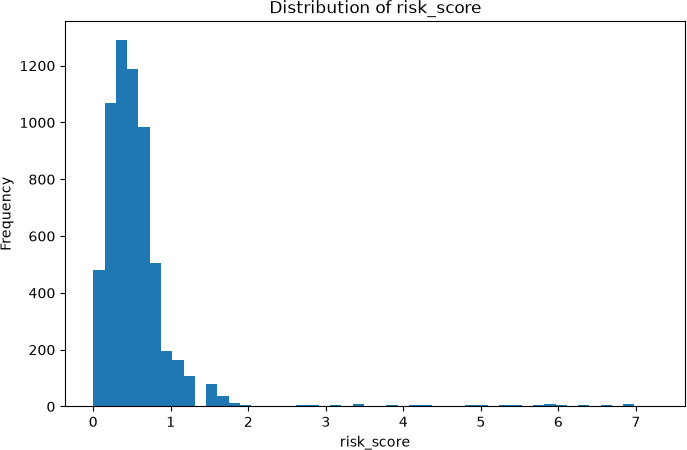
Feature-level inspection further showed that elevated risk values were frequently associated with increased failed authentication activity, unusual session behavior, and other behavioral deviations. These observations support the use of derived features rather than relying exclusively on raw event attributes.
The temporal analysis provided additional insight into how behavioral deviations develop over time. Moving-average analysis reduced short-term fluctuations and made larger changes in variables such as risk score and login frequency easier to examine. Similarly, five-minute time-window aggregation provided a compact representation of activity intensity and made short bursts of authentication activity more visible.
Seasonal decomposition indicated comparatively weak periodic structure within the analyzed signals. Although trend and residual components were observable, the seasonal component was limited. This suggests that the behavioral anomalies represented in the synthetic dataset are predominantly episodic or burst-driven rather than consistently periodic.
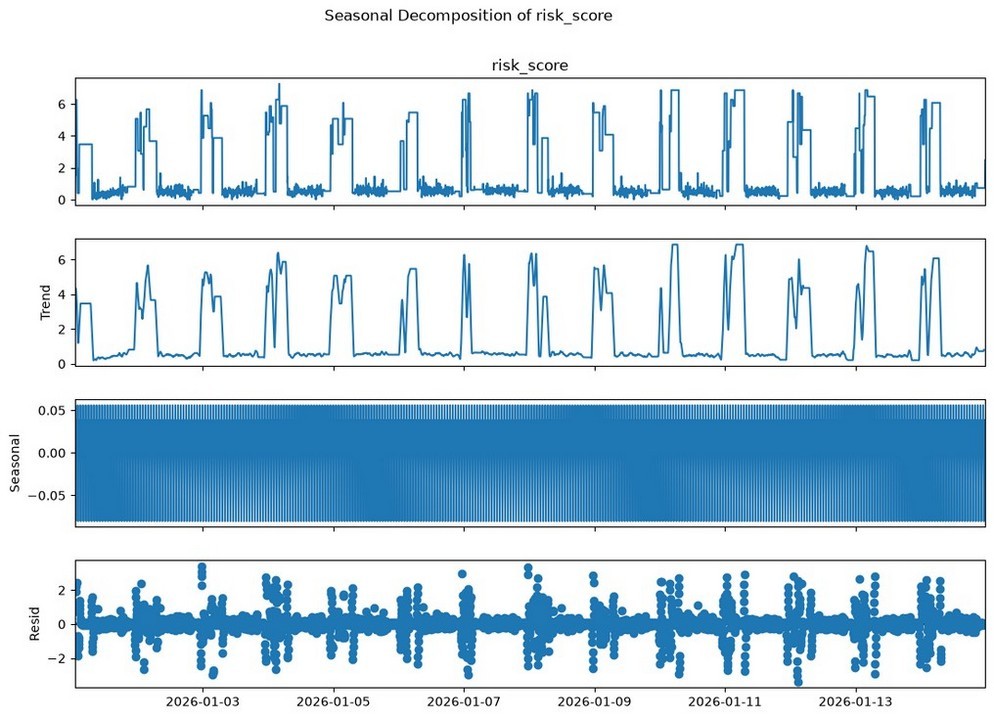
Overall, the statistical and temporal analysis demonstrates that the engineered features provide useful behavioral information for subsequent machine-learning analysis. However, the analysis also indicates that not all attack scenarios are equally well represented by the current feature space. Authentication-focused attacks produce more pronounced changes in the available features, whereas attacks involving privilege relationships or multi-resource movement may require richer contextual features.
4.2Model performance evaluation
The machine-learning evaluation was performed using the synthetic ground-truth labels that were retained exclusively for post hoc assessment. Although all five models were trained without using the attack labels, the known labels enabled quantitative evaluation of their ability to identify the injected attack observations.
The final experiment evaluated five unsupervised approaches: Isolation Forest, Local Outlier Factor (LOF), One-Class SVM, Autoencoder, and Gaussian Mixture Model (GMM). All models operated on the same six engineered numerical features, providing a consistent basis for comparison.
The evaluation considered fixed-threshold classification performance using precision, recall, F1-score, and accuracy, together with threshold-independent ROC-AUC and PR-AUC measures.
| Model | Precision | Recall | F1-score | Accuracy | ROC-AUC | PR-AUC |
|---|---|---|---|---|---|---|
| Isolation Forest | 0.4824 | 0.4081 | 0.4422 | 0.9390 | 0.7574 | 0.4608 |
| GMM | 0.4696 | 0.3973 | 0.4305 | 0.9377 | 0.8227 | 0.3712 |
| One-Class SVM | 0.2716 | 0.2297 | 0.2489 | 0.9178 | 0.6484 | 0.2209 |
| Autoencoder | 0.1917 | 0.1622 | 0.1757 | 0.9098 | 0.7385 | 0.1712 |
| LOF | 0.0671 | 0.0568 | 0.0615 | 0.8973 | 0.5622 | 0.1028 |
The results demonstrate substantial differences between the five approaches.
Isolation Forest achieved the strongest fixed-threshold performance, producing the highest precision, recall, F1-score, and accuracy. Its F1-score of 0.4422 represents the strongest balance between precision and recall at the selected operating point.
GMM produced a closely competitive fixed-threshold result, with an F1-score of 0.4305. However, GMM achieved the highest ROC-AUC of 0.8227, indicating that its continuous anomaly scores provided the strongest ranking performance across varying thresholds according to the ROC criterion.
One-Class SVM produced intermediate performance, with an F1-score of 0.2489 and ROC-AUC of 0.6484.
The Autoencoder achieved a ROC-AUC of 0.7385, indicating meaningful threshold-independent discrimination. However, its fixed-threshold F1-score of 0.1757 and PR-AUC of 0.1712 were substantially lower than those of Isolation Forest and GMM.
LOF produced the weakest overall results, with an F1-score of 0.0615, ROC-AUC of 0.5622, and PR-AUC of 0.1028.
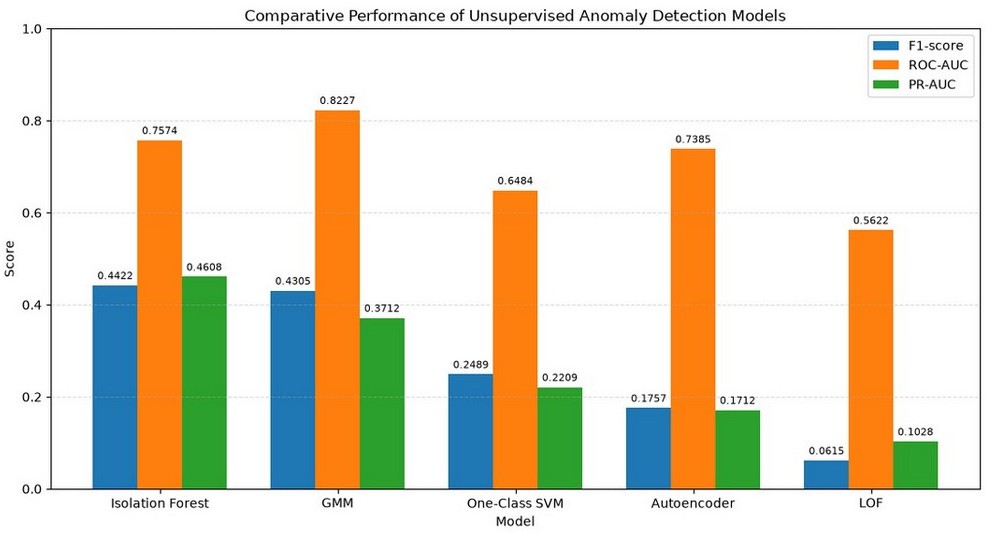
These results demonstrate that no single algorithm dominates across every evaluation criterion. Instead, model performance depends on the metric and operating condition used for assessment.
4.3Confusion matrix analysis
Confusion matrices were used to examine how each model’s fixed operating point translated into correctly and incorrectly classified observations.
Isolation Forest produced TP = 151, TN = 5,712, FP = 162, and FN = 219. GMM produced TP = 147, TN = 5,708, FP = 166, and FN = 223. One-Class SVM produced TP = 85, TN = 5,646, FP = 228, and FN = 285. The Autoencoder produced TP = 60, TN = 5,621, FP = 253, and FN = 310. LOF produced TP = 21, TN = 5,582, FP = 292, and FN = 349.
The confusion matrices show that Isolation Forest detected the largest number of attack observations at the selected operating point while also producing fewer false positives than GMM, One-Class SVM, Autoencoder, and LOF.
GMM produced a very similar classification profile, detecting 147 attack observations compared with 151 for Isolation Forest.
The relatively large number of false negatives across all models demonstrates that many injected attack observations were not sufficiently distinguishable from normal activity within the current feature representation.
The false-positive results are also important. Legitimate observations can exhibit unusual behavioral characteristics, meaning that statistical or model-based unusualness does not necessarily imply malicious activity.
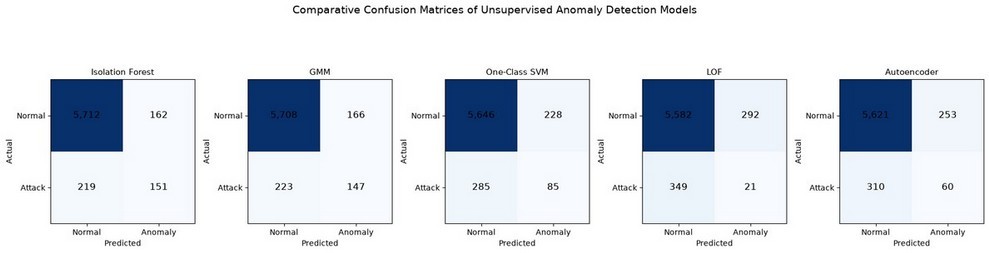
4.4ROC-AUC analysis
ROC-AUC analysis was used to evaluate the continuous anomaly scores produced by the five models across different decision thresholds.
The anomaly scores were transformed where necessary so that higher values consistently represented greater anomalousness. This enabled the models to be evaluated using a common ROC framework despite differences in their native scoring conventions.
The results were: GMM, 0.8227; Isolation Forest, 0.7574; Autoencoder, 0.7385; One-Class SVM, 0.6484; and LOF, 0.5622.
GMM achieved the highest ROC-AUC, indicating that its continuous probability-based anomaly score provided the strongest overall ranking of attack observations relative to normal observations according to the ROC criterion.
Isolation Forest ranked second with a ROC-AUC of 0.7574, demonstrating strong score-based discrimination.
The Autoencoder achieved a ROC-AUC of 0.7385. This indicates that reconstruction error contained meaningful information about the distinction between normal and attack observations, despite the model’s weaker fixed-threshold F1 performance.
One-Class SVM achieved 0.6484, indicating moderate ranking capability. LOF produced the lowest ROC-AUC at 0.5622, indicating comparatively weak separation between attack and normal observations.
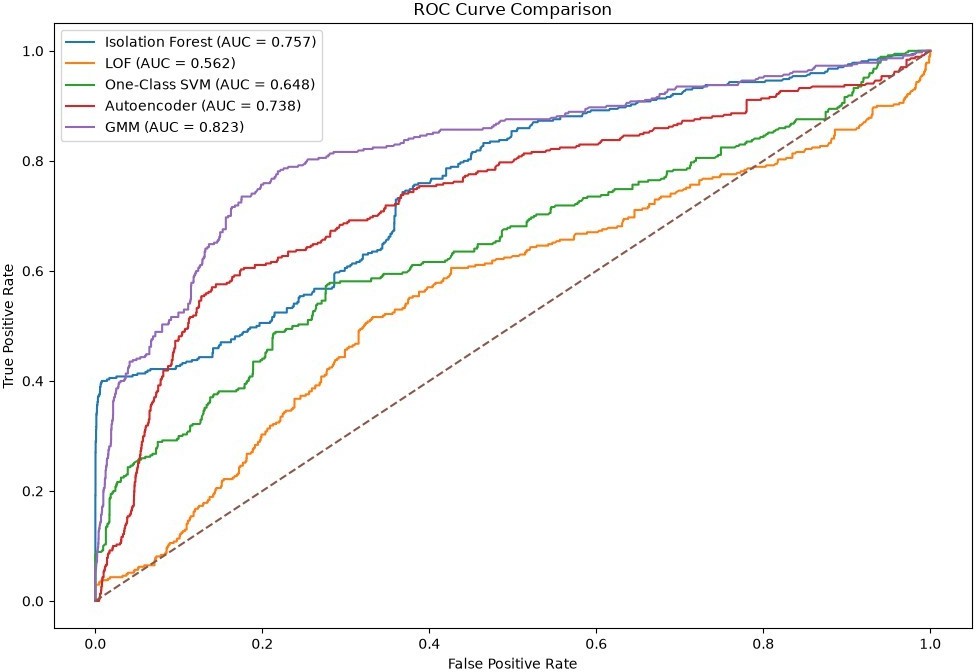
These results differ from the fixed-threshold F1 ranking. Isolation Forest achieved the highest F1-score, whereas GMM achieved the highest ROC-AUC. This difference demonstrates that the choice of evaluation metric can influence the apparent ranking of anomaly-detection methods.
4.5Precision-recall analysis
Because the dataset contains substantially more normal observations than attack observations, precision-recall analysis provides an important complementary evaluation of model performance.
The PR-AUC results were: Isolation Forest, 0.4608; GMM, 0.3712; One-Class SVM, 0.2209; Autoencoder, 0.1712; and LOF, 0.1028.
Isolation Forest achieved the highest PR-AUC of 0.4608, indicating the strongest precision-recall ranking performance across different thresholds.
GMM ranked second with a PR-AUC of 0.3712. Although GMM produced the highest ROC-AUC, its PR-AUC was lower than Isolation Forest’s.
This distinction is important because ROC-AUC and PR-AUC measure different aspects of ranking performance. The ROC-AUC result favors GMM, while the precision-recall analysis favors Isolation Forest.
One-Class SVM achieved a PR-AUC of 0.2209, while the Autoencoder achieved 0.1712. LOF recorded the lowest PR-AUC at 0.1028.
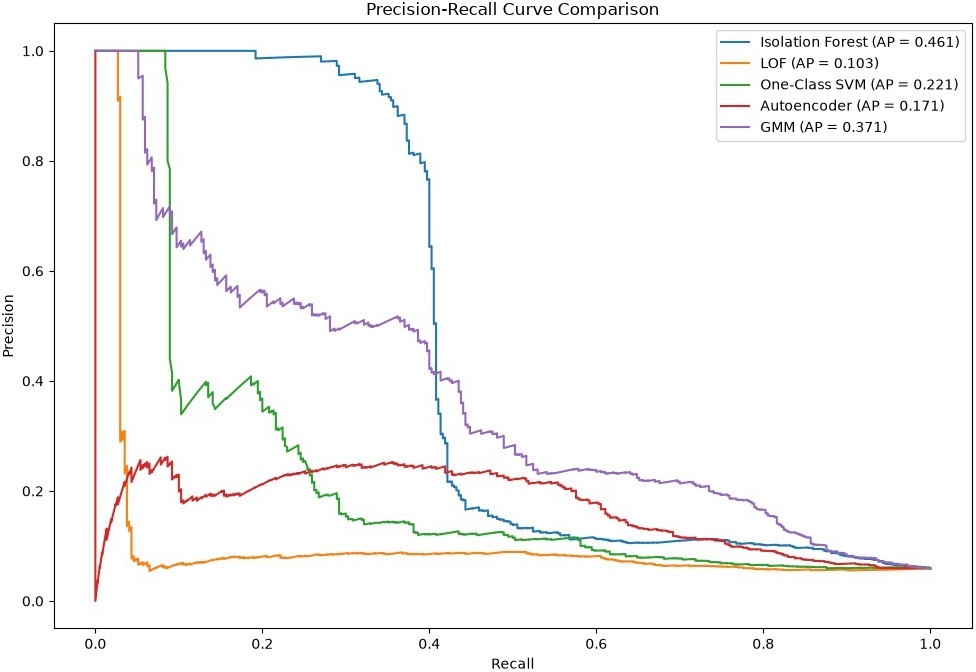
The results therefore reinforce the conclusion that Isolation Forest provides the strongest overall precision-recall behavior in the current experiment, while GMM provides the strongest ROC-based ranking.
4.6Visualization-based analysis
To complement the numerical evaluation, visualization techniques were used to examine how anomalous observations were distributed across time, users, and the engineered feature space. These visualizations provide contextual information that cannot be obtained from aggregate evaluation metrics alone.
4.6.1Temporal anomaly distribution
Temporal visualization was used to examine how anomalous observations and anomaly scores changed over the observation period.
The results indicate that unusual activity is not uniformly distributed across time. Instead, elevated behavioral activity appears in localized periods or bursts.
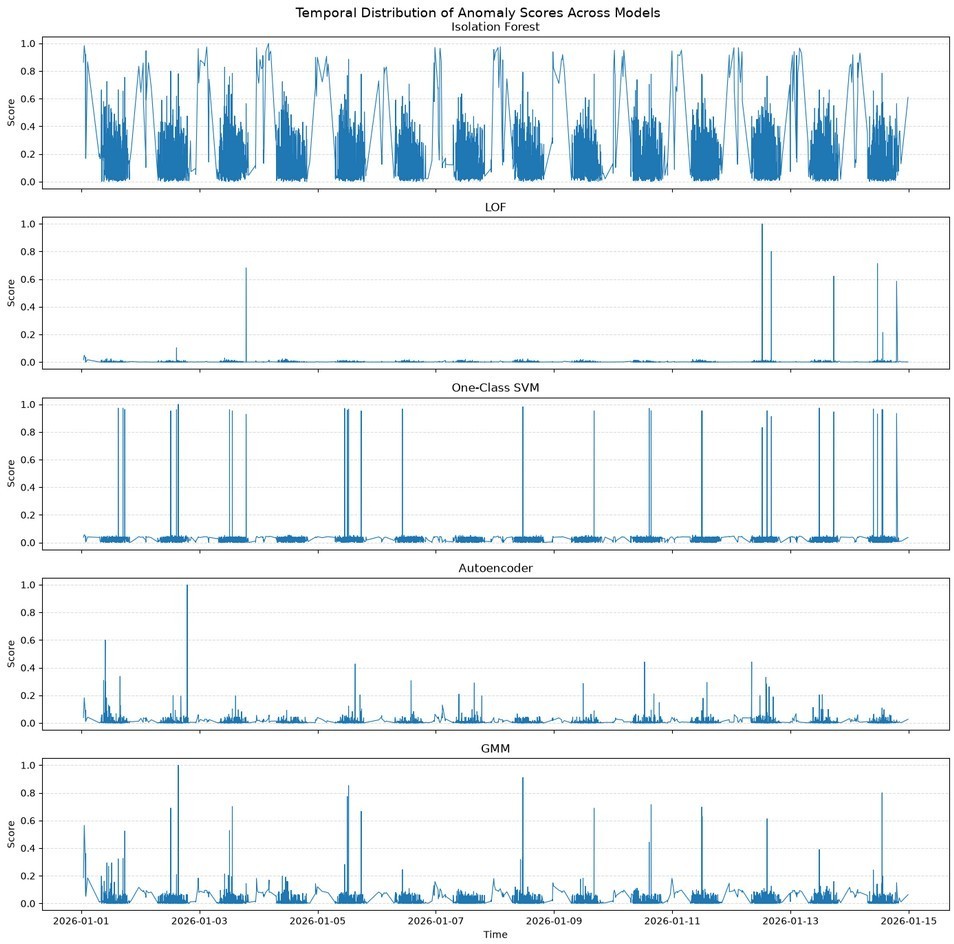
This pattern is consistent with the synthetic attack design, particularly scenarios involving repeated authentication attempts and rapid sequences of activity.
However, temporal concentration should not automatically be interpreted as evidence of malicious behavior because legitimate activity can also occur in bursts. The temporal visualizations therefore provide contextual information rather than definitive attack classification.
4.7User-based anomaly patterns
User-level aggregation was used to examine whether anomalous activity was distributed evenly across the simulated user population or concentrated among particular accounts.
The analysis provides a higher-level view of behavioral irregularity by aggregating observations associated with individual users.
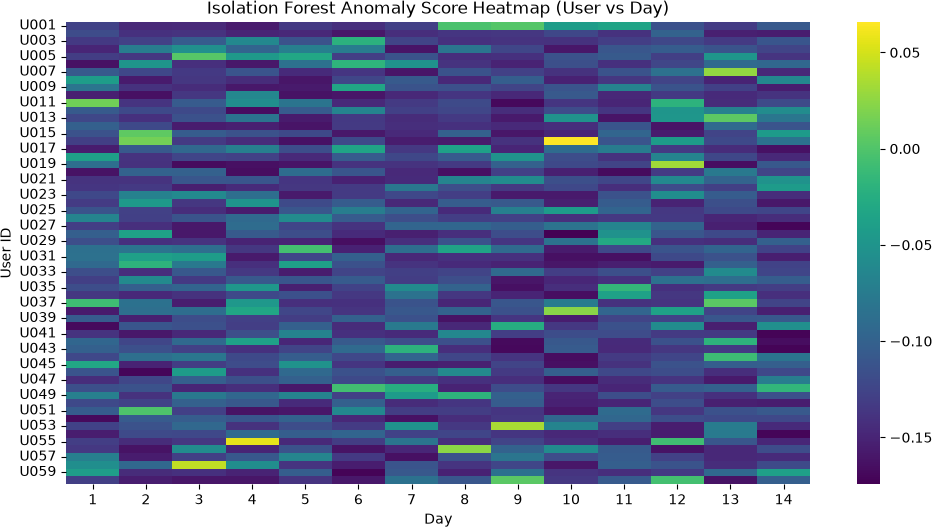
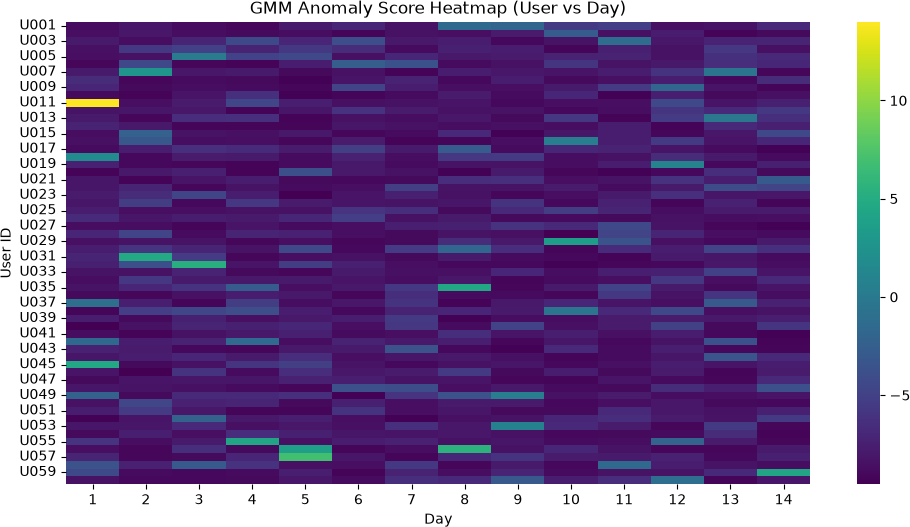
Where concentrations of elevated anomaly scores occur, these observations may indicate users whose activity differs substantially from the broader behavioral population.
However, such patterns should be interpreted cautiously because a high anomaly score does not necessarily indicate compromise. A legitimate user may naturally exhibit unusual activity because of their role, working schedule, or access requirements.
The user-level analysis therefore demonstrates the value of contextual behavioral analysis while also highlighting the importance of distinguishing statistical unusualness from confirmed malicious activity.
4.8Feature-space visualization
Dimensionality reduction was used to visualize the structure of the six-dimensional engineered feature space in two dimensions. The purpose of this analysis was not to establish formal cluster membership but to provide an intuitive representation of the relationships among observations.
The resulting projection indicates that the dataset contains overlapping behavioral regions rather than perfectly separated normal and attack clusters. This is consistent with the quantitative results, which show that all five models miss a substantial proportion of attack observations.
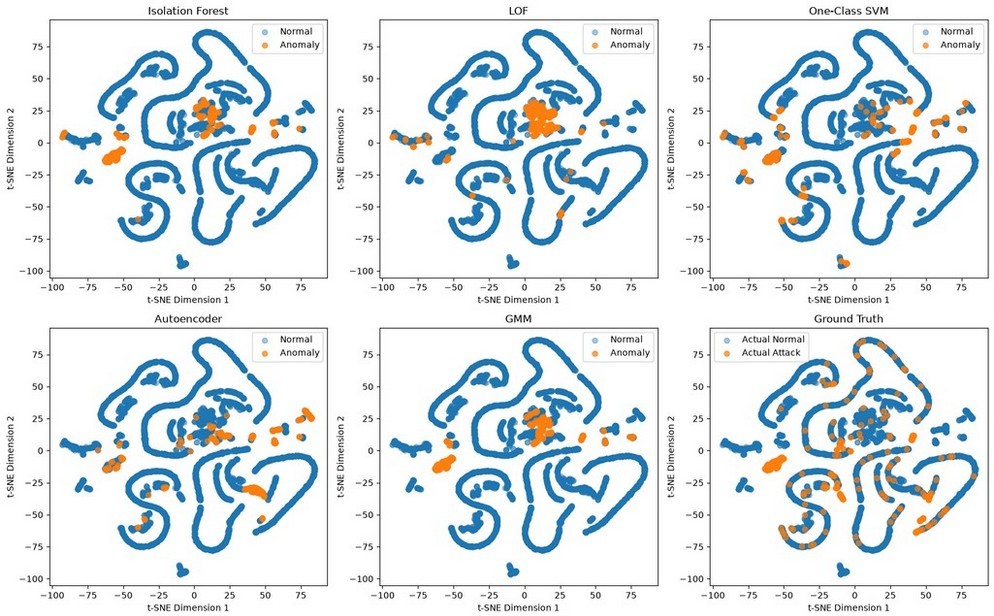
The overlap also demonstrates why behavioral anomaly detection is challenging. Some attack observations exhibit sufficiently unusual characteristics to be identified, while others occupy regions of the feature space that resemble legitimate activity.
The visualization therefore supports the conclusion that the attack scenarios are not uniformly separable using the current six-feature representation.
Model predictions can also be visualized on the projected feature space to examine where each algorithm tends to classify observations as anomalous. Such visualizations should be interpreted as projections rather than direct representations of the full six-dimensional model space.
4.9Interpretation of visualization results
The combined visualizations reveal several characteristics of the synthetic security-event dataset.
First, anomalous activity tends to occur in localized periods rather than being uniformly distributed across the observation period.
Second, some users exhibit higher concentrations of unusual activity than others, demonstrating the importance of user-level behavioral context.
Third, the feature-space projection shows substantial overlap between normal and anomalous observations. This indicates that not all attacks are represented as clearly isolated points in the engineered feature space.
These observations help explain the differences in model performance. Algorithms that are effective at identifying strong global deviations may perform well when attack observations occupy unusual regions, while methods based on local density or learned boundaries may respond differently when normal and attack observations overlap.
The visual analysis therefore complements rather than replaces the quantitative evaluation.
4.10Silhouette score analysis
Silhouette analysis was used as a supplementary measure of the separation produced by the model-predicted normal and anomalous groups.
The silhouette coefficient ranges from −1 to 1. Higher values generally indicate that observations are more strongly separated from observations assigned to other groups, while values near zero indicate substantial overlap.
| Model | Silhouette Score |
|---|---|
| Isolation Forest | 0.6516 |
| GMM | 0.6502 |
| One-Class SVM | 0.4867 |
| LOF | 0.4221 |
| Autoencoder | 0.3254 |
Isolation Forest produced the highest silhouette score of 0.6516, closely followed by GMM with 0.6502. This indicates that the normal and anomalous observations produced by these two models exhibited comparatively stronger geometric separation in the engineered feature space.
One-Class SVM achieved a silhouette score of 0.4867, indicating a moderate degree of separation. LOF produced a lower score of 0.4221, while the Autoencoder recorded the lowest silhouette score at 0.3254, suggesting greater overlap between its predicted normal and anomalous groups.
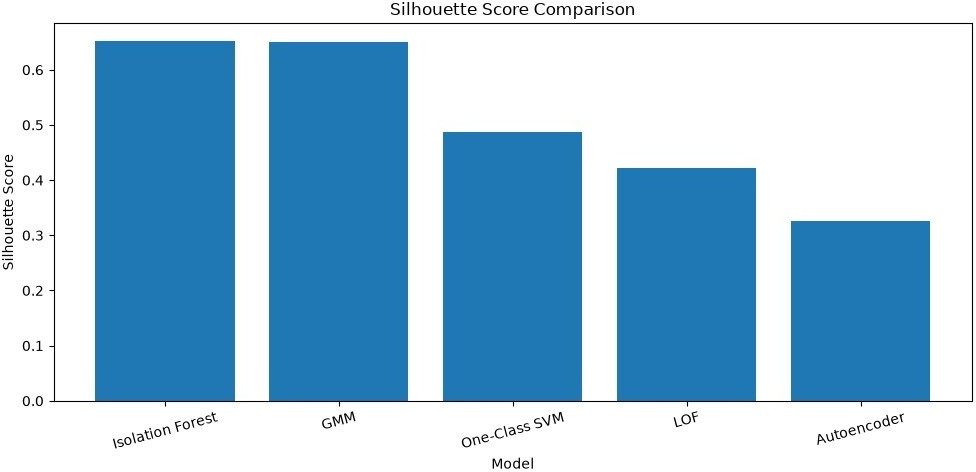
The close silhouette scores of Isolation Forest and GMM are particularly notable. Although GMM achieved the highest ROC-AUC (0.8227), Isolation Forest produced a slightly higher silhouette score. This demonstrates that geometric separation in feature space and threshold-independent detection performance do not necessarily produce identical model rankings.
However, silhouette scores should be interpreted cautiously in this study because the normal/anomalous labels used for the calculation are model-generated predictions rather than independently established clusters. Consequently, silhouette analysis provides information about the geometric separation associated with each model’s predictions, but it should not be treated as a direct measure of anomaly-detection accuracy The results should therefore be considered supplementary to the precision, recall, F1-score, ROC-AUC, and PR-AUC evaluations.
4.11Sensitivity analysis
Sensitivity analysis was used to examine how changes in the assumed anomaly proportion affect model performance.
The contamination parameter influences the number of observations that an anomaly-detection model classifies as anomalous. Varying this parameter therefore provides insight into how model behavior changes under different assumptions about anomaly prevalence.
F1-score and recall were selected as the principal measures because they provide complementary information about detection effectiveness. Recall measures the proportion of injected attacks detected, while F1-score balances precision and recall.
4.11.1F1-score sensitivity
The F1-score sensitivity analysis demonstrates that model performance varies with the selected contamination level and that increasing the proportion of observations classified as anomalous does not necessarily improve the balance between precision and recall.
Isolation Forest showed the strongest F1-score performance across the evaluated contamination levels. Its F1-score increased from approximately 0.30 at 1% contamination to a peak of approximately 0.53 at 3%, before declining as the contamination level increased further. This indicates that although higher contamination continued to produce a slight increase in recall, the additional observations classified as anomalous also increased false-positive effects, reducing the overall F1-score.
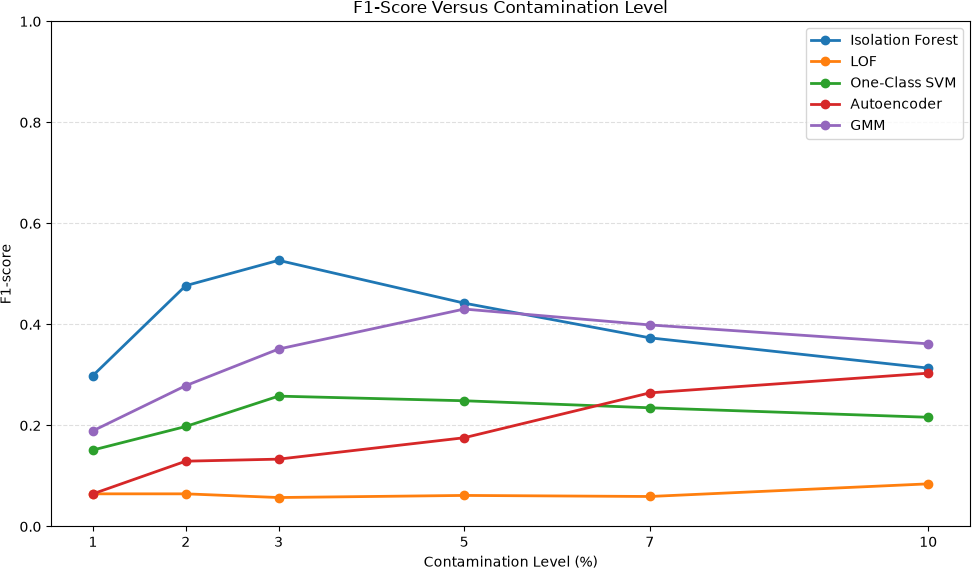
GMM demonstrated a similar pattern but reached its highest F1-score at approximately 5% contamination, with an F1-score of about 0.43. Its performance declined slightly at higher contamination levels, although it remained the second strongest model across the evaluated settings.
One-Class SVM reached its highest F1-score at approximately 3% contamination, after which its F1-score gradually declined. Autoencoder, in contrast, showed a generally increasing F1-score as the contamination level increased, reaching approximately 0.30 at 10% contamination. Despite this improvement, its F1-score remained below those of Isolation Forest and GMM across the evaluated range.
LOF remained comparatively weak throughout the sensitivity analysis, with F1-scores remaining close to the lower end of the observed range. This is consistent with its weak performance in the canonical fixed-threshold evaluation.
Overall, the results demonstrate that the contamination level can materially influence the apparent effectiveness of an anomaly-detection model. The relationship is not uniformly monotonic: increasing contamination may improve recall, but it can also introduce additional false positives and consequently reduce F1-score. Therefore, the contamination level should be considered an important operating parameter when interpreting unsupervised anomaly-detection performance.
4.12Recall sensitivity
The recall sensitivity analysis shows that increasing the contamination level generally increases the proportion of injected attack observations detected by the models.
Isolation Forest achieved the highest recall across most of the evaluated contamination levels, increasing from approximately 0.17 at 1% contamination to approximately 0.42 at 10%. Its recall increased rapidly at lower contamination levels before approaching a relatively stable range at higher levels.
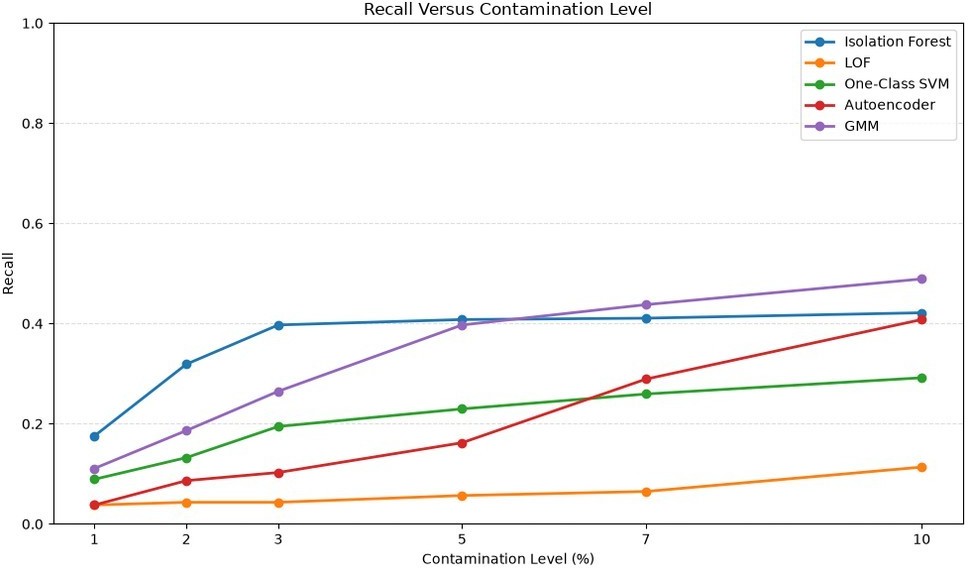
GMM also demonstrated a consistent increase in recall, rising from approximately 0.11 at 1% contamination to approximately 0.49 at 10%. At the highest contamination level evaluated, GMM produced the highest recall among the five models.
One-Class SVM showed a gradual improvement in recall as contamination increased, reaching approximately 0.29 at 10%. The Autoencoder exhibited a particularly noticeable increase at higher contamination levels, rising from approximately 0.04 at 1% to approximately 0.41 at 10%.
LOF remained the weakest model in terms of recall throughout the sensitivity analysis. Its recall increased only modestly, reaching approximately 0.11 at 10% contamination.
These results demonstrate the trade-off between contamination level and detection sensitivity. Increasing contamination generally allows more observations to be classified as anomalous, which can increase recall. However, the corresponding increase in false positives can prevent F1-score from improving proportionally. This explains why the contamination level that produces the highest recall is not necessarily the contamination level that produces the highest F1-score.
4.13Overall interpretation of results
The combined results demonstrate that the five unsupervised approaches exhibit different strengths within the synthetic enterprise security environment. Model performance varied according to the evaluation criterion, decision threshold, and contamination level used during analysis.
Isolation Forest produced the strongest fixed-threshold classification results, achieving the highest precision, recall, F1-score, and accuracy. It also achieved the highest PR-AUC of 0.4608, indicating strong precision-recall ranking performance across different thresholds. Its sensitivity analysis further showed that F1-score reached its highest observed value at approximately 3% contamination, while recall continued to increase at higher contamination levels. This demonstrates the trade-off between increasing detection sensitivity and maintaining a favorable balance between precision and recall.
GMM produced the highest ROC-AUC of 0.8227, demonstrating the strongest threshold-independent ranking performance according to the ROC criterion. Its fixed-threshold F1-score of 0.4305 was also close to that of Isolation Forest. GMM additionally achieved a high silhouette score of 0.6502, closely following Isolation Forest at 0.6516, indicating comparatively strong geometric separation between its predicted normal and anomalous groups in the engineered feature space.
One-Class SVM provided moderate detection capability but remained below Isolation Forest and GMM across the major evaluation measures. Its ROC-AUC of 0.6484 and F1-score of 0.2489 indicate that the learned normal-behavior boundary captured some anomalous observations but provided weaker overall discrimination than the leading models.
The Autoencoder demonstrated useful ROC-based discrimination, with a ROC-AUC of 0.7385, but its fixed-threshold F1-score of 0.1757 and PR-AUC of 0.1712 were considerably lower. Its silhouette score of 0.3254 was also the lowest among the five models. These results indicate that reconstruction error captured some behavioral differences but did not translate into strong precision-recall or geometric separation at the selected operating point.
LOF produced the weakest overall results. Its ROC-AUC of 0.5622, PR-AUC of 0.1028, and F1-score of 0.0615 indicate that local-density relationships were poorly aligned with the attack patterns represented in the current feature space. Its silhouette score of 0.4221 was also lower than those of Isolation Forest, GMM, and One-Class SVM.
The contamination sensitivity analysis further demonstrates that increasing the contamination level generally increases recall but does not necessarily improve F1-score. This indicates that classifying more observations as anomalous can increase the number of detected attacks while simultaneously increasing false-positive effects. Consequently, the contamination level represents an important operating parameter rather than simply a setting in which higher values produce better detection.
The results therefore do not support a universal ranking in which one algorithm is superior under every criterion. Instead, the experiment demonstrates distinct strengths:
- Isolation Forest provided the strongest fixed-threshold classification and PR-AUC performance.
- GMM provided the strongest ROC-AUC performance.
- Isolation Forest and GMM produced the strongest silhouette separation.
- One-Class SVM provided intermediate performance.
- Autoencoder demonstrated useful ROC-based discrimination but weaker fixed-threshold and PR-AUC performance.
- LOF produced the weakest overall detection performance.
This distinction is one of the most important findings of the experiment. Isolation Forest provided the strongest performance at the selected operating point and under precision-recall analysis, whereas GMM provided the strongest threshold-independent ROC ranking performance. The sensitivity and silhouette analyses further demonstrate that anomaly-detection performance depends not only on the selected algorithm but also on the contamination level and the geometric characteristics of the resulting predictions.
5Conclusion and future work
This study presented a reproducible framework for behavioral anomaly detection within synthetic enterprise security event logs using unsupervised machine learning. The experimental pipeline integrated synthetic enterprise log generation, adversarial attack injection, behavioral and temporal feature engineering, statistical analysis, unsupervised anomaly detection, and multi-model evaluation within a controlled experimental environment.
The final dataset contained 6,244 security events, comprising 5,874 normal observations and 370 injected attack observations. The attack scenarios represented credential stuffing, privilege misuse, abnormal session duration, and lateral movement. Five unsupervised anomaly-detection approaches were evaluated: Isolation Forest, Local Outlier Factor (LOF), One-Class SVM, Autoencoder, and Gaussian Mixture Model (GMM). The attack labels were excluded from model training and retained only for post hoc evaluation.
The experimental findings provide empirical support for the alternative hypothesis (H₁) that unsupervised machine learning models can identify meaningful behavioral anomalies within synthetic enterprise security event logs. However, the strength of this support varied substantially across the evaluated models and performance criteria. The results demonstrate that the models were capable of identifying a measurable proportion of injected attack observations, although none achieved complete separation between malicious and normal behavior.
Isolation Forest produced the strongest fixed-threshold classification performance, achieving a precision of 0.4824, recall of 0.4081, F1-score of 0.4422, and accuracy of 0.9390. It also achieved the highest PR-AUC of 0.4608, indicating the strongest precision-recall ranking performance among the evaluated approaches. These results establish Isolation Forest as the strongest-performing model under the selected operating point and precision-recall evaluation.
GMM demonstrated a different strength, achieving the highest ROC-AUC of 0.8227. Its fixed-threshold F1-score of 0.4305 was also close to the Isolation Forest result. This indicates that GMM provided strong threshold-independent ranking performance even though Isolation Forest achieved slightly better performance at the selected operating point. GMM also produced a silhouette score of 0.6502, closely following Isolation Forest at 0.6516, indicating comparatively strong geometric separation of the model-predicted groups in the engineered feature space.
The remaining models demonstrated comparatively weaker performance. One-Class SVM achieved an F1-score of 0.2489 and ROC-AUC of 0.6484, indicating moderate-to-low detection capability. The Autoencoder achieved a ROC-AUC of 0.7385, demonstrating that reconstruction error captured useful behavioral differences; however, its F1-score of 0.1757 and PR-AUC of 0.1712 were considerably lower. LOF produced the weakest overall performance, with an F1-score of 0.0615, ROC-AUC of 0.5622, and PR-AUC of 0.1028.
These results suggest that local-density relationships were less aligned with the simulated attack patterns within the selected feature space.
The sensitivity analysis further demonstrated that model performance depends on the selected contamination level. Increasing the contamination level generally increased recall because a greater proportion of observations were classified as anomalous. However, higher contamination did not necessarily improve F1-score, as additional anomaly predictions can introduce more false positives. This finding demonstrates the importance of selecting an appropriate operating point when applying unsupervised anomaly-detection techniques.
The silhouette analysis provided additional information about the geometric separation associated with the model predictions. Isolation Forest and GMM produced the highest silhouette scores, at 0.6516 and 0.6502, respectively. However, because silhouette scores were calculated from model-generated normal/anomaly assignments rather than independently established clusters, these results should be interpreted as supplementary evidence of feature-space separation rather than direct measures of detection accuracy.
Taken together, the findings support H₁ at the level of empirical model performance, demonstrating that the evaluated unsupervised approaches can extract meaningful anomaly signals from engineered behavioral features. However, the study does not provide sufficient evidence to claim a statistically significant superiority over a random or non-informative anomaly-scoring process because no formal statistical significance test against such a baseline was performed. Consequently, the results supporting the usefulness of unsupervised anomaly detection rather than as a formal statistical rejection of H₀.
Overall, the study demonstrates that model effectiveness is strongly dependent on algorithmic approach, feature representation, contamination level, and evaluation criterion. No single model was universally superior across all measures. Isolation Forest provided the strongest fixed-threshold and precision-recall performance, whereas GMM provided the strongest ROC-AUC performance. This distinction highlights the importance of evaluating unsupervised anomaly-detection systems using multiple complementary metrics rather than relying on a single measure of performance.
Acknowledgments
The authors acknowledge the open-source software communities whose tools and libraries supported the development and evaluation of this research, particularly Python, Pandas, NumPy, Scikit-learn, PyTorch, and Matplotlib. The authors also thank their families, friends, and colleagues for their encouragement and support throughout the research and manuscript preparation.
Funding
This research received no specific grant from any funding agency in the public, commercial, or not-for-profit sectors.
Conflict of Interest
The authors declare that they have no known financial, professional, or personal conflicts of interest that could have influenced the research, analysis, or presentation of the findings reported in this study.
Data Availability
The dataset used in this study was synthetically generated using the data-generation framework developed as part of the research. The dataset does not contain real user identities, proprietary enterprise information, or confidential security telemetry.
The synthetic dataset and associated processing artifacts are available through the project’s public repository. The data-generation and attack-injection procedures are also provided to support reproduction of the experimental dataset.
Code Availability
The source code used to generate the synthetic security-event dataset, perform attack-scenario injection, engineer behavioral features, train the unsupervised anomaly-detection models, evaluate model performance, and generate the experimental visualizations is publicly available in the project’s GitHub repository:
https://github.com/0x0allenace/security-anomaly-project The repository includes implementations for Isolation
Forest, Local Outlier Factor, One-Class SVM, Autoencoder, and the associated preprocessing, evaluation, statistical-analysis, and visualization components.
Author Contributions
Author 1: Conceptualization, methodology, software, synthetic data generation, and writing — original draft. Author 2: Machine learning implementation and investigation.
Author 3: Data analysis and visualization. Author 4: Attack-scenario simulation and feature engineering.
All authors reviewed and approved the final manuscript and agreed to be accountable for all aspects of the work.
References
- [1]Kent K, Souppaya M. Guide to computer security log management. NIST. 2006.
- [2]Sommer R, Paxson V. Outside the closed world: On using machine learning for network intrusion detection. IEEE S&P. 2010.
- [3]Chandola V, et al. Anomaly detection: A survey. ACM Computing Surveys. 2009.
- [4]Liu FT, et al. Isolation forest. In: ICDM. 2008.
- [5]Breunig M, et al. LOF: Identifying density-based local outliers. In: SIGMOD. 2000.
- [6]Schölkopf B, et al. Support vector method for novelty detection. Neural Computation. 2001.
- [7]Du M, et al. DeepLog. In: ACM CCS. 2017.
- [8]An J, Cho S. Autoencoder-based anomaly detection. 2015.
- [9]Garcia S, et al. An empirical comparison of botnet detection methods. 2014.
- [10]Hussein SA, Répás SR. Anomaly detection in log files based on machine learning techniques. 2024.
- [11]Wibowo RA, Syalsabilla AF, Rozy AF. Identification of cyber attacks based on network anomaly factor in Indonesia using fuzzy Gaussian mixture model with intervention analysis. 2026.
- [12]Kumar Y, Saraswat N, Gupta PK, Mathur M. Comparative evaluation of anomaly detection algorithms for network intrusion detection. In: Data Processing and Networking (ICDPN 2025). Cham: Springer; 2026. (Lecture Notes in Networks and Systems; vol. 1934).
- [13]Agyemang EF. Anomaly detection using unsupervised machine learning algorithms: A simulation study. Scientific African. 2024;26:e02386.
- [14]Benova L, Hudec L. Comprehensive analysis and evaluation of anomalous user activity in web server logs. Sensors. 2024;24(3):746.
- [15]Gutierrez-Portela F, Almenares Mendoza F, Calderon-Benavides L. Evaluation of the performance of unsupervised learning algorithms for intrusion detection in unbalanced data environments. IEEE Access. 2024;12:190134–190157.
- [16]Pennada SSP, Nayak SK, V. K. M. Insider threat detection using behavioural analysis through machine learning and deep learning techniques. International Research Journal of Multidisciplinary Technovation. 2025;7(2):74–86.
- [17]Guo H, Yuan S, Wu X. LogBERT: Log anomaly detection via BERT. In: 2021 International Joint Conference on Neural Networks (IJCNN), IEEE. 2021. p. 1–8.
- [18]Fei K, Zhou J, Zhou Y, Gu X, Fan H, Li B, et al. LaAeb: A comprehensive log-text analysis based approach for insider threat detection. Computers & Security. 2025;148:104126.
- [19]Blanco R, Malagón P, Briongos S, Moya JM. Anomaly detection using Gaussian mixture probability model to implement intrusion detection system. In: Hybrid Artificial Intelligent Systems (HAIS 2019). Cham: Springer; 2019. p. 648–659. (Lecture Notes in Computer Science; vol. 11734).
- [20]Das BC, Sartaz MS, Reza SA, Hossain A, Nasiruddin M, Bishnu KK, et al. AI-driven cybersecurity threat detection: Building resilient defense systems using predictive analytics. International Journal of Basic and Applied Sciences. 2025;14(4):33–45.