AI, Machine Learning
AI-Based Network Intrusion Detection System Using Machine Learning and Explainable AI
Department of Computer Science and Engineering, Rajiv Gandhi Institute of Technology, Bengaluru, India
Published October 2026
Abstract
Network intrusion detection is an important cybersecurity function because network traffic can contain benign activity as well as malicious behavior. This paper presents an AI-based Network Intrusion Detection System (AI-NIDS) that combines live packet capture, flow generation, machine-learning classification, explainable artificial intelligence, and web-based visualization. The prototype is implemented in an Ubuntu virtual machine hosted through VirtualBox. Scapy captures traffic visible on the virtual network interface, and related packets are grouped into flows. Four features that can be derived directly from live traffic—destination port, packet count, total bytes, and average packet size—are used by the live classification pipeline. CICIDS2017 is used for model training and evaluation. Isolation Forest is used for anomaly-oriented analysis, while Random Forest and XGBoost perform multi-class classification. SHAP provides feature-level explanations, and a Flask dashboard presents live flows, detections, and explanations. On a held-out test set of 22,339 samples, Random Forest achieved 90.67% accuracy and XGBoost achieved 94.42% accuracy; macro F1 scores were 0.78 and 0.81, respectively. The results demonstrate the feasibility of combining machine learning and explainability in a practical NIDS prototype, while highlighting limitations related to reduced live features, rare attack classes, false positives, and virtualized network scope.
Keywords: network intrusion detection; machine learning; CICIDS2017; random forest; XGBoost; isolation forest; SHAP; explainable AI
1Introduction
Networked systems are exposed to a growing range of malicious activities. A Network Intrusion Detection System (NIDS) monitors traffic and identifies behavior that may indicate attacks or abnormal activity. Conventional signature-oriented methods are effective for known patterns but can be less effective when traffic characteristics change or when an event does not match a predefined rule.
Machine learning provides a complementary approach by learning statistical and behavioral patterns from traffic. This work connects live packet capture to flow generation, feature extraction, machine-learning inference, SHAP explanations, and web visualization. The design is intended as a practical prototype that can be observed in real time.
2Related work
CICIDS2017 provides benign and attack traffic for intrusion-detection research [1]. Random Forest is an ensemble of decision trees [2], while XGBoost is a scalable gradient-boosted tree framework [3]. Isolation Forest identifies observations that are easier to isolate through random partitioning [4]. SHAP provides feature-level explanations based on Shapley-value attribution [5]. The contribution of this work is the integration of these techniques with a live packet-to-dashboard workflow.
3Problem statement and contributions
The objective is to develop a practical NIDS prototype that transforms live network packets into flow-level features, applies machine-learning models, explains predictions, and presents the result through a web dashboard.
The main contributions are: (1) live packet capture and flow generation using Python and Scapy; (2) a compact four-feature live representation; (3) integration of Isolation Forest, Random Forest, and XGBoost; (4) SHAP-based explanation; and (5) Flask-based live visualization.
4Proposed system
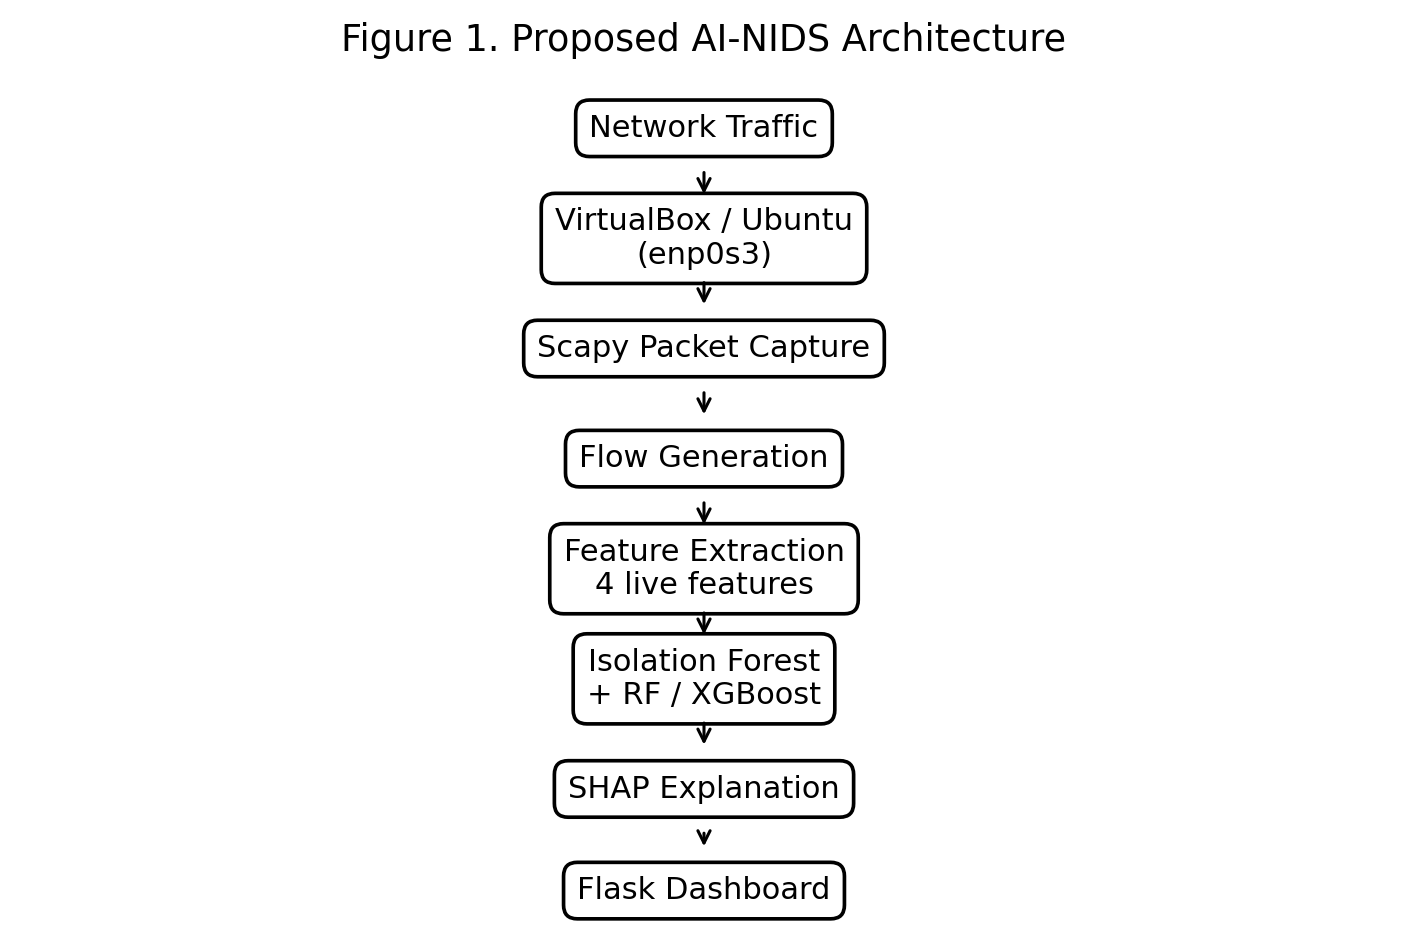
The system runs inside an Ubuntu virtual machine under VirtualBox. The live capture interface is enp0s3. Scapy captures packets and extracts source and destination addresses, ports, protocol, and packet size. Related packets are grouped using source IP, destination IP, source port, destination port, and protocol. Once the configured packet threshold is reached, flow features are generated and passed to the models.
The current deployment uses VirtualBox NAT; therefore, the prototype monitors traffic visible to the Ubuntu guest interface rather than all traffic on the physical LAN.
5Methodology
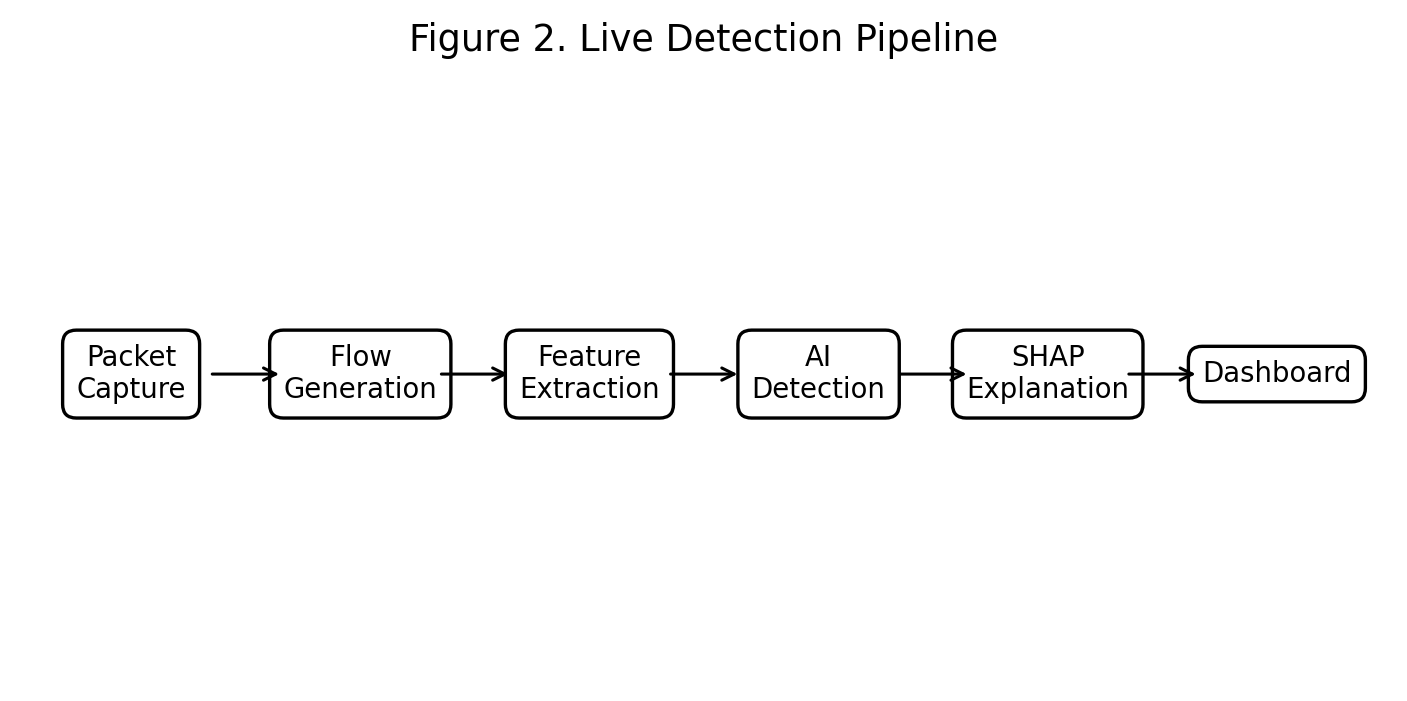
The workflow begins with packet capture and ends with dashboard visualization. The same feature definitions are used for the live inference models and the derived live training dataset.
6Dataset and preprocessing
CICIDS2017 contains benign traffic and multiple attack categories, including DDoS, DoS, PortScan, Bot, Brute Force, Web Attacks, Infiltration, and Heartbleed [1]. The preprocessing pipeline cleans column names, removes empty rows and columns, selects numeric features, replaces infinite values, fills missing values, encodes labels, and standardizes features.
For live inference, a compact dataset was derived using destination port, packet count, total bytes, and average packet size. The live dataset contains 111,694 samples across 15 classes. An 80/20 split produced 89,355 training samples and 22,339 test samples.
where x is a feature, μ is the training-set mean, and σ is its standard deviation.
7Flow generation and feature extraction
A flow is represented by the communication endpoints and protocol:
For N packets with packet sizes Sᵢ, total bytes are:
Average packet size is:
| Feature | Definition | Purpose |
|---|---|---|
| Destination Port | Destination service port | Target service endpoint |
| Packet Count | N | Number of observed packets |
| Total Bytes | Σ Sᵢ | Traffic volume |
| Average Packet Size | B/N | Average packet size |
8Machine learning methodology
Isolation Forest is used for anomaly-oriented analysis [4]. Random Forest and XGBoost are supervised multi-class classifiers [2], [3]. The live Random Forest uses 150 estimators with balanced class weighting. XGBoost uses 150 estimators, maximum depth 6, learning rate 0.1, and multi-class log-loss evaluation.
The expression represents the majority-vote principle of a Random Forest ensemble.
9Experimental setup and evaluation
Evaluation was performed on 22,339 held-out samples. Accuracy, macro F1, and weighted F1 were used to summarize performance.
| Model | Accuracy | Macro F1 | Weighted F1 |
|---|---|---|---|
| Random Forest | 90.67% | 0.78 | 0.93 |
| XGBoost | 94.42% | 0.81 | 0.94 |
XGBoost achieved the stronger aggregate result on the held-out dataset. These results are dataset-specific; several attack classes contain very few samples, so rare-class performance requires additional validation.
10Results and discussion
The four-feature representation supports meaningful multi-class discrimination on the derived CICIDS2017 test set. XGBoost achieved 94.42% accuracy compared with 90.67% for Random Forest, with a higher macro F1 as well.
The live implementation demonstrates that the selected features can be calculated directly from captured packets. However, the reduced feature set limits the amount of behavioral information available to the classifier. Live testing also showed that ordinary SSH traffic can occasionally be classified as SSH-Patator; therefore, an attack classification is a model-generated indication requiring investigation rather than absolute proof of malicious activity.
11Explainable AI using SHAP
SHAP (SHapley Additive exPlanations) is used to explain individual predictions [5]. Its additive explanation can be represented as:
where φ₀ is the base value and φᵢ is the contribution assigned to feature i.
| Feature | Example absolute SHAP importance |
|---|---|
| Destination Port | 5.1954 |
| Total Bytes | 0.4200 |
| Packet Count | 0.3465 |
| Average Packet Size | 0.0569 |
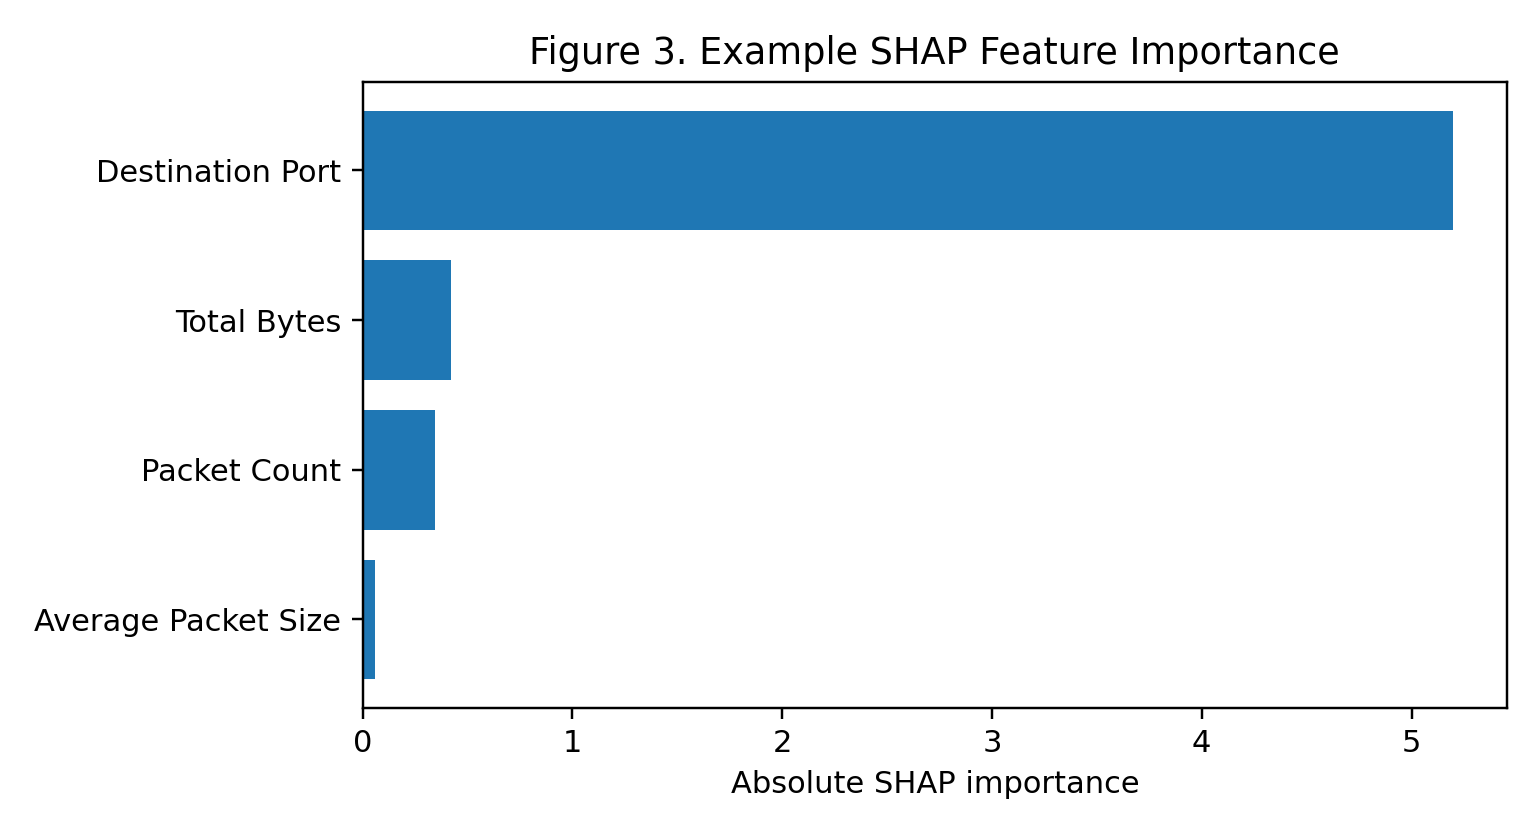
The example shows that destination port had the largest absolute contribution among the displayed features. SHAP explains model behavior for the selected input; it does not independently prove that the traffic is malicious.
12Live NIDS implementation and dashboard
The live sensor runs on Ubuntu and captures traffic through enp0s3. Flows are analyzed after a configured packet threshold. Detection records contain time, source and destination addresses, ports, protocol, packet count, total bytes, status, and predicted attack class when available.
The Flask application provides system health, recent detections, live-flow data, and SHAP results. The dashboard presents live network activity, traffic statistics, current detections, attack classifications, and feature-level explanations.
13Limitations
The prototype uses only four live features, while CICIDS2017 contains a richer flow-feature representation. VirtualBox NAT limits monitoring to traffic visible to the Ubuntu guest interface. Some attack classes have very few samples. Machine-learning predictions can produce false positives and false negatives. The prototype has not yet been validated across multiple physical networks or production-scale traffic volumes.
14Future scope
Future work includes expanding the live feature set, improving flow timeout and bidirectional-flow handling, introducing a calibrated suspicious state, evaluating additional machine-learning and deep-learning models, addressing class imbalance, testing across multiple interfaces, evaluating additional real-world traffic, and adding automated alerting.
15Conclusion
This paper presented an AI-based Network Intrusion Detection System integrating live packet capture, flow generation, lightweight feature extraction, machine-learning classification, SHAP explainability, and Flask visualization. CICIDS2017 was used for model development, while the live prototype processes traffic visible on an Ubuntu virtual network interface. Random Forest achieved 90.67% accuracy and XGBoost achieved 94.42% on the held-out test set. The prototype demonstrates the feasibility of combining machine learning and explainability in a practical NIDS workflow, while the observed false positives, rare classes, reduced feature set, and virtualized monitoring scope identify areas for future improvement.
Acknowledgments
The authors thank the Department of Computer Science and Engineering, Rajiv Gandhi Institute of Technology, Bengaluru, and the project guide for their guidance and support.
References
- [1]Sharafaldin I, Lashkari AH, Ghorbani AA. Toward generating a new intrusion detection dataset and intrusion traffic characterization. In: Proc. 4th International Conference on Information Systems Security and Privacy (ICISSP). 2018. p. 108–116.
- [2]Breiman L. Random forests. Machine Learning. 2001;45:5–32.
- [3]Chen T, Guestrin C. XGBoost: A scalable tree boosting system. In: Proc. 22nd ACM SIGKDD International Conference on Knowledge Discovery and Data Mining. 2016. p. 785–794.
- [4]Liu FT, Ting KM, Zhou ZH. Isolation forest. In: Proc. Eighth IEEE International Conference on Data Mining. 2008. p. 413–422.
- [5]Lundberg SM, Lee SI. A unified approach to interpreting model predictions. In: Advances in Neural Information Processing Systems 30. 2017. p. 4765–4774.