Power
Comparative Performance Evaluation of FACTS for Transmission Congestion Mitigation in the Nigerian 330 kV Network
Department of Electrical/Electronic Engineering, University of Port Harcourt, Port Harcourt, Nigeria
Published October 2026
Abstract
Increasing electricity demand and inadequate transmission capacity have intensified congestion and voltage stability challenges in Nigeria’s 330 kV transmission network. This study investigates the effectiveness of Flexible AC Transmission Systems (FACTS), specifically the Static Var Compensator (SVC) and Thyristor-Controlled Series Capacitor (TCSC), in mitigating transmission congestion, improving voltage regulation, and reducing power losses. A representative Nigerian 330 kV transmission network was modelled and analysed using NEPLAN 555. Base-case power-flow analysis was conducted to identify overloaded transmission corridors. The performance of the compensation schemes was evaluated by comparing transmission line loading and active and reactive power losses before and after integration. The base-case analysis recorded total active and reactive power losses of 388.33 MW and 980.82 Mvar, respectively. Following SVC integration, these losses decreased to 244.30 MW and 416.19 Mvar, representing reductions of 37.09% and 57.57%, respectively. TCSC integration achieved greater reductions, lowering active power losses to 109.976 MW and reactive power losses to 252.234 Mvar, corresponding to improvements of 71.68% and 74.28%, respectively. The results demonstrate that both FACTS devices can enhance transmission network performance, with TCSC exhibiting superior performance in reducing system losses under the investigated operating conditions. The findings provide a basis for improving congestion management and operational efficiency in Nigeria’s 330 kV transmission network.
Keywords: transmission congestion; FACTS devices; Static Var Compensator (SVC); Thyristor-Controlled Series Capacitor (TCSC); Nigerian 330 kV transmission network
1Introduction
The increasing demand for electrical energy due to population growth, urbanization, and industrial development has placed significant pressure on power transmission systems, particularly in developing countries. In Nigeria, the 330 kV transmission network constitutes a major backbone for transferring electricity from generating stations to regional and urban load centres. However, ageing infrastructure, inadequate transmission capacity, limited redundancy, increasing load demand, and poor reactive power management have contributed to congestion, voltage instability, and increased transmission losses [1]. Transmission congestion occurs when power flow through a transmission line or transformer exceeds its permissible thermal, voltage, or stability limits. Such conditions may result in uneconomic generation dispatch, increased losses, voltage violations, load curtailment, and, under severe conditions, system instability or collapse [2]. Consequently, effective congestion management is essential for maintaining secure and reliable power-system operation while maximizing the utilization of existing transmission infrastructure. Transmission congestion is a major operational challenge in modern power systems, occurring when power flow exceeds the thermal, voltage, or stability limits of transmission facilities. It can result in increased transmission losses, voltage violations, uneconomic generation dispatch, load shedding, and, under severe conditions, cascading outages and system collapse. These challenges are particularly significant in developing power systems such as Nigeria, where transmission expansion has not always kept pace with growth in generation and electricity demand. Several approaches have been proposed for congestion management, including network reinforcement, generation rescheduling, demand-side management, optimal power flow (OPF), pricing mechanisms, and Flexible AC Transmission Systems (FACTS). Although network expansion can provide permanent capacity enhancement, its implementation is constrained by high capital requirements, environmental concerns, regulatory procedures, and right-of-way limitations. Consequently, FACTS-based solutions have received increasing attention because they can improve the utilization and controllability of existing transmission infrastructure.
FACTS devices employ power-electronic controllers to regulate voltage, reactive power, impedance, and power flow. Common devices include the Static VAR Compensator (SVC), Static Synchronous Compensator (STATCOM), Thyristor-Controlled Series Capacitor (TCSC), Static Synchronous Series Compensator (SSSC), Unified Power Flow Controller (UPFC), and Unified Power Quality Conditioner (UPQC). Their ability to provide rapid and localized control makes them suitable for congestion mitigation under normal and contingency operating conditions.
A research by [3] investigated optimal UPFC placement using sensitivity- and pricing-based approaches within an OPF framework and reported improvements in transmission losses, voltage profile, and congestion costs. A study by [4] demonstrated that coordinated TCSC and distributed generation could reduce line overloading under stressed operating conditions. Genetic Algorithm (GA) optimization was applied to TCSC placement and there were reported reductions in congestion and transmission losses [5]. Flexible AC Transmission System (FACTS) devices represent a technically sophisticated and dynamic solution for mitigating congestion and enhancing the operational flexibility of power networks. These power electronic-based controllers enable real-time control of key parameters such as voltage magnitude, phase angle, and line impedance. FACTS devices such as Static VAR Compensator (SVC), Static Synchronous Compensator (STATCOM), and Unified Power Flow Controller (UPFC) have the ability to manage reactive power, support voltage profiles, and redirect power flows across designated corridors makes them particularly valuable in congestion management applications [6].A study showed that strategic coordination of multiple FACTS devices can significantly improve power transfer capability and reduce transmission constraints [7]
Power flow analysis is an essential computational tool used in planning, operating, and optimizing power systems. It provides the steady-state voltage magnitude and phase angle at each bus, and the real and reactive power flows on each line under specified operating conditions. The primary objective is to ensure that the power system operates within its thermal, voltage, and stability limits under various load scenarios [8].
Newton-Raphson and Fast-Decoupled Load Flow methods are particularly suitable for large transmission systems because of their convergence characteristics and computational efficiency [9]. When integrated with optimization algorithms, power-flow analysis can identify critical transmission corridors and determine appropriate FACTS locations and ratings.
Despite the extensive literature on FACTS-based congestion management, important gaps remain. Most existing studies are based on standard IEEE test systems, with limited application to the Nigerian 330 kV transmission network. There is also limited integration of Nigerian network modelling, congestion severity assessment, and Genetic Algorithm-based optimization for FACTS placement and sizing under both normal and contingency conditions.
This study addresses these gaps by modelling a representative Nigerian 330 kV transmission network in NEPLAN and applying power-flow analysis to identify and quantify congestion. A Genetic Algorithm is subsequently employed to optimize FACTS placement and sizing. The effectiveness of the proposed compensation is evaluated using voltage profile improvement, line-loading relief, transmission loss reduction, and congestion severity indices. The approach provides a framework for assessing the technical feasibility of FACTS-based congestion mitigation in Nigeria's transmission network.
2Materials and methods
The materials used were collected from Transmission Company of Nigeria (TCN) [10] with particular attention to the schematic diagram of the entire 330kV grid network. The materials collected includes:
Bus data consisting of fourteen (14) generators with Egbin chosen as the slack and thirty four (34) loads. (from March 2024 to November, 2025). Line data consisting of thirty four (34) single circuit, twenty four (24) double circuit, one (1) triple circuit and one (1) quadruple circuit. (Source: Transmission Company of Nigeria). Static Var Compensator (SVC) use for control of reactive power and improves voltage stability by compensating for voltage fluctuations. Thyristor-Controlled Series Capacitor (TCSC) used for enhancing system stability and controlling power flow between different parts of the network by adjusting series reactance. Neplan 555 software package was used for modeling, network analysis and optimization of Nigerian 330 kV network using FACTS devices
This study adopts a simulation-based approach to optimize congestion in the Nigerian 330 kV transmission network through the integration of FACTS devices. A comparative analysis of two selected FACTS devices was conducted to evaluate their effectiveness in mitigating transmission line congestion, relieving overloaded corridors, improving voltage stability, and minimizing system losses. To achieve this, the following steps were undertaken: Load flow analysis was employed to identify overloaded transmission lines and weak voltage buses in the network, providing a diagnostic basis for congestion and voltage instability. Contingency analysis (N-1) was performed to test the network’s response to individual line or generator outages to evaluate the robustness of each FACTS device under stressed conditions.
The performance of each FACTS device was evaluated based on key technical indicators, including improvement in voltage profiles, reduction in line loading percentages, minimization of total system losses, and the network’s ability to maintain stable operation under both base case and contingency scenarios
2.1Base case power flow analysis
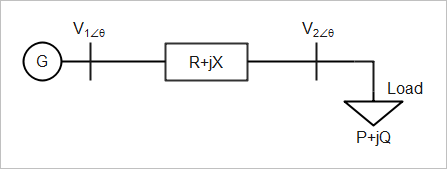
where G is the generator; V1∠θ the sending-end voltage and angle; V2∠θ the receiving-end voltage and angle; and P + jQ the complex power at the receiving end.
Figure 1 shows a two-bus system, which consists of a load fed from a source via a transmission line. For any ith bus, let
For the kth bus,
The real and reactive power injected in the network is given by
Separating (8) into real and imaginary parts have,
where
: the admittance matrix
: the injected real power
: the injected reactive power
: phase angle
Expanding (9) and (10) in Taylor series neglecting higher order terms we have
The Jacobian matrix gives the linearized relationship between small changes in voltage angle and magnitude and small changes in real and reactive power , respectively.
where
, , and are the elements of the Jacobian matrix.
The off-diagonal and diagonal elements of are
The off-diagonal and diagonal elements of are
The off-diagonal and diagonal elements of are
The off-diagonal and diagonal elements of are
Compute the scheduled errors and for each load bus:
3Results and discussion
| BranchID | FromBus | ToBus | Power Flow | Loading | Losses | ||
|---|---|---|---|---|---|---|---|
| MW | MVar | % | MW | MVar | |||
| A1K | Alaoji Ts | Ikot Ekpene | -133.60 | -124.31 | 10.7 | 0.017 | -0.498 |
| A1S | Markudi | Jos | -428.46 | -939.53 | 72.5 | 17.957 | 151.878 |
| B11J | Benin | Ajakuta | -954.91 | 127.68 | 57.1 | 6.630 | 4.999 |
| B1T | Onitsha | Benin | 659.67 | -205.57 | 40.7 | 1.504 | 12.132 |
| B3D | Asaba | Benin | 321.33 | -103.31 | 39.8 | 0.718 | 5.775 |
| B5M | Omotosho | Benin | -318.68 | -1.42 | 37.6 | 2.183 | 23.364 |
| B5W | Ikeja West | Benin | -155.65 | 3.66 | 18.4 | 1.220 | 3.016 |
| B6N | Egbin | Benin | -240.62 | 7.68 | 28.4 | 2.267 | 19.835 |
| B8J | Jebba Gs | Jebba TS | -160.00 | -150.69 | 13.0 | 0.001 | -0.688 |
| D1B | Odukpani | Adiabor | -140.00 | -90.00 | 36.7 | 0.001 | -0.627 |
| D1K | Odukpani | Ikot Ekpene | 10.00 | 110.63 | 6.5 | 0.003 | -0.614 |
| D1M | Damaturu | Maiduguri | 80.40 | 33.23 | 15.6 | 0.396 | 3.227 |
| D3T | Asaba | Onitsha | 220.61 | -159.08 | 31.9 | 0.088 | -0.232 |
| E1D | Gombe | Damaturu | 231.91 | 165.96 | 49.5 | 1.517 | 12.737 |
| E1Y | Gombe | Yola | 181.82 | 83.69 | 34.8 | 1.682 | 14.134 |
| F1A | Afam | Alaoji Ts | 417.85 | 111.01 | 25.4 | 0.023 | -0.364 |
| F1E | Afam | Ikot Ekpene | -172.12 | -111.41 | 12.1 | 0.029 | -0.418 |
| G1W | Delta | Aladja | 82.36 | 24.44 | 10.1 | 0.003 | -0.296 |
| G3B | Delta | Benin | -167.60 | -95.58 | 22.7 | 0.035 | -0.024 |
| G5B | Gwagalada | Katempe | 271.92 | 59.24 | 32.9 | 0.042 | 0.038 |
| H1U | New Heaven | Ugwaji | -642.18 | -980.43 | 138.0 | 0.023 | -0.127 |
| H1W | Ikeja West | Oshogbo | -123.25 | 13.52 | 14.5 | 0.689 | -2.844 |
| H2A | Ayede | Oshogbo | -2124.62 | 1039.47 | 176.1 | 24.371 | 20.360 |
| H3G | Oshogbo | Ganmo | -786.52 | 421.52 | 105.1 | 10.054 | 0.990 |
| H7V | Ihovbor | Oshogbo | -1190.66 | 760.26 | 166.5 | 34.239 | 28.738 |
| J1B | Aja | Alagbon | -260.00 | -120.00 | 33.4 | 0.018 | -0.163 |
| J1E | Aja | Lekki | 100.00 | 49.68 | 13.0 | 0.001 | -0.319 |
| J1H | Oshogbo | Jebba TS | -26.36 | -23.80 | 4.2 | 0.036 | 0.157 |
| J1L | Ajakuta | Lokoja | 924.91 | -32.06 | 54.9 | 0.210 | 1.155 |
| J3G | Ganmo | Jebba TS | -634.83 | 512.64 | 96.2 | 1.693 | 1.119 |
| J3R | Shiroro | Jebba TS | 729.45 | -186.92 | 44.4 | 5.668 | 47.458 |
| K1J | Kainji | Jebba TS | -108.27 | -104.36 | 8.9 | 0.163 | 1.466 |
| K1T | Okpai | Onitsha | -148.73 | -1553.77 | 91.7 | 1.273 | 10.164 |
| K1U | Ikot Ekpene | Ugwaji | 5.31 | -187.50 | 5.5 | 0.029 | -1.035 |
| K3R | Kainji | B-Kebbi | 156.57 | 71.15 | 20.1 | 10.572 | -13.854 |
| K7W | OkeAro | Ikeja West | 1923.50 | 90.86 | 112.7 | 0.478 | 3.415 |
| L6G | Gwagalada | Lokoja | -622.85 | 198.24 | 38.6 | 1.844 | 15.025 |
| L7A | Alaoji | Alaoji Ts | 95.00 | 80.00 | 7.3 | 0.000 | -0.639 |
| M2S | Jos | Mando | 495.19 | -198.15 | 74.4 | 5.195 | 4.184 |
| M5W | Omotosho | Ikeja West | -194.86 | 89.56 | 25.0 | 0.392 | 2.656 |
| M6N | Mando | Kumbotso | 241.68 | 94.14 | 36.2 | 1.675 | 13.997 |
| N3J | Egbin | Aja | 660.04 | 373.96 | 44.2 | 0.019 | -0.563 |
| N6W | Egbin | Ikeja West | 2113.15 | 166.18 | 147.2 | 5.739 | 43.777 |
| N7K | Egbin | OkeAro | 2148.26 | 200.99 | 151.7 | 4.767 | 40.133 |
| NWIBS | Ikeja West | Sakete | 302.52 | 251.82 | 46.1 | 2.519 | 1.822 |
| R1J | Geregu | Ajakuta | -200.00 | -210.63 | 17.2 | 0.000 | -0.625 |
| R1M | Shiroro | Mando | 1085.49 | -21.82 | 63.3 | 178.624 | 14.603 |
| R1W | Oloronsogo | Ikeja West | 2316.84 | -512.72 | 177.9 | 11.183 | 85.649 |
| R2A | Oloronsogo | Ayede | -2423.99 | 813.11 | 196.8 | 7.667 | 64.744 |
| R4B | Shiroro | Katempe | 18.46 | 12.35 | 2.6 | 0.343 | -0.348 |
| R5G | Shiroro | Gwagalada | -200.17 | 333.24 | 45.3 | 0.766 | 5.758 |
| S2B | Sapele | Benin | -142.34 | -155.61 | 8.3 | 0.013 | -0.579 |
| S4G | Sapele | Aladja | 17.64 | 44.97 | 5.7 | 0.003 | -0.293 |
| SIE | Jos | Gombe | 768.45 | 668.99 | 143.0 | 34.719 | 294.479 |
| T3H | Onitsha | New Heaven | 822.63 | 1109.56 | 162.2 | 0.429 | -0.741 |
| T4A | Onitsha | Alaoji Ts | 20.79 | 7.62 | 2.6 | 0.003 | -0.295 |
| U1A | Ugwaji | Markudi | -530.42 | -1073.81 | 73.6 | 6.447 | 54.113 |
| V7B | Ihovbor | Benin | -1300.65 | 669.70 | 86.2 | 0.009 | -0.559 |
| W3L | Ikeja West | Akangba | 300.01 | 249.42 | 22.9 | 0.008 | -0.579 |
| Y1G | Yola | Jalingo | 80.14 | 51.04 | 17.1 | 0.139 | 1.041 |
| 388.33 | 980.82 | ||||||
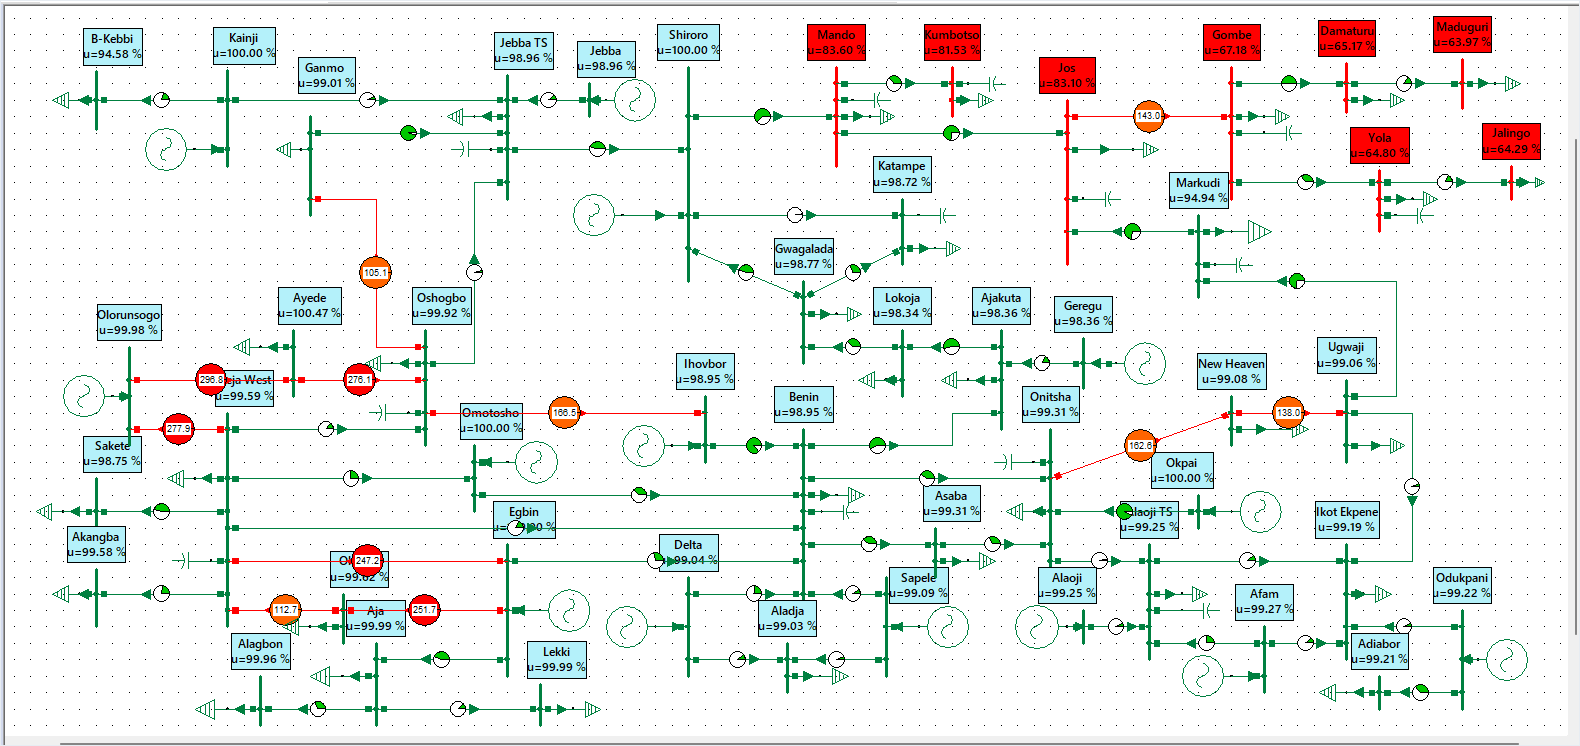
Table 1 shows that the most critically overloaded lines include R2A (Oloronsogo-Ayede, 196.82 %), R1W (Oloronsogo-Ikeja West, 177.91 %), H2A (Ayede-Oshogbo, 176.11 %), H7V (Ihovbor-Oshogbo, 166.54 %), T3H (Onitsha-New Heaven, 162.64 %), N7K (Egbin-Oke Aro, 151.66 %), N6W (Egbin-Ikeja West, 147.23 %), and SIE (Jos-Gombe, 143.02 %). Other significantly loaded lines include H3G (Oshogbo-Ganmo, 105.14 %) and K7W (Oke Aro-Ikeja West, 112.73 %), all of which exceed acceptable thermal limits and signal potential congestion points. These critical corridors constitute the primary transmission backbones linking major generation centers in the southwest to load centers in the north and southeast, making them highly susceptible to overload and voltage instability.
The cumulative network losses under these conditions amount to 388.33 MW of active power and 980.82 Mvar of reactive power
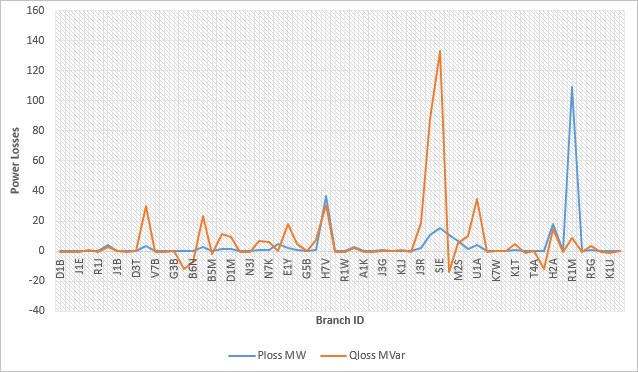
From Figure 3, the most critically overloaded lines in the base scenario R2A (Oloronsogo–Ayede, 196.82 %), R1W (177.91 %), H2A (Ayede-Oshogbo, 176.11 %), H7V (Ihovbor-Oshogbo, 166.54 %), T3H (Onitsha–New Heaven, 162.64 %), N7K (Egbin–Oke Aro, 151.66 %), N6W (Mando-Kubomtso 147.23 %), and SIE (Jos-Gombe143.02 %) experienced substantial improvement after SVC integration. In the compensated network, the remaining overloaded elements are limited to H2A (Ayede–Oshogbo, 166.36 %), T3H (Onitsha–New Heaven, 147.57 %), H7V (Ihovbor–Oshogbo, 121.66 %), R2A (Oloronsogo–Ayede, 118.04 %), and N7K (Egbin–Oke Aro, 102.30 %). This demonstrates that the SVC devices effectively alleviated congestion on several key transmission corridors, particularly those linking the southwestern generation clusters (Egbin, Oloronsogo, and Ihovbor) to major northern and southeastern load centers. The cumulative network losses under the post-compensation condition amount to 244.30 MW of active power and 416.19 Mvar of reactive power, representing a significant reduction from the 388.33 MW and 980.82 Mvar recorded under the base case. These improvements reflect the SVCs’ capacity to minimize reactive circulation, improve voltage regulation, and lower resistive losses along long-distance transmission lines
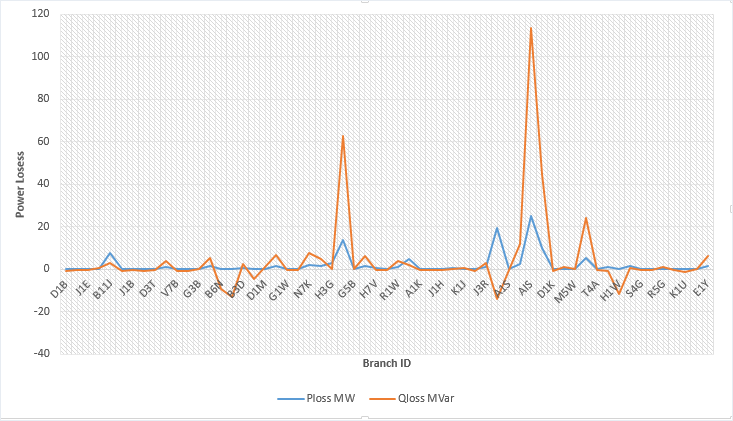
From Figure 4, the most critically overloaded lines in the base scenario R2A (Oloronsogo–Ayede, 196.82 %), R1W (Oloronsogo-Ikeja West, 177.91 %), H2A (Ayede-Oshogbo, 176.11 %), H7V (Ihovbor-Oshogbo, 166.54 %), T3H (Onitsha-New Heaven, 162.64 %), N7K (Egbin-Oke Aro, 151.66 %), N6W (Mando-Kumbotso, 147.23 %), and SIE (Jos-Gombe, 143.02 %) experienced substantial improvement following TCSC integration. In the compensated network, the remaining overloaded elements were reduced to only T3H (Onitsha-New Heaven), operating at 164.7%, and K1T (Shiroro-Katampe), at 139.15% loading. This reflects a significant reduction in congestion across the grid, demonstrating the TCSCs’ effectiveness in redirecting bulk power transfers and relieving stress on long-distance north–south and southwest–central transmission corridors.
The cumulative network losses under the post-compensation condition amount to 109.976 MW of active power and 252.234 Mvar of reactive power, representing a significant improvement compared to the base-case losses of 388.33 MW and 980.82 Mvar. These reductions reflect the TCSC’s ability to enhance transmission efficiency by reducing excessive current flows, mitigating reactive power circulation, and minimizing resistive losses along compensated corridors
4Conclusion
This study investigated the effectiveness of Flexible AC Transmission Systems (FACTS), specifically the Static Var Compensator (SVC) and Thyristor-Controlled Series Capacitor (TCSC), in mitigating transmission congestion and improving the performance of Nigeria’s 330 kV transmission network.
The base-case analysis recorded total active and reactive power losses of 388.33 MW and 980.82 Mvar, respectively, indicating significant transmission inefficiencies. Following SVC integration, active and reactive power losses decreased by 37.09% and 57.57%, respectively. TCSC integration achieved greater reductions of 71.68% in active power losses and 74.28% in reactive power losses. These results demonstrate the effectiveness of both devices in improving transmission efficiency and mitigating congestion under the operating conditions investigated.
TCSC exhibited superior performance in reducing system losses, highlighting its potential for controlling power flows and relieving congestion along critical transmission corridors. Conversely, SVC remains valuable for reactive power compensation and voltage regulation. Therefore, the strategic deployment of FACTS devices offers a promising approach to enhancing the operational performance of Nigeria’s 330 kV transmission network. Further studies incorporating voltage stability indices, bus-voltage profiles, contingency analysis, and economic evaluation are recommended to establish the optimal application of these devices under varying operating conditions.
References
- [1]Akinyele DO, Rayudu RK. Review of energy storage technologies for renewable energy integration and applications in Nigeria. Renewable and Sustainable Energy Reviews. 2019;81:1725–1737.
- [2]Abdelaziz AY, Mohamed ES, El-Metwally KA. Optimal power flow considering FACTS devices: A review. International Journal of Electrical Power & Energy Systems. 2020;1(7):105–104.
- [3]Kumar R, Sharma V. Congestion mitigation using UPFC in deregulated power systems. IET Generation, Transmission & Distribution. 2019;10(9):2261–2269.
- [4]Rajasekar S, Murthy CS. Particle swarm optimization-based TCSC placement in congested transmission networks. Applied Soft Computing. 2019;3(1):10–18.
- [5]Zhang L, Singh M, Khatod DK. TCSC placement for congestion mitigation using genetic algorithm. Energy Reports. 2019;5:103–112.
- [6]Abido MA. Power system stability enhancement using FACTS controllers: A review. The Arabian Journal for Science and Engineering. 2019;3(1):153–172.
- [7]Gupta A, Prakash R, Singh AK. Case study of coordinated FACTS deployment on India’s 765 kV system for congestion alleviation. International Journal of Electrical Power & Energy Systems. 2023;149:108233. https://doi.org/10.1016/j.ijepes.2023.108233
- [8]Sankar S, Raju GK. Power system analysis: Modeling, simulation, and congestion management using Newton-Raphson and FDLF techniques. International Journal of Electrical Engineering Education. 2020;57(1):34–49.
- [9]Jain A, Singh SK. Comparative performance analysis of power flow algorithms for contingency evaluation. Journal of Power System Simulation. 2022;10(2):93–105.
- [10]Transmission Company of Nigeria (TCN).. National grid infrastructure summary report. TCN Planning and Expansion Unit. 2023.