Renewable Energy Technology
Techno-Economic Analysis of Combined Biogas and Solar Photovoltaic Renewable Energy Options for On- and Off-Grid Systems in Abuja, Nigeria
1Gas Department, Ministry of Petroleum Resources, Abuja, Nigeria
2Institute of Biological and Environmental Sciences, School of Biological Sciences, University of Aberdeen, Aberdeen, United Kingdom
3Petroleum Midstream and Downstream Department, Ministry of Petroleum Resources, Abuja, Nigeria
Published October 2026
Abstract
This research investigates the techno-economic feasibility of biomass-based hybrid renewable energy systems for on- and off-grid connection in Abuja, Nigeria. The work aims to explore the use of renewable energy technologies to reduce the city’s increasing municipal waste volume, while also generating sustainable and affordable energy for a cleaner environment. The work involves pre-evaluation of potential renewable energy resources for biogas and solar radiation in Abuja. Hybrid Optimization of Multiple Energy Resources (HOMER) software was employed to provide a techno-economic analysis. The optimum grid-connected option used a 500 kW biogas power generator combined with a 291 kW photovoltaic array with a 0.063 $ kWh-1 cost of energy. The optimum off-grid option used a 500 kW biogas power generator, 432 kW photovoltaic array, 144 batteries strings with a 0.143 $ kWh-1 cost of energy. The grid-connected option showed a 56% decrease in the cost of energy over the off-grid option and was 52% cheaper than the current conventional generated power tariff in Abuja of 0.130 $ kWh-1. This suggests that renewable energy could provide increased affordability for energy for the citizens of Abuja. The analysis also indicated that the grid-connected option had a net present cost of $2,682,808 compared to the off-grid option which had a 68% higher net present cost of $4,507,376. The grid-connected option generated 4% of annual power demands of Abuja with 83% renewable energy penetration while the off-grid option generated 5% of the annual load, thereby supporting the United Nations Sustainable Development Goal 7 of affordable, reliable and modern energy access. It is concluded that integration of biomass-based energy technologies into a grid-connected hybrid renewable energy system not only reduces the volume of municipal solid waste but is also capable of contributing to the sustainability of energy provision in low-income countries, especially in sub-Saharan Africa.
Keywords: anaerobic digestion; biogas; biomass; photovoltaic; hybrid renewable energy system; techno-economic analysis
1Introduction
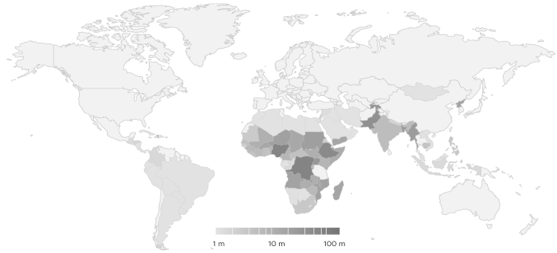
Energy for electricity, transport and cooking influence most aspects of daily life because most human, social and economic activities are driven by energy availability (Best and Burke, 2018). According to World Energy Outlook of International Energy Agency (IEA, 2020), in 2019, approximately 7.7 × 10⁸ people, equivalent to about 10% of global population, lacked access to electricity. A higher proportion of this population live in developing countries, especially in sub-Saharan Africa (SSA) with ~75% of the population without electricity (Figure 1; IEA, 2020). It is also estimated that 90% of the ~6.5 × 10⁸ world population without electricity access in 2030 will be in SSA (Chirambo, 2018). Affordable, reliable and modern energy access constitutes the major aim of Sustainable Development Goal (SDG) 7 of the United Nations (UN) energy mission. Regional electrification projects focusing on SSA are urgently needed to reach this goal.
Energy generation from renewable technologies has increased global market penetration due to its ability to meet the power demands of various sectors. In 2019, renewables were globally contributing 26% of cooling/heating, 10% electricity and 3% transport fuels, with great potential for expansion (Murdock et al., 2019). By 2026, the capacity of renewable electricity generation globally is estimated to grow by over 60% compared to 2020 levels, by 4,800 GW, equivalent to the total capacity of current global fossil fuel power generation (IEA, 2022). A study by Thambi et al. (2018) suggests that about 11% of carbon dioxide (CO2) emissions from the energy sector, equivalent to 3.75 × 10⁸ t, could be saved if 45% of renewable energy penetration was achieved globally by 2030 (Thambi et al., 2018). In addition, renewable energy development can also contribute to infrastructure development, employment opportunities, energy security and access to health facilities, all common challenges in developing countries (Candia et al., 2019; Bala and Siddique, 2009; Kanase-Patil et al., 2011). This growth is driven by strong support from government renewable energy policies and clean energy goals as set prior to and during the UN climate change conference (COP26) (Mountford et al., 2021). Technological advances and favorable policies on renewables by different national governments are reducing the high initial cost of renewable energy generation, making it more affordable in SSA. This is particularly important in Nigeria where the population is undergoing an exponential growth, associated with increases in economic activities, resulting in increasing energy demand.
Primary methods of achieving energy access have focused on grid power extension and diesel generators (Almeshqab and Ustun, 2019), but these methods have limitations in addressing the challenges in the developing countries (Mukhtar et al., 2021; Cook, 2013; Ahlborg and Hammar, 2014). Renewable energy resources, such as the increasing amount of municipal solid waste (MSW), have potential to contribute to meeting these increasing demands (Charles, 2014; Connolly and Mathiesen, 2014). The organic fraction of MSW (OFMSW), if used for biogas production by anaerobic digestion (AD), could significantly reduce greenhouse gas emissions while also affordably contributing to the national grid power supply. Different studies have suggested distributed Hybrid Renewable Energy Systems should be adopted to achieve higher energy access in developing countries (Shezan et al., 2018; Eras-Almeida and Egido-Aguilera, 2019). These are multi-component energy systems, characterized by a range of generating units integrated with storage devices and fueled either by renewables, fossil fuels or a combination of the two (Yimen et al., 2020). An appropriate power control unit is used to connect the power generating sources to single direct current (DC) or alternating current (AC) points. These points transmit the generated power to the target loads or save it for later use in an energy storage device, such as a battery, fuel cell or ultra-capacitor (Chauhan and Saini, 2014). Increases in Hybrid Renewable Energy System penetration, could further help solve intermittent power availability, contribute to reliable power supply, reduce generation cost and improve overall system performance (Malik et al., 2020).
Despite numerous benefits, Hybrid Renewable Energy System development has faced economic, technical, social and political challenges in recent decades. These include funding frameworks impacted by stringent organizational requirements and adverse environmental policies, installation and operational costs, lack of awareness and local expertise, demographic changes, poor investment returns, low power generation, transmission problems and lack of investors (Raman et al., 2012; Bhattacharyya, 2013; Dorji et al., 2012).
However, most of the existing literature suggests that a major limitation is the need for power storage equipment, which is responsible for high overall project costs (Lian et al., 2019; Bhandari et al., 2015; Bajpai and Dash, 2012; Krishna and Kumar, 2015). Therefore, systems aim to limit storage size to reduce overall system costs.
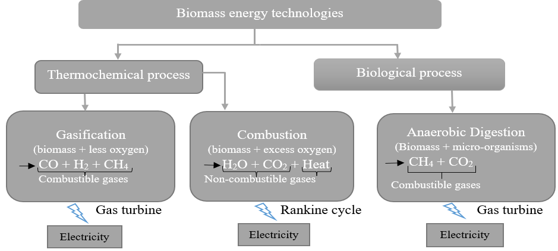
Biomass-based Hybrid Renewable Energy Systems, with lower generation and investment costs, are currently leading options for SSA (Sansaniwal et al., 2017). Biomass can be used for energy generation by two different processes, biological and thermochemical energy conversion (Figure 2; Yimen et al., 2021; Situmorang et al., 2020; Nunes et al., 2017). The costs associated with different designs of Biomass-based Hybrid Renewable Energy Systems in SSA require further study. Therefore, the research presented in this paper aims to explore the potential use of biomass-based Hybrid Renewable Energy Systems to reduce the increasing MSW volumes in cities in SSA, while also providing a sustainable and affordable source of energy. The study focuses on the example of the energy supply in Abuja, Nigeria, and is the first study to explore integration of AD fed by OFMSW into a Hybrid Renewable Energy System in SSA. We consider the impact on capital cost and the affordability of energy generation, and compare the techno-economic feasibilities for grid and off-grid-connected options.
2Study materials and methods
2.1Project location and constraints
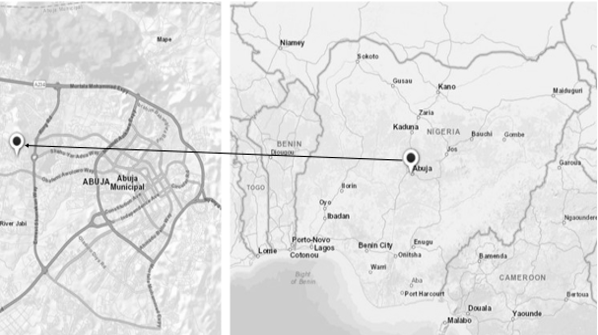
The research was carried out using data from Abuja city, with a population of 1,072,810 (NBS, 2020), located at latitude 09o 05ʹ 29.28ʺ N and longitude 07o 26ʹ 55.43ʺ E, geographically (Figure 3). This study focus is to design hybrid renewable energy system that would use OFMSW as feedstock, and the system will be constrained by the geography of waste collection and the amount of waste. The design is scaled up by more than one system in place and use about half of the produced waste. The system electricity generation is designed to serve Abuja locality of ~400 households with about 2,240 kWh daily electricity consumption.
2.2Selection of software for energy system analysis and load evaluation
The research was carried out using the Hybrid Optimization of Multiple Energy Resources (HOMER) Pro software, designed by the National Renewable Energy Laboratory (NREL) in the US in 1992. The HOMER tool can perform Hybrid Renewable Energy System simulation, optimization and sensitivity analysis with demonstrable high user friendliness (Table 1; HOMER Energy, 2021). It simplifies the task of designing both grid and off-grid-connected power systems, analyzes possible energy resource combinations and determines the least cost system (Sinha and Chandel, 2014). In this work, HOMER Pro Edition version 3.14.5 was used as it has an integrated technological and components library suitable for Hybrid Renewable Energy System modelling.
Studies into biomass-based Hybrid Renewable Energy Systems have increased over the past decade with the development of many using simulation tools, which bring together software for design, optimization and analysis of technical and economic viability (Sinha and Chandel, 2014). Table 1 shows an overview of different hybrid system simulation tools available. The HOMER tool is becoming widely used because decisions about the system configuration, such as best components for the system, most efficient quantity and size of each component, options for different technologies, variations in costs and availability of energy resources, are easily evaluated using the HOMER algorithms (Sinha and Chandel, 2014). Previous application of HOMER in low to middle income countries are summarized in Table 2.
| Software tools | Input of data in time series format | Design optimization | Biogas model option | CO2 analysis | Net metering | User friendliness |
|---|---|---|---|---|---|---|
| HOMER | Y | Y | Y | Y | Y | High |
| HYBRID2 | N | N | N | N | N | Medium |
| TRNSYS | N | Y | N | N | N | Medium |
| i-HOGA | Y | Y | N | N | Y | Low |
| RETScreen | N | Y | N | Y | N | Low |
Note: Adapted from Malik et al. (2020). Y: yes; N: no.
| Location | Application | Source |
|---|---|---|
| South-Eastern Nigeria | Photovoltaic/Biomass/Battery systems designed to provide small community-based electricity and ~333 liters potable water | Eziyi and Krothapalli (2014) |
| Karnataka, India | Biomass-based Hybrid Renewable Energy Systems for power generation in off-grid villages | Suresh et al. (2020) |
| Himalayas, West India | Biomass-based Hybrid Renewable Energy Systems in educational institutes | Malik et al. (2020) |
| Kallar Kahar, Pakistan | Grid-connected Biomass/Wind/Photovoltaic system | Ahmad et al. (2018) |
| India | Off-grid Biomass/Wind/Photovoltaic/Battery system in villages | Balamurugan et al. (2009) |
| Fars Province, India | Off-grid Biomass/Wind/Photovoltaic/Battery Hybrid Renewable Energy System design analysis | Jahangir et al. (2020) |
| Carabao Island, Philippines | Multi-objective stochastic design for Biomass/Wind/Photovoltaic system | Li et al. (2019) |
| Djounde, northern Cameroon | Photovoltaic/Wind/Biogas/Pumped-hydro off-grid Hybrid System for rural electrification | Yimen et al. (2018) |
The HOMER tool was selected for this work for the following reasons:
- Ability to handle much denser simulations than other systems (Malik et al., 2020);
- Wide range of different previous applications comprising of both grid-connected and off-grid systems (Sinha and Chandel, 2014);
- Techno-economic evaluation of the scenarios using limited data (Mishra et al., 2016);
- Capability to determine the effects of uncertainties in input variables (Malik et al., 2020).
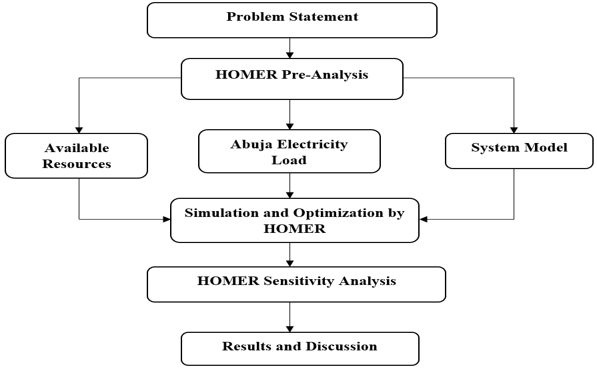
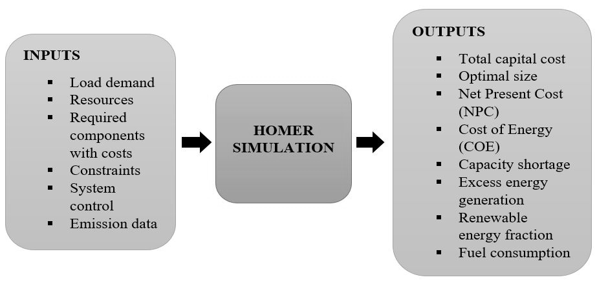
The methodology used is simply illustrated in Figure 4. The three-step process of the HOMER workflow, which involves data input, simulation and output of analytical variables, as depicted in Figure 5. The study will provide a pre-analysis of Abuja city energy resource availability, electricity load and project siting which constitute input data for the HOMER calculations. Data on MSW was collected from the Abuja Environmental Protection Board (AEPB), population data was obtained from the Nigerian National Bureau of Statistics (NBS), and Abuja city primary electricity load with current tariff were obtained from the Nigerian Electricity Regulatory Commission’s (NERC) website. Data on the solar global horizontal irradiance (GHI) at the project location was generated by HOMER from the NREL database. Other secondary data, such as component costs, were obtained from relevant market websites by google search. The data were pre-analyzed to provide specific HOMER input requirement for the calculation.
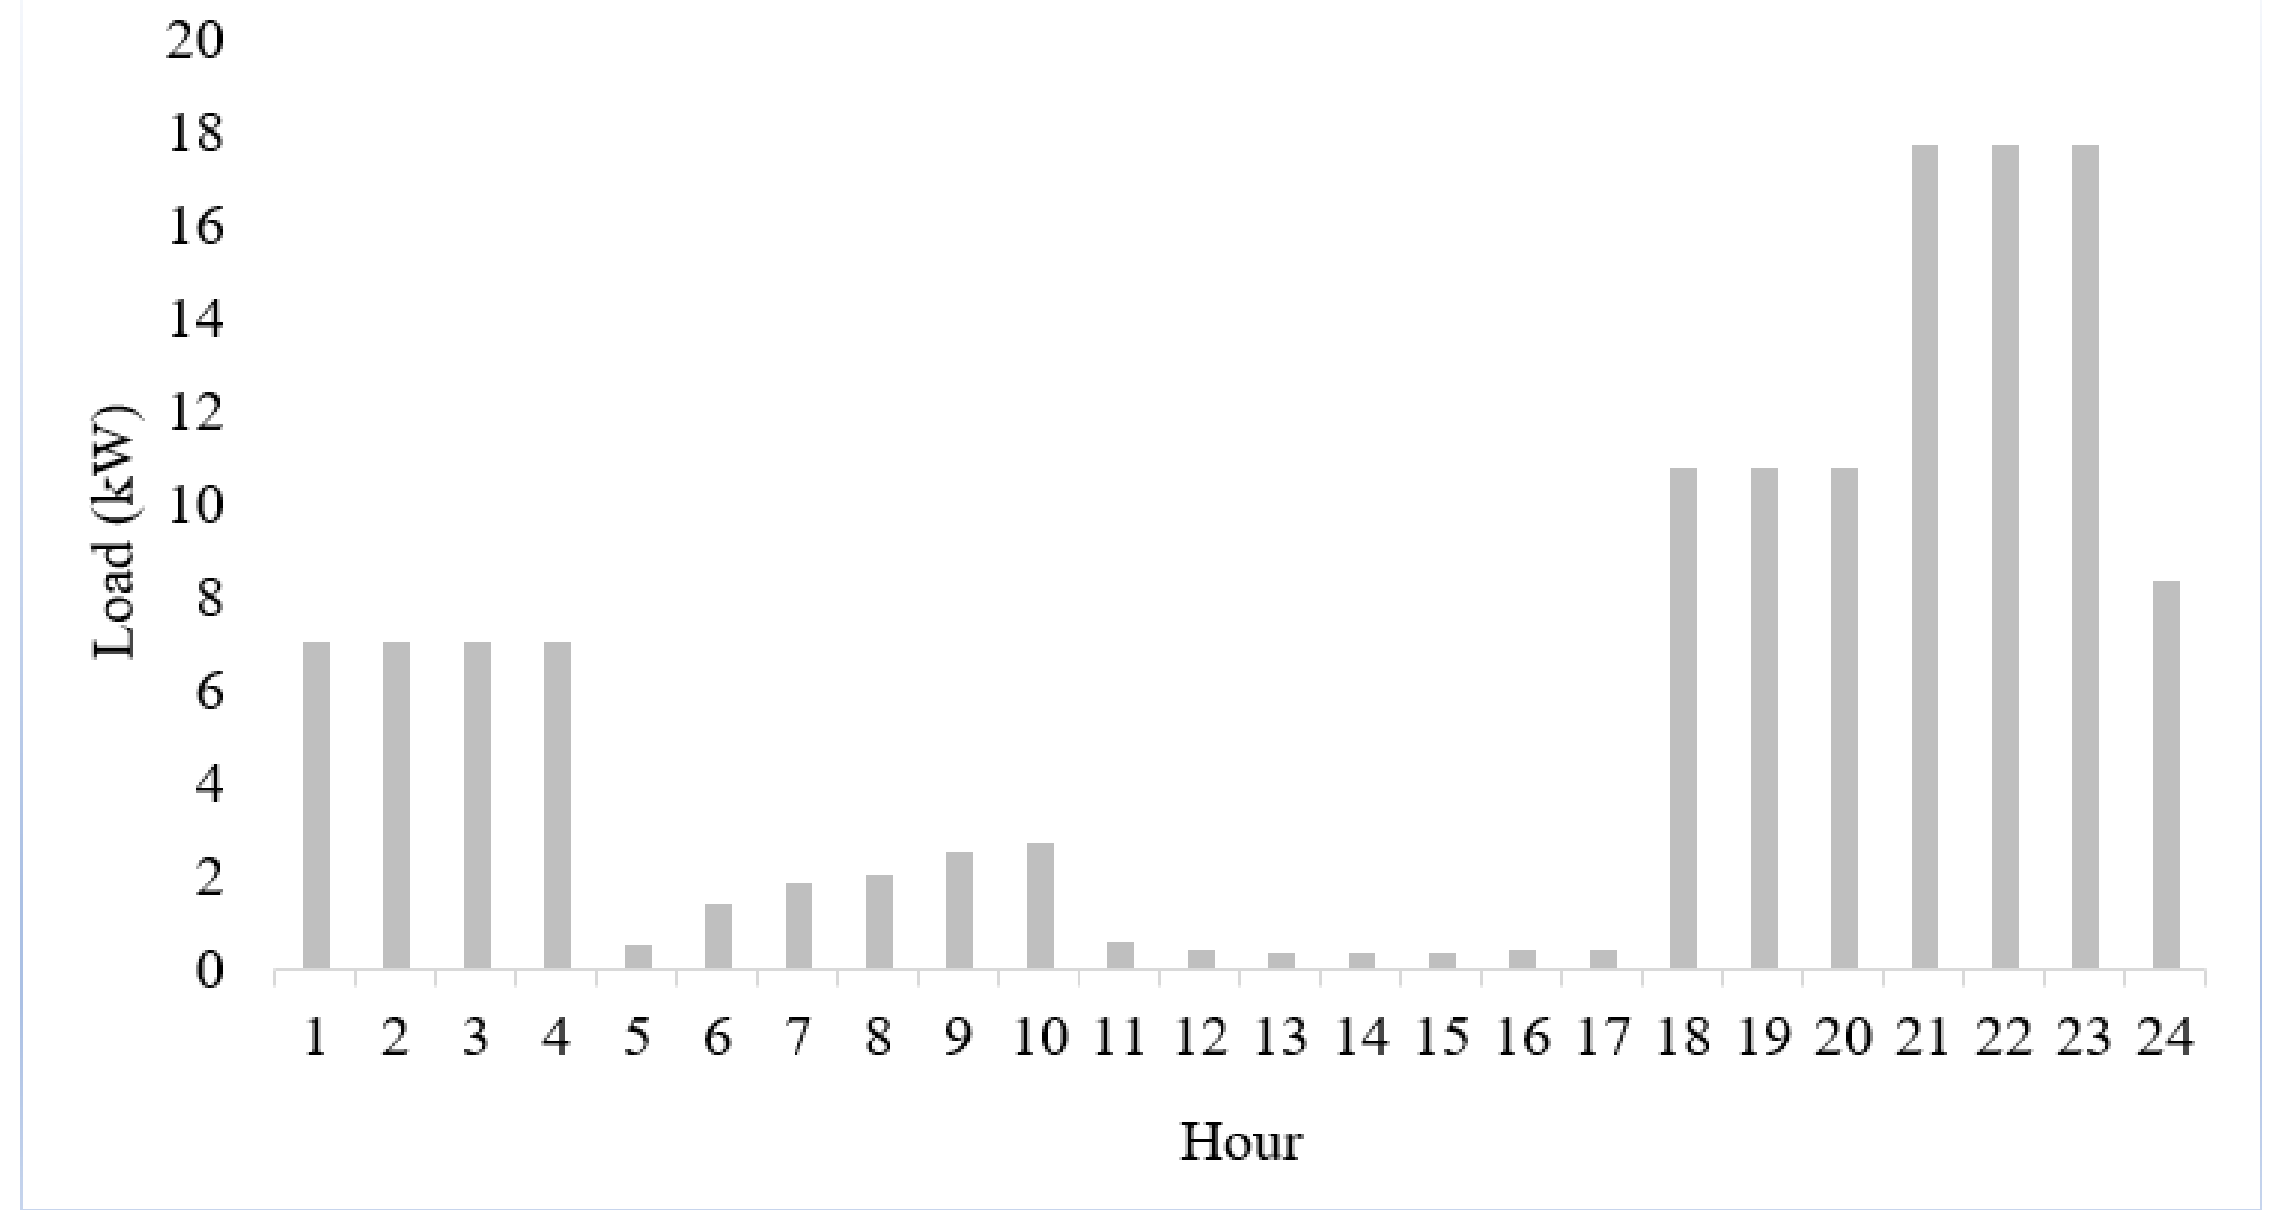
To provide HOMER data input for the simulations, the study considered two types of power loads; primary and deferrable loads. Primary load is a basic electricity need that must be met in a given period of time. This includes demands such as lighting and motor applications. Primary load data was obtained from data on residential load provided by NERC (2020) (Figure 6). Deferrable load (Figure 7) is the electrical need that can be met in a flexible time period. This includes demands such as water pumps for irrigation. Deferrable load data was also obtained from NERC (2020).
A random variation each day of 10% in demand and 20% in the size of hourly time-step was used to provide a more realistic electricity load profile for the city (Dash et al., 2018; HOMER Energy, 2018). The supply voltage variation was applied as an increase or decrease in power amplitude with regard to its nominal value; this was done automatically within the HOMER software with 10% variation applied to the daily supply, and 20% variation applied to the timing of the supply through the day. The peak demand needed to cover regular and irregular parametric operations was calculated from the annual average primary load of the city, (kW d-1), and the efficiency of electrical energy usage, known as the load factor, (proportion),
The annual average primary load per household of the city () was 2,240 kWh d-1 (NERC, 2020). This is equivalent to 93 kW d-1 for the city. The load factor, (no units), (Yimen et al., 2021; HOMER Energy, 2021), was calculated as
where is the average daily electrical energy usage (5.6 kWh; NERC, 2020) and is the maximum daily electrical energy demand (30.2 kWh; NERC, 2020).
This gives a value of of 5.6 / 30.2 = 0.19. The peak demand to cover regular and irregular parametric operations was, therefore, 93/0.19 = 491 kW d-1. The minimum size of generator considered in the simulation was rounded up to 500 kW.
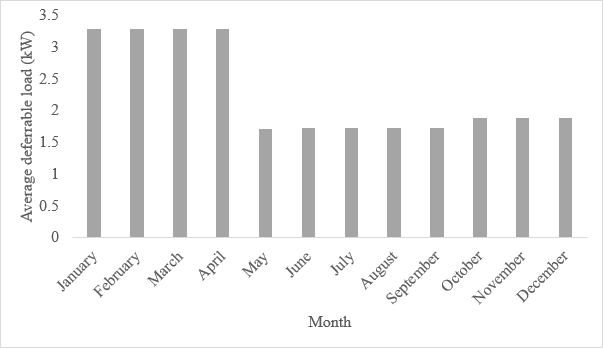
The Abuja city deferrable load input data per household shown in Figure 7 (NERC, 2020) averaged over the year is 55 kWh d-1, equivalent to 2.3 kW d-1 as the rated baseline deferrable electricity demand each month (Figure 7). Minimum time required to meet deferrable load was assumed to be 40% of each day, so is 40% × 24 hours = 9.7 hours (HOMER Energy, 2021). Therefore, on average, the power required to serve the deferrable load (peak load) is 2.3 kW × 9.7 h = 22 kW each month. The deferrable load input data varies according to season (Figure 7); 3.29 kW d-1 for January-April, 1.89 kW d-1 for October-December and 1.73 kW d-1 for May-September (NERC, 2020). This is because water pumping requirement in Nigeria is higher during the dry season (October-April) than in the rainy season (May-September) when precipitation supports water demands. This gives the monthly power required to serve the deferrable load of 32 kW for January-April, 18 kW for October-December and 17 kW for May-September. Note that because the deferrable load is usually secondary priority without specific serving time and the evaluated capacity is only drawn when the system generates excess power or when the storage tank is empty, the deferrable load does not add to generator size (HOMER Energy, 2021).
2.3System components
The schematic designs compared on-and off-grid hybrid renewable energy systems (Figure 8). The grid-connected system includes biogas power generator (BPG) and photovoltaic (PV) arrays in addition to the grid supply, while the off-grid system is limited to BPG and PV. Other integrated system components were the batteries to provide excess power storage from the intermittent supply by renewable energy resources and the power conversion system, all regulated through the control station.
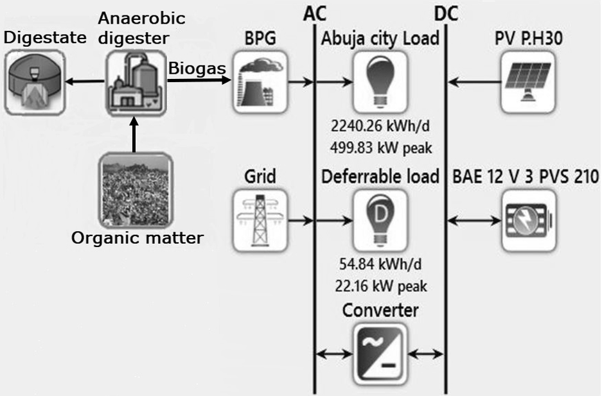
The electricity load is normally connected to an AC-bus route and therefore the design system needs a converter which changes the DC output from high voltage sources of battery and PV units to fit into AC power load. The solar system is dependent on the diurnal cycle, which makes it a periodic energy source that must be backed-up with a storage device. The grid system in Nigeria is usually unreliable as grid power failure is common (Mukhtar et al., 2021; Charles, 2014). Therefore, the biogas generator serves as the main power source supported by the combined PV, grid and battery sources, aimed at providing round-the-clock power supply in the city.
2.3.1Biomass-based power generation
The biomass resource considered as the feedstock for BPG was OFMSW. The electrical potential of the BPG was calculated as:
where is the total electrical potential by the biogas power generation unit (kWh), is the proportion of efficiency of conversion of energy in a large generator (assumed to be 0.4 for high efficiency centralized generators; Tafdrup, 1995), is the energetic potential of methane (MJ m-3) (assumed to be 36 MJ m-3 under standard conditions; Cuellar and Webber, 2008), and is the volume of methane produced (m3 d-1). The volume of methane produced is assumed to be 60% of the biogas production rate, (m3 d-1) (Vogeli et al., 2014), calculated using equation 4.
where was calculated for Abuja city by Dickson et al. (2023) to be 3.06 × 10⁶ (±2 × 10⁵) m3 y-1 (= 8.4 × 10³ (±6 × 10²) m3 d-1).
2.3.2Photovoltaic array power generation
The study assumed a Huawei SUN2000 30kW generic flat-plate panel type PV (PV P.H30) based on model availability of 550 kW rated capacity specified as suitable for typical large hybrid energy systems (HOMER Energy, 2021). The module was assumed to be fitted at the DC power bus of the system. The power output of the PV array, (kWh), was estimated in HOMER using the equation provided by Honnurvali et al. (2018)
where is the PV power rating (550 kW), is the derating factor (proportion assumed to be 0.96 after Honnurvali et al., 2018), is the incident solar radiation (kW m-2), is the standard incident solar radiation at 25°C (kW m-2), is the temperature coefficient (-0.0041 °C-1 from manufacturer specifications), (°C) is the PV cell temperature and is the PV cell ambient temperature at standard conditions (25°C; HOMER Energy, 2021).
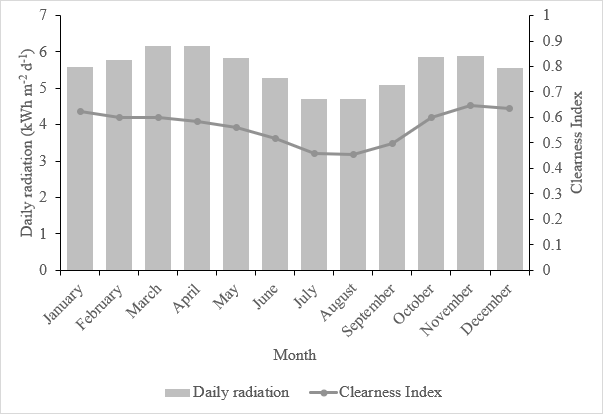
HOMER generated hourly global radiation () from monthly averages by applying the Holland and Graham algorithm (Halabi and Mekhilef, 2018). Data on solar radiation potential and clearness index in Abuja used to generate and were downloaded directly from the NREL database. Solar radiation in Abuja ranges between 4.8 and 6.4 kWh m-2 d-1 (Figure 9).
The PV cell temperature () was estimated as
where is the proportion of PV array solar transmittance, is the proportion of PV array solar absorptance, with assumed to be 0.9 (Duffie and Beckman, 1991), is the coefficient of heat transfer to the surroundings (kW m-2 °C-1) and is the proportion of electrical conversion efficiency (0.173) from manufacturer specifications.
The coefficient of heat transfer () was estimated as
where is the nominal operating temperature (45°C from manufacturer specifications).
2.3.3Battery storage
Batteries are the most often used energy storage devices in hybrid renewable energy systems, especially lead-acid deep-cycle batteries considered to as the most commonly available and lower cost compared to lithium batteries. However, it is important to examine the charge and discharge specifications of the batteries to enable decisions on optimum number required. This work assumed BAE Secura PVS Kinetic Batteries with specifications of 12 V nominal voltage, 201 Ah maximum capacity and 2.41 kWh nominal capacity at 0.245 capacity ratio. This is considered to be the optimal solution currently available for reliable and robust storage for regenerative energy under extreme industrial conditions (Yimen et al., 2021). It is specially designed with tubular electrodes for high security and reliability as well as high cycle lifetime. Other properties include roundtrip efficiency of 85%, maximum charge and discharge current of 68.4A and 342A respectively at maximum charge rate of 1A per Ah and a rate constant of 2.09 (1 h-1) (from manufacturer specifications).
In HOMER, the simulation process uses the specified system configuration, while the optimization process determines the possible best feasible system configuration. The optimum number of batteries required in the storage bank, , was calculated by the optimization process using equation 8 (HOMER Energy, 2021),
where is the storage battery life (18 years from manufacturer specifications), is the lifetime throughput of a single storage unit (kWh), and is the power throughput for each battery (kWh y-1). The value of was calculated as the total amount of power generated each year by the components of the system that could be stored as,
where is the total electrical potential by the biogas power generation unit (obtained from equation 3) and is the power output of the PV array (obtained from equation 5), both in kWh. The value of for an individual battery was determined as,
where is the nominal capacity (2.41 kWh, from manufacturer specification), is the roundtrip efficiency (0.85 as a proportion of total efficiency, from manufacturer specification), and is the battery depth of discharge (0.7 as a proportion of total battery charge, from manufacturer specification).
2.3.4Converter
The system requires a converter to maintain the flow of electrical power between AC and DC components. A system converter with capacity 25% greater than the power generator size is recommended to allow for potential power surges (Honnurvali et al., 2018). The smallest available size of converter that provides this capacity is 630 kW (1.25 × 500 kW power generator = 625 kW), so a 630 kW converter was assumed. The converter was integrated with an inverter parallel to the AC generator and a rectifier for bi-directional AC-DC power conversion. The inverter and rectifier efficiencies were both assumed to be a ratio of 0.95 with a 100% relative capacity and a 15-year lifetime (from manufacturer specifications; HOMER Energy, 2021). The efficiency of the converter, (0.95, HOMER Energy, 2021), also referred to as power factor applicable to both inverter and rectifier, was used to calculate the optimum converter power in-flow capacity, (kW) in consideration to the system power generator with highest conversion efficiency (Dash et al., 2018), expressed as
where is the energy capacity of the system converter (630 kW).
2.4Economic evaluation of system performance
The standard criterion for Hybrid Renewable Energy System feasibility assessment in HOMER Pro is the net present cost, ($). All feasible component combinations of the system are evaluated by HOMER based on the system and the cost of energy, ($). The value of is the total discounted value (determining process of present value of all future payments, i.e., nominal cash flow discounted to year zero) of all expenses and revenues of the system (Sanjay et al., 2021).
where is the system total annual cost ($ y-1) and is the capital recovery factor.
The capital recovery factor () converts the present value into an annual uniform cash-flow series over the lifetime, (y), of the project at a given discount rate, (%).
In this analysis, the lifetime of the project was assumed to be 25 years and the discount rate was estimated as,
where is the nominal interest rate assumed to be 12.5% for Nigeria (NBS, 2020) and is the yearly inflation rate considered to be 11.25% for Nigeria (NBS, 2020).
The total system costs () (equation 13, Yimen et al., 2021) include the capital cost of the generator (), the replacement cost (), the operation and maintenance costs () and the fuel cost (), while the revenues include the salvage value of the system (), all in $ y-1,
HOMER calculated the cost of energy () as the ratio of the total system annualized expenses to the total annualized served energy output (HOMER Energy, 2021; Dash et al., 2018), expressed as,
where is the total served power load by the system from both and , (kWh y-1).
2.4.1Biomass-based power generation
The was estimated from the total size of biogas power generator, (kW), and the capital cost of a generator per kW, ($ kW-1),
As discussed in section 2.2, the on-and off-grid systems in this work assumed a BPG with = 500 kW default size. The capital cost of the 500 kW BPG generator () was assumed for both grid and off-grid systems to be equivalent to the capital cost of a conventional diesel generator, = ~$24 kW-1 (Al-Najjar et al., 2022), giving a total BPG of $12,000.
The BPG was assumed to be $10,000 because manufacturers offer a 16.7% re-order discount rate (Al-Najjar et al., 2022).
The BPG was assumed to be $0.20 per operating hour, with generic manufacturer specifications of a life expectancy of 20,000 hours, at a 50% minimum load ratio (Yimen et al., 2021; HOMER Energy, 2021). HOMER calculates the total for the BPG entire lifetime by multiplying the per hour operating cost with life expectancy ($0.20 × 20,000 hours) (HOMER Energy, 2021).
The biomass price was used in HOMER to estimate the annual fuel cost () (HOMER Energy, 2021), as
where is the average biomass cost (assumed to be 25 $ t-1 as this is the cost of processing OFMSW in Abuja; AEPB, 2020), is the annual mass of feedstock available, estimated from a daily rate of 1.95 × 10² t d-1 (AEPB, 2020), giving an annual value of 7.12 × 10⁴ t y-1.
The salvage value provided by the system (), is the remaining value of the system components at the end of the project lifetime. It is assumed by HOMER that the value accrual at the end of lifetime of the project depends on replacement cost () (HOMER Energy, 2021), and is calculated as
where is the remaining life of the component at the end of project (y) and is the lifetime of the component (y). The remaining life of the component is estimated as
where is the project lifetime (assumed 25 years) and is the last time the component was replaced (y), based on the manufacturer’s specified component lifetime in a project lifetime as
The lifetime of the BPG () was assumed to be 20,000 hours (from manufacturers specifications) equivalent to 2.3 years.
2.4.2Photovoltaic array power generation
The PV panel’s and were both assumed to be $1,900 per 25 kW unit capacity with a manufacturer specification of lifetime of 25 years.
The of the PV panel was assumed to be $10 kW-1 y-1 (Yimen et al., 2021).
The fuel costs are zero for a PV array.
The salvage value (), was calculated assuming for PV is 25 years from manufacturer specifications (HOMER Energy, 2021), with an estimated 1 year .
2.4.3Battery storage
The battery’s and were both considered to be $1,200 assuming an optimum string size of 6 × 12V (72V) connected at the DC bus (Yimen et al., 2021), with the manufacturer specification of 18 years lifetime (HOMER Energy, 2021).
The and fuel costs are zero for battery string.
The salvage value (), is calculated assuming 18 years battery string from manufacturer specifications (HOMER Energy, 2021), with an estimated 1.4 years .
2.4.4Converter
The converter’s and were both assumed to be $4,800 per rated capacity (Yimen et al., 2021), with the manufacturer specification of 15 years lifetime (HOMER Energy, 2021).
The and fuel costs are zero for converter.
The salvage value (), was calculated assuming 15 years converter from manufacturer specifications (HOMER Energy, 2021), with an estimated 1.7 years .
2.4.5System constraints
Two constraints were included to determine the optimum configuration; capacity shortage and operating reserve. Capacity shortage was assumed to be 1%, meaning that any system configuration without capacity to meet up 99% of annual load and operating demands was discarded. Operating reserve provides additional system resilience for unexpected operational fluctuations in power generation. In this work, the operational reserve percentage for annual peak load was assumed to be 15%, current time step load was 10%, BPG output was 50% and solar PV output was 20% (Yimen et al., 2021).
2.5The grid
The grid is important in the power generation system because it provides a stable avenue for electricity transaction, where power can be sold-to and bought-from. The generating electricity is sold to the grid and bill paid through net-metering as return on investment and electricity is purchased from the grid to feed the Hybrid Renewable Energy System during capacity shortages. This is referred to as the grid power prices such as the demand and sellback rates. This work considered a simple grid power demand rate at 0.130 $ kWh-1 (NERC, 2020) and sellback rate at 0.05 $ kWh-1 (NERC, 2020), which constitute the grid-connected economic requirement. This enables the simulations of the systems with and without the grid for comparison of the technical and economic variations as aimed in this research.
2.6System optimization variables and search space
The HOMER software automatically evaluates all possible values and combinations of variables within a specified search space. It finds the optimum value of each variable based on system configuration with lowest net present cost () and lowest cost of energy () consecutively. The rationale for the choice of minimum and maximum sizes were described for BPG in section 2.2, PV in section 2.3.2 and converter in section 2.3.4. The on-grid option limits the maximum size of bi-directional converter which potentially increases with increasing number of batteries to 630 kW by activating the optimizer setting only, since battery requirement is limited here by choice of load following dispatch strategy. However, in the off-grid option both optimizer and search space were activated with increased of number of configurations to 11 to allow for optimization of number of batteries required to support stand-alone system output. This increased the maximum converter size to 900 kW. The range of the variables optimized in the study are summarized in Table 3.
| Optimization variables | BPG size (kW) | Solar PV array size (kW) | Number of battery strings | Bi-directional converter size (kW) |
|---|---|---|---|---|
| Minimum | 500 | 0 | 0 | 0 |
| Maximum (on-grid) | 610 | 550 | 450 | 630 |
| Maximum (off-grid) | 610 | 550 | 450 | 900 |
| Step | 16 | 55 | 90 | 90 |
The values of for all variable combinations were calculated using two dispatch strategies of (1) load-following (allows the generator to dispatch only to meet net load) and (2) cycle-charge (allows the generator to meet net load as well as maximally charging batteries). This was done for both on-grid and off-grid options. The grid-connected option search space values were 8 for BPG sizes, 11 for PV array sizes, 6 for battery strings, 8 for converter sizes and two dispatch strategies giving 8 × 11 × 6 × 8 × 2 = 8,437 configurations. The off-grid option values were 8 × 11 × 6 × 11 × 2 = 11,429.
3Results and discussion
3.1Results of optimal system design
The techno-economic features of the top four feasible configurations for grid-connected and off-grid systems, based on and , are presented in Tables 4 and 5, respectively. The on-grid configurations in order of most optimal systems (Table 4) were (1) BPG / PV / Converter, (2) BPG / PV / Battery / Converter, (3) BPG, and (4) BPG / Battery / Converter. The off-grid configurations in order of most optimal systems (Table 5) were (1) BPG / PV / Battery / Converter, (2) BPG / Battery / Converter, (3) BPG / PV / Converter, and (4) BPG.
| Most feasible Hybrid Renewable Energy System simulated | ||||||
|---|---|---|---|---|---|---|
| Specification | Units | 1 (Best) | 2 | 3 | 4 | |
| System architecture | BPG | kW | 500 | 500 | 500 | 500 |
| Solar PV array | kW | 291 | 299 | 0 | 0 | |
| Battery | No. | 0 | 6 | 0 | 6 | |
| Converter | kW | 31.3 | 34.1 | 0 | 4.08 | |
| Dispatch strategy | LF / CC | LF | LF | LF | LF | |
| Cost | $ kWh-1 | 0.0630 | 0.0632 | 0.0750 | 0.0753 | |
| $ | 2.68 × 10⁶ | 2.69 × 10⁶ | 3.02 × 10⁶ | 3.03 × 10⁶ | ||
| Total | $ y-1 | 7.05 × 10⁴ | 7.06 × 10⁴ | 7.99 × 10⁴ | 8.00 × 10⁴ | |
| Total | $ | 3.22 × 10⁴ | 3.99 × 10⁴ | 9.83 × 10³ | 1.71 × 10⁴ | |
| Energy production | BPG | kWh y-1 | 9.43 × 10⁵ | 9.43 × 10⁵ | 9.47 × 10⁵ | 9.47 × 10⁵ |
| PV array | kWh y-1 | 1.21 × 10⁵ | 1.21 × 10⁵ | 0 | 0 | |
| Total energy production | kWh y-1 | 1.06 × 10⁶ | 1.06 × 10⁶ | 9.47 × 10⁵ | 9.47 × 10⁵ | |
| Excess energy production | kWh y-1 | 4.04 × 10⁵ | 4.18 × 10⁵ | 0 | 0 | |
| Capacity factor | BPG | % | 21.5 | 21.5 | 21.6 | 21.6 |
| PV array | % | 4.74 | 4.62 | 0 | 0 | |
| Biomass summary | Total feedstock consumed | t y-1 | 2.95 × 10³ | 2.95 × 10³ | 2.96 × 10³ | 2.96 × 10³ |
| Average feedstock per day | t d-1 | 8.07 | 8.07 | 8.11 | 8.11 | |
Note: BPG = biogas power generator, PV = photovoltaic power panel, LF = load following strategy, CC = cycle charge strategy, = cost of energy, = net present costs, = costs of operation and maintenance, = capital costs, Columns 1, 2, 3, 4 represent the order of the most feasible system categories.
| Best feasible Hybrid Renewable Energy System simulated | ||||||
|---|---|---|---|---|---|---|
| Specification | Units | 1 (Best) | 2 | 3 | 4 | |
| System architecture | BPG | kW | 500 | 500 | 500 | 500 |
| Solar PV array | kW | 432 | 0 | 191 | 0 | |
| Battery | Number | 144 | 420 | 0 | 0 | |
| Converter | kW | 77.3 | 68.4 | 65.3 | 0 | |
| Dispatch strategy | LF / CC | LF | LF | LF | LF | |
| Cost | $ kWh-1 | 0.143 | 0.169 | 0.208 | 0.216 | |
| $ | 4.51 × 10⁶ | 5.31 × 10⁶ | 6.55 × 10⁶ | 6.81 × 10⁶ | ||
| Total | $ y-1 | 1.14 × 10⁵ | 1.27 × 10⁵ | 1.74 × 10⁵ | 1.81 × 10⁵ | |
| Total | $ | 2.16 × 10⁵ | 5.14 × 10⁵ | 2.49 × 10⁴ | 9.84 × 10³ | |
| Energy production | BPG | kWh y-1 | 1.39 × 10⁶ | 1.51 × 10⁶ | 2.16 × 10⁶ | 2.25 × 10⁶ |
| PV array | kWh y-1 | 1.04 × 10⁵ | 0 | 9.87 × 10⁴ | 0 | |
| Total energy production | kWh y-1 | 1.50 × 10⁶ | 1.52 × 10⁶ | 2.25 × 10⁶ | 2.25 × 10⁶ | |
| Excess energy production | kWh y-1 | 1.32 × 10⁶ | 6.74 × 10⁵ | 1.66 × 10⁶ | 1.41 × 10⁶ | |
| Capacity factor | BPG | % | 31.9 | 34.6 | 49.2 | 51.3 |
| Solar PV array | % | 2.75 | 0 | 5.89 | 0 | |
| Biomass summary | Total feedstock consumed | t y-1 | 4,370 | 4,751 | 6,757 | 7,050 |
| Average feedstock per day | t d-1 | 12.0 | 13.0 | 18.5 | 19.3 | |
Note: BPG = biogas power generator, PV = photovoltaic power panel, LF = load following strategy, CC = cycle charge strategy, = cost of energy, = net present costs, = costs of operation and maintenance, = capital costs, Columns 1, 2, 3, 4 represent the order of the most feasible system categories.
The best (lowest and ) options for both grid and off-grid Hybrid Renewable Energy Systems are shown in category 1 of Tables 4 and 5. The grid-connected option is a better system with lower of $2.68 × 10⁶ and of $0.063 per kWh compared to the off-grid option which had a higher of $4.51 × 10⁶ and of $0.143 per kWh.
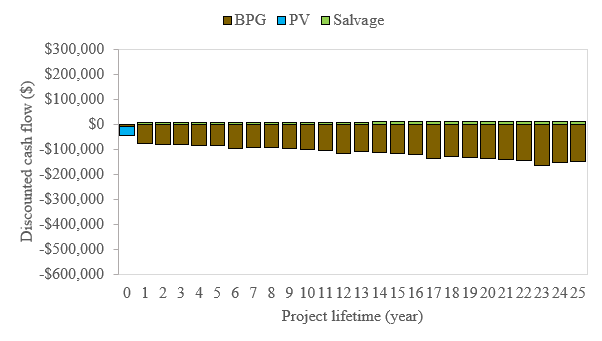
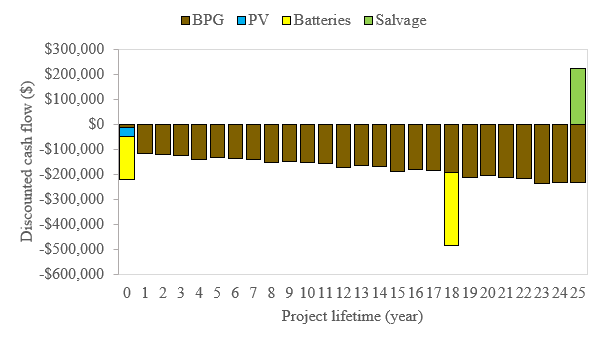
The discounted cash flows (determining the present value of all future payments i.e. nominal cash flow discounted to year zero) by components for the best grid-connected and off-grid systems are presented in Figures 10 and 11, respectively. The column bars show the year at which each cash flow occurs from the project start date. Cash flows in both options were mainly costs, therefore appear as negative values. Revenue from sale of power is not counted in the cash flows presented here because they will usually be adjusted to ensure at least break-even for the generating company. The costs in year 1 of the graphs suggest dominance of capital expenses of PV and BPG (and batteries in the off-grid system). Fuel, operation and maintenance costs occur each year. Also shown are the years of the component replacement costs; in the off-grid system, this occurs for batteries in year 18, but then also provides higher revenue as salvage at the end of the project. Salvage revenue occurs in the grid-connected system every year due to discounted cost of storage device eliminated by grid electricity supplies especially at the project start.
The overall fueling costs of the system over 25 years were estimated to be $2.77 × 10⁶ for the grid-connected and $4.11 × 10⁶ for the off-grid system. The fuel costs in the best configurations accounted for 92% of total cost in grid-connected option and 87% in off-grid option, significantly higher than the overall capital costs in each system, at $3.22 × 10⁴ and $2.16 × 10⁵ respectively. The overall capital cost for the grid-connected option was dominated (69%) by the PV array , while that of the off-grid option was dominated (80%) by of the battery devices. The grid-connected system had a significantly higher of $1.59 × 10⁵, dominated by the cost of purchasing power from the grid to balance supply (88%), while the off-grid system was lower at $3.95 × 10⁴ dominated by purchase of feedstock for the BPG (84%). Total component replacement for the lifetime of the grid-connected option at discounted rates was $5.11 × 10⁴, dominated by BPG (99%) with most of the remaining 1% being for converter replacement cost. The off-grid component replacement costs were higher, $3.69 × 10⁵, 80% of which was for the costs of replacing 144 batteries, 20% for BPG and 1% for the converter. Salvage values of the projects are excluded from this analysis of investment costs.
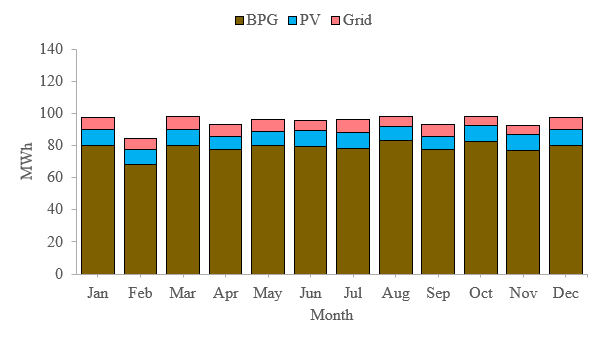
Figures 12 and 13 present grid-connected and off-grid monthly output of power generation from the proposed systems. The best grid-connected system had three main distributed power producers, comprising AD-based BPG with 9.43 × 10⁵ kWh y-1, PV array 1.21 × 10⁵ kWh y-1 and grid power purchases of 7.55 × 10⁴ kWh y-1. The off-grid system had only the BPG and PV array, accounting for 1.39 × 10⁶ kWh y-1 and 1.04 × 10⁵ kWh y-1 electricity outputs, respectively. The AD-based BPG generates 82.8% of the total energy produced by the grid-connected system, and 93% in the off-grid system. This makes it the major power producer in both systems; the PV array generated only 10.6% and 6.95% of total energy, respectively.
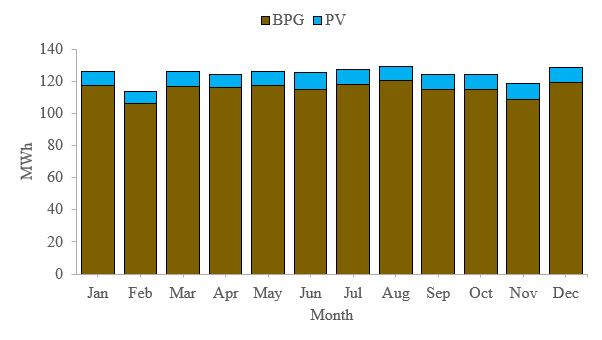
Excess energy output (surplus power generation by the system) for the grid-connected system was 4.04 × 10⁵ kWh y-1 and even higher for the off-grid system at 1.32 × 10⁶ kWh y-1, representing 35.5% and 88.1% of the total power outputs, respectively. The excess energy showed no unmet period-demand loads in either option; that is, the system met all primary loads and allowed batteries to be fully charged. Both systems produced maximally to meet target loads, as there was no power capacity shortage (power shortfall to meet demands) in the grid-connected system, and only 9.95 kWh y-1 (an insignificant 0.027 kWh) in the off-grid option which was complimented by the power storage device.
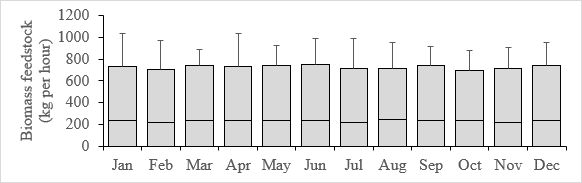
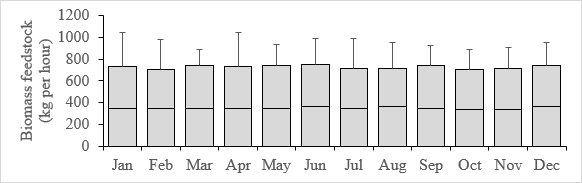
Figures 14 and 15 present the average per hour monthly consumptions of fuel for grid and off-grid systems respectively. The results suggest that fuel consumption is distributed evenly across months in both options. The grid-connected option had a total feedstock consumption of 2.95 × 10³ t y-1 with 3,537 annual operating hours, while off-grid option had 4.37 × 10³ t y-1 with 5,350 annual operating hours.
3.2Relevance of system comparison
The optimum configurations for the grid-connected option of the distributed Hybrid Renewable Energy System indicated a of 0.063 $ kWh-1, 56% lower than the off-grid system, which had a of 0.143 $ kWh-1. This is also 52% less than the current conventionally generated power tariff of 0.130 $ kWh-1 in Abuja (AEDC, 2020; Eziyi and Krothapalli, 2014). The grid-connected option will therefore provide improved affordability of energy for the citizens of Abuja; similar opportunities might be possible in other low-income countries. The optimum grid-connected option used 93.3% renewable energy, so supporting the UN clean energy mission (SDG7), which aims to achieve affordable, reliable and modern energy access. The higher for the off-grid system suggests addressing the city’s energy needs using a stand-alone renewable power system is not the best option.
Average annual availability of OFMSW in Abuja city was 9,664 t y-1 in 2020, but the optimum systems used only 2,946 t y-1 (~31%) in the grid-connected option and 4,370 t y-1 (~45%) in the off-grid option for the production of biogas, which in turn generated 83% and 93% of the total energy fraction in each option, respectively. These estimated feedstock fractions met the electrical load, with excess electricity generation resulting from a continuous supply from other integrated renewable sources estimated at 403,767 kWh y-1 for grid-connected option and 1,320,965 kWh y-1 for off-grid option. The energy generation from the grid-connected BPG was 942,633 kWh y-1 with total energy of 1,542,545 kWh y-1 including PV, excess energy and grid-contribution, while for off-grid BPG it was 1,395,877 kWh y-1 with total energy of 2,821,151 kWh y-1 including PV and excess energy. This suggests that using all of the OFMSW in the two systems could generate a total power of 3,491,576 kWh y-1 (equivalent to 3,492 MWh y-1) in the grid-connected option and 3,431,430 kWh y-1 (equivalent to 3,431 MWh y-1) in the off-grid option. The annual power generation potential from both options is therefore 4% of the total power requirement of Abuja city. Biogas use could also be extended for use as cooking, heating and transportation fuels, thereby contributing towards global access to cleaner energy. This is especially important in SSA, where 83% of the population lack access to clean energy (Yimen et al., 2021). The expansion potential of the energy production capacity using MSW and the economic benefits of the optimal Hybrid Renewable Energy System technology make this a feasible proposal in Abuja city.
The results of this study indicate that a Hybrid Renewable Energy System, using biomass integrated with the conventional energy generation system, has the potential to contribute to the city’s power demands, generating more affordable and clean energy. It could also contribute to global reduction of greenhouse gas emissions, decreasing Nigeria’s dependence on fossil fuels. The higher CO2 emissions reported in the grid-connected option (3.66 × 101 kg CO2e kg-1) compared to the off-grid option (3.64 × 101 kg CO2e kg-1) is associated with the fossil-fuel source of grid power purchases, but even this is insignificant (0.00019%) compared to current emissions from Abuja of 1.89 × 10⁷ kg y-1 (Emission database for global atmospheric research, 2020). This also contributes to the UN-SDG13 on sustainable mitigation of climate impacts by adopting Hybrid Renewable Energy System technology for power generation. Affordable energy access could improve life in Abuja by contributing to citizen business empowerment, innovations and skill acquisitions (UN-SDG9), thereby promoting sustainable development, creating employment opportunities and improving living standards (Bamisile et al., 2020; 2021). This study provides the first analysis of the potential of an AD-based Hybrid Renewable Energy System in Abuja city.
4Conclusion
This work has identified the optimum system configurations for Hybrid Renewable Energy Systems in Abuja, and estimated costs and power generation capacities of on- and off-grid systems. The grid-connected option used 83% renewable energy and was 52% cheaper than the current conventional generated power tariff in Abuja. The off-grid option cost 56% more than the on-grid system, with 68% higher . Both systems were capable of contributing to energy generation by Hybrid Renewable Energy System, providing ~4% of the Abuja city energy demand and significantly improving affordable power access while also reducing the volume of municipal solid waste that must be disposed of.
Acknowledgments
The authors thanked and acknowledged PTDF Nigeria for granting the research award and also thanked the management of Abuja Electricity Distribution Company (AEDC), Nigeria, for providing research data on Abuja electricity demands and consumption. The UK Natural Environment Research Council (UKERC) and UK Research and Innovation Energy Programme are also much appreciated for funding support.
Funding
Petroleum Technology Development Fund (PTDF), Nigeria funded the research as oversea PHD fully funded program with award number (PTDF/ED/OSS/PHD/EMD/1656/19), and The ADVENT and ADVANCES partly funded the project via UK Natural Environment Research Council (NE/M019691/1), EPSRC is funded by UKERC-4 and AH is funded by UK Research and Innovation Energy Programme grant number EP/S029575/1.
Author contributions
EMD: conceptualization, data collection, investigation, design, visualization, analysis, wrote the first original draft. UKG: data collection and contributed in improving the manuscript standard. JS and AH: design paper structure and methodology, and also supervised the research, formal analysis, reviewed and edited the writing. JS: final review and improved manuscript standard. All authors reviewed and approved the final version of the manuscript. Research grants awarded to ED and AH.
Conflict of interest
The authors declare no competing financial interest or personal relationship that seems to have influenced the reported work in this research. The PTDF Nigeria and UKERC were not involved in study design.
Data availability
Data is available on request.
References
- [1]Abuja Environmental Protection Board (AEPB) (2020). Data on solid waste collected by AEPB in Abuja city from 1998–2019 and waste characterization [unpublished data].
- [2]Ahlborg H, Hammar L (2014). Drivers and barriers to rural electrification in Tanzania and Mozambique – Grid-extension, off-grid, and renewable energy technologies. Renewable Energy, 61, 117–124.
- [3]Ahmad J et al. (2018). Techno economic analysis of a biomass/wind/photovoltaic hybrid renewable energy system for rural electrification: A case study of Kallar Kahar. Energy, 148, 208–234. https://doi.org/10.1016/j.energy.2018.01.133
- [4]Akanbi OA (2016). Spatial analysis of household size as a determinant of health status of rural areas of Federal Capital Territory, Nigeria. Global Journal of Human-Social Science, 16(1). https://globaljournals.org/GJHSS_Volume16/4-Spatial-Analysis-of-Household.pdf
- [5]Almeshqab F, Ustun TS (2019). Lessons learned from rural electrification initiatives in developing countries: Insights for technical, social, financial and public policy aspects. Renewable Sustainable Energy Rev, 102, 35–53. https://ideas.repec.org/a/eee/rensus/v102y2019icp35-53.html
- [6]Al-Najjar H, El-Khozondar HJ, Pfeifer C, Al-Afif R (2022). Hybrid grid-tie electrification analysis of bio-shared renewable energy systems for domestic application. Sustainable Cities and Society, 77, 103538. https://doi.org/10.1016/j.scs.2021.103538
- [7]Bajpai P, Dash V (2012). Hybrid renewable energy systems for power generation in stand-alone applications: A review. Renewable Sustainable Energy Rev, 16(5), 2926–2939. https://doi.org/10.1016/j.rser.2012.02.009
- [8]Bala BK, Siddique SA (2009). Optimal design of a PV-diesel hybrid system for electrification of an isolated Island-Sandwip in Bangladesh using genetic algorithm. Energy for Sustainable Development, 13(3), 137–142. https://doi.org/10.1016/j.esd.2009.07.002
- [9]Balamurugan P, Ashok S, Jose T (2009). Optimal scheduling and operation of hybrid biomass/wind/PV energy system for rural areas. Int J Energy technol policy, 7(1), 113–126.
- [10]Bamisile O et al. (2020). Impact of economic development on CO2 emission in Africa; the role of BEVs and hydrogen production in renewable energy integration. International Journal of Hydrogen Energy.
- [11]Bamisile O et al. (2021). Electrification and renewable energy nexus in developing countries: an overarching analysis of hydrogen production and electric vehicles integrality in renewable energy penetration. Energy Convers Manage, 236, 114023. https://pubag.nal.usda.gov/catalog/7328023
- [12]Best R, Burke PJ (2018). Electricity availability: A pre-condition for faster economic growth. Energy Econ, 74, 321–329. https://openresearch-repository.anu.edu.au/bitstream/1885/144673/3/30_2018_best_burke.pdf
- [13]Bhandari B, Lee K, Lee G, Cho Y, Ahn S (2015). Optimization of hybrid renewable energy power systems: A review. Int J Precis Eng manufac.-green technol, 2(1), 99–112. https://link.springer.com/content/pdf/10.1007/s40684-015-0013-z.pdf
- [14]Bhattacharyya SC (2013). Financing energy access and off-grid electrification: A review of status, options and challenges. Renewable and Sustainable Energy Reviews, 20, 462–472. https://doi.org/10.1016/j.rser.2012.12.008
- [15]Bond T, Templeton MR (2011). History and future of domestic biogas plants in the developing world. Energy Sustain Dev, 15(4), 347–354.
- [16]Candia RAR, Subieta SLB, Ramos JAA, Miquelez VS, Balderrama JGP, Florero HJ, Quoilin S (2019). Techno-economic assessment of high variable renewable energy penetration in the Bolivian interconnected electric system. International Journal of Sustainable Energy Planning and Management, 22. https://doi.org/10.5278/ijsepm.2659
- [17]Charles A (2014). How is 100% renewable energy possible for Nigeria? Global Energy Network Institute (GENI). http://geni.org/globalenergy/research/renewable-energy-potential-of-nigeria/100-percent-renewable-energy-Nigeria.pdf
- [18]Chauhan A, Saini RP (2014). A review on Integrated Renewable Energy System based power generation for stand-alone applications: configurations, storage options, sizing methodologies and control. Renewable and Sustainable Energy Reviews, 38, 99–120. https://doi.org/10.1016/j.rser.2014.05.079
- [19]Chirambo D (2018). Towards the achievement of SDG 7 in sub-Saharan Africa: Creating synergies between power Africa, sustainable energy for all and climate finance in-order to achieve universal energy access before 2030. Renewable Sustainable Energy Rev, 94, 600–608. https://www.aler-renovaveis.org/contents/lerpublication/dumisani-chirambo_2018_towards-the-achievement-of-sdg-7-in-sub-saharan-africa-creating.pdf
- [20]Chowdhury N et al. (2020). Feasibility and cost analysis of photovoltaic biomass hybrid energy system in off-grid areas of Bangladesh. Sustainability, 12(4), 1568.
- [21]Chowdhury TH (2020). Technical-economical analysis of anaerobic digestion process to produce clean energy. Energy Reports, 7, 247–253. https://doi.org/10.1016/j.egyr.2020.12.024
- [22]Connolly D, Mathiesen BV (2014). A technical and economic analysis of one potential pathway to a 100% renewable energy system. International Journal of Sustainable Energy Planning and Management, 1, 7–28. https://doi.org/10.5278/ijsepm.2014.1.2
- [23]Cook P (2013). Rural electrification and rural development. In: Bhattacharyya S, editor. Rural electrification through decentralized off-grid systems in developing countries. Springer, London. p. 13–38.
- [24]Cuellar AD, Webber ME (2008). Cow power: The energy and emissions benefits of converting manure to biogas. Environ Res Lett, 3, 034002. https://doi.org/10.1088/1748-9326/3/3/034002
- [25]Dash RL, Behera L, Mohanty B, Hota PK (2018). Cost and sensitivity analysis of a microgrid using HOMER Pro software in both grid connected and standalone mode. In: International Conference on Recent Innovations in Electrical, Electronics & Communication Engineering (ICRIEECE). https://doi.org/10.1109/ICRIEECE44171.2018.9009218
- [26]Diaz-Vazquez D et al. (2020). Evaluation of biogas potential from livestock manures and multicriteria site selection for centralized anaerobic digester systems: The case of Jalisco, Mexico. Sustainability, 12(9), 3527. https://doi.org/10.3390/su12093527
- [27]Dickson EM, Hastings A, Smith J (2023). Energy production from municipal solid waste in low to middle income countries: A case study of how to build a circular economy in Abuja, Nigeria. Frontiers in Sustainability.
- [28]Dorji T, Urmee T, Jennings P (2012). Options for off-grid electrification in the Kingdom of Bhutan. Renewable Energy, 45, 51–58. https://doi.org/10.1016/j.renene.2012.02.012
- [29]Duffie JA, Beckman WA (1991). Solar engineering of thermal processes. 2nd ed. Wiley, New York.
- [30]Emission database for global atmospheric research (2020). Nigeria CO2 emissions. https://www.worldometers.info/co2-emissions/nigeria-co2-emissions/
- [31]EPA (2007). Methodology for thermal efficiency and energy input calculations and analysis of biomass cogeneration unit characteristics. U.S. Environmental Protection Agency Office of Air and Radiation. https://www3.epa.gov/airtoxics/utility/fnl_biomass_cogen_TSD_04_19_07.pdf
- [32]Eras-Almeida A, Egido-Aguilera M (2019). Hybrid renewable mini-grids on non-interconnected small islands: Review of case studies. Renewable Sustainable Energy Rev, 116, 109417. https://doi.org/10.1016/j.rser.2019.109417
- [33]Eroglu M (2011). A mobile renewable house using PV/wind/Fuel-cell hybrid power system. International Journal of Hydrogen Energy, 68, 7985–7992.
- [34]Eziyi I, Krothapalli A (2014). Sustainable rural development: solar/biomass hybrid renewable energy system. Energy Procedia, 57, 1492–1501. https://doi.org/10.1016/j.egypro.2014.10.141
- [35]Fahmy FH, Farghally HM, Ahmed NM (2014). Photovoltaic-Biomass Gasifier hybrid energy system for a poultry house. IJMER, 4(8), 51–62.
- [36]Halabi LM, Mekhilef S (2018). Flexible hybrid renewable energy system design for a typical remote village located in tropical climate. J Cleaner Prod, 177, 908–924. https://doi.org/10.1016/j.jclepro.2017.12.248
- [37]HOMER Energy (2021). HOMER Pro version 3.7 user manual. HOMER Energy. https://www.homerenergy.com/pdf/HOMERHelpManual.pdf
- [38]Honnurvali MS et al. (2018). Case study of PV output power degradation rates in Oman. IET Renewable Power Gener, 13(2), 352–360. https://doi.org/10.1049/iet-rpg.2018.5457
- [39]IEA (2020). SDG7: Data and projections. International Energy Agency. https://www.iea.org/reports/sdg7-data-and-projections
- [40]IEA (2022). Renewable electricity growth is accelerating faster than ever worldwide, supporting the emergence of the new global energy economy [news]. International Energy Agency. https://www.iea.org/news/renewable-electricity-growth-is-accelerating-faster-than-ever-worldwide-supporting-the-emergence-of-the-new-global-energy-economy
- [41]Igoni AH, Harry ISK (2016). Modelling continuous anaerobic digestion of municipal solid waste in biogas production. Energy and Environmental Engineering, 4(3), 30–43. https://doi.org/10.13189/eee.2016.040302
- [42]Jahangir MH, Cheraghi R (2020). Economic and environmental assessment of solar/wind/biomass HRES supplying rural settlement load. Sustainable Energy Technol Assess, 42, 100895.
- [43]Kanase-Patil AB, Saini RP, Sharma MP (2011). Sizing of integrated renewable energy system based on load profiles and reliability index for the state of Uttarakhand in India. Renewable Energy, 36(11), 2809–2821. https://doi.org/10.1016/j.renene.2011.04.022
- [44]Krishna KS, Kumar KS (2015). A review on hybrid renewable energy systems. Ren Susta Energ Rev, 52, 907–916. https://econpapers.repec.org/RePEc:eee:rensus:v:52:y:2015:i:c:p:907-916
- [45]Li L et al. (2019). Optimal design of negative emission hybrid renewable energy systems with biochar production. Appl Energy, 243, 233–249. https://doi.org/10.1016/j.apenergy.2019.03.183
- [46]Lian J et al. (2019). A review on recent sizing methodologies of hybrid renewable energy systems. Energy Convers Manage, 199, 112027. https://doi.org/10.1016/j.enconman.2019.112027
- [47]Malik P, Awasthi M, Sinha S (2020). Study of grid integrated biomass-based hybrid renewable energy systems for Himalayan territory. International Journal of Sustainable Energy Planning and Management, 28, 71–88. https://doi.org/10.5278/ijsepm.3674
- [48]Mishra S, Panigrahi CK, Kothari DP (2016). Design and simulation of a solar, wind, biogas hybrid system architecture using HOMER in India. International Journal of Ambient Energy, 37, 184–191.
- [49]Monson KD, Esteves SR, Guwy AJ, Dinsdale RM (2007). Anaerobic digestion of biodegradable municipal wastes. a Review. The Sustainable Environment Research Centre, University of Glamorgan. https://www.walesadcentre.org.uk/media/1050/anaerobic-digestion-of-bmw-_compressed_-part1.pdf
- [50]Mountford H, Waskow D, Gonzalez L, Gajjar C, Cogswell N, Holt M, Fransen T, Bergen M, Gerholdt R (2021). COP26: Key outcomes from the UN climate talks in glasgow. https://www.wri.org/insights/cop26-key-outcomes-un-climate-talks-glasgow
- [51]Mukhtar M et al. (2021). Effect of inadequate electrification on Nigeria’s economic development and environmental sustainability. Sustainability, 13(4), 2229. https://www.mdpi.com/2071-1050/13/4/2229/pdf
- [52]Muller C (2007). Anaerobic digestion of biodegradable solid waste in low- and middle-income countries, Swiss Federal Institute of Aquatic Science and Technology (Eawag). Department of Water and Sanitation in Developing Countries (Sandec), Dubendorf, Switzerland.
- [53]Murdock HE, Gibb D, Andre T, Appavou F, Brown A, Epp B, et al. (2019). Renewables 2019 global status report. REN21. http://hdl.handle.net/20.500.11822/28496
- [54]National Bureau of Statistics (NBS) (2020). National Bureau of Statistics, Nigeria. https://www.nigerianstat.gov.ng/
- [55]Nigerian Electricity Regulatory Commission (NERC) (2020). Abuja Electricity Distribution Company tariff and estimated load report for Abuja city centre. https://nerc.gov.ng/
- [56]Nunes L, Matias J, Catalao J (2017). Biomass in the generation of electricity in Portugal: A review. Renewable Sustainable Energy Rev, 71, 373–378. http://webx.ubi.pt/~catalao/Paper_R2_RSER.pdf
- [57]Raman P, Murali J, Sakthivadivel D, Vigneswaran VS (2012). Opportunities and challenges in setting up solar photovoltaic-based microgrids for electrification in rural areas of India. Renewable and Sustainable Energy Reviews, 16(5), 3320–3325. https://doi.org/10.1016/j.rser.2012.02.065
- [58]Sanjay KC et al. (2021). Techno commercial study of hybrid systems for the agriculture farm using HOMER software. In: Hybrid renewable energy systems. Wiley. p. 115–133. https://doi.org/10.1002/9781119555667.ch5
- [59]Sansaniwal S, Pal K, Rosen MA, Tyagi SK (2017). Recent advances in the development of biomass gasification technology: A comprehensive review. Renewable Sustainable Energy Rev, 72, 363–384. https://doi.org/10.1016/j.rser.2017.01.038
- [60]Sen R, Bhattacharyya S (2014). Off-grid electricity generation with renewable energy technologies in India: An application of HOMER. Renewable Energy, 62, 388–398.
- [61]Shahzad K et al. (2017). Bioenergy prospective and efficient utilization pattern for rural energy supply in district of Pakpattan. J Agric Res, 55(1), 101–113. https://apply.jar.punjab.gov.pk/upload/1496900680_126_9._JAR_4339_(ALI).pdf
- [62]Shezan S, Al-Mamoon A, Ping H (2018). Performance investigation of an advanced hybrid renewable energy system in Indonesia. Environ Prog Sustainable Energy, 37(4), 1424–1432. http://eprints.um.edu.my/20677/
- [63]Sigarchian SG, Paleta R, Malmquist A, Pina A (2015). Feasibility study of using a biogas engine as backup in a decentralized hybrid (PV/wind/battery) power generation system: Case study Kenya. Energy, 90, 1830–1841. https://doi.org/10.1016/j.energy.2015.07.008
- [64]Singh A, Baredar P, Gupta B (2015). Computational simulation & optimization of a solar, fuel cell and biomass hybrid energy system using HOMER Pro software. Procedia Engineering, 127. https://doi.org/10.1016/j.proeng.2015.11.408
- [65]Sinha S, Chandel SS (2014). Review of software tools for hybrid renewable energy systems. Renewable and Sustainable Energy Reviews, 32, 192–205. https://doi.org/10.1016/j.rser.2014.01.035
- [66]Situmorang YA et al. (2020). Small-scale biomass gasification systems for power generation (< 200 kW class): A review. Renewable Sustainable Energy Rev, 117, 109486. https://doi.org/10.1016/j.rser.2019.109486
- [67]Suresh V, Muralidhar M, Kiranmayi R (2020). Modelling and optimization of an off-grid hybrid renewable energy system for electrification in a rural-areas. Energy Rep, 6, 594–604. https://www.econstor.eu/handle/10419/244061
- [68]Tafdrup S (1995). Viable energy production and waste recycling from anaerobic digestion of manure and other biomass materials. Biomass Bioenergy, 9, 303–314. https://doi.org/10.1016/0961-9534(95)00098-4
- [69]Thambi S, Bhattacharya A, Fricko O (2018). India’s energy and emissions outlook: Results from India energy model. NITI Aayog, New Delhi. p. 1–27. http://pure.iiasa.ac.at/id/eprint/15536/1/India%E2%80%99s-Energy-and-Emissions-Outlook.pdf
- [70]Vogeli Y, Lohri CR, Gallardo A, Diener S, Zurbrugg C (2014). Anaerobic digestion of biowaste in developing countries: practical information and case studies. Dubendorf: Swiss Federal Institute of Aquatic Science and Technology. https://www.eawag.ch/fileadmin/Domain1/Abteilungen/sandec/publikationen/SWM/Anaerobic_Digestion/biowaste.pdf
- [71]Vogeli Y, Zurbrugg C (2008). Biogas in cities: A new trend? Swiss Federal Institute of Aquatic Science and Technology (Eawag), Department of Water and Sanitation in Developing Countries (Sandec), Dubendorf, Switzerland.
- [72]Winrock (1997). Assessment of biomass and carbon stock in present land use. https://www.fao.org/3/y5490e/y5490e07.htm#:~:text=The%20calculation%20of%20carbon%20stock,average%20carbon%20content%20in%20biomass
- [73]Yimen N et al. (2018). Analyzing of a photovoltaic/wind/biogas/pumped-hydro off-grid hybrid system for rural electrification in Sub-Saharan Africa: Case study of Djounde in northern Cameroon. Energies, 11(10), 2644.
- [74]Yimen N et al. (2020). Optimal sizing and techno-economic analysis of hybrid renewable energy systems: A case study of a photovoltaic/wind/battery/diesel system in fanisau, Northern Nigeria. Processes, 8(11), 1381. https://www.mdpi.com/2227-9717/8/11/1381/pdf
- [75]Yimen N, Monkam L, Tcheukam-Toko D, Musa B, Abang R, Fombe LF, et al. (2021). Optimal design and sensitivity analysis of distributed biomass-based hybrid renewable energy systems for rural electrification: Case study of different photovoltaic/wind/battery-integrated options in Babadam, northern Cameroon. IET Renewable Power Generation, 1–18. https://doi.org/10.1049/rpg2.12266
- [76]Zurbrugg C (2018). Calculating the size of an anaerobic reactor: municipal solid waste management in developing countries. Eawag aquatic research.