Pharmacy
Formulation and Evaluation of a Herbal Antioxidant Face Cream Containing Aloe vera Gel, Green Tea and Pomegranate Peel Extracts for Skin Care
Department of Pharmaceutics, Harishchandra P.G. College, Bawanbheegha, Varanasi, Uttar Pradesh, India (affiliated to Dr. A.P.J. Abdul Kalam Technical University, Lucknow, Uttar Pradesh, India)
Published October 2026
Abstract
Background: Oxidative stress drives both intrinsic and photo-induced skin ageing, and polyphenol-rich botanicals are widely used in topical products to counter it.
Objective: To formulate and evaluate an oil-in-water (O/W) herbal face cream combining Aloe barbadensis gel, Camellia sinensis (green tea) leaf extract and Punica granatum (pomegranate) peel extract.
Methods: Green tea (Soxhlet, 95% ethanol) and pomegranate peel (maceration, 70% ethanol) extracts and clarified aloe gel were characterised by phytochemical screening and by total phenolic, flavonoid and tannin assays. Five creams (F1–F5) with increasing extract loads were prepared by fusion–emulsification and assessed for organoleptic and physicochemical properties, DPPH radical scavenging (10–160 µg/mL; ascorbic acid as reference), antimicrobial activity (agar well diffusion), Draize patch-test safety, centrifugation and freeze–thaw behaviour, and 90-day stability under ICH Q1A(R2) conditions.
Results: Pomegranate peel extract had the highest phenolic (342.60 ± 7.48 mg GAE/g) and tannin content, and green tea extract the highest flavonoid content. Antioxidant potency rose with extract load (IC50 74.33 µg/mL for F1 to 32.29 µg/mL for F5; ascorbic acid 29.13 µg/mL), whereas viscosity fell and the highest-load batch (F5) showed grittiness and slight creaming. Batch F4 (10% aloe gel, 5% green tea extract, 2.5% pomegranate peel extract) gave the best composite score: pH 5.78 ± 0.04, viscosity 18,900 ± 410 cP, spreadability 9.38 ± 0.26 g·cm/s, IC50 35.42 µg/mL, a primary irritation index of 0.033, and retention of 92.4% of its antioxidant activity after 90 days at 40 °C/75% RH. Its IC50 was about 1.8-fold lower than that of a marketed herbal cream.
Conclusions: The three-extract cream F4 is a stable, well-tolerated and antioxidant-active cosmeceutical candidate; in vivo efficacy studies and marker-based standardisation are the next steps.
Keywords: herbal cosmeceutical; antioxidant cream; Aloe vera; green tea; pomegranate peel; DPPH; stability; skin ageing
1Introduction
Human skin is the body’s largest organ and its principal barrier against the environment. With age its structure and function decline through two overlapping processes: intrinsic (chronological) ageing, which is genetically programmed, and extrinsic ageing, which is driven mainly by ultraviolet (UV) radiation, pollutants and lifestyle factors [1–3]. Photoaged skin shows coarse wrinkles, dyspigmentation, dryness and loss of elasticity, and UV exposure is considered the dominant contributor to visible facial ageing [1,3].
Oxidative stress links these processes at the molecular level. Reactive oxygen species (ROS) generated by mitochondrial metabolism, UV irradiation and pollutants damage lipids, proteins and DNA, activate transcription factors such as AP-1 and NF-κB, and up-regulate matrix metalloproteinases that degrade collagen and elastin [1,4,5]. Because the skin’s own antioxidant defences (enzymatic systems, vitamins C and E, glutathione) are depleted by ageing and UV exposure, topical replenishment with exogenous antioxidants is a rational and widely used strategy [6,7].
Plant extracts are attractive sources of such antioxidants. Polyphenols, flavonoids and tannins scavenge free radicals, chelate transition metals, and modulate inflammatory and matrix-degrading pathways, and consumer preference for natural cosmetic ingredients has expanded their use in skin-care products [8–11]. Herbal creams containing phytoextracts have been reported to show anti-ageing potential in vitro and in human volunteers [12].
Three botanicals are especially suited to a combined formulation. Aloe vera (Aloe barbadensis Miller) inner leaf gel is a polysaccharide-rich, humectant and soothing material that also contains vitamins, enzymes and phenolic constituents [13–15]; aloe-containing cosmetic bases have been assessed for their moisturising effect by skin bioengineering methods [16]. Green tea (Camellia sinensis) leaves are rich in catechins, chiefly epigallocatechin-3-gallate (EGCG), which have been shown to reduce UV-induced inflammation and oxidative damage in skin [17–21], although controlled clinical evidence for photoaging is mixed [22,23]. Pomegranate (Punica granatum) peel is among the richest plant sources of ellagitannins such as punicalagin, and peel extracts show higher antioxidant capacity than pulp extracts [24–27]. Pomegranate fractions stimulate procollagen synthesis and inhibit MMP-1 in human skin cells and modulate UVB-induced signalling in keratinocytes [28,29], and the activity of pomegranate tannins is enhanced in the presence of other polyphenols [30].
These botanicals have complementary phytochemical profiles: a hydrating polysaccharide matrix (aloe), flavan-3-ols (green tea) and hydrolysable tannins (pomegranate peel). To our knowledge, however, systematic optimisation of a single stable cream that carries all three extracts, with parallel assessment of antioxidant activity, antimicrobial activity, safety and stability, has received limited attention. Extract loading is also a formulation problem in its own right, because hydrophilic, tannin-rich extracts can reduce the viscosity and structure of a stearate-based emulsion. The present work therefore set out to (i) prepare and characterise the three extracts; (ii) formulate five O/W creams (F1–F5) with graded extract loads; (iii) evaluate their physicochemical, antioxidant, antimicrobial, safety and stability properties; and (iv) select an optimised batch and benchmark it against a marketed herbal face cream.
2Materials and methods
2.1Plant material and authentication
Fresh Aloe barbadensis Miller leaves (3–4-year-old plants) were collected in the early morning from a certified botanical garden. Dried green tea leaves (Camellia sinensis L.) were obtained from a commercial tea estate in Darjeeling, West Bengal, and pomegranate (Punica granatum L.) fruits were purchased from a local market, from which the peel was separated. The materials were authenticated by macroscopic, microscopic and organoleptic examination against standard pharmacognostic references, including WHO quality-control methods for medicinal plant materials [31], and voucher specimens were deposited in the institutional herbarium. Plant material was washed, shade-dried at 25–30 °C for 7–10 days, powdered in a mechanical grinder, passed through a 60-mesh sieve and stored in airtight amber glass containers at 4 °C. All chemicals and excipients were of analytical or pharmacopoeial grade.
2.2Preparation of extracts
Green tea powder (50 g) was extracted in a Soxhlet apparatus with 300 mL of 95% ethanol at 70–75 °C for 6–8 h (10–12 siphoning cycles). Pomegranate peel powder (50 g) was macerated in 500 mL of 70% ethanol for 72 h at room temperature with intermittent shaking, and the marc was re-extracted with 250 mL of fresh solvent for 24 h; maceration was chosen to limit thermal hydrolysis of heat-labile ellagitannins. Filtrates (Whatman No. 1) were concentrated under reduced pressure at 45 °C in a rotary evaporator to a semisolid mass, and percentage yield was calculated as (weight of dried extract/weight of plant material) × 100. Extracts were stored in airtight vials at 4 °C. Aloe leaves were washed and the rind removed with a scalpel, taking care to avoid the aloin-containing yellow latex; the inner gel was homogenised for 3 min, filtered through double-layer muslin, centrifuged at 3000 rpm for 15 min, stored at 4 °C in sterile amber bottles and used within 48 h.
2.3Phytochemical screening and quantification
Qualitative tests for alkaloids (Mayer’s, Wagner’s, Dragendorff’s), flavonoids (Shinoda, lead acetate, alkaline reagent), tannins (ferric chloride, gelatin, lead acetate), phenolics (Folin–Ciocalteu, ferric chloride), saponins (foam), glycosides (Molisch, Keller–Killiani), steroids and terpenoids (Liebermann–Burchard, Salkowski), reducing sugars (Benedict, Fehling), proteins and amino acids (biuret, ninhydrin) and fixed oils (spot test) followed standard methods [32]. Total phenolic content was determined by the Folin–Ciocalteu method with gallic acid as standard [33], total flavonoids by the aluminium chloride colorimetric method with quercetin as standard [34], and total tannins by the Folin–Denis method with tannic acid as standard. Results are expressed as mg gallic acid equivalents (GAE)/g, quercetin equivalents (QE)/g and tannic acid equivalents (TAE)/g (mean ± SD, n = 3).
2.4Formulation of the creams
Five O/W creams (F1–F5) and a plain cream base (Std.) were prepared by the fusion–emulsification method (Table 1). The oil phase (stearic acid, beeswax, cetyl alcohol, propylparaben) was melted at 70–75 °C on a water bath. The aqueous phase (glycerin, triethanolamine, methylparaben, distilled water) was heated to the same temperature and added slowly to the oil phase under mechanical stirring (500–700 rpm), followed by stirring at 400 rpm while cooling from 70 °C to 45 °C. When the emulsion reached 40–45 °C, aloe gel, green tea extract and pomegranate peel extract were incorporated in that order with gentle stirring, keeping the temperature below 50 °C to protect EGCG and punicalagin from thermal degradation. The pH was adjusted to 5.5–6.5 with triethanolamine, and the cream was cooled to 25 °C under slow stirring and packed in airtight jars.
| Ingredient | F1 | F2 | F3 | F4 | F5 | Std. |
|---|---|---|---|---|---|---|
| Stearic acid | 12.0 | 12.0 | 12.0 | 12.0 | 12.0 | 12.0 |
| Beeswax | 5.0 | 5.0 | 5.0 | 5.0 | 5.0 | 5.0 |
| Cetyl alcohol | 4.0 | 4.0 | 4.0 | 4.0 | 4.0 | 4.0 |
| Glycerin | 5.0 | 5.0 | 5.0 | 5.0 | 5.0 | 5.0 |
| Triethanolamine | 1.5 | 1.5 | 1.5 | 1.5 | 1.5 | 1.5 |
| Methylparaben | 0.20 | 0.20 | 0.20 | 0.20 | 0.20 | 0.20 |
| Propylparaben | 0.05 | 0.05 | 0.05 | 0.05 | 0.05 | 0.05 |
| Aloe vera gel | 5.0 | 7.5 | 10.0 | 10.0 | 10.0 | — |
| Green tea extract | 2.5 | 2.5 | 2.5 | 5.0 | 5.0 | — |
| Pomegranate peel extract | 2.5 | 2.5 | 2.5 | 2.5 | 5.0 | — |
| Distilled water | q.s. | q.s. | q.s. | q.s. | q.s. | q.s. |
Std. = plain cream base (negative control); q.s. = quantity sufficient to 100 g.
2.5Evaluation of the creams
All tests were performed in triplicate. Colour, odour, appearance, texture and homogeneity were assessed visually and by touch. pH was measured (ELICO pH-101, calibrated with pH 4.0, 7.0 and 9.2 buffers) in a 1% w/w dispersion in freshly boiled, cooled distilled water at 25 °C. Viscosity was measured with a Brookfield viscometer (spindle 64, 20 rpm, 25 °C, 60 s). Spreadability was determined by the glass-slide method (0.5 g of cream, 100 g weight, 5 min) and calculated as S = m × l/t. Extrudability was assessed from the percentage of cream extruded from a collapsible tube under constant load. Washability was judged by removal from the forearm with water, and greasiness by the blotting-paper test. Acceptance criteria were pH 5.5–6.5, viscosity 10,000–30,000 cP and spreadability > 4 g·cm/s.
2.6DPPH radical scavenging assay
Antioxidant activity was measured by the DPPH method [35,36]. Cream samples (100 mg) were dissolved in 10 mL of methanol by gentle warming and vortexing and diluted to 10, 20, 40, 80 and 160 µg/mL. One millilitre of each dilution was mixed with 3 mL of 0.1 mM methanolic DPPH, vortexed for 30 s and incubated in the dark at 25 °C for 30 min, and absorbance was read at 517 nm (Shimadzu UV-1800). Ascorbic acid served as the positive control and the plain cream base as the negative control. Inhibition (%) was calculated as [(Ac – As)/Ac] × 100, where Ac is the absorbance of the DPPH control and As that of the sample. IC50 values were obtained by regression of inhibition (%) against log concentration. Relative potency was expressed as the ratio of the IC50 of ascorbic acid to that of the sample. The limits of a single radical-based assay are discussed in Section 3.9[37].
2.7Antimicrobial activity
Antimicrobial activity was determined by agar well diffusion [38] against Staphylococcus aureus (ATCC 25923), Bacillus subtilis (ATCC 6633), Escherichia coli (ATCC 25922), Pseudomonas aeruginosa (ATCC 27853) and Candida albicans (ATCC 10231). Plates were seeded with suspensions standardised to 0.5 McFarland (about 1.5 × 10⁸ CFU/mL), 8 mm wells were filled with 100 µL of cream suspension, and plates were incubated at 37 °C for 24 h (bacteria) or 28 °C for 48 h (fungus). Gentamicin (10 µg/disc) and fluconazole (25 µg/disc) were positive controls, and the plain base was the negative control.
2.8Primary skin irritation (patch) test
A Draize-type patch test [39] was carried out on 10 healthy adult volunteers (5 men, 5 women; 20–35 years) with written informed consent, after clearance by the Institutional Ethics Committee. Volunteers with skin allergy, active dermatological disease or recent topical corticosteroid use were excluded. The optimised cream (0.5 g) was applied under a non-occlusive patch to a 4 × 4 cm area of the inner forearm and the site was scored for erythema, oedema, papules and vesicles at 24, 48 and 72 h (0–3 scale). The primary irritation index was calculated as the sum of erythema and oedema scores divided by the product of the number of volunteers and observation times; values below 0.5 indicate negligible irritation.
2.9Stability studies
Stability of the optimised batch was assessed according to ICH Q1A(R2)[40]. Samples in opaque, airtight 30 g jars were stored at 25 ± 2 °C/60 ± 5% RH, 4 ± 2 °C and 40 ± 2 °C/75 ± 5% RH for 90 days and examined at 0, 7, 14, 30, 60 and 90 days for organoleptic changes, pH, viscosity, spreadability, phase separation and DPPH activity. All batches were also centrifuged (3000 rpm, 30 min) and subjected to three freeze–thaw cycles (–10 °C for 48 h alternating with 25 °C for 48 h). The formulation was regarded as stable if there was no phase separation, pH change was within ±0.2 units and remained in 5.5–6.5, viscosity change was within ±10%, spreadability change within ±15%, and at least 90% of initial DPPH activity was retained.
2.10Batch selection, marketed-product comparison and statistics
Each batch was scored from 1 to 5 against seven criteria (pH compatibility, viscosity and body, spreadability, antioxidant potency, physical and chemical stability, organoleptic acceptability and antimicrobial contribution; maximum 35), and the batch with the highest total was selected. The selected batch was compared with a commercially available herbal face cream for pH, viscosity, spreadability, DPPH activity, washability and greasiness. Data are mean ± SD (n = 3). Differences among batches were tested by one-way ANOVA with Tukey’s post-hoc test, and P < 0.05 was considered significant.
3Results and discussion
3.1Extract yield and phytochemical profile
Pomegranate peel gave the highest extractive yield (24.35 ± 0.92% w/w), followed by green tea (18.62 ± 0.74% w/w); fresh aloe gel recovery was 54.20 ± 1.85% of leaf weight (dried solids 1.18 ± 0.06%). The higher peel yield reflects its abundance of readily soluble tannins and sugars and the longer contact time in maceration. Qualitative screening (Table 2) showed that aloe gel was dominated by carbohydrates, glycosides and proteins and was free of tannins, consistent with its polysaccharide-rich mucilage [13,14]. Green tea and pomegranate peel extracts gave strong reactions for phenolics, tannins and flavonoids, the blue-black ferric chloride colour being typical of galloylated catechins and ellagitannins. Steroids and terpenoids were present in traces in aloe gel and green tea and absent in pomegranate peel, proteins and amino acids were moderate in aloe gel, and fixed oils were absent in all three. The three extracts were therefore chemically complementary rather than duplicative.
Quantitative assay agreed with this picture (Table 2). Pomegranate peel had the highest total phenolic (342.60 ± 7.48 mg GAE/g) and tannin (218.70 ± 5.21 mg TAE/g) contents, while green tea had the highest flavonoid content (196.80 ± 4.75 mg QE/g). Aloe gel contributed only small amounts of phenolics (18.70 ± 0.84 mg GAE/g), so its role in the cream is mainly hydrating and skin-conditioning rather than directly antioxidant. High phenolic content of pomegranate peel relative to pulp is well documented [24,25], although absolute values vary with cultivar, maturity and extraction solvent.
| Parameter | Aloe vera gel | Green tea extract | Pomegranate peel extract |
|---|---|---|---|
| Extraction method | Homogenisation, centrifugation | Soxhlet, 95% ethanol | Maceration, 70% ethanol |
| Yield (% w/w) | 54.20 ± 1.85 (fresh gel) | 18.62 ± 0.74 | 24.35 ± 0.92 |
| Alkaloids | − | + | + |
| Flavonoids | + | +++ | ++ |
| Tannins | − | +++ | +++ |
| Phenolic compounds | + | +++ | +++ |
| Saponins | + | + | + |
| Glycosides | ++ | + | ++ |
| Reducing sugars | +++ | + | + |
| Total phenolics (mg GAE/g) | 18.70 ± 0.84 | 268.40 ± 6.12 | 342.60 ± 7.48 |
| Total flavonoids (mg QE/g) | 6.20 ± 0.31 | 196.80 ± 4.75 | 84.50 ± 2.64 |
| Total tannins (mg TAE/g) | 4.10 ± 0.22 | 142.30 ± 3.86 | 218.70 ± 5.21 |
+++ abundant; ++ moderate; + trace; − absent. Quantitative values are mean ± SD, n = 3.
3.2Organoleptic and physicochemical properties
All batches were smooth, homogeneous and free from lumps and phase separation on preparation. Colour deepened from off-white (F1) to brown (F5) and the herbal odour strengthened with extract load, as expected for polyphenol-rich extracts. F5 alone was slightly gritty, softer in body and dull in appearance, indicating that a total active load of 20% begins to disturb the emulsion network.
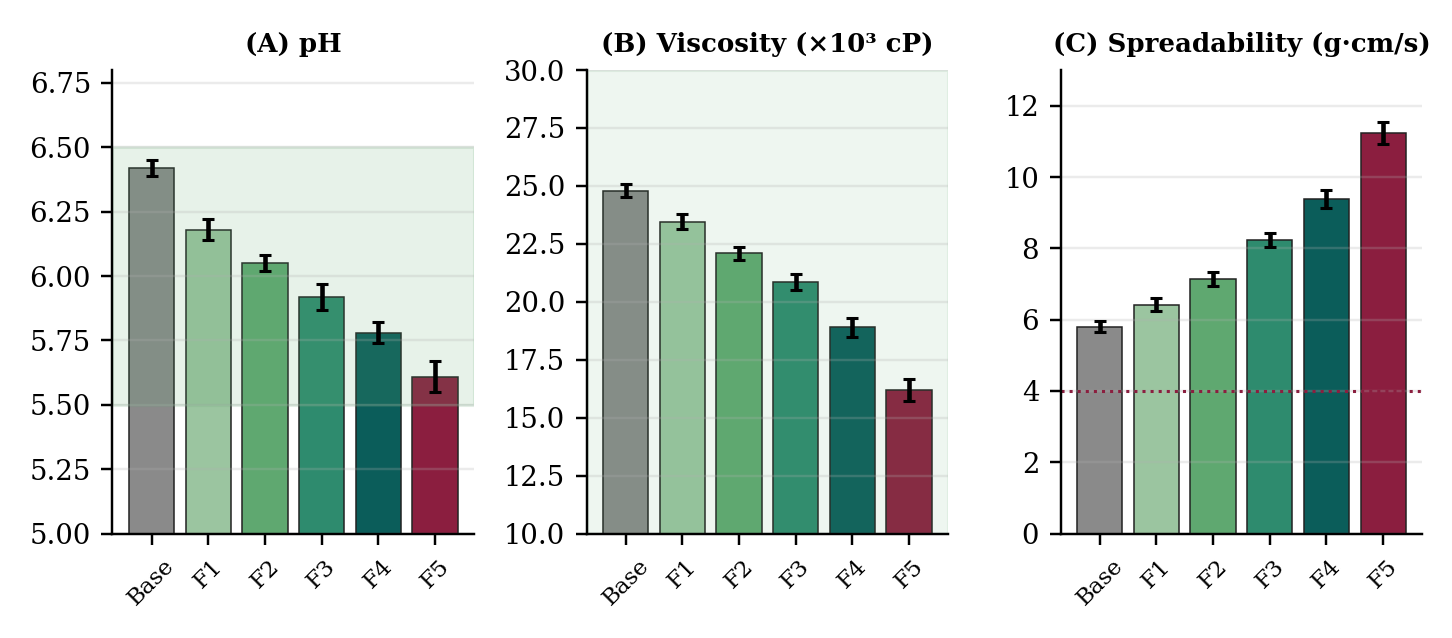
The pH of all creams (5.61–6.18) lay within the target range of 5.5–6.5 and close to the skin’s acid mantle (Table 3, Figure 1A), so irritation or barrier disturbance is unlikely. The gradual fall in pH from F1 to F5 is attributable to the phenolic hydroxyl and carboxylic acid groups introduced with the extracts. A mildly acidic medium is also favourable for polyphenol stability, since catechins are generally more stable in acidic than in neutral or alkaline media [41].
Viscosity fell steadily from 23,450 cP (F1) to 16,200 cP (F5), while spreadability rose from 6.42 to 11.24 g·cm/s (Table 3, Figure 1B–C). This inverse relationship is the expected consequence of adding more hydrophilic extract to the aqueous external phase, which dilutes the stearic acid–cetyl alcohol–beeswax network that structures the emulsion. All batches remained within the viscosity window of 10,000–30,000 cP and exceeded the spreadability criterion of 4 g·cm/s. F3 and F4 offered the best balance of easy spreading and sufficient body. All creams were easily washable and non-greasy, confirming the O/W character of the system; only F5 felt slightly tacky.
Extrudability decreased only modestly, from 93.10% for the base to 86.40% for F5, and remained acceptable throughout, in line with the softer consistency of the higher-load creams. Homogeneity was good for every batch except F5, which was rated satisfactory. Taken together, the physical data show that extract loading, rather than the fixed excipient system, is the main determinant of texture in this series, and that up to about 17.5% total active load (F4) the stearate–cetyl alcohol–beeswax matrix can accommodate the extracts without loss of structure.
| Batch | pH | Viscosity (cP) | Spreadability (g·cm/s) | Extrudability (%) | Washability / greasiness |
|---|---|---|---|---|---|
| Std. | 6.42 ± 0.03 | 24,800 ± 290 | 5.80 ± 0.15 | 93.10 ± 1.20 | Washable / non-greasy |
| F1 | 6.18 ± 0.04 | 23,450 ± 320 | 6.42 ± 0.18 | 92.40 ± 1.35 | Washable / non-greasy |
| F2 | 6.05 ± 0.03 | 22,100 ± 280 | 7.14 ± 0.21 | 91.80 ± 1.18 | Washable / non-greasy |
| F3 | 5.92 ± 0.05 | 20,850 ± 350 | 8.23 ± 0.19 | 90.60 ± 1.42 | Washable / non-greasy |
| F4 | 5.78 ± 0.04 | 18,900 ± 410 | 9.38 ± 0.26 | 89.20 ± 1.56 | Washable / non-greasy |
| F5 | 5.61 ± 0.06 | 16,200 ± 460 | 11.24 ± 0.31 | 86.40 ± 1.74 | Washable / slightly tacky |
3.3Antioxidant activity
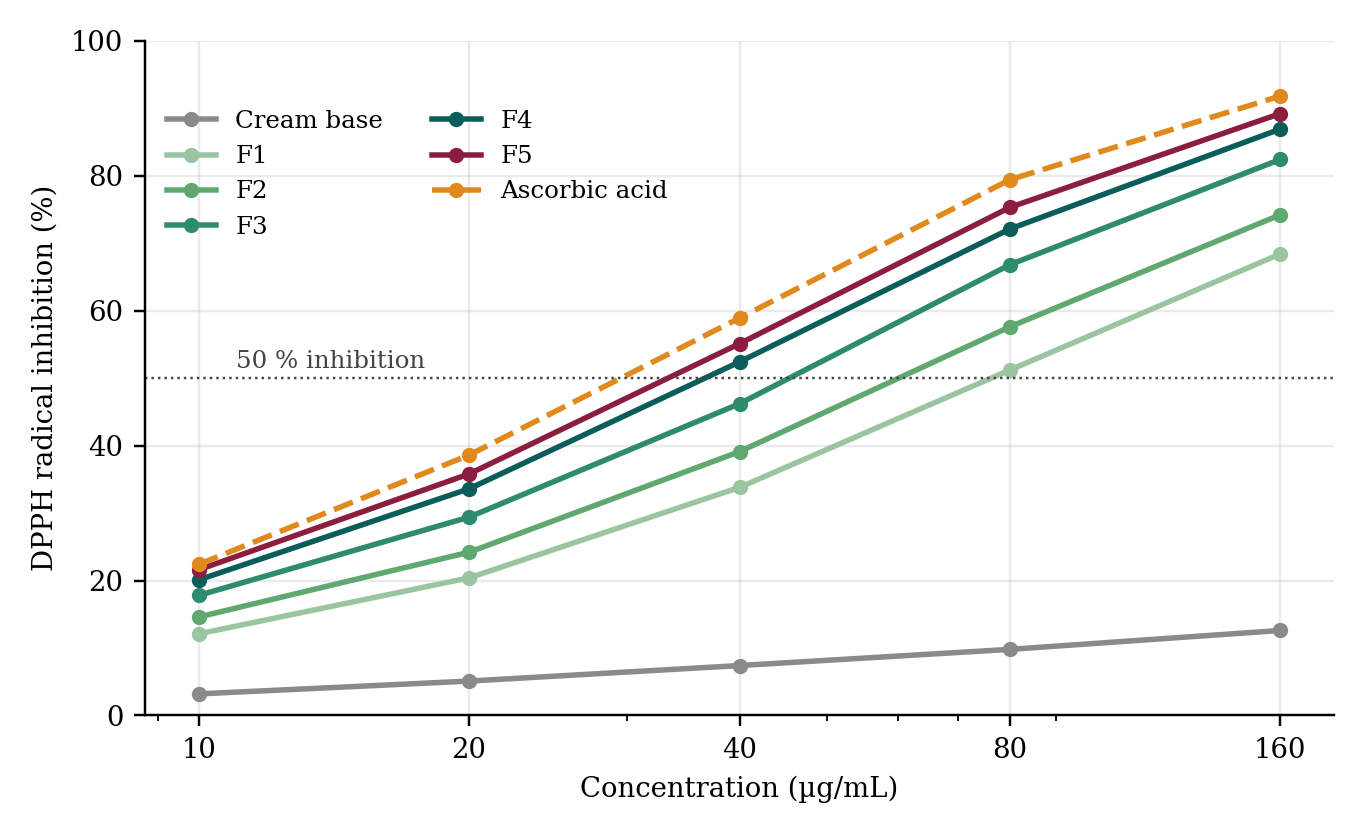
Every batch scavenged DPPH radicals in a concentration-dependent manner over 10–160 µg/mL (Figure 2), whereas the plain base showed only 3.20–12.60% inhibition, so the activity is attributable to the herbal actives and not to the excipients. Regression of inhibition against log concentration gave R2 of 0.982–0.996, and potency rose in the order F1 < F2 < F3 < F4 < F5, mirroring the polyphenol load (Table 4, Figure 3). The IC50 of F5 (32.29 µg/mL) and F4 (35.42 µg/mL) approached that of ascorbic acid (29.13 µg/mL), corresponding to 90% and 82% of the reference potency, respectively.
| Sample | Regression equation | R² | IC₅₀ (µg/mL) | Relative potency |
|---|---|---|---|---|
| Cream base | y = 7.51 log C − 4.62 | 0.9953 | > 1000 | Negligible |
| F1 | y = 47.64 log C − 39.14 | 0.9824 | 74.33 | 0.39 |
| F2 | y = 50.69 log C − 39.27 | 0.9883 | 57.68 | 0.50 |
| F3 | y = 55.34 log C − 40.14 | 0.9924 | 42.54 | 0.68 |
| F4 | y = 57.17 log C − 38.57 | 0.9962 | 35.42 | 0.82 |
| F5 | y = 58.03 log C − 37.57 | 0.9957 | 32.29 | 0.90 |
| Ascorbic acid | y = 59.66 log C − 37.36 | 0.9941 | 29.13 | 1.00 |
Relative potency = IC₅₀ of ascorbic acid ÷ IC₅₀ of sample.
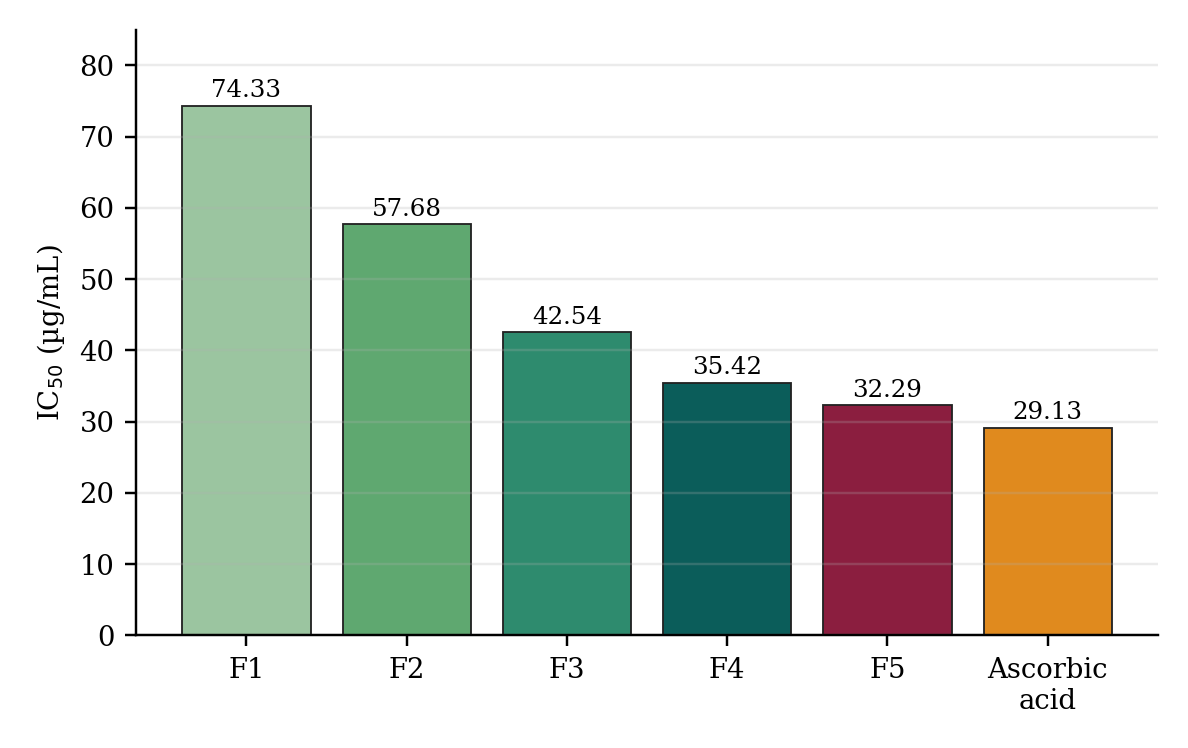
The gain in potency between F4 and F5, in which pomegranate extract was doubled from 2.5% to 5.0%, was smaller than that between F3 and F4, suggesting a plateau. Tukey’s test confirmed that F4 and F5 did not differ significantly in DPPH inhibition at 160 µg/mL (Section 3.8). Such saturation is commonly seen with polyphenols in radical-based assays, in which the accessible radical population becomes limiting and polyphenol self-association can reduce the effective concentration [36,37]. From a formulation standpoint the plateau matters, because doubling the pomegranate load bought only a marginal improvement in scavenging while damaging the physical quality of the cream. The activity of the cream is best explained by the complementary mechanisms of its components: hydrogen and electron donation by catechins and ellagitannins, metal chelation by galloyl groups, and a hydrating polysaccharide matrix from aloe that retains the actives on the skin surface [14,17,30].
It should be noted that concentrations in the assay refer to the mass of cream dissolved in methanol, not to the mass of extract, whereas ascorbic acid was tested as a pure compound. That a cream containing at most 17.5% active extract reached 82% of the mass-based potency of pure ascorbic acid indicates that the extracts are highly active per unit mass; it does not, however, mean that the cream is as effective as ascorbic acid on skin, where penetration, retention and interaction with the stratum corneum determine the outcome [6,42]. The DPPH result should be read as a ranking tool for comparing batches, which is how it is used here.
3.4Antimicrobial activity
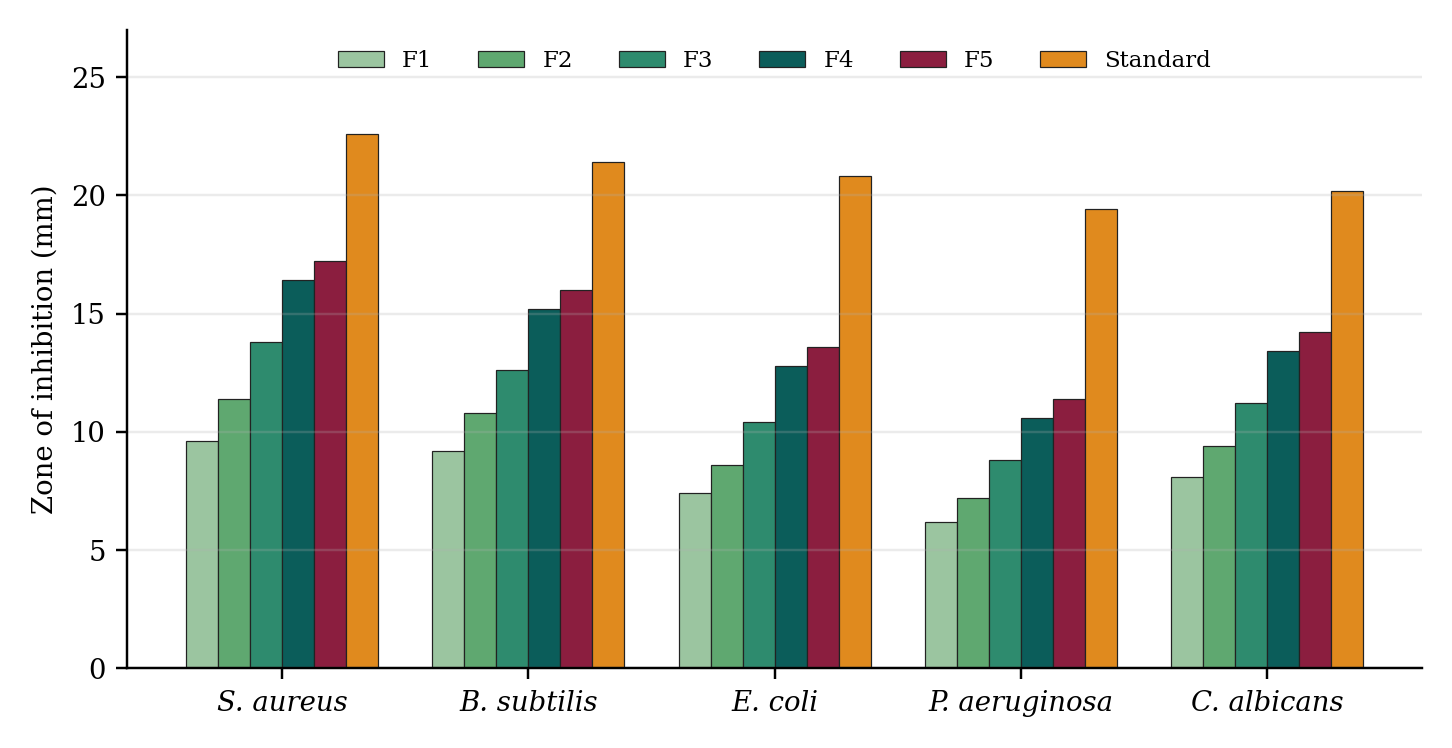
All extract-containing creams produced zones of inhibition against the five test organisms (Figure 4), whereas the base produced none. Zones increased with extract load, for example against S. aureus from 9.6 mm (F1) to 17.2 mm (F5), compared with 22.6 mm for gentamicin. Activity was greater against Gram-positive bacteria than Gram-negative ones (P. aeruginosa least susceptible, 6.2–11.4 mm), which is consistent with the protective outer membrane of Gram-negative cells restricting entry of polyphenols. The tannin-rich pomegranate fraction is a likely contributor [43]. Antimicrobial activity against S. aureus is of dermatological relevance because this organism commonly colonises and infects compromised skin. The activity of the cream is, however, well below that of the standard antimicrobials and should be regarded as supportive of, not a replacement for, the paraben preservative system.
3.5Skin irritation
In the patch test on the optimised batch F4, one of ten volunteers showed grade-1 erythema at 24 h, which had resolved by 48 h; no oedema, papules, vesicles, itching or burning occurred at any time. The mean irritation score was 0.10 at 24 h and 0.00 at 48 and 72 h, and the primary irritation index was 0.033, well below the 0.5 threshold for negligible irritation, so F4 can be regarded as well tolerated in this small sample. The single transient reaction was most probably a mechanical effect of the patch. Ten volunteers are adequate for a preliminary screen but not for detecting rare sensitisation, and repeat insult patch testing in a larger panel would be required before commercial use.
The good tolerance is consistent with the mildly acidic pH of F4, its moderate preservative levels and the use of the inner aloe gel rather than the aloin-containing latex, which can sensitise skin. The extracts themselves are widely used in topical products, but concentrated polyphenol extracts can occasionally cause contact reactions, which is a further reason for testing in a larger and more diverse volunteer panel [8].
3.6Stability
The optimised batch F4 remained physically stable for 90 days under all conditions, with no phase separation, syneresis or cracking (Table 5, Figure 5). At 25 °C the pH fell by 0.07 units and viscosity by 4.23%; at 40 °C/75% RH the pH fell by 0.16 units and viscosity by 8.99%, both within the ±0.2 unit and ±10% limits. DPPH activity retention was 97.2% (25 °C), 98.6% (4 °C) and 92.4% (40 °C/75% RH), all above the 90% criterion. The greatest loss (7.6%) occurred under accelerated conditions and a slight darkening was seen at day 90, consistent with thermally accelerated oxidation of catechins and other polyphenols [41]. This supports packaging in opaque, airtight containers and suggests that a lipophilic chain-breaking antioxidant such as tocopherol could be evaluated as an adjuvant.
| Condition | Parameter | 0 d | 7 d | 14 d | 30 d | 60 d | 90 d |
|---|---|---|---|---|---|---|---|
| 25 °C / 60% RH | pH | 5.78 | 5.77 | 5.76 | 5.75 | 5.73 | 5.71 |
| Viscosity (cP) | 18,900 | 18,820 | 18,740 | 18,560 | 18,320 | 18,100 | |
| DPPH retained (%) | 100.0 | 99.4 | 99.0 | 98.5 | 97.8 | 97.2 | |
| 4 °C | pH | 5.78 | 5.78 | 5.77 | 5.77 | 5.76 | 5.75 |
| Viscosity (cP) | 18,900 | 18,880 | 18,860 | 18,800 | 18,720 | 18,650 | |
| DPPH retained (%) | 100.0 | 99.7 | 99.5 | 99.3 | 98.9 | 98.6 | |
| 40 °C / 75% RH | pH | 5.78 | 5.75 | 5.73 | 5.70 | 5.66 | 5.62 |
| Viscosity (cP) | 18,900 | 18,650 | 18,410 | 18,020 | 17,620 | 17,200 | |
| DPPH retained (%) | 100.0 | 98.6 | 97.8 | 96.1 | 94.2 | 92.4 |
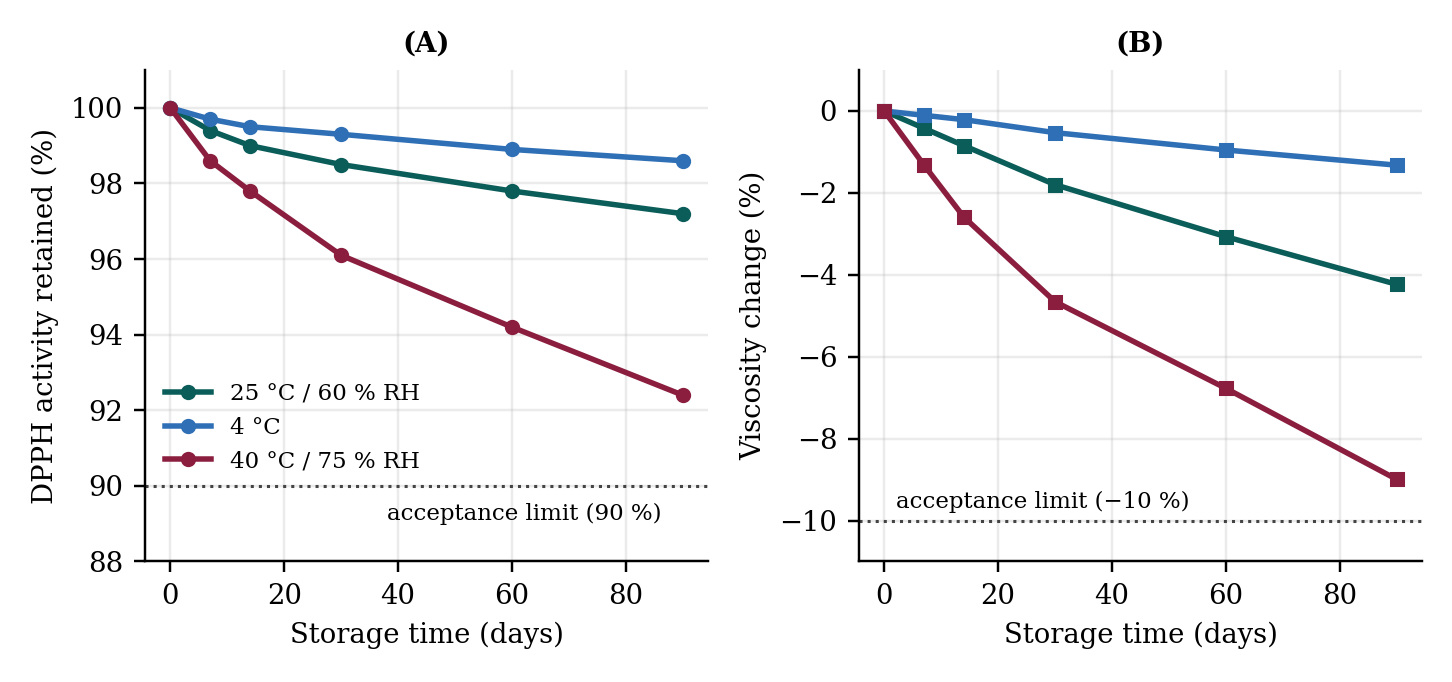
In centrifugation and freeze–thaw testing, the base and batches F1–F4 showed no separation, whereas F5 showed slight surface creaming that recovered on stirring. The reduced physical robustness of F5 agrees with its low viscosity and the disruption of the structuring network at high hydrophilic extract load.
The loss of DPPH activity at 40 °C/75% RH averaged about 0.08 percentage points per day over 90 days, and the viscosity loss about 0.1% per day. These rates are modest, but they were measured on a single batch over three months and under a fixed set of conditions, so they are reported as evidence of adequate short-term robustness rather than as a basis for extrapolating shelf life. Long-term studies at 30 °C/65% RH (or 30 °C/75% RH for Zone IVb), with chromatographic tracking of EGCG and punicalagin, would be needed to set an expiry period [40].
3.7Selection of the optimised formulation
Antioxidant potency rose monotonically with extract load, but physical acceptability and stability deteriorated at the highest load, so batch selection required a compromise. In the weighted scoring, the totals (maximum 35) were F1 26, F2 28, F3 31, F4 34 and F5 28. F4 (10% aloe gel, 5% green tea extract, 2.5% pomegranate peel extract) therefore ranked highest. F5 marginally exceeded F4 in scavenging potency but was penalised for grittiness, softer body, creaming on stress testing and a stronger astringent odour. This illustrates a general principle in cosmeceutical development: the batch with the greatest in vitro potency is not necessarily the one with the greatest pharmaceutical utility.
3.8Statistical analysis and comparison with a marketed cream
One-way ANOVA showed significant differences among batches for pH (F = 48.62), viscosity (F = 112.40), spreadability (F = 96.85), DPPH inhibition at 160 µg/mL (F = 134.21) and the S. aureus zone of inhibition (F = 78.94), all P < 0.001. In Tukey’s post-hoc comparisons, DPPH inhibition did not differ significantly between F4 and F5, giving statistical support for choosing the lower-load batch F4 without a measurable loss of efficacy.
Compared with the marketed herbal face cream (Table 6), F4 matched the product on pH, washability and greasiness and spread more readily, while the marketed cream was slightly firmer. F4 inhibited 86.90 ± 1.71% of DPPH at 160 µg/mL versus 71.40 ± 1.94% for the marketed cream, and its IC50 (35.42 µg/mL) was about 1.8-fold lower than that of the marketed cream (62.84 µg/mL). The advantage is plausibly due to the higher total polyphenol load and the combination of three complementary botanicals, but the composition of the marketed product was not disclosed, so the comparison is descriptive and does not isolate the cause.
| Parameter | Formulation F4 | Marketed cream | Inference |
|---|---|---|---|
| pH | 5.78 ± 0.04 | 6.12 ± 0.05 | Both within physiological range |
| Viscosity (cP) | 18,900 ± 410 | 21,300 ± 380 | Marketed cream slightly firmer |
| Spreadability (g·cm/s) | 9.38 ± 0.26 | 7.82 ± 0.22 | F4 spreads more readily |
| DPPH inhibition at 160 µg/mL (%) | 86.90 ± 1.71 | 71.40 ± 1.94 | F4 higher |
| IC₅₀ (µg/mL) | 35.42 | 62.84 | F4 about 1.8-fold more potent |
| Washability / greasiness | Washable / non-greasy | Washable / non-greasy | Comparable |
3.9Limitations
Several limitations should be noted. First, antioxidant activity was measured with a single cell-free radical assay (DPPH), which does not model the enzymatic and compartmentalised defences of living skin; confirmation with complementary assays (ABTS, FRAP) and cell-based or ex vivo models is needed. Second, no instrumental measurement of hydration, elasticity or transepidermal water loss was made, so anti-ageing benefit remains an inference from mechanism rather than a demonstrated outcome. Third, extracts were standardised only by total phenolic content and not by chromatographic quantification of markers such as EGCG and punicalagin, which limits batch-to-batch reproducibility. Fourth, the patch-test panel was small and the stability data cover 90 days for one batch, so shelf life cannot be assigned. Finally, microbiological quality (total plate count) and preservative efficacy were not tested.
4Conclusion
Five O/W creams combining Aloe vera gel, green tea extract and pomegranate peel extract were successfully formulated. Antioxidant and antimicrobial activity increased with extract load, while viscosity and physical robustness decreased, so the most potent batch (F5) was not the most suitable. Batch F4 offered the best balance: skin-compatible pH, good spreadability, DPPH potency equal to 82% of that of ascorbic acid, negligible irritation in volunteers, stability for 90 days including accelerated storage, and about 1.8-fold greater DPPH potency than a marketed herbal cream. F4 is a promising, low-cost herbal cosmeceutical candidate. Marker-based standardisation of extracts, complementary antioxidant and cell-based assays, preservative-efficacy and microbial-limit testing, longer stability studies and controlled human efficacy trials should follow.
Acknowledgments
The authors thank the Principal and the Department of Pharmaceutics, Harishchandra P.G. College, Varanasi, for providing laboratory facilities, and the volunteers who took part in the patch test.
Funding
[Funding statement to be supplied by the authors.]
Author Contributions
Shweta Kushwaha (first author): conceptualisation of the experimental work, investigation (extraction, formulation, evaluation), data curation, formal analysis and writing of the original draft. Pradeep Kumar (second and corresponding author): conceptualisation, supervision, methodology, validation, project administration, writing (review and editing), and correspondence with the journal. Both authors read and approved the final manuscript.
Conflict of Interest
The authors declare no conflict of interest.
Ethics Statement
The human patch test was conducted after clearance by the Institutional Ethics Committee (approval no. [to be inserted]) and after written informed consent from all volunteers.
References
- [1]Fisher GJ, Kang S, Varani J, Bata-Csorgo Z, Wan Y, Datta S, et al. Mechanisms of photoaging and chronological skin aging. Arch Dermatol. 2002;138(11):1462–70.
- [2]Rittié L, Fisher GJ. Natural and sun-induced aging of human skin. Cold Spring Harb Perspect Med. 2015;5(1):a015370.
- [3]Krutmann J, Bouloc A, Sore G, Bernard BA, Passeron T. The skin aging exposome. J Dermatol Sci. 2017;85(3):152–61.
- [4]Rinnerthaler M, Bischof J, Streubel MK, Trost A, Richter K. Oxidative stress in aging human skin. Biomolecules. 2015;5(2):545–89.
- [5]Poljšak B, Dahmane R. Free radicals and extrinsic skin aging. Dermatol Res Pract. 2012;2012:135206.
- [6]Pinnell SR. Cutaneous photodamage, oxidative stress, and topical antioxidant protection. J Am Acad Dermatol. 2003;48(1):1–19.
- [7]Masaki H. Role of antioxidants in the skin: anti-aging effects. J Dermatol Sci. 2010;58(2):85–90.
- [8]Aburjai T, Natsheh FM. Plants used in cosmetics. Phytother Res. 2003;17(9):987–1000.
- [9]Ribeiro AS, Estanqueiro M, Oliveira MB, Sousa Lobo JM. Main benefits and applicability of plant extracts in skin care products. Cosmetics. 2015;2(2):48–65.
- [10]Zillich OV, Schweiggert-Weisz U, Eisner P, Kerscher M. Polyphenols as active ingredients for cosmetic products. Int J Cosmet Sci. 2015;37(5):455–64.
- [11]Mukherjee PK, Maity N, Nema NK, Sarkar BK. Bioactive compounds from natural resources against skin aging. Phytomedicine. 2011;19(1):64–73.
- [12]Jadoon S, Karim S, Bin Asad MHH, Akram MR, Khan AK, Malik A, et al. Anti-aging potential of phytoextract loaded-pharmaceutical creams for human skin cell longevity. Oxid Med Cell Longev. 2015;2015:709628.
- [13]Reynolds T, Dweck AC. Aloe vera leaf gel: a review update. J Ethnopharmacol. 1999;68(1–3):3–37.
- [14]Hamman JH. Composition and applications of Aloe vera leaf gel. Molecules. 2008;13(8):1599–616.
- [15]Surjushe A, Vasani R, Saple DG. Aloe vera: a short review. Indian J Dermatol. 2008;53(4):163–6.
- [16]Dal'Belo SE, Gaspar LR, Maia Campos PMBG. Moisturizing effect of cosmetic formulations containing Aloe vera extract in different concentrations assessed by skin bioengineering techniques. Skin Res Technol. 2006;12(4):241–6.
- [17]Hsu S. Green tea and the skin. J Am Acad Dermatol. 2005;52(6):1049–59.
- [18]Katiyar SK, Elmets CA. Green tea polyphenolic antioxidants and skin photoprotection (review). Int J Oncol. 2001;18(6):1307–13.
- [19]Elmets CA, Singh D, Tubesing K, Matsui M, Katiyar S, Mukhtar H. Cutaneous photoprotection from ultraviolet injury by green tea polyphenols. J Am Acad Dermatol. 2001;44(3):425–32.
- [20]Nichols JA, Katiyar SK. Skin photoprotection by natural polyphenols: anti-inflammatory, antioxidant and DNA repair mechanisms. Arch Dermatol Res. 2010;302(2):71–83.
- [21]Oyetakin White P, Tribout H, Baron E. Protective mechanisms of green tea polyphenols in skin. Oxid Med Cell Longev. 2012;2012:560682.
- [22]Chiu AE, Chan JL, Kern DG, Kohler S, Rehmus WE, Kimball AB. Double-blinded, placebo-controlled trial of green tea extracts in the clinical and histologic appearance of photoaging skin. Dermatol Surg. 2005;31(7 Pt 2):855–60.
- [23]Heinrich U, Moore CE, De Spirt S, Tronnier H, Stahl W. Green tea polyphenols provide photoprotection, increase microcirculation, and modulate skin properties of women. J Nutr. 2011;141(6):1202–8.
- [24]Li Y, Guo C, Yang J, Wei J, Xu J, Cheng S. Evaluation of antioxidant properties of pomegranate peel extract in comparison with pomegranate pulp extract. Food Chem. 2006;96(2):254–60.
- [25]Negi PS, Jayaprakasha GK, Jena BS. Antioxidant and antimutagenic activities of pomegranate peel extracts. Food Chem. 2003;80(3):393–7.
- [26]Akhtar S, Ismail T, Fraternale D, Sestili P. Pomegranate peel and peel extracts: chemistry and food features. Food Chem. 2015;174:417–25.
- [27]Fischer UA, Carle R, Kammerer DR. Identification and quantification of phenolic compounds from pomegranate (Punica granatum L.) peel, mesocarp, aril and differently produced juices by HPLC-DAD-ESI/MSn. Food Chem. 2011;127(2):807–21.
- [28]Aslam MN, Lansky EP, Varani J. Pomegranate as a cosmeceutical source: pomegranate fractions promote proliferation and procollagen synthesis and inhibit matrix metalloproteinase-1 production in human skin cells. J Ethnopharmacol. 2006;103(3):311–8.
- [29]Afaq F, Malik A, Syed DN, Maes D, Matsui MS, Mukhtar H. Pomegranate fruit extract modulates UV-b-mediated phosphorylation of mitogen-activated protein kinases and activation of nuclear factor kappa b in normal human epidermal keratinocytes. Photochem Photobiol. 2005;81(1):38–45.
- [30]Seeram NP, Adams LS, Henning SM, Niu Y, Zhang Y, Nair MG, et al. In vitro antiproliferative, apoptotic and antioxidant activities of punicalagin, ellagic acid and a total pomegranate tannin extract are enhanced in combination with other polyphenols as found in pomegranate juice. J Nutr Biochem. 2005;16(6):360–7.
- [31]World Health Organization. Quality control methods for medicinal plant materials. Geneva: World Health Organization; 1998.
- [32]Harborne JB. Phytochemical methods: a guide to modern techniques of plant analysis. 3rd ed. London: Chapman and Hall; 1998.
- [33]Singleton VL, Rossi JA. Colorimetry of total phenolics with phosphomolybdic–phosphotungstic acid reagents. Am J Enol Vitic. 1965;16(3):144–58.
- [34]Chang CC, Yang MH, Wen HM, Chern JC. Estimation of total flavonoid content in propolis by two complementary colorimetric methods. J Food Drug Anal. 2002;10(3):178–82.
- [35]Brand-Williams W, Cuvelier ME, Berset C. Use of a free radical method to evaluate antioxidant activity. LWT – Food Sci Technol. 1995;28(1):25–30.
- [36]Molyneux P. The use of the stable free radical diphenylpicrylhydrazyl (DPPH) for estimating antioxidant activity. Songklanakarin J Sci Technol. 2004;26(2):211–9.
- [37]Prior RL, Wu X, Schaich K. Standardized methods for the determination of antioxidant capacity and phenolics in foods and dietary supplements. J Agric Food Chem. 2005;53(10):4290–302.
- [38]Balouiri M, Sadiki M, Ibnsouda SK. Methods for in vitro evaluating antimicrobial activity: a review. J Pharm Anal. 2016;6(2):71–9.
- [39]Draize JH, Woodard G, Calvery HO. Methods for the study of irritation and toxicity of substances applied topically to the skin and mucous membranes. J Pharmacol Exp Ther. 1944;82(3):377–90.
- [40]International Conference on Harmonisation. ICH harmonised tripartite guideline Q1A(R2): stability testing of new drug substances and products. Geneva: ICH; 2003.
- [41]Zhu QY, Zhang A, Tsang D, Huang Y, Chen ZY. Stability of green tea catechins. J Agric Food Chem. 1997;45(12):4624–8.
- [42]Kaur IP, Kapila M, Agrawal R. Role of novel delivery systems in developing topical antioxidants as therapeutics to combat photoageing. Ageing Res Rev. 2007;6(4):271–88.
- [43]Al-Zoreky NS. Antimicrobial activity of pomegranate (Punica granatum L.) fruit peels. Int J Food Microbiol. 2009;134(3):244–8.