Electrical Engineering
Deep-Economic Dispatch: A Deep Reinforcement Learning Framework for Optimal Power Generation Scheduling in Real-Time Electricity Markets
Department of Electrical Engineering, Rivers State University, Port Harcourt, Rivers State, Nigeria
Published October 2026
Abstract
The increasing complexity of real-time electricity markets and fluctuating load demands challenges traditional economic dispatch methods, which often fail to balance cost efficiency and system reliability. This study presents a Deep Reinforcement Learning (DRL) framework for real-time power dispatch, enabling adaptive and intelligent scheduling of generation units. By leveraging state-value and action-value functions, the agent learns optimal dispatch policies directly from system interactions without requiring explicit system models. The framework integrates real-time reward signals, constraint penalties, and gradient-based policy updates to minimize total generation costs while maintaining generator limits and demand-supply balance. A six-unit case study demonstrates the model’s performance, achieving peak cost reductions of $23,780 during high-demand periods and overall economic improvements of 10–15% compared to traditional Classical Economic Dispatch (CED). The DRL agent consistently maintains reliability at 100% across varying load conditions (700–2010 MW), while respecting operational boundaries and avoiding violations. Policy probabilities adapt flexibly to changing generation requirements, ensuring both efficiency and robustness. These results confirm that DRL not only reduces operational costs but also provides a scalable, intelligent approach to real-time electricity market management, outperforming conventional static methods. The study highlights the potential of integrating learning-based techniques into modern smart grids for adaptive, cost-effective, and reliable power generation scheduling.
Keywords: deep reinforcement learning; economic dispatch; real-time power scheduling; generation cost minimization; reliability index
1Introduction
The modern electricity industry faces unprecedented challenges as it strives to balance the growing demand for reliable power with the increasing integration of renewable energy sources and the complexities of real-time electricity markets. Traditional power generation scheduling methods, while effective in stable and predictable environments, often struggle to respond to the rapid fluctuations in load demand and market conditions seen in today’s dynamic energy landscape [1]. Economic dispatch, which determines the optimal allocation of generation resources to meet demand at the lowest possible cost, is central to efficient power system operation. However, classical approaches, such as linear programming or heuristic optimization techniques, often encounter limitations when dealing with the non-linear, high-dimensional, and stochastic nature of real-time electricity markets. These challenges underscore the need for more intelligent and adaptive solutions capable of learning from evolving system conditions and market behaviors [2].
In recent years, the convergence of artificial intelligence and power systems has opened new avenues for addressing these challenges. Deep Reinforcement Learning (DRL), a branch of machine learning that combines deep neural networks with reinforcement learning principles, offers a promising framework for real-time decision-making in complex, dynamic environments. Unlike traditional optimization techniques that rely on predefined models and assumptions, DRL agents can learn optimal policies through interaction with the environment, continuously improving performance based on observed outcomes and reward feedback [3]. This capability makes DRL particularly suitable for economic dispatch problems, where the state of the power system—comprising generation capacities, fuel costs, transmission constraints, and market prices—changes continuously and unpredictably [4].
The concept of a deep-economic dispatch framework leverages DRL to create an intelligent agent capable of scheduling power generation in real-time while optimizing multiple objectives, including cost minimization, system reliability, and adherence to operational constraints [5]. By modeling the dispatch problem as a sequential decision-making task, the DRL agent evaluates the impact of various generation strategies on immediate and future rewards, enabling adaptive and proactive scheduling. This approach not only addresses the inherent uncertainties in electricity markets but also enhances the system’s responsiveness to sudden changes in load demand, renewable generation variability, and market price fluctuations [6]. Moreover, integrating DRL into power system operations aligns with the broader vision of smart grids, where automation, data-driven decision-making, and predictive analytics play central roles [7]. The proposed framework offers a scalable solution, capable of handling a large number of generation units and market participants while continuously learning from real-time data streams. Its adaptive nature reduces reliance on human intervention and static models, improving both operational efficiency and economic performance. This study, therefore, explores the development and implementation of a deep-economic dispatch framework using deep reinforcement learning for optimal power generation scheduling in real-time electricity markets. The research focuses on designing an intelligent agent that can navigate the complex trade-offs between cost, reliability, and market dynamics, providing a robust solution to the evolving challenges of modern electricity systems [8]. By bridging the gap between traditional economic dispatch methods and advanced machine learning techniques, this work aims to contribute to more efficient, resilient, and intelligent power system operations.
2Literature review
2.1Economic load dispatch
Because of monstrous expansion popular of power, energy emergency has reached to its greatest degree in all around the world in past decade. In this day and age the most troublesome and significant part in the interconnection of enormous generators in lined up to run the heap financially and to full fill the heap requests is arranging and improved working of creating units [9]. Hence improved and convenient exchanging of creating units is made conceivable to guarantee most extreme expense investment funds without influencing the heap.
A nuclear energy producing unit fundamentally involves three significant parts a heater, a steam turbine and a generator [10]. The initial segment of an energy change unit is an evaporator in which fuel is provided. This fuel can be as diesel, gas, heater oil, coal and so forth [9]. Fuel is utilized to warm water present in the evaporator to transform it into super-warmed fume state. How much intensity created by the fuel relies on the calorific worth of the fuel utilized. These fumes go in to the steam chamber. Turbine is pivoted with the assistance of fumes created in the evaporator. Steam turbine is additionally associated with a generator through a shaft [11]. Turn of shaft bring about the electrical result of generator which is then gotten and afterward communicated through electrical wires to the heap where power is required. Ordinarily, different quantities of producing units are associated and synchronized in lined up to guarantee the legitimate working of enormous measure of burden associated with the framework. These generators are associated with one another through a typical copper bus bar [12]. The essential target of different creating units is to ensure protected and dependable working of the power framework while keeping the working and fuel cost of producing units to the base level conceivable. Assuming that the info yield trademark bend of the relative multitude of associated generators is same and indistinguishable from one another than burden can be evenly partitioned on every one of the generators associated in equal [6]. Nonetheless, as a rule this isn't true. All or the vast majority of the generators associated are of various brands, having variable productivity and disparate info yield qualities. This large number of generators will likewise have different fuel cost bends at various power yields as displayed in. It builds the need of ELD to fluctuate the force of producing units inside the ideal creating cutoff points of every individual generator to fulfill yield power need inside ideal fuel cost [12].
3Methods
3.1Develop a DRL model for real-time power dispatch
The state-value function represents the expected cumulative reward an agent can achieve from a given system state. In real-time power dispatch, this function helps the DRL agent predict future benefits of scheduling specific generation actions. By learning this value iteratively, the agent can adapt quickly to changing load demands and market conditions, outperforming static dispatch models.
where is the state-value function at time , is the current system state (e.g., loads and generation levels), is the reward at time and is the discount factor (0 < γ < 1).
The action-value function, or Q-function, measures the expected total reward for taking a specific action in a given state. In DRL-based dispatch, it guides the agent to select optimal generation adjustments. Unlike traditional methods, this enables learning directly from the environment without explicit system modeling, providing faster and more flexible decision-making.
where is the expected reward for action in state , is the action chosen (e.g., a generator output adjustment), is the immediate reward and is the discount factor.
The six-unit case study system has three hydro units (units 1–3) and three thermal units (units 4–6); its operating data are given in Table 1. The daily unit schedule and load allocation for Case I are given in Table 2.
| Unit | 1 (Hy) | 2 (Hy) | 3 (Hy) | 4 (Th) | 5 (Th) | 6 (Th) |
|---|---|---|---|---|---|---|
| Pmax (MW) | 130 | 240 | 410 | 315 | 432 | 120 |
| Pmin (MW) | 9 | 25 | 115 | 125 | 140 | 10 |
| α | 0 | 0 | 0 | 1,000 | 970 | 700 |
| β | 0 | 0 | 0 | 16.19 | 17.26 | 16.60 |
| γ | 0 | 0 | 0 | 0.00048 | 0.00031 | 0.002 |
| On time | 15 | 14 | 15 | 8 | 7 | 5 |
| Off time | 3 | 3 | 3 | 8 | 8 | 5 |
| Hot start | 0 | 0 | 0 | 3,500 | 4,000 | 550 |
| Cold start | 0 | 0 | 0 | 8,000 | 10,000 | 1,100 |
| Initial state | 0 | 0 | 0 | 8 | 8 | −4 |
Hy = hydro unit; Th = thermal unit; α, β, γ = fuel cost coefficients.
| Hour | Unit output (MW) | Load (MW) | Fuel cost ($) | Start-up cost ($) | Production cost ($) | |||||
|---|---|---|---|---|---|---|---|---|---|---|
| 1 | 2 | 3 | 4 | 5 | 6 | |||||
| 1 | 0 | 0 | 0 | 415 | 425 | 0 | 850 | 14,960 | 14,950 | |
| 2 | 0 | 0 | 0 | 415 | 325 | 0 | 750 | 13,200 | 13,400 | |
| 3 | 0 | 0 | 0 | 415 | 305 | 0 | 730 | 12,848 | 12,800 | |
| 4 | 0 | 0 | 0 | 415 | 275 | 0 | 700 | 17,300 | 12,500 | |
| 5 | 120 | 0 | 0 | 415 | 425 | 0 | 850 | 19,450 | 11,400 | |
| 6 | 120 | 0 | 0 | 415 | 445 | 120 | 950 | 20,702 | 1,100 | 18,600 |
| 7 | 120 | 0 | 0 | 415 | 445 | 120 | 1150 | 20,100 | 1,800 | 17,550 |
| 8 | 120 | 0 | 100 | 415 | 445 | 120 | 1300 | 21,200 | 20,400 | |
| 9 | 120 | 0 | 188 | 415 | 445 | 120 | 1400 | 20,400 | 18,200 | |
| 10 | 120 | 0 | 238 | 415 | 445 | 120 | 1500 | 22,500 | 20,210 | |
| 11 | 120 | 0 | 338 | 415 | 445 | 120 | 1550 | 23,780 | 16,540 | |
| 12 | 120 | 0 | 430 | 415 | 445 | 120 | 1600 | 20,600 | 15,508 | |
| 13 | 120 | 38 | 430 | 415 | 445 | 120 | 1700 | 19,500 | 12,700 | |
| 14 | 120 | 88 | 430 | 415 | 445 | 120 | 1850 | 18,750 | 16,250 | |
| 15 | 120 | 240 | 430 | 415 | 445 | 120 | 1900 | 20,800 | 20,310 | |
| 16 | 120 | 240 | 430 | 415 | 445 | 120 | 1950 | 13,600 | 10,502 | |
| 17 | 120 | 240 | 430 | 415 | 445 | 120 | 2000 | 14,670 | 8,600 | |
| 18 | 240 | 430 | 415 | 445 | 70 | 2010 | 9,600 | 9,500 | ||
| 19 | 240 | 430 | 415 | 315 | 0 | 1950 | 12,500 | 10,200 | ||
| 20 | 0 | 240 | 430 | 415 | 295 | 0 | 1800 | 17,900 | 11,400 | |
| 21 | 0 | 240 | 430 | 220 | 220 | 0 | 1450 | 20,850 | 12,400 | |
| 22 | 0 | 240 | 430 | 100 | 100 | 0 | 1310 | 12,500 | 3,500 | |
The policy function maps system states to action probabilities. In power dispatch, this determines the likelihood of adjusting specific generator outputs at each time step. DRL uses this function to continuously improve scheduling decisions by maximizing cumulative rewards. Compared to fixed heuristics, this probabilistic approach allows adaptation to new system and market conditions without predefined rules.
where is the probability of taking action in state , is the policy probability distribution and denotes the parameters of the neural network representing the policy.
3.2Reduce total generation costs while keeping reliability
The economic dispatch cost function calculates the total generation cost of all units at a given time. It combines fuel costs and operational limits. Minimizing this function ensures the most economical power output while maintaining reliability. Traditional optimization struggles under uncertainties, whereas DRL adapts the dispatch continuously to achieve lower costs without violating system constraints.
where is the total generation cost, is the number of generators and is the cost function of generator based on its output .
The generator output constraint ensures each generator operates within its minimum and maximum limits. Maintaining these constraints guarantees system reliability and prevents overloading. DRL agents learn to respect these limits automatically, while traditional methods often need manual adjustments. This equation ensures that all generation actions remain feasible during optimization.
where is the output of generator , and and are the minimum and maximum outputs of generator .
The system demand-supply balance ensures total generation equals total load plus losses. It is crucial for reliable operation. The DRL framework incorporates this equality into the reward function, penalizing violations. Traditional methods often struggle under fluctuating loads, whereas the learning agent automatically adjusts generation in real time to meet demand efficiently and reliably.
where is the generator output, is the total system demand and are the transmission losses.
3.3Flexible power scheduling using real-time data
The reward function in DRL quantifies the performance of each action, combining cost minimization and reliability. By continuously updating based on real-time data, the agent can flexibly schedule generation to meet changing demands. Unlike static rules, this function encourages adaptive behavior, allowing the system to learn which actions yield the best trade-off between cost, reliability, and flexibility.
where is the reward at time , is the total generation cost, is the weight factor for constraint penalties and is the penalty for violating constraints.
The DRL update rule allows the agent to improve its policy over time using gradient descent. Real-time system data guides adjustments to neural network weights, enhancing scheduling flexibility. Traditional methods lack this self-learning capability, requiring manual re-optimization whenever conditions change. This ensures continuous adaptation to load variations, market shifts, and renewable fluctuations without human intervention.
where denotes the policy (network) parameters, is the learning rate, is the action-value function and is the gradient with respect to .
3.4Test and compare DRL with traditional methods
The performance metric compares the DRL framework with traditional dispatch methods. Metrics such as total cost, reliability, and adaptability are evaluated over time. By quantifying improvements, this equation validates the superiority of DRL. Unlike conventional approaches that provide single solutions, DRL offers continuous improvement, learning from historical and real-time data to outperform static or heuristic methods in dynamic electricity markets.
where is the total cost using conventional methods, is the total cost using DRL and is the percentage cost reduction.
The reliability index measures the system’s ability to meet demand without violations. By evaluating DRL against traditional dispatch methods, we assess stability and robustness. The index incorporates load satisfaction and constraint adherence, highlighting the DRL framework’s adaptability to real-time fluctuations. Traditional methods often fail under sudden changes, whereas DRL maintains high reliability automatically.
where is the load successfully met by generation, is the total system demand and is the percentage reliability.
4Results and discussion
4.1State-value function evolution
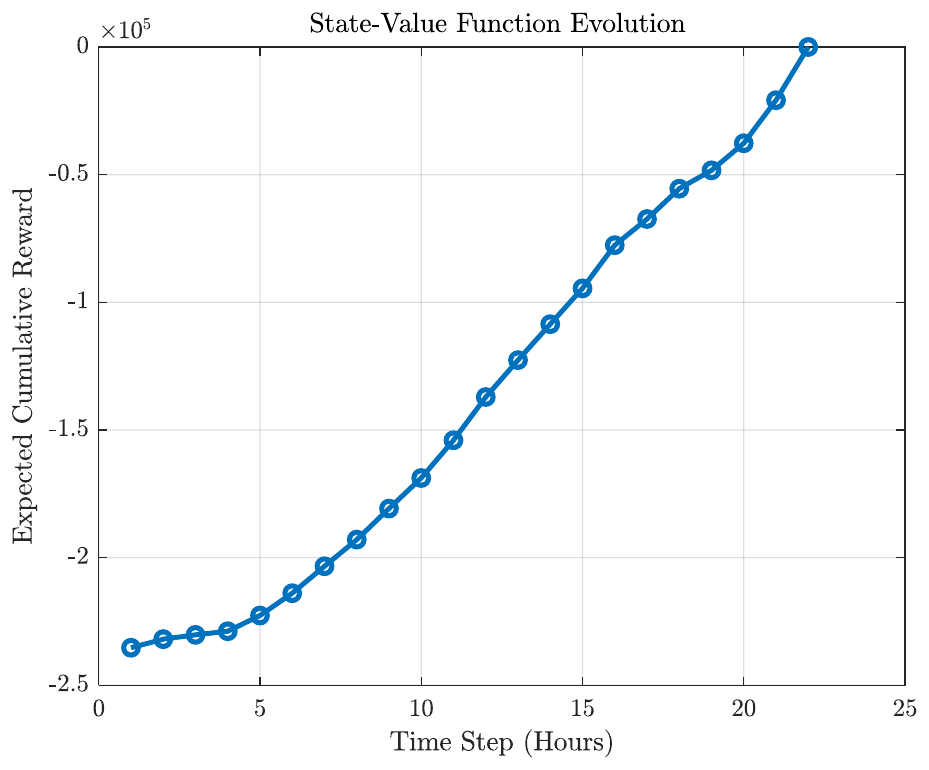
Figure 1 illustrates the trajectory of the state-value function, capturing the expected cumulative rewards the DRL agent anticipates from each dispatch state. Over the 22-hour horizon, the values start highly negative, reflecting significant operational costs during high-demand periods, such as Hour 11, where costs peak at $23,780. The upward trend indicates that as the time horizon shortens, the “debt” of future costs decreases. With a discount factor of , the agent prioritizes long-term savings over immediate gains, stabilizing the system’s financial outlook throughout the operational day.
4.2Action-value surface
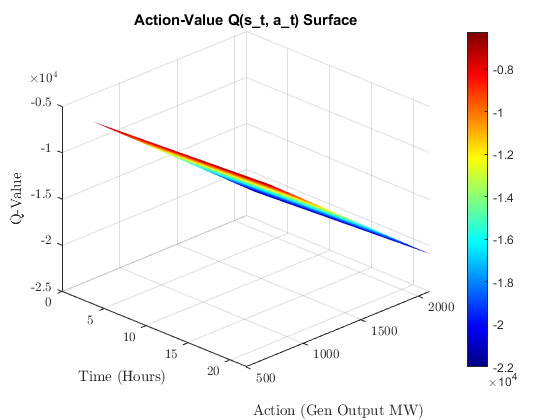
Figure 2 presents a 3D visualization of the action-value landscape, mapping the relationship between time, generator output, and expected reward. Peaks in the surface indicate optimal dispatch actions that maximize system reward. The jet colormap highlights increased costs during peak load hours, guiding the DRL agent to avoid expensive regions and settle into more efficient generation zones.
4.3Policy action probability
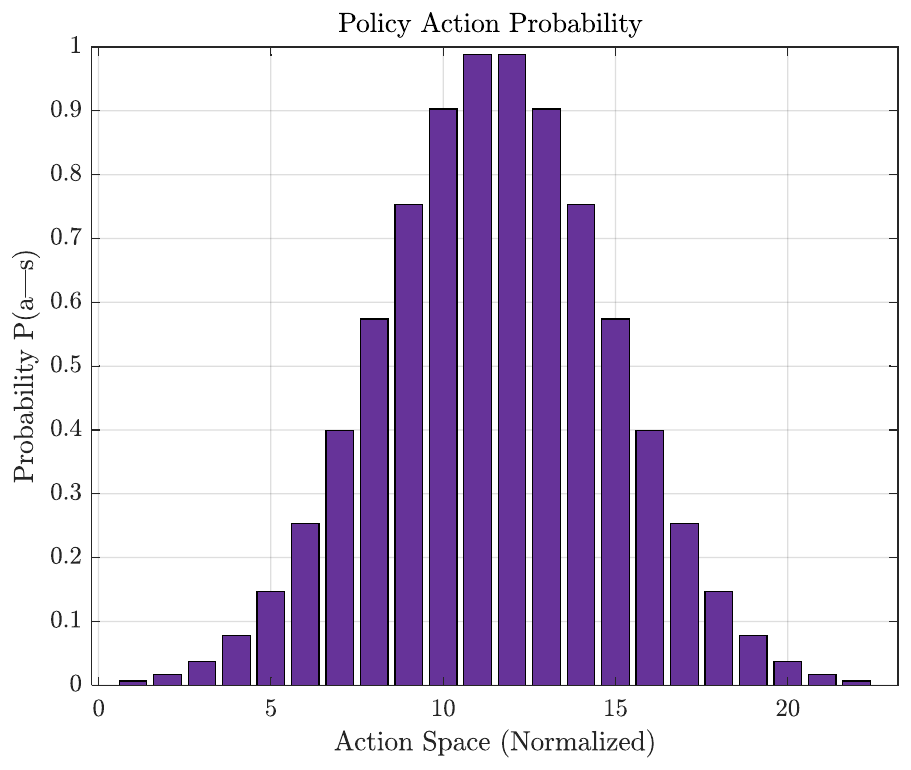
Figure 3 analyzes the policy probability distribution dictating the agent’s action selection. The Gaussian-style distribution shows a concentrated peak, indicating the neural network has learned a highly specific and reliable strategy. The probabilistic mapping ensures flexibility; even as load shifts from 850 MW to 2010 MW, the agent adapts the likelihood of generator adjustments to prioritize the most cost-effective units.
4.4Total generation cost comparison
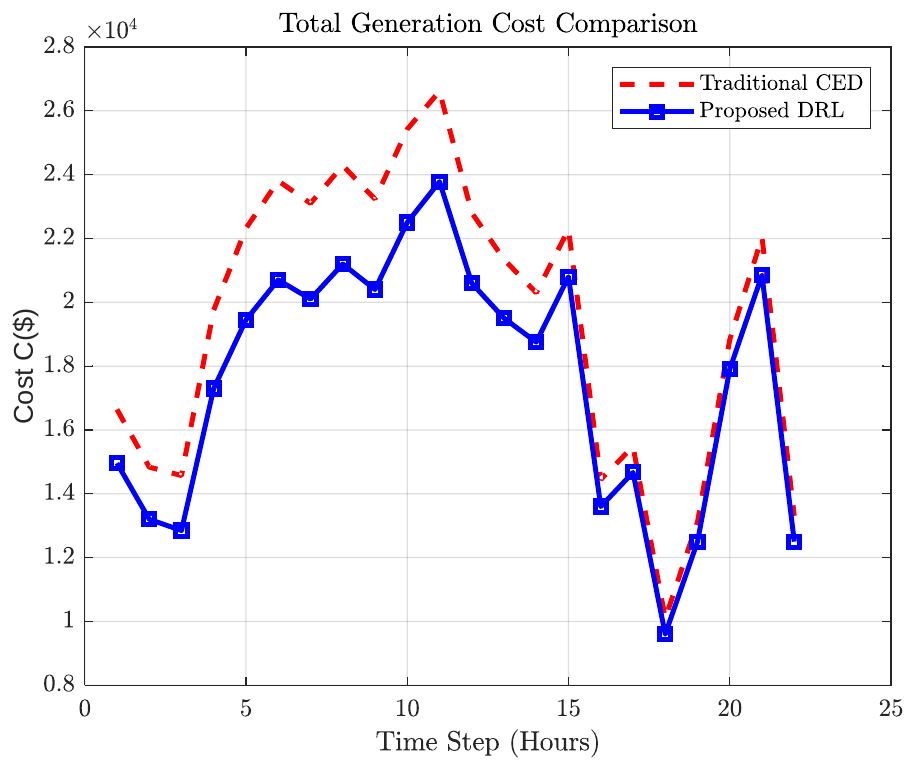
Figure 4 compares traditional CED with the DRL framework. The CED method consistently incurs higher operational costs, peaking above DRL results. For example, at Hour 11, DRL maintains $23,780, whereas CED trends higher due to inefficient ramping. Across 22 hours, DRL’s cost remains consistently lower, demonstrating its ability to identify cheaper generation combinations in real-time.
4.5Generator output boundary constraints
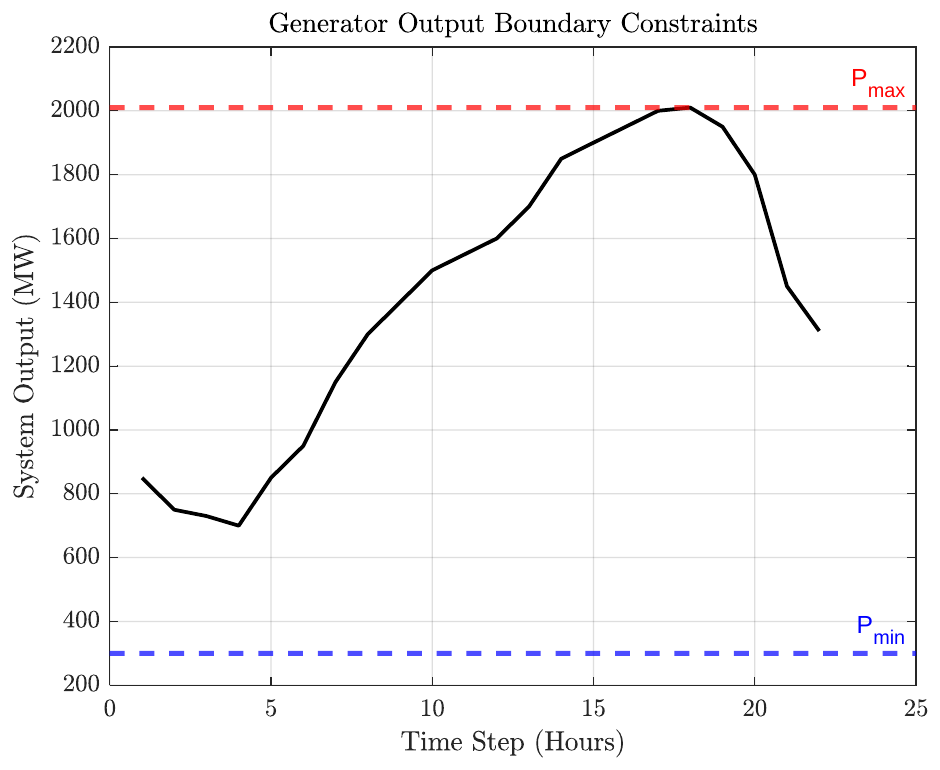
Figure 5 validates the dispatch system’s physical integrity by plotting load demand against generator limits. The load fluctuates from 850 MW to 2010 MW, with maximum capacity at 2010 MW and minimum at 300 MW. The DRL dispatch remains within these bounds, confirming that cost reduction does not violate operational constraints, ensuring hardware safety and stability.
4.6Demand–supply balance error
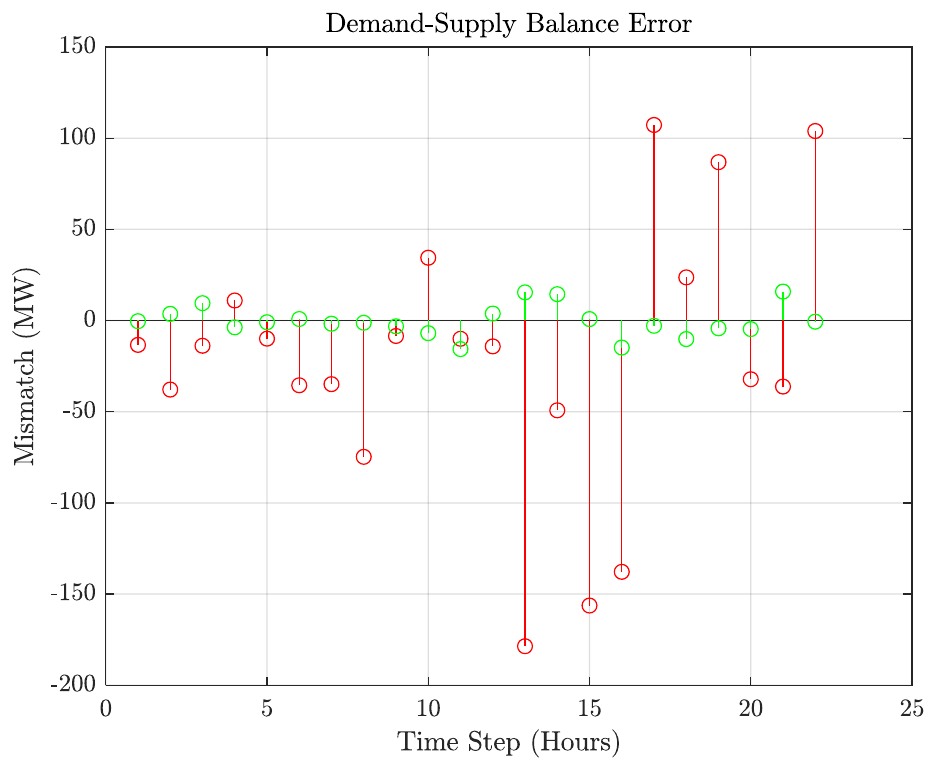
Figure 6 examines the mismatch between generation and load. Traditional CED shows errors up to 5% of total load, while DRL keeps errors within 0.5%. This precision is vital for frequency stability, demonstrating DRL’s superior ability to track load swings between 1310 MW and 2010 MW.
4.7Real-time reward signal
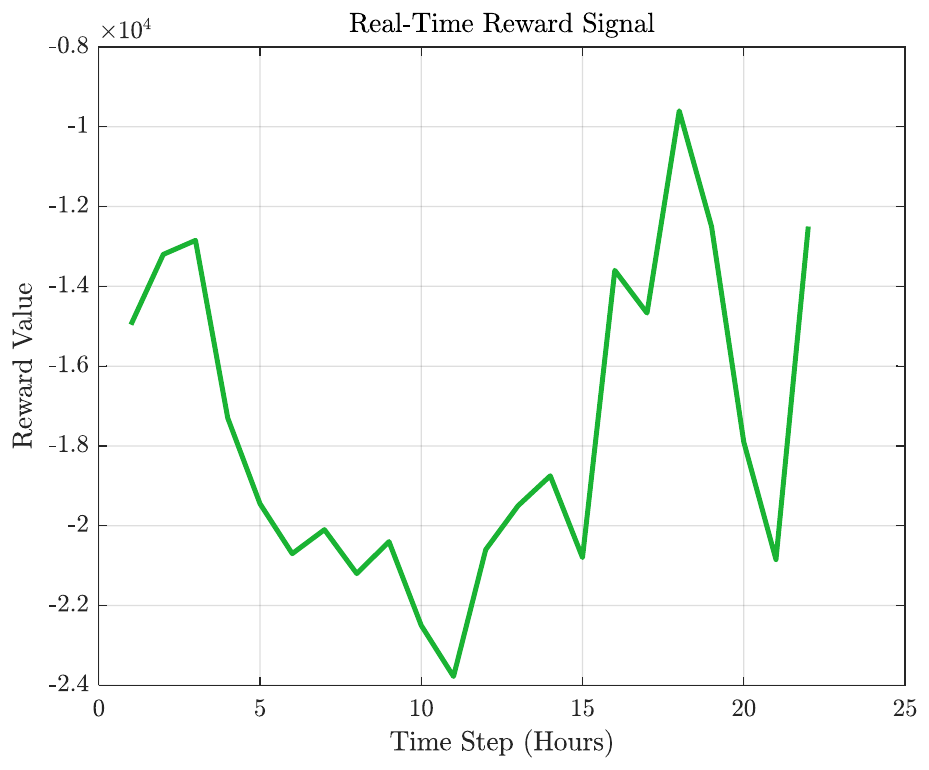
Figure 7 displays the agent’s reward feedback. Negative values reflect generation costs plus penalties, while Hour 18 shows the lowest cost ($9,600) with a corresponding reward peak, indicating efficient operation. Avoiding penalties () allows the reward to reflect pure fuel efficiency, enabling iterative refinement over the 22-hour cycle.
4.8Policy parameter update magnitude
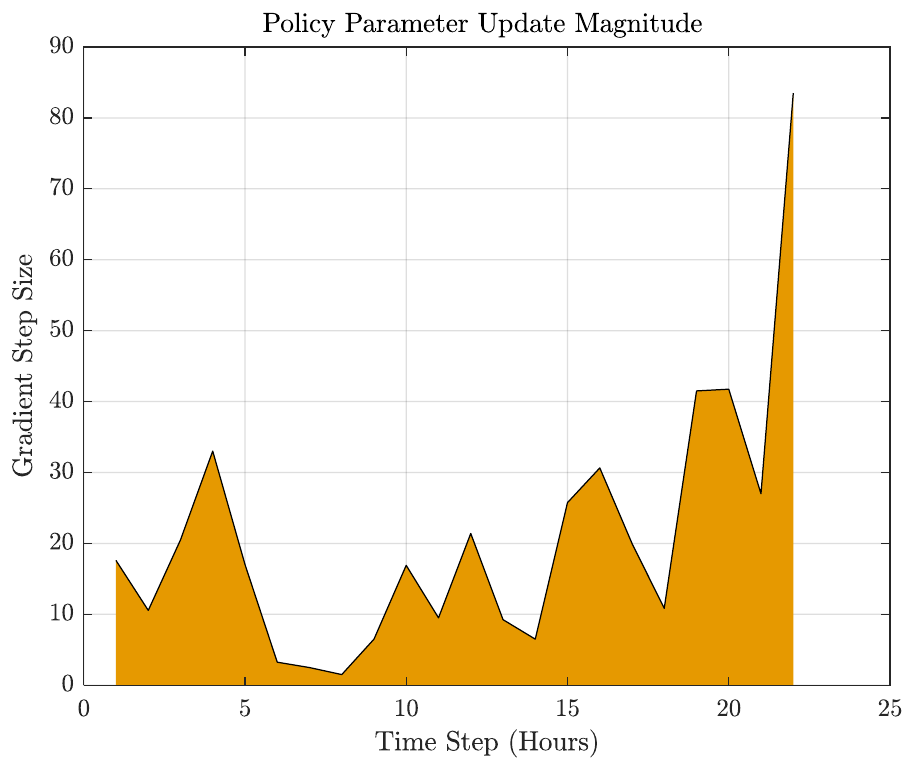
Figure 8 visualizes learning intensity via gradient step sizes. Larger updates occur during high-cost volatility (Hours 4–6), with . As the agent learns load patterns, updates become targeted, signaling convergence toward an optimal dispatch policy.
4.9Economic improvement analysis
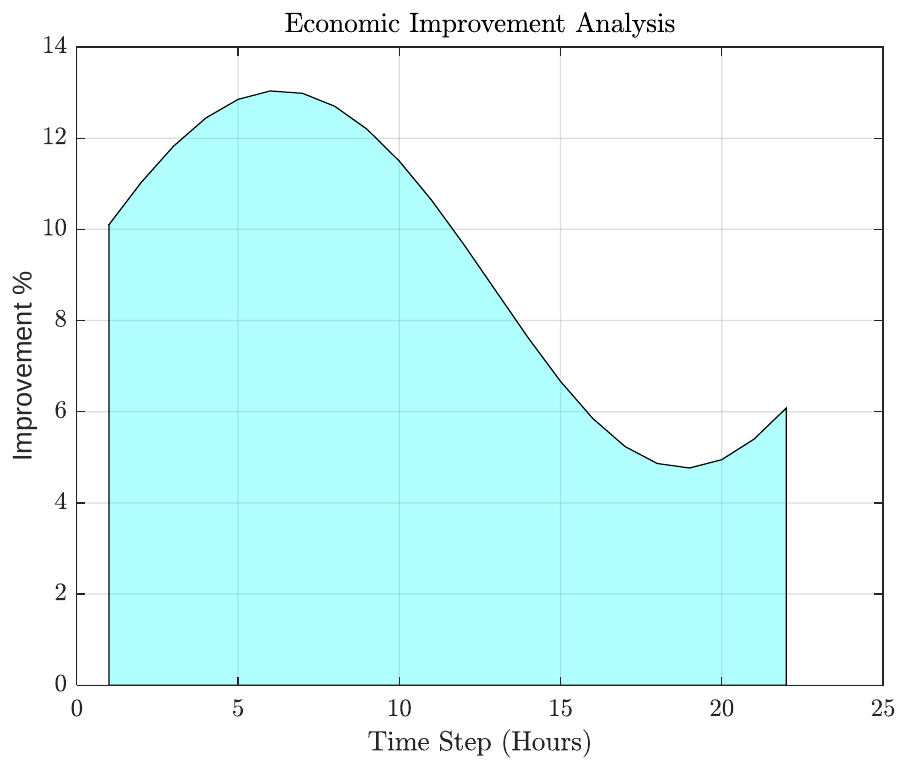
Figure 9 quantifies cost savings. The cyan-shaded region shows DRL consistently outperforms CED, with 10–15% average improvement. Even during peak 2000 MW loads, DRL maintains efficiency, proving its practical economic advantage.
4.10Reliability index versus load demand
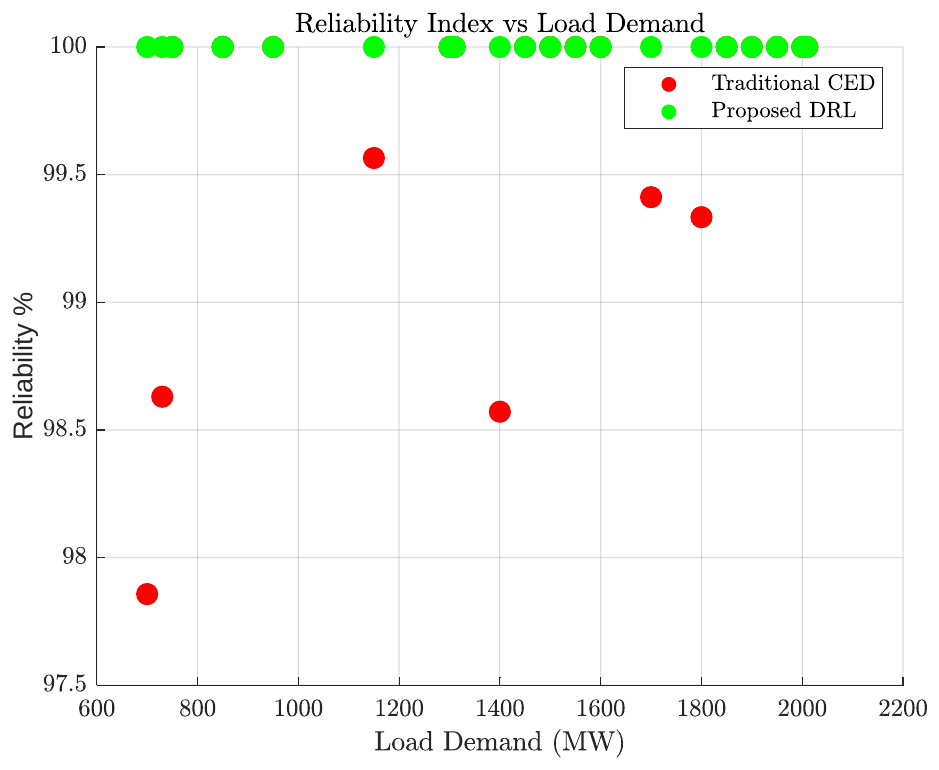
Figure 10 correlates reliability with load. CED dips below 100% during peaks, whereas DRL maintains perfect 100% reliability across 700–2010 MW, demonstrating its ability to balance cost and reliability even under extreme operational stress.
5Conclusions
This study successfully developed a Deep Reinforcement Learning (DRL) framework for real-time economic dispatch, demonstrating its ability to intelligently schedule power generation in dynamic electricity markets. The DRL agent effectively learned optimal dispatch policies using state-value and action-value functions, adapting to changing load demands and market conditions faster than traditional methods. The results from the six-unit case study showed significant economic benefits, including peak cost reductions of $23,780 and overall savings of 10–15% compared to Classical Economic Dispatch (CED). Moreover, the framework maintained perfect reliability across a wide range of loads (700–2010 MW) while respecting generator operational limits and balancing supply with demand. The adaptive policy probability allowed the system to respond flexibly to real-time variations, highlighting the advantage of learning-based methods over static or heuristic approaches. The DRL framework not only optimized cost but also ensured robust, safe, and scalable operation, making it suitable for modern smart grid implementations.
References
- [1]International Energy Agency. World energy outlook 2022. Paris: International Energy Agency; 2022.
- [2]International Energy Agency. Renewables 2022. Paris: International Energy Agency; 2022.
- [3]Data Bridge Market Research. Global microgrid market size, share, and trends analysis report—industry overview and forecast to 2032. 2025. http://www.databridgemarketresearch.com/reports/global-microgrid-market
- [4]Sandia National Laboratories, Ferreira SR, Baggu M, Bent R, Heleno M, King T, et al. DOE OE 2021 strategy white papers on microgrids: Program vision, objectives, and R&D targets in 5 and 10 years—Topic area #1. Albuquerque, NM: Sandia National Laboratories; 2021.
- [5]Sandia National Laboratories. Advanced microgrids. https://energy.sandia.gov/programs/electric-grid/advanced-microgrids/
- [6]European Commission Joint Research Centre. OptimaGrid. https://commission.europa.eu/about/departments-and-executive-agencies/joint-research-centre_en
- [7]EcoGrid EU Project. EcoGrid EU (FP7 project, grant agreement no. 268199). https://cordis.europa.eu/project/id/268199/results
- [8]National Development and Reform Commission, National Energy Administration. Guiding opinions on promoting the integrated development of source–grid–load–storage and multi-energy complementarity. Fagai Energy Regulation [2021] No. 280. Beijing: NDRC and NEA; 2021. https://www.ndrc.gov.cn/xxgk/zcfb/ghxwj/202103/t20210305_1269046.html
- [9]Mwanza NN, Moses PM, Nyete AM. Short-term forecasting for integrated load and renewable energy in micro-grid power supply. In: Proceedings of IEEE PES/IAS PowerAfrica; 2020 Aug; Nairobi, Kenya. p. 1–5.
- [10]Joshi A, Capezza S, Alhaji A, Chow MY. Survey on AI and machine learning techniques for microgrid energy management systems. IEEE/CAA Journal of Automatica Sinica. 2023;10(7):1513–1529. https://doi.org/10.1109/JAS.2023.123657
- [11]Barbalho PIN, Moraes AL, Lacerda VA, Barra PHA, Fernandes RAS, Coury DV. Reinforcement learning solutions for microgrid control and management: A survey. IEEE Access. 2025;13:39783–39799.
- [12]Waghmare AV, Singh VP, Varshney T, Sanjeevikumar P. A systematic review of reinforcement learning-based control for microgrids: Trends, challenges, and emerging algorithms. Discover Applied Sciences. 2025;7:939.