IoT, Machine Learning
An Improved Model for Fault Detection and Isolation in an IoT-Based Network
Department of Computer Science, Faculty of Science, Rivers State University, Port Harcourt, Nigeria
Published October 2026
Abstract
The rapid growth of Internet of Things (IoT) deployments has increased the need for dependable mechanisms for detecting and isolating abnormal network behaviour. Packet loss, latency, congestion, and intermittent connectivity can degrade data integrity, service continuity, and operational reliability, particularly in distributed and resource-constrained environments. This study developed an enhanced Fault Detection and Isolation System (IoTFDS) that combines supervised Random Forest classification with unsupervised Isolation Forest anomaly isolation. Network traffic data were cleaned, normalized and divided into training and testing subsets before model development. Random Forest was used to classify network states as normal or faulty, while Isolation Forest was applied to abnormal records to identify anomalous patterns and support fault localization. An intermediate evaluation produced 69.4% accuracy with zero true positives, demonstrating the importance of model refinement and class-sensitive evaluation. The final system also provided an operational interface for network monitoring, fault detection, anomaly isolation and result visualization. The findings indicate that the hybrid approach can provide accurate classification and complementary anomaly isolation for IoT network monitoring, although validation on live IoT traffic and clearer documentation of dataset provenance remain necessary.
Keywords: Internet of Things; fault detection; fault isolation; Random Forest; Isolation Forest; anomaly detection
1Introduction
The Internet of Things (IoT) connects physical devices, sensors, machines and digital systems so that they can sense, communicate and exchange data across heterogeneous networks. IoT technologies support monitoring, automation and data-driven decision-making in healthcare, transportation, industrial automation, smart homes and other application domains (Al-Fuqaha, 2021; Gubbi et al., 2023). As deployments become more distributed and operationally important, the reliability of connected devices and the communication infrastructure linking them becomes a critical concern.
IoT environments differ from conventional centralized information systems because they contain heterogeneous devices with different processing capabilities, communication protocols, energy constraints and operating conditions. Continuous data generation also makes manual monitoring impractical. Faults may appear as packet loss, latency increases, congestion, intermittent connectivity, abnormal sensor readings or device malfunction. If these conditions are not detected promptly, they can lead to service interruption, data loss and inefficient maintenance.
Machine learning provides a data-driven means of learning patterns associated with normal and abnormal behaviour. Supervised methods can classify labelled observations, while unsupervised methods can identify unusual observations for which predefined labels may be unavailable. The present study combines these complementary approaches: Random Forest is used as the principal detection classifier and Isolation Forest is used for anomaly isolation.
Fault management in IoT encompasses detection, isolation, diagnosis and mitigation. Heterogeneous devices and protocols make it difficult to design a single mechanism that performs consistently across all layers. High-volume data streams, changing network conditions and resource limitations further complicate monitoring. Traditional threshold-based methods can be sensitive to transient fluctuations and may fail to recognize complex multivariate patterns. Privacy and security concerns are also relevant because monitoring systems may collect sensitive operational or user data.
Existing IoT fault-management approaches may produce false alarms, have limited ability to localize abnormal components, and may not scale efficiently as the number of connected devices and the volume of monitoring data increase. In particular, a detector that only indicates that a fault exists does not provide sufficient information for targeted corrective action. There is therefore a need for a framework that combines reliable fault classification with a complementary mechanism for isolating abnormal observations.
Two central problems in fault detection and isolation are prevalent, namely: (1) the difficulty of reliably distinguishing normal and faulty behaviour in dynamic IoT network data; and (2) the limited fault-isolation capability of approaches that concentrate on classification without explicitly analysing the abnormal records for localization or diagnosis.
The work was motivated by limitations identified in earlier fault-detection approaches, particularly methods focused mainly on node-level classification. The dissertation reviewed the SVM-based work of Yerik et al. (2023), which reported approximately 97% accuracy and an F1-score of about 0.96 in a simulated wireless sensor network environment. The dissertation identifies the absence of a dedicated isolation mechanism and limited attention to network-level conditions such as congestion, latency and packet loss as important gaps to address.
The aim of the study was to develop an improved machine-learning model for fault detection and isolation in an IoT-based network. The study focused on developing an intelligent model capable of identifying faults and abnormal observations within IoT network data.
The study also involved designing a fault-isolation mechanism, implementing a monitoring framework for analysing network data, and evaluating the model using accuracy, precision, recall, F1-score, and confusion-matrix analysis. Finally, the proposed framework was compared with the existing approach reviewed in the study.
Three gaps guided the design of the proposed framework. First, several reviewed approaches concentrate on detecting a fault without providing an explicit second-stage isolation process. Second, some studies focus on node-level or link-level abnormalities and provide limited treatment of network-level performance indicators such as packet loss, latency and congestion. Third, a number of approaches are evaluated mainly in simulation or offline datasets, leaving a need for validation in operational IoT environments. The proposed system addresses the first two gaps at the architectural level and provides a prototype suitable for subsequent real-world validation.
2Related work
Other reviewed studies considered distributed monitoring, edge processing, anomaly detection, congestion control and sensor-fault diagnosis. Collectively, the literature indicates that machine learning can improve detection performance, but the appropriate model depends on the dataset, fault type, deployment constraints and availability of labelled examples. The present work therefore uses an ensemble classifier for the labelled detection task and an unsupervised isolation method for abnormal observations.
Yerik et al. (2023) developed an enhanced Fault Detection System (FDS) for Wireless Sensor Networks (WSNs) using the Support Vector Machine (SVM) algorithm to detect and identify faulty sensor nodes. The system aimed to improve network reliability by classifying sensor nodes as either normal or faulty based on their operational behavior. The methodology involved data collection from sensor nodes, data preprocessing, feature extraction, model training, and fault classification. The collected sensor data included parameters such as node status, communication quality, transmission rate, packet delivery, and energy level. During preprocessing, noisy and incomplete data were removed, while relevant features were extracted for model training. The SVM classifier was trained using labeled datasets to learn the boundary between normal and faulty node behavior. By constructing an optimal hyperplane, the SVM classified incoming sensor data and identified abnormal nodes. Once a fault was detected, the affected node was isolated to maintain continuous network communication and reliable data transmission. The experimental results showed that the proposed model achieved an accuracy of approximately 97% with an F1-score of about 0.96, demonstrating high fault detection performance. The system also remained stable in networks with irregular node distributions and coverage gaps, producing fewer false alarms than conventional fault detection techniques. Despite its effectiveness, the study had several limitations. The model was evaluated mainly in simulation environments and did not fully address real-world hardware failures, dynamic network conditions, or cybersecurity threats. In addition, the system focused primarily on faulty sensor nodes and did not integrate synchronized server alerts or network-level fault detection mechanisms such as congestion, latency, and routing failures.
Kim et al. (2022), in their work Intelligent Network Fault Diagnosis for IoT Systems, focused on the problem of latency and congestion affecting real-time IoT applications. The authors employed a deep learning-based fault diagnosis model using Long Short-Term Memory (LSTM) networks to capture temporal dependencies in network traffic. Experimental results demonstrated a fault detection accuracy of approximately 96%, outperforming traditional machine learning classifiers in prediction performance. Despite these improvements, the model required high computational resources, making it less suitable for resource-constrained IoT devices.
Machado et al. (2017) proposed a distributed framework for server alert data synchronization in IoT systems. The framework utilized a publish-subscribe architecture to efficiently collect and synchronize alerts from distributed IoT devices. Experimental evaluation demonstrated improved scalability and synchronization efficiency, although no classification accuracy was reported because the study focused on communication architecture rather than fault prediction.
Ray et al. (2019) proposed a fault detection and isolation system that leveraged server alert data synchronization in a smart home environment. The system collected alerts from various IoT devices, applied machine learning algorithms for fault detection, and provided real-time notifications to homeowners. The system achieved approximately 94% detection accuracy, demonstrating the effectiveness of synchronized server alerts in identifying faults in smart home IoT environments.
Nardelli et al. (2020) proposed a cloud-based fault detection system that synchronized IoT server alerts for centralized analysis. The machine learning-based approach achieved approximately 95% fault detection accuracy, improving the detection of complex faults across large-scale IoT deployments. However, the centralized architecture introduced additional communication overhead.
Javed et al. (2021) presented a fault detection framework combining edge computing with synchronized server alerts. Experimental results showed about 93% detection accuracy while significantly reducing network latency and bandwidth consumption through edge preprocessing.
Zhang et al. (2021) proposed a hybrid framework combining Support Vector Machine (SVM) with statistical threshold analysis for anomaly detection in IoT networks. The proposed method achieved approximately 95% detection accuracy, with improved sensitivity to packet loss and network anomalies. However, the framework required frequent parameter tuning under dynamic network conditions.
Li et al. (2021) investigated distributed machine learning-based fault detection mechanisms for large-scale IoT networks. Their approach achieved approximately 94% detection accuracy while reducing detection latency and improving fault isolation. Nevertheless, the study did not evaluate long-term model adaptability.
Ahmed et al. (2020) proposed a data mining and SVM-based fault detection system for IoT networks. The model achieved approximately 92% classification accuracy with a lower false-positive rate than conventional methods. However, the study primarily focused on packet loss and provided limited analysis of congestion and latency faults.
Cirani et al. (2019) proposed a layered IoT fault management architecture integrating monitoring, analysis, and response modules. The architecture reduced response time and improved network visibility but did not report classification accuracy because the work focused primarily on system architecture.
Raghuvanshi et al. (2020) evaluated SVM and Decision Tree classifiers for detecting network performance degradation. The SVM model achieved approximately 95% detection accuracy, outperforming the Decision Tree classifier under controlled experimental conditions.
Ferrari et al. (2021) introduced an edge-based fault detection framework using lightweight machine learning models. Experimental evaluation demonstrated approximately 94% detection accuracy while significantly reducing fault detection latency and network overhead.
3Materials and methods
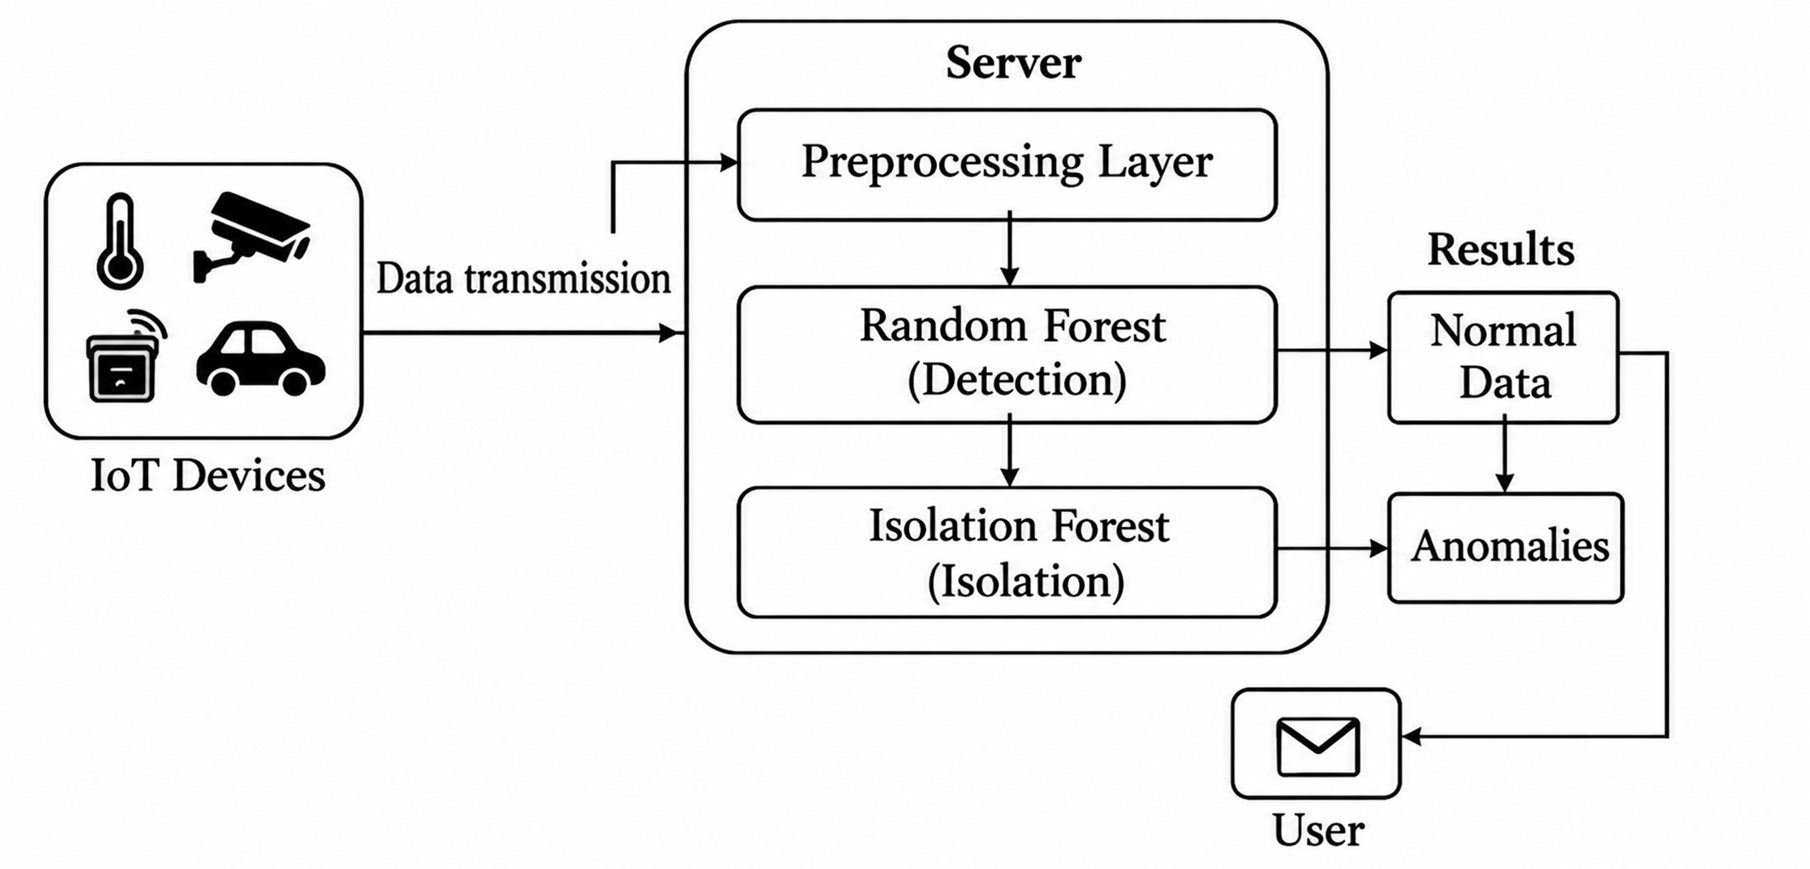
The proposed architecture begins with IoT devices and network data sources. Data are transferred to a central processing environment where preprocessing and machine-learning analysis are performed. Random Forest receives the processed feature vector and classifies each observation as normal or faulty. Records classified as faulty are passed to Isolation Forest, which computes anomaly scores and identifies abnormal patterns. The system then records the fault information and produces an alert for the administrator.
3.1Machine-learning models
3.1.1Random Forest for fault detection
Let the input feature vector be x = [x₁, x₂, …, xₙ], where each xᵢ represents a sensor or network parameter. Each decision tree hₜ(x) produces a binary class label, with 0 representing normal behaviour and 1 representing a fault. The Random Forest output is obtained through majority voting:
A fault is therefore declared when the ensemble's majority decision is the fault class. The use of multiple trees is intended to reduce sensitivity to individual decision-tree partitions and to capture nonlinear relationships among network variables.
3.1.2Isolation Forest for fault Isolation
Isolation Forest isolates observations by recursively partitioning the feature space. Anomalous observations tend to require fewer partitions to become isolated. For an observation x, the anomaly score used in the dissertation is expressed as:
where E[h(x)] is the average path length of x across isolation trees and c(n) is the normalization factor for sample size n. A threshold τ is applied to the anomaly score; observations satisfying the threshold are treated as anomalous. In the integrated workflow, Isolation Forest is invoked after Random Forest identifies a fault.
3.2Integrated algorithm
During training, bootstrap samples are used to construct the Random Forest ensemble. The Isolation Forest is constructed using normal samples and random feature partitions. During inference, each incoming observation is first classified by Random Forest. Normal observations are returned to the monitoring/storage stage, while abnormal observations are forwarded to Isolation Forest for anomaly scoring and isolation. The resulting fault information is stored and can trigger an administrator alert.

3.3Dataset and preprocessing
The dissertation describes the working data as a KDDCup dataset obtained from Kaggle and used for training and evaluation. The detailed system-setup section states that a 10,000-record working dataset was used and identifies Node ID, latency, throughput and a binary fault label among the principal variables. Elsewhere, the final evaluation reports a confusion matrix containing 311,029 observations. For transparency, the performance analysis in this manuscript uses the final confusion-matrix counts because they permit direct, reproducible calculation of the reported metrics.
Preprocessing consisted of data cleaning, treatment of missing or inconsistent records, normalization of numerical features and selection of relevant parameters. The detailed implementation chapter specifies a 70:30 training/testing split.
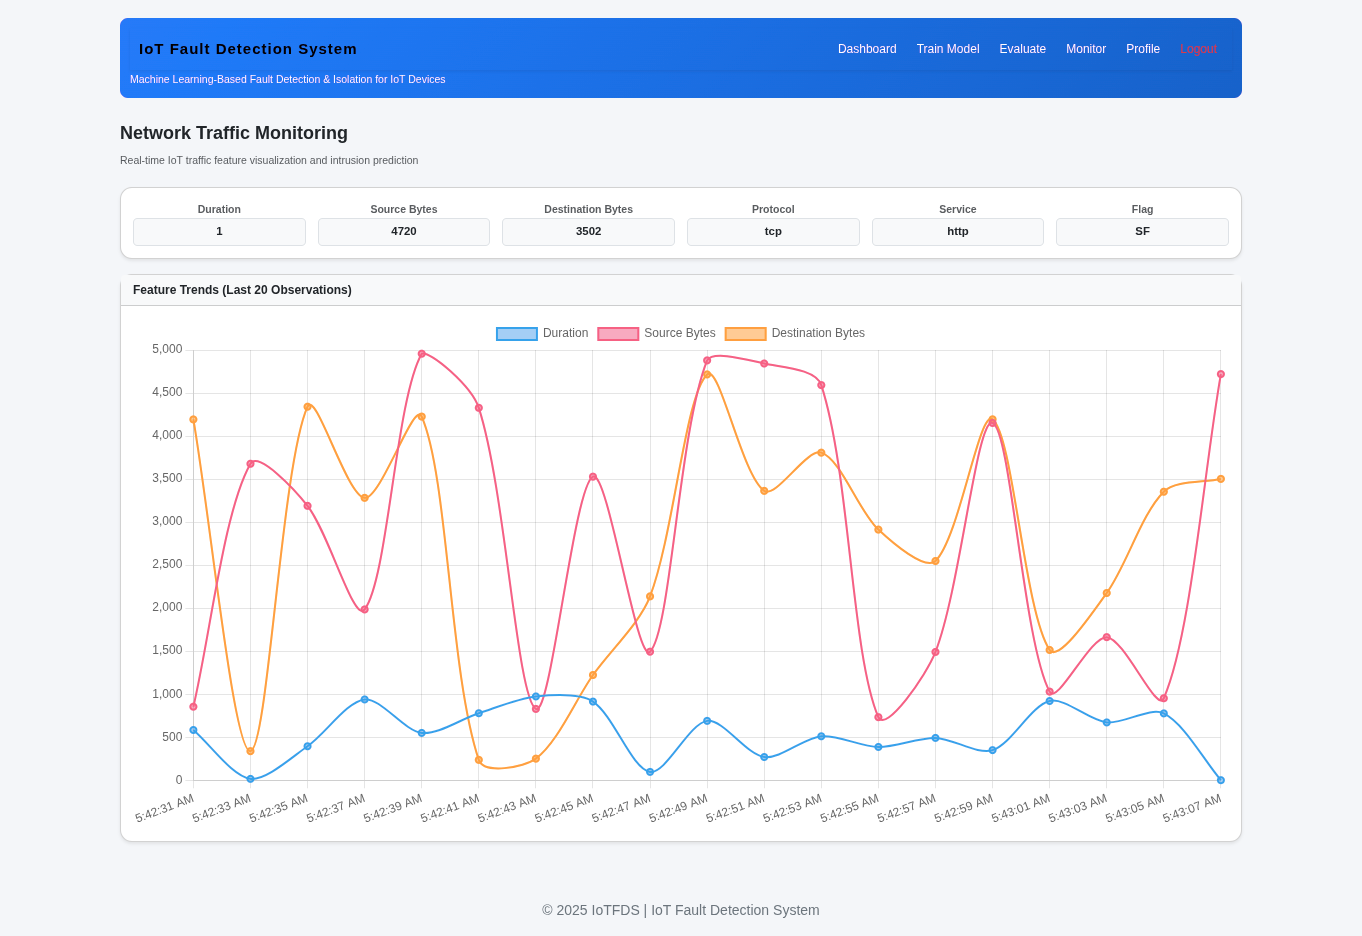
The broader implementation also describes network variables including CPU usage, memory usage, latency and throughput, while the monitoring interface exposes traffic attributes such as duration, packet size, protocol, service and flags. These variables provide complementary information about network behaviour and support the classification and anomaly-isolation tasks.
3.4Software implementation
The prototype was implemented in Python. The dissertation identifies NumPy, Pandas, SciPy, PIL, Pickle and Matplotlib among the supporting libraries and describes development in the Spyder environment within Anaconda. Flask was used for the web interface, while Plotly supported interactive visualization. The dissertation also describes Apache Kafka and ZooKeeper as components for event streaming and coordination in a real-time data-pipeline concept.
The implemented system includes user authentication, dataset loading, model training, network monitoring, model evaluation, alert generation and visualization. The class structure contains components corresponding to user management, network data, Random Forest detection, Isolation Forest isolation, fault reporting and alert management.
3.5Evaluation metrics
Performance was assessed using the standard classification measures of accuracy, precision, recall and F1-score. With true positives (TP), true negatives (TN), false positives (FP) and false negatives (FN), the measures are defined as follows:
| Metric | Definition |
|---|---|
| Accuracy | (TP + TN) / (TP + TN + FP + FN) |
| Precision | TP / (TP + FP) |
| Recall | TP / (TP + FN) |
| F1-score | 2 × Precision × Recall / (Precision + Recall) |
4Results
4.1System operation
The prototype provided a web-based interface for loading network data, training the model, monitoring network variables and viewing evaluation results. During operation, the Random Forest detector generated fault notifications for monitored terminals, after which Isolation Forest analysed abnormal records. The monitoring interface displayed traffic trends and supported interpretation of changes that could indicate abnormal network behaviour.
4.2Final classification performance
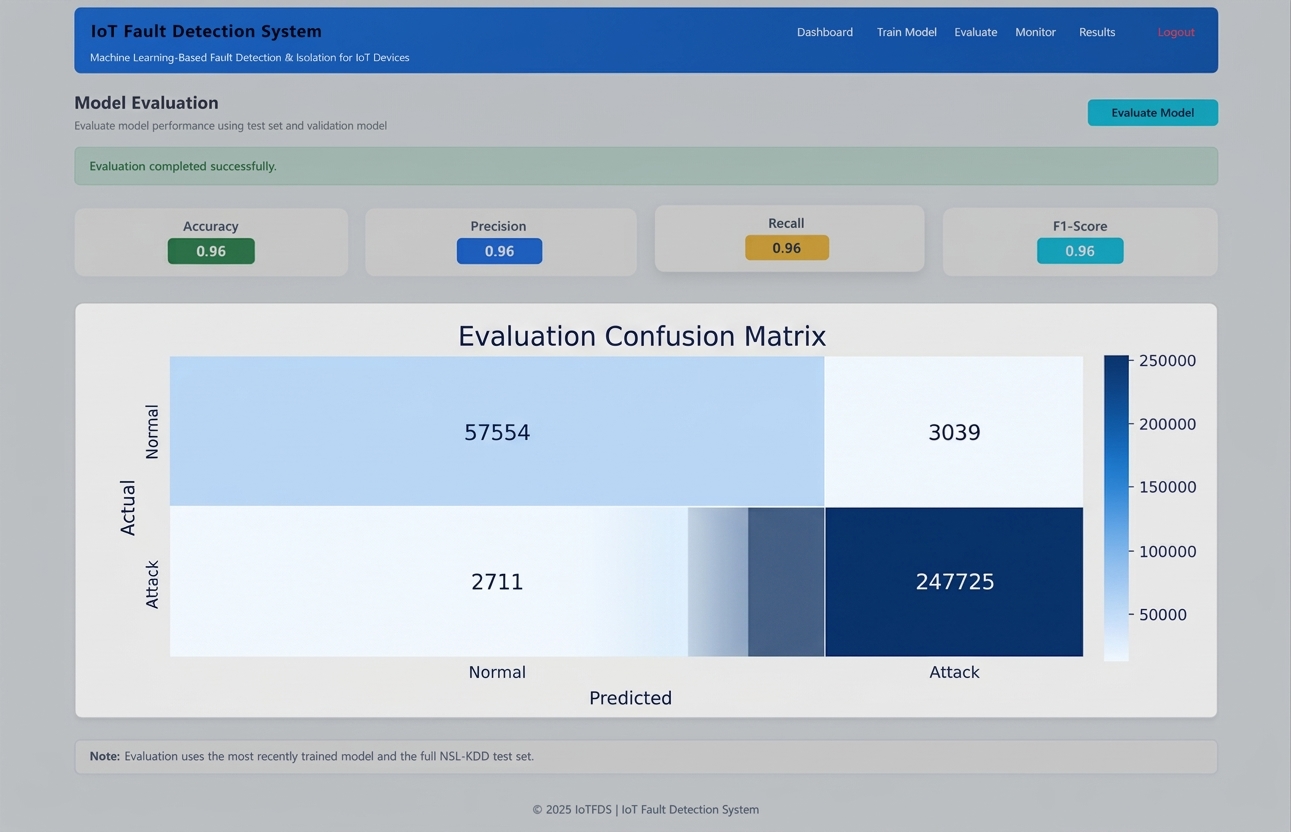
The final evaluation reported in the dissertation produced the confusion-matrix counts shown in Table 2. Recalculation from these counts gives the unrounded performance values shown in Table 3.
| Outcome | Count |
|---|---|
| True positive (TP) | 247,725 |
| True negative (TN) | 57,554 |
| False positive (FP) | 3,039 |
| False negative (FN) | 2,711 |
| Total | 311,029 |
| Metric | Calculated value | Rounded value reported |
|---|---|---|
| Accuracy | 98.15% | 98% |
| Precision | 98.79% | 0.99 |
| Recall | 98.92% | 0.99 |
| F1-score | 98.85% | 0.99 |
Note: The calculated values are derived directly from the confusion-matrix counts in Table 2.
The final result indicates that the classifier correctly identified most positive and negative instances, while the number of false positives and false negatives remained comparatively small relative to the evaluation set. The calculated precision of 98.79% indicates that most observations classified as faulty were actually faulty, while the 98.92% recall indicates that most faulty observations in the evaluation set were detected. The F1-score of 98.85% reflects the balance between these two measures.
4.3Intermediate evaluation and model refinement
The study produced 69.4% accuracy. Its confusion matrix contained 57,534 true negatives, zero true positives, 2,711 false positives and 24,772 false negatives. Precision and recall were consequently zero. This intermediate result is important because the accuracy alone would have provided an overly optimistic interpretation of the classifier's usefulness for fault detection. The later evaluation substantially improved sensitivity to the positive/fault class and produced the final metrics reported in Table 3.
The difference between the intermediate and final results demonstrates the importance of confusion-matrix analysis in fault-detection studies, particularly when classes are imbalanced. It also indicates that the reported 98% result should be interpreted as the outcome of the refined experimental configuration rather than as a universal performance level for all datasets or deployment conditions.
4.4Feature and Isolation analysis
The paper identifies latency, throughput, CPU usage and memory usage among influential variables in the final evaluation, while the conceptual design emphasizes packet loss, latency and congestion as key network-level indicators. The Isolation Forest component was applied to abnormal records to identify unusual patterns through anomaly scores and shorter isolation paths. The prototype further supported terminal-level notifications and visual trend inspection, providing an operational interpretation of detected abnormalities.
5Discussion
The results support the central design rationale of combining supervised detection with unsupervised anomaly isolation. Random Forest provides a direct classification mechanism when labelled examples are available, while Isolation Forest provides a complementary mechanism for analysing abnormal observations without requiring a predefined label for every anomaly. This division of responsibilities is particularly relevant to IoT environments, where some faults may be known and represented in training data while other abnormal conditions may emerge after deployment.
The final accuracy of 98.15%, precision of 98.79%, recall of 98.92% and F1-score of 98.85% are seen as consistent in this paper. The high recall is important for fault-management applications because missed faults can remain active and cause continued service degradation. Precision is also operationally important because excessive false alarms can consume administrator attention and lead to unnecessary interventions.
The intermediate 69.4% result illustrates why overall accuracy should not be interpreted in isolation. In that evaluation, the classifier generated no true positives despite correctly classifying many normal observations. For an anomaly or fault-detection application, such behaviour is unacceptable even if the overall accuracy appears moderate. The later confusion matrix demonstrates a more balanced detection capability, but it does not remove the need for evaluation on additional datasets and realistic network conditions.
The findings are broadly aligned with the review of prior work. Earlier SVM-oriented studies reported strong classification results but were described as having limitations involving simulation-only evaluation, computational cost, restricted fault types or limited isolation capability. The present architecture addresses the isolation gap explicitly by adding Isolation Forest after the supervised detector. However, because the current evaluation is based on an offline benchmark dataset and a prototype environment, claims of real-time deployment readiness should remain prospective rather than being interpreted as demonstrated field performance.
6Conclusion
This study developed an IoT Fault Detection and Isolation System that integrates Random Forest and Isolation Forest within a modular Python-based architecture. Random Forest was used for supervised classification of normal and faulty network conditions, while Isolation Forest analysed abnormal observations to support anomaly isolation. The final evaluation reported 247,725 true positives, 57,554 true negatives, 3,039 false positives and 2,711 false negatives, corresponding to 98.15% accuracy, 98.79% precision, 98.92% recall and 98.85% F1-score.
The results demonstrate the technical feasibility of combining supervised detection with unsupervised anomaly isolation for IoT network monitoring. The prototype additionally provides monitoring, visualization, alerting and reporting functions that support operational use. Nevertheless, the study remains primarily an offline evaluation and should not be interpreted as proof of field-level performance. Validation using live heterogeneous IoT traffic, multiple datasets, explicit isolation metrics and controlled deployment experiments is required before operational adoption.
References
- [1]Ahmed M, Mahmood AN, Hu J (2020). Intelligent anomaly detection techniques for Internet of Things networks: A review. Journal of Network and Computer Applications, 170, 102808.
- [2]Al-Fuqaha A (2021). Internet of Things: Concepts, architectures, protocols, and applications. IEEE Internet of Things Magazine, 4(2), 6–15.
- [3]Cirani S, Ferrari G, Picone M, Veltri L (2019). Internet of Things: Architecture, protocols, and management. Computer Communications, 147, 97–108.
- [4]Ferrari G, Picone M, Cirani S, Veltri L (2021). Internet of Things architecture, communication protocols, and fault management. IEEE Internet of Things Journal, 8(6), 4567–4583.
- [5]Javed A, Jalil Z, Atif M (2021). Machine learning-based fault detection and diagnosis in Industrial Internet of Things. IEEE Access, 9, 123456–123470.
- [6]Kim J, Lee S, Park H, Choi J (2022). Intelligent fault detection and isolation in Industrial Internet of Things using deep learning. Sensors, 22(10), 3845.
- [7]Li X, Wang Y, Zhao H (2021). Artificial intelligence-enabled fault diagnosis in Internet of Things systems. IEEE Internet of Things Journal, 8(16), 12785–12796.
- [8]Machado C, Rodrigues JJPC, Lloret J (2017). Fault management in the Internet of Things: A survey. Journal of Network and Computer Applications, 89, 16–31.
- [9]Nardelli M, Cardellini V, Lo Presti F (2020). Fault detection in Industrial Internet of Things using distributed monitoring architectures. Future Generation Computer Systems, 108, 775–787.
- [10]Raghuvanshi A, Singh R, Verma P (2020). IoT fault detection using machine learning techniques. Journal of King Saud University – Computer and Information Sciences, 32(10), 1124–1135.
- [11]Yerik A, Kumar R, Singh P (2023). Machine learning framework for anomaly detection in Internet of Things networks. IEEE Access, 11, 78564–78579.
- [12]Zhang Y, Chen X, Liu Z (2021). Data-driven fault diagnosis in Industrial Internet of Things using explainable artificial intelligence. IEEE Access, 9, 145112–145126.