Analytical Chemistry
Chemometric Assessment of Structure–Operation–Performance Relationships in Heterogeneous Biodiesel Catalysis
Department of Chemistry, Faculty of Physical Sciences, University of Abuja, Abuja, Nigeria
Published October 2026
Abstract
A literature-derived chemometric assessment was conducted to examine how catalyst structural characteristics and reaction operating conditions jointly organize the reported performance of heterogeneous biodiesel catalysts. A curated database contained 218 heterogeneous observations, of which 133 had complete operating variables, and 30 from 19 source studies contained the full structure–operation–performance dataset. Principal component analysis (PCA), hierarchical cluster analysis (HCA), hierarchical regression, and partial least-squares (PLS) validation were applied. PCA retained four components explaining 85.69% of the standardized variance, with reaction time and catalyst loading dominating the first component, while specific surface area (SBET) and pore volume contributed strongly to the second. HCA identified three exploratory multivariate profiles, although their exact partition showed sensitivity to selected source studies. In the 133-observation operation-only dataset, temperature and alcohol-to-oil ratio were positively associated with reported yield, whereas catalyst loading showed a negative association. For the 30 complete cases, adding structural descriptors increased explained variance from 7.44% to 48.63%. However, study-clustered inference weakened the significance of SBET, while PLS showed negative study-level predictive performance. The findings support multivariate structure–operation analysis but not transferable predictive catalyst selection or causal ranking.
Keywords: biodiesel; heterogeneous catalysis; chemometrics; principal component analysis; hierarchical cluster analysis; transesterification
1Introduction
Biodiesel is a renewable liquid fuel produced mainly through conversion of triglyceride-rich or free-fatty-acid feedstocks to fatty acid alkyl esters. Heterogeneous catalysts have received sustained attention because solid catalytic materials can facilitate separation and potential reuse and can be prepared from a broad range of inorganic, supported and biomass-derived materials [1–7].
The performance of a heterogeneous biodiesel catalyst is not determined by catalyst identity alone. Surface area, pore structure, accessible basic-site density, catalyst loading, alcohol-to-oil ratio, reaction temperature and residence time may jointly influence reactant adsorption, interfacial contact, mass transfer and conversion [4–9]. Consequently, two catalyst systems reporting similar yields may have reached those yields under substantially different operating conditions.
Published catalyst studies are commonly designed around individual catalyst formulations or small experimental matrices. This makes direct quantitative comparison across publications difficult because feedstocks, catalyst preparation, analytical procedures, operating conditions and reporting practices differ [5, 7, 9]. Chemometric methods provide a useful descriptive approach because correlated chemical and process variables can be represented simultaneously in a standardized multivariate space [10, 11].
A further difficulty is reporting completeness. Reaction temperature, catalyst loading and alcohol ratio are frequently reported, whereas quantitative structural descriptors such as specific surface area, pore volume and active-site density are less consistently available. Analyses that require all structural and operational variables therefore operate on a selected subset of the literature. Treating that subset as automatically representative may lead to overconfident interpretation.
The present study was designed specifically to examine this structure–operation–performance problem. It does not attempt to rank catalyst families, estimate yield–time productivity or construct a universal catalyst-selection rule. Instead, it asks how catalyst structural descriptors and transesterification operating conditions jointly organize variation in reported biodiesel yield across heterogeneous solid-base catalyst studies. The analysis is observational and literature-derived; published experimental runs are not treated as independent controlled replicates, and no causal interpretation is assigned to regression coefficients.
The objectives were to: (i) curate and harmonize heterogeneous solid-base biodiesel catalyst observations; (ii) quantify the availability and selection of structural and operational descriptors; (iii) identify dominant multivariate dimensions using PCA and HCA; (iv) assess the incremental association of structural descriptors with reported yield beyond operating variables; and (v) evaluate robustness through study-level dependence, complete-case sensitivity, and cross-validation.
2Experimental
2.1Literature data curation and analytical dataset
Primary research articles reporting experimental biodiesel production using heterogeneous solid-base catalysts were used as the source of observations. Reviews were used for contextual interpretation rather than as experimental observations. Distinct catalyst–operating-condition combinations were retained after duplicate checking. Homogeneous NaOH and KOH systems, enzyme catalysts, and non-transesterification conversion routes were excluded from the present structure–operation analysis because their catalytic architectures and descriptor spaces were not directly comparable.
The extraction schema contained source study, catalyst identity or family, biodiesel yield, reaction time, catalyst loading, alcohol-to-oil molar ratio, reaction temperature, SBET, Vpore, and Da. Values were not inferred from related publications or substituted when not explicitly reported. Non-standard entries were retained for traceability but were not arbitrarily converted for inferential calculations.
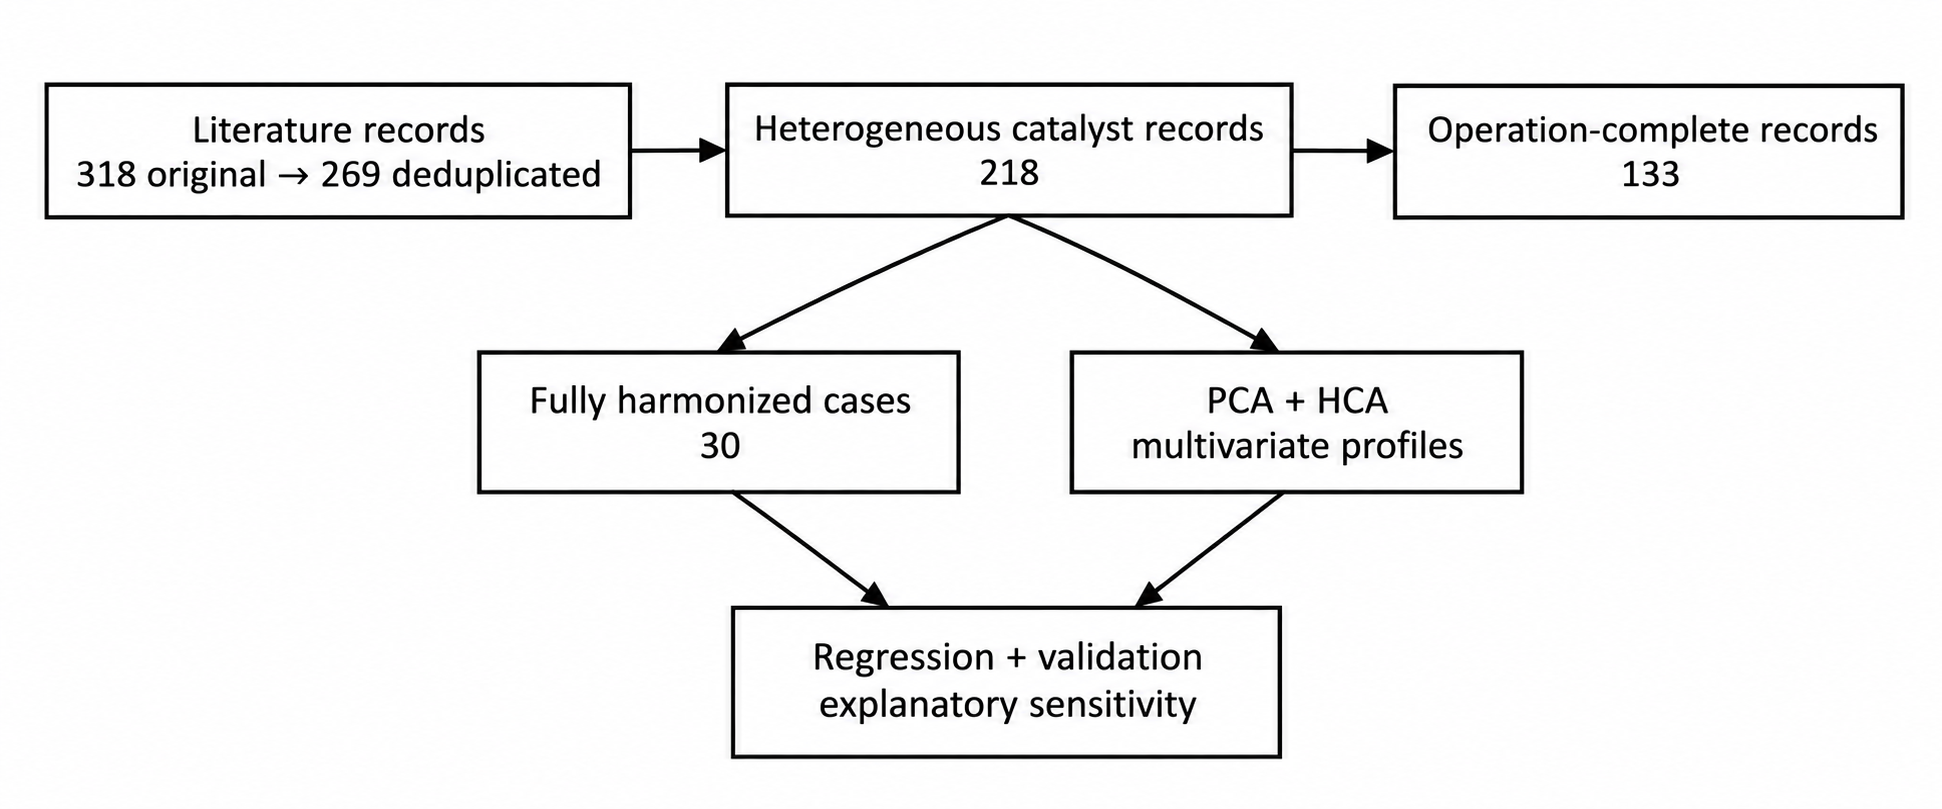
The curation hierarchy comprised 318 original records, 269 deduplicated records, and 218 heterogeneous records. Among the heterogeneous records, 133 contained the operating variables required for the broad operation–performance analysis. Only 30 observations contained all eight variables required for the full structure–operation–performance analysis, and these originated from 19 source studies. Thus, the complete-case matrix represented 13.8% of the heterogeneous literature. The workflow from literature records to analysis is shown in Figure 1, and Table 1 gives descriptive statistics for the complete observations.
A selection-sensitivity analysis compared the 30 complete records with the 188 incomplete heterogeneous records using variables available in both groups. This was undertaken because reporting completeness may be related to experimental practice and should not automatically be regarded as missing completely at random.
| Variable | Mean | SD |
|---|---|---|
| Biodiesel yield (%) | 79.01 | 29.47 |
| Reaction time (h) | 3.62 | 2.45 |
| Catalyst loading (wt.%) | 5.43 | 5.35 |
| Alcohol-to-oil ratio | 11.75 | 5.40 |
| Temperature (°C) | 83.37 | 42.97 |
| SBET (m² g⁻¹) | 159.10 | 209.92 |
| Vpore (cm³ g⁻¹) | 0.190 | 0.181 |
| Da (µmol g⁻¹) | 20,946.67 | 61,115.47 |
2.2Data standardization
Variables with different units and numerical ranges were autoscaled using the z-score transformation in Equation (1):
where xij is the value of variable j for observation i, x̄j is the corresponding sample mean and sj is the sample standard deviation. The original Da values were retained for PCA. Because active basicity was strongly right-skewed, ln(Da) was used in regression.
2.3Principal component analysis
PCA was performed on the standardized eight-variable matrix. Components with eigenvalues greater than unity were retained. Component scores and loading vectors were calculated from the standardized observations. PCA was used to characterize multivariate organization rather than to rank catalysts by yield. Because yield was included in the PCA, associations between yield and PCA coordinates were interpreted as descriptive rather than independent evidence of performance.
2.4Hierarchical cluster analysis
Ward's minimum-variance method with Euclidean distance was applied to the PC1–PC2 scores. Two-, three- and four-cluster solutions were compared using silhouette and Davies–Bouldin indices. The three-cluster solution was retained for exploratory visualization. Cluster labels represent multivariate similarity and are not interpreted as yield classes or catalyst families.
2.5Operation-only regression and hierarchical regression
Two related regression analyses were performed. First, an operation-only model was fitted to the 133 observations containing reaction time, catalyst loading, alcohol-to-oil ratio, and temperature. This analysis describes the broad association between operating conditions and reported yield across the heterogeneous literature.
Second, a hierarchical model was fitted to the 30 complete observations so that structural descriptors could be added without changing the observations between model blocks. Block 1 contained reaction time, catalyst loading, alcohol-to-oil ratio, and temperature. Block 2 added SBET, Vpore, and ln(Da). Model fit was summarized using R², adjusted R², F statistics, and coefficients. Because some source studies contributed multiple observations, inference was additionally evaluated with source-study clustered covariance.
All regression coefficients are interpreted as conditional associations within the literature-derived dataset. They are not estimates of controlled experimental effects.
2.6PLS validation and sensitivity analyses
Direct PLS regression of yield on the seven predictors was evaluated as a supervised sensitivity analysis rather than as the principal predictive model. Leave-one-out cross-validation (LOOCV) assessed observation-level performance, while leave-one-study-out validation withheld all observations from a source study simultaneously. Performance was summarized using Q² and RMSECV.
Study-level dependence was examined through an intraclass correlation estimate for yield, clustered regression inference, and sequential study omission. PCA and HCA stability were also examined by leave-one-study-out recalculation. Observation-level diagnostics included variance inflation factors, residual measures, leverage, and Cook's distance.
3Results and discussion
3.1Reporting completeness defines the analytical boundary
The principal limitation of the literature-derived dataset was not the number of biodiesel experiments but the inconsistent reporting of structural descriptors. Of 218 heterogeneous observations, 133 contained the operating variables required for the broad operation–performance analysis, whereas only 30 contained the complete eight-variable structure–operation–performance matrix. The complete cases therefore constitute a selected reporting subset rather than a statistically representative sample of the heterogeneous catalyst literature.
The complete-case sensitivity analysis found no statistically significant difference in reported yield between complete and incomplete records under the Welch test (p=0.095). Reaction time and catalyst loading also showed no strong evidence of systematic differences. Temperature distributions differed under the Mann–Whitney test (p=0.017), indicating that reporting completeness was not fully independent of the observed experimental space. This supports use of the 30 complete cases for simultaneous structural analysis while requiring explicit restriction of inference to that harmonized subset.
3.2Operation–performance relationships in the broader dataset
The 133-observation operation-only regression (Table 2) explained 24.18% of the variance in reported biodiesel yield (R²=0.242; adjusted R²=0.217; F=9.887; p=5.62×10⁻⁷). Reaction temperature and alcohol-to-oil ratio showed positive coefficients, whereas catalyst loading showed a negative coefficient. Reaction time was not statistically significant in the multivariable model. These relationships should be interpreted as cross-study associations because feedstock, catalyst composition, analytical procedure, and operating variables vary simultaneously among publications.
| Predictor | B | p |
|---|---|---|
| Intercept | 34.532 | 0.00012 |
| Reaction time (h) | +0.911 | 0.4455 |
| Catalyst loading (wt.%) | −2.422 | 0.0386 |
| Alcohol-to-oil ratio | +1.439 | 0.00221 |
| Temperature (°C) | +0.280 | 0.00334 |
3.3Multivariate structure of the complete cases
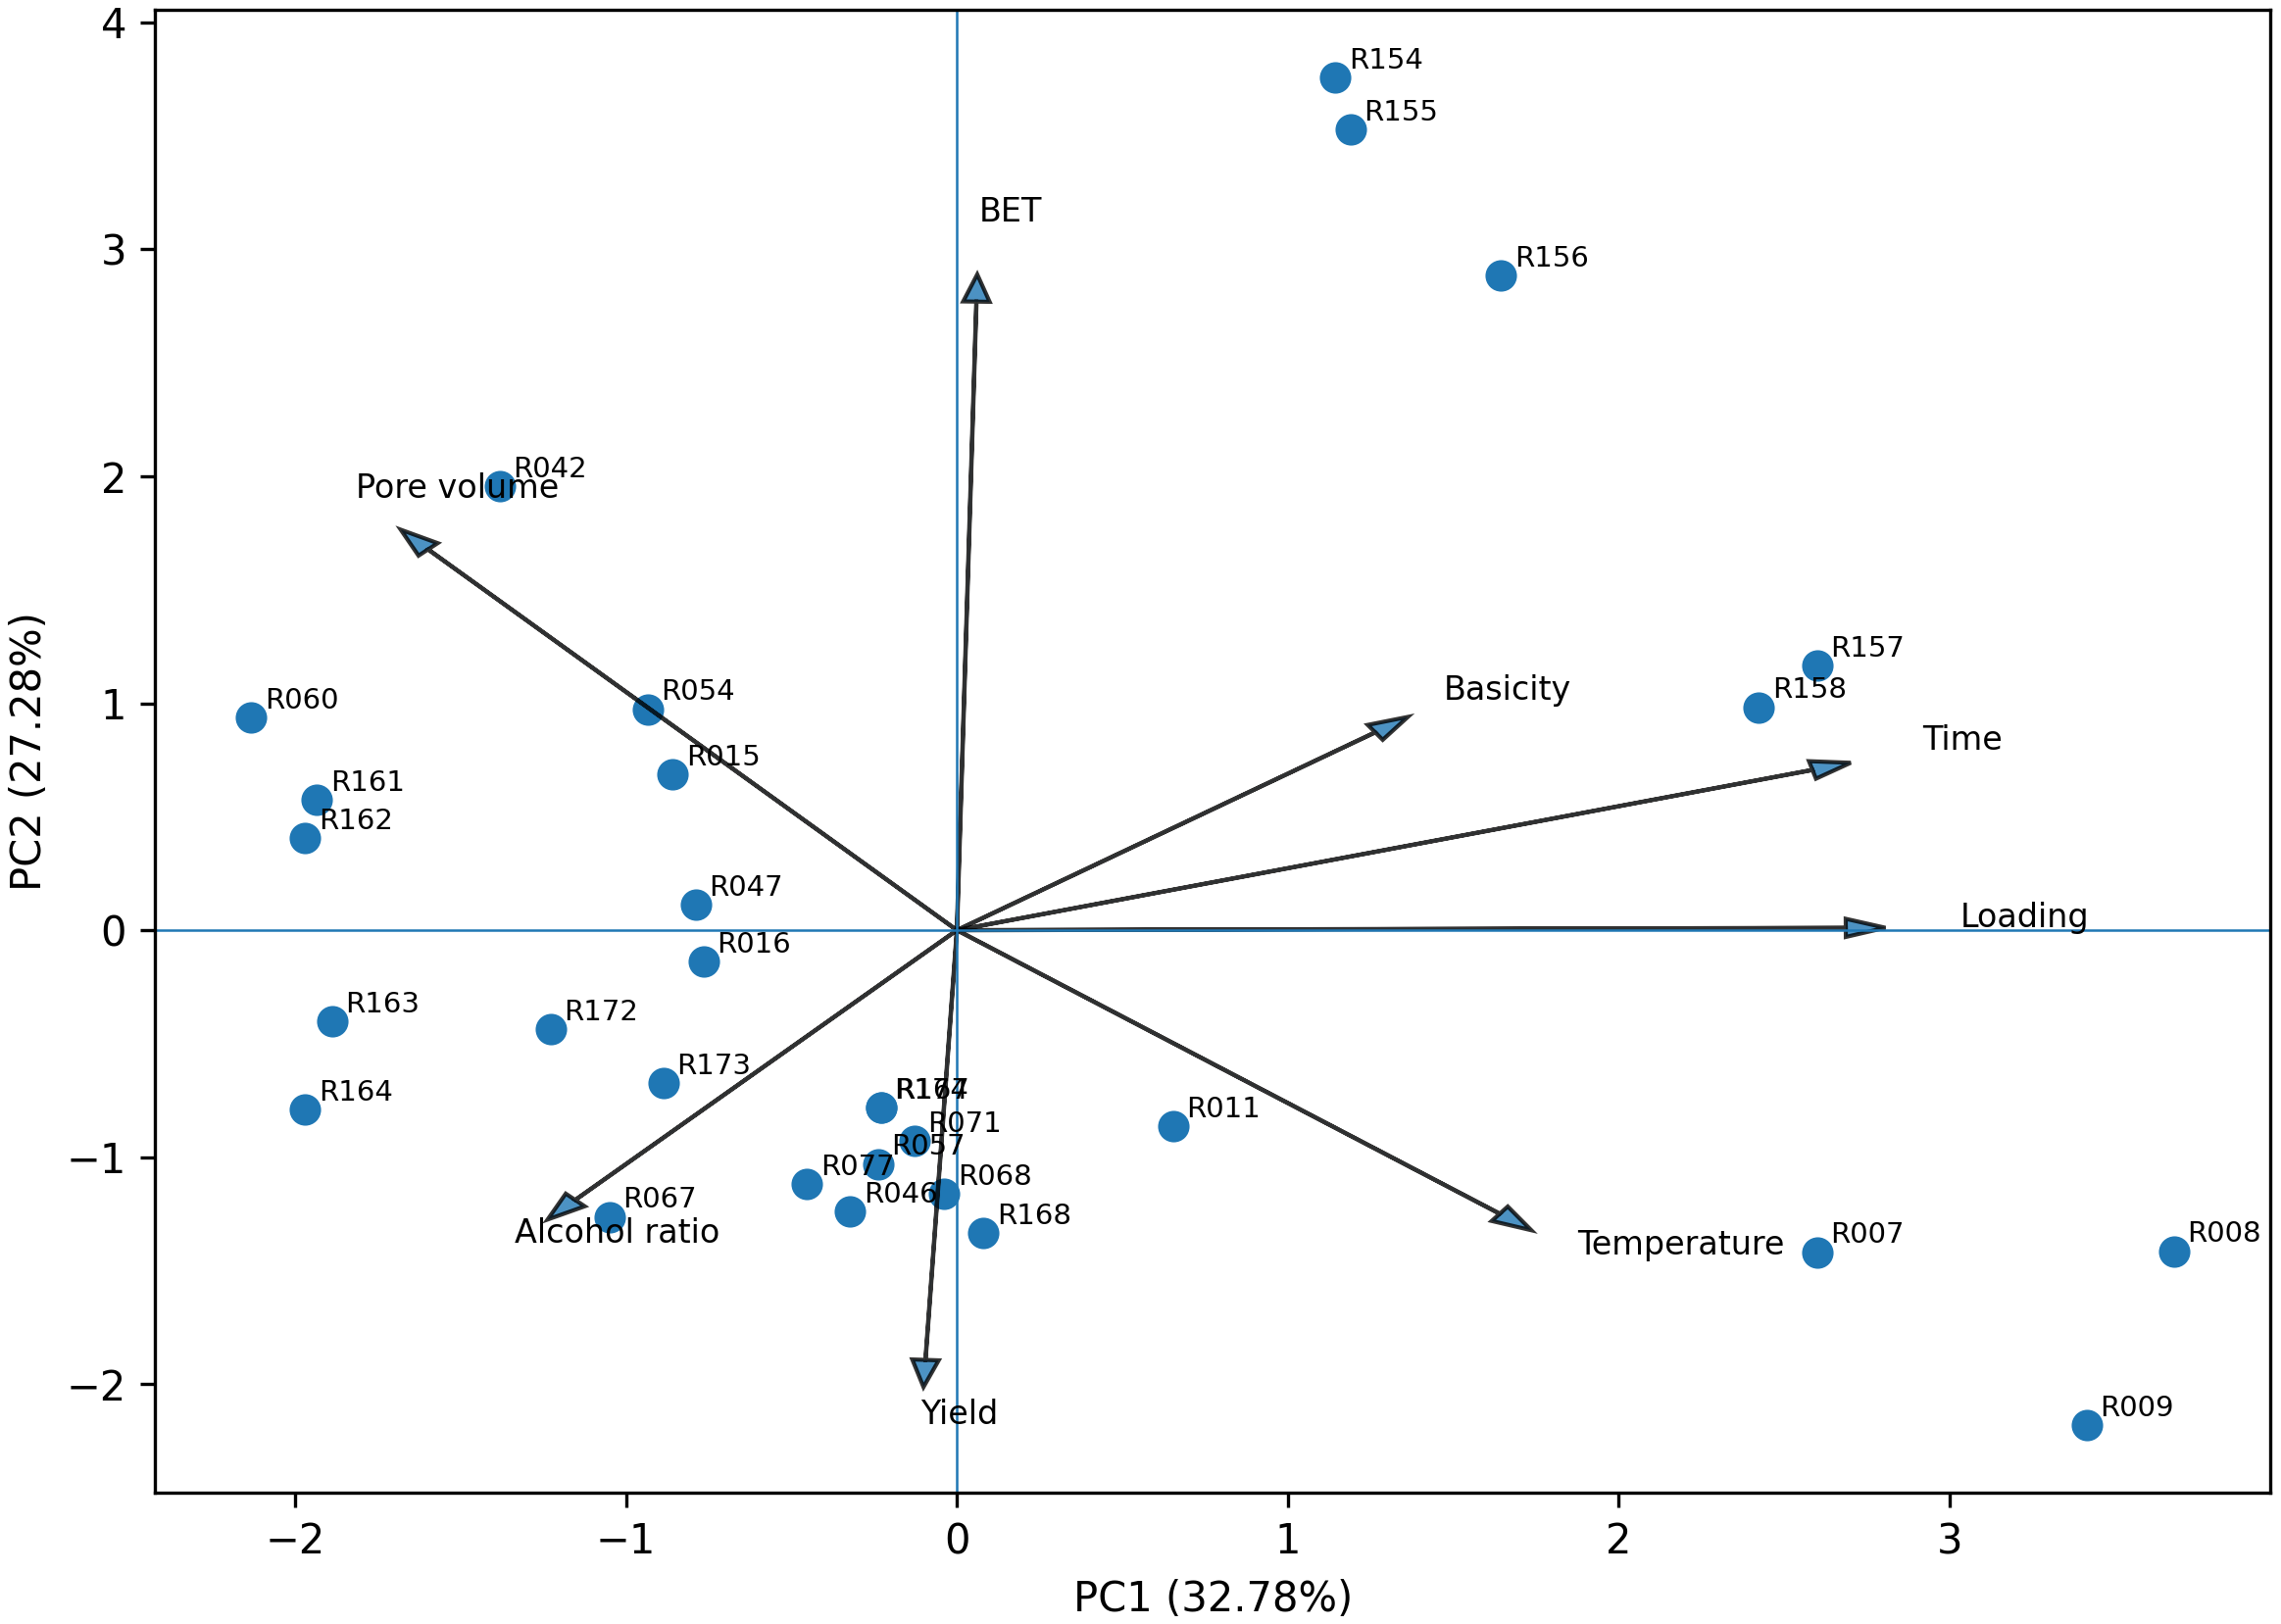
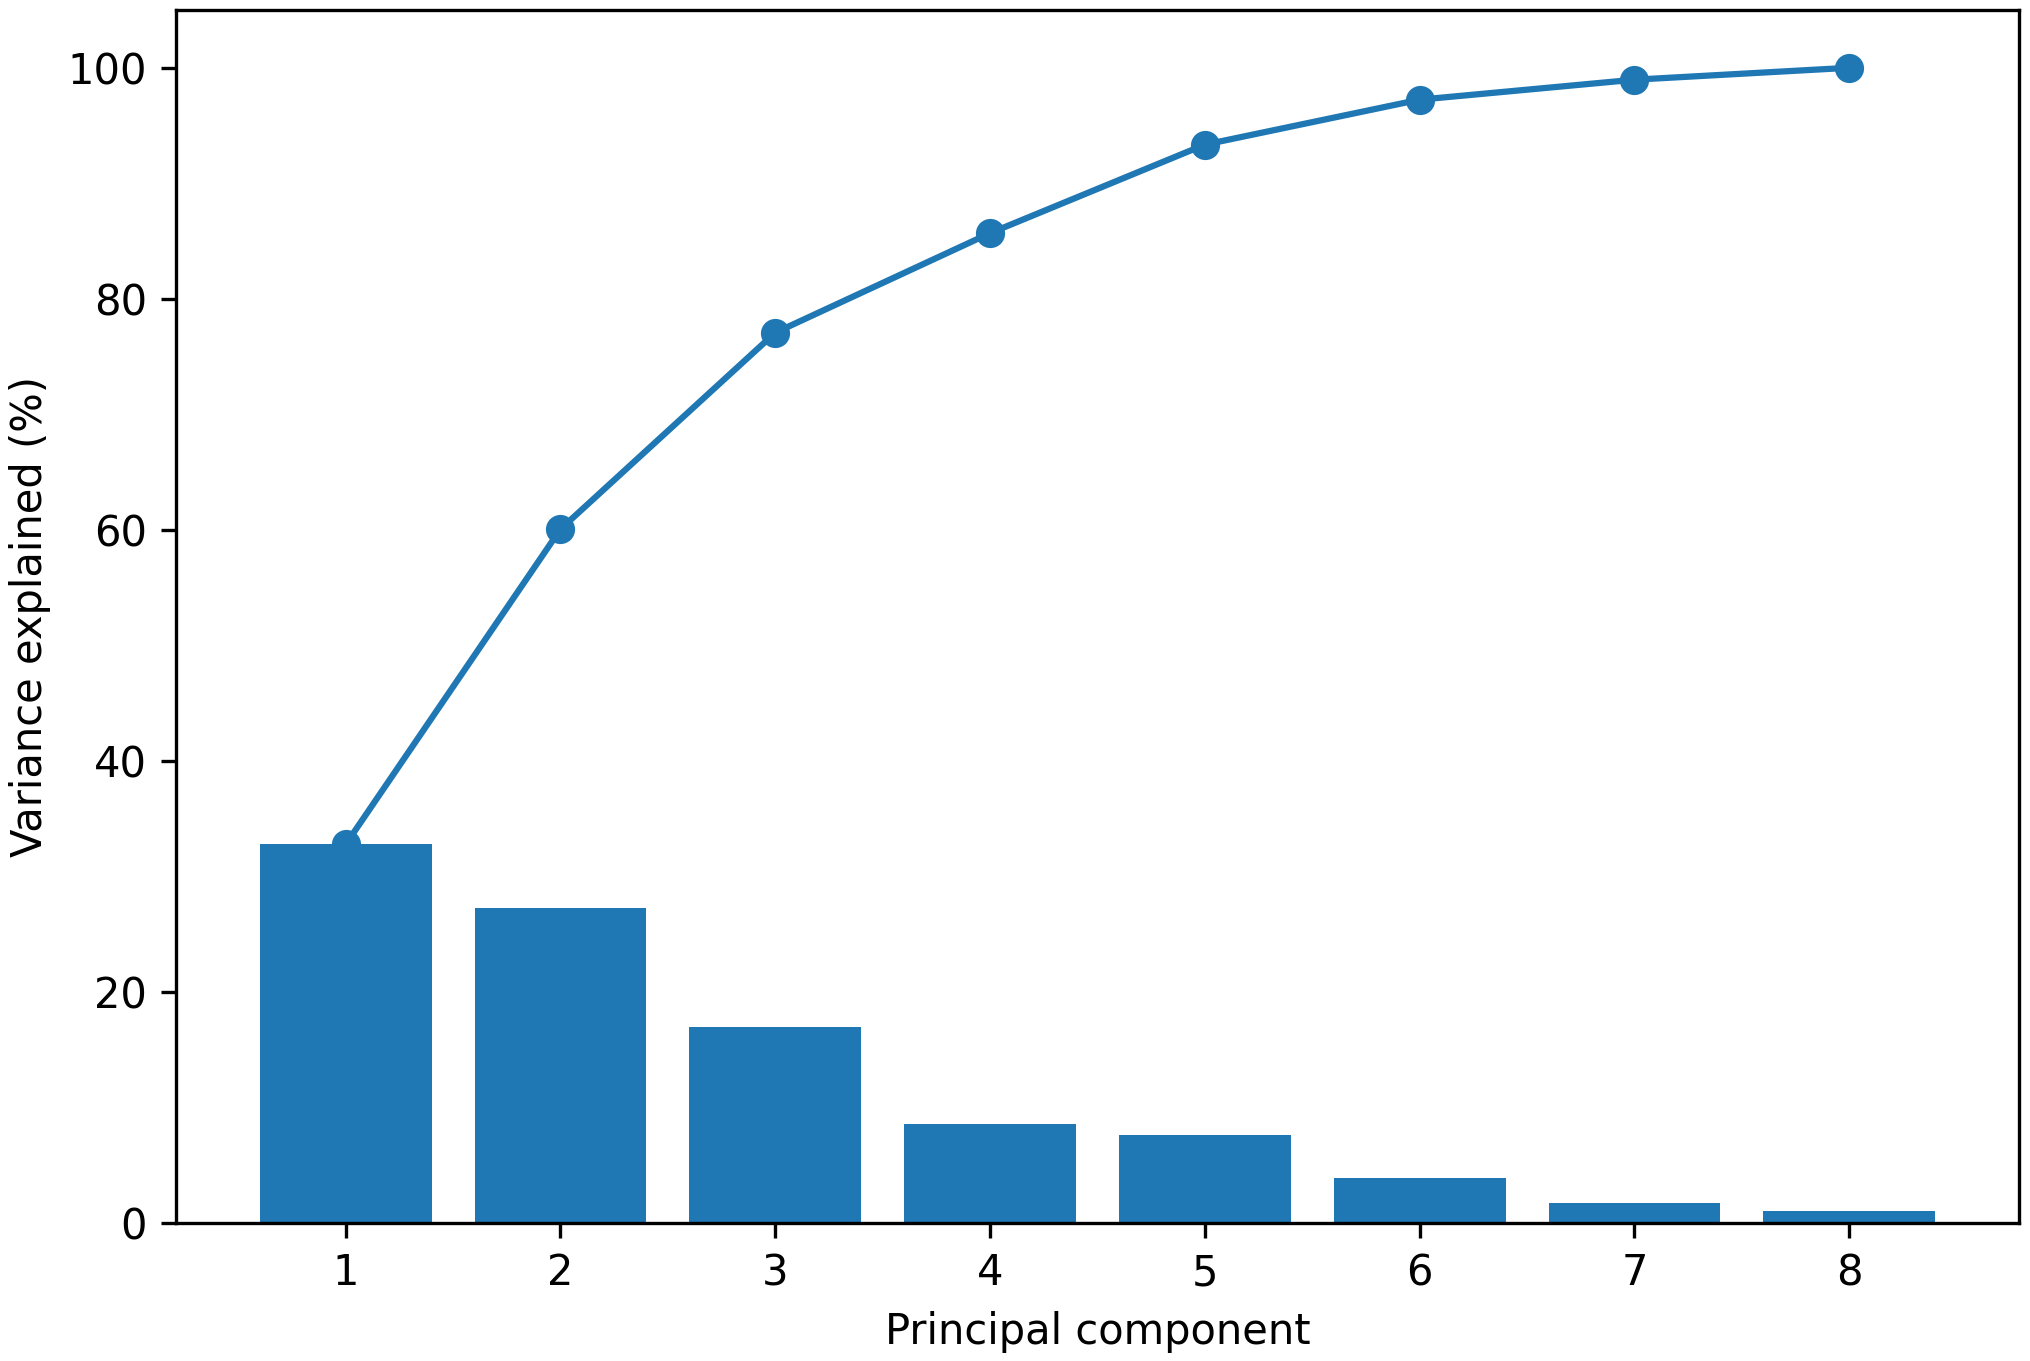
PCA of the 30 complete observations retained four components with eigenvalues greater than unity. PC1, PC2, PC3 and PC4 explained 32.783%, 27.283%, 17.007% and 8.616% of standardized variance, respectively, giving a cumulative 85.688%. PC1 and PC2 together represented 60.066% of total standardized variance. The loading matrix is given in Table 3, the score–loading biplot in Figure 2 and the variance structure in Figure 3.
PC1 was dominated by reaction time (+0.901) and catalyst loading (+0.936), with temperature also contributing positively (+0.579). It is therefore best interpreted as an operational or catalyst-intensity dimension rather than as a pure catalyst-structure axis. PC2 was dominated by SBET (+0.963) and Vpore (+0.588), while yield loaded negatively (−0.671). Active basicity contributed most strongly to PC3 (+0.637), where yield also showed a positive loading (+0.542). These results indicate that the literature-derived observations occupy overlapping operational, textural and performance dimensions.
| Variable | PC1 | PC2 | PC3 | PC4 |
|---|---|---|---|---|
| Yield | −0.034 | −0.671 | +0.542 | −0.168 |
| Reaction time | +0.901 | +0.246 | −0.048 | +0.152 |
| Catalyst loading | +0.936 | +0.004 | −0.255 | −0.011 |
| Alcohol ratio | −0.412 | −0.425 | −0.493 | +0.640 |
| Temperature | +0.579 | −0.441 | −0.563 | −0.170 |
| SBET | +0.020 | +0.963 | −0.144 | −0.079 |
| Vpore | −0.560 | +0.588 | −0.243 | −0.037 |
| Da | +0.454 | +0.313 | +0.637 | +0.464 |
3.4Exploratory multivariate profiles from HCA
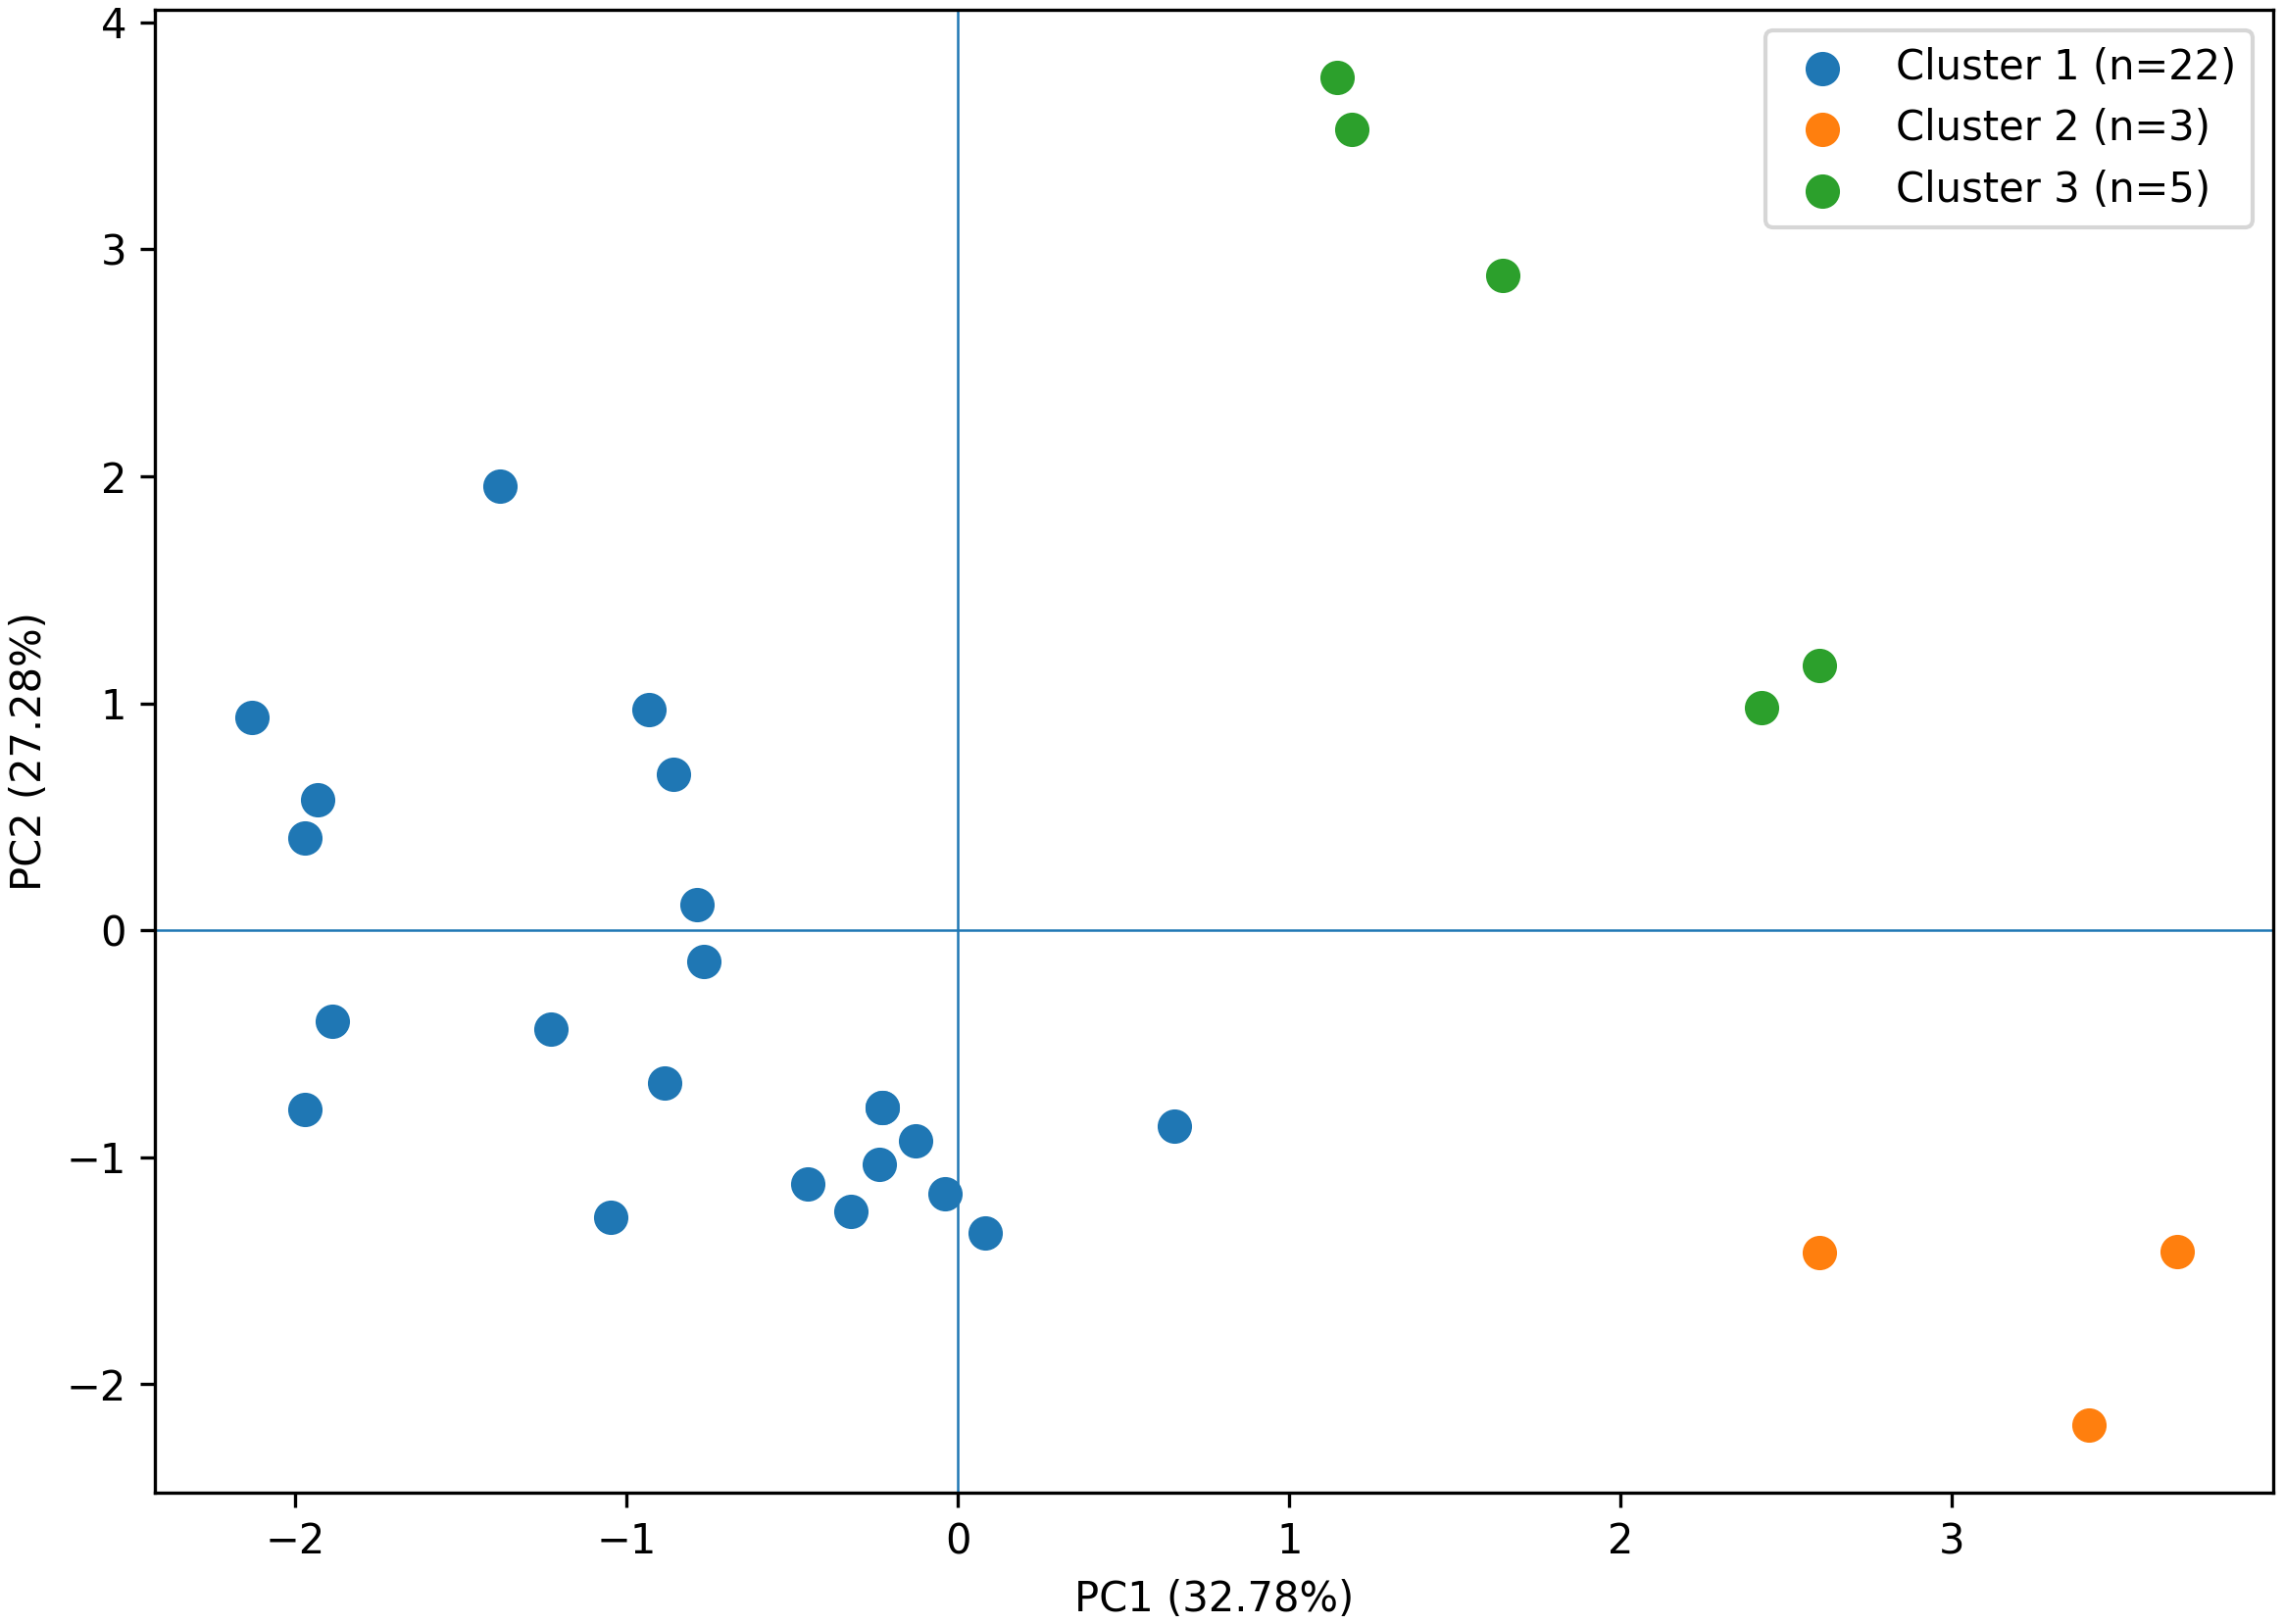
Ward clustering of the PC1–PC2 coordinates produced three clusters containing 22, 5, and 3 observations. The selected solution had a silhouette coefficient of 0.605 and a Davies–Bouldin index of 0.539. The clusters should be regarded as exploratory profiles of combined catalyst–process observations rather than discrete catalyst classes. The clusters are shown in Figure 4.
The centroids were located at approximately (PC1, PC2) = (−0.850, −0.332), (+3.231, −1.672) and (+1.800, +2.464), respectively. The separation therefore reflects different combinations of operating intensity and textural characteristics. Leave-one-study-out sensitivity showed that the broad organization was retained in most omissions, but removal of Ramos et al. (2008) [13] or Luadthong et al. (2016) [12] reduced adjusted-Rand agreement with the full partition to approximately 0.435 and 0.399, respectively. The exact cluster boundaries should therefore not be treated as stable universal classes.
3.5Incremental contribution of structural descriptors
Within the 30 complete cases, the operation-only block explained 7.44% of reported yield variance (R²=0.074; adjusted R²=−0.074; F=0.502; p=0.734). Addition of SBET, Vpore and ln(Da) increased R² to 48.63% (adjusted R²=0.323; F=2.975; p=0.024). The increase indicates that structural descriptors contain information associated with reported yield beyond the four operating variables in this selected complete-case subset.
The strongest individual association under ordinary OLS was SBET (B=−0.138, p=0.003). However, its p-value increased to 0.056 after source-study clustering. The other predictors remained nonsignificant under clustered inference. SBET should therefore be described as the strongest individual statistical association in this dataset, not as a definitive independent or causal determinant of biodiesel activity. The coefficients are given in Table 4.
| Predictor | B | OLS p | Study-clustered p |
|---|---|---|---|
| Reaction time | +2.857 | 0.428 | 0.430 |
| Catalyst loading | −1.219 | 0.515 | 0.354 |
| Alcohol ratio | −1.619 | 0.118 | 0.140 |
| Temperature | +0.009 | 0.964 | 0.945 |
| SBET | −0.138 | 0.003 | 0.056 |
| Vpore | +52.289 | 0.251 | 0.135 |
| ln(Da) | +1.795 | 0.475 | 0.211 |
3.6Validation and study-level robustness
Direct PLS regression provided limited observation-level predictive evidence. The two-component model produced the highest LOOCV performance, with calibration R²=0.397, LOOCV Q²=0.072 and RMSECV=27.91 percentage points. Adding further components did not improve out-of-sample performance consistently.
The study-level validation was substantially less favourable. The two-component PLS model produced a negative leave-one-study-out Q² of −1.825, indicating that the fitted relationships did not generalize when complete source studies were withheld. The cross-validation results are summarized in Table 5.
Study-level regression sensitivity gave full-model R² values ranging approximately from 0.469 to 0.730 when individual source studies were omitted. Removing Ramos et al. [13] reduced the model to R² 0.469 and increased the model p-value to 0.095, although the explanatory direction remained similar. The yield intraclass correlation was approximately zero, but clustered inference was retained as a conservative check because several source publications contributed multiple observations.
PCA sensitivity indicated that the broad multivariate organization was generally preserved, although the orientation of PC2 was sensitive to omission of studies contributing several observations. In particular, removal of Ramos et al. produced substantial rotation of the PC2 loading vector. The appropriate interpretation is therefore a robust broad structure with uncertainty in the exact orientation of individual axes.
3.7Implications for structure–operation analysis
The combined evidence supports a distinction between explanatory multivariate analysis and predictive catalyst selection. The PCA shows that operational intensity, textural characteristics, and basic-site information occupy interacting dimensions rather than isolated axes. HCA identifies observations with similar multivariate positions, while hierarchical regression indicates that structural descriptors can add explanatory information beyond operating variables in the selected complete cases.
The negative study-level predictive performance is equally important. A model that describes relationships within a small harmonized literature subset should not be presented as a general catalyst-selection algorithm. Instead, the present results identify variables that warrant standardized measurement in future experimental programs. A useful follow-up dataset should record catalyst composition, phase, SBET, pore-size distribution, active-site density, catalyst loading, temperature, alcohol ratio, reaction time, feedstock composition, analytical yield definition, catalyst reuse, and leaching under common protocols.
The present analysis is not a catalyst-family ranking, yield–time productivity assessment, or Pareto optimization. Those questions require a broader comparative performance analysis and are outside the scope of the present structure–operation study. The present contribution is restricted to the multivariate organization and explanatory role of structural and operational descriptors.
3.8Limitations
Several limitations constrain interpretation. First, the complete structure–operation analysis is based on only 30 observations from 19 studies because structural descriptors were incompletely reported. Second, the observations are heterogeneous with respect to feedstock, catalyst preparation, analytical method and experimental design. Third, some source studies contribute multiple observations, creating potential within-study dependence. Fourth, PCA includes yield among the variables and therefore cannot be interpreted as a causal latent model. Fifth, the negative study-level PLS Q² demonstrates that the present data do not provide evidence of transferable prediction. Finally, structural descriptors may themselves be proxies for catalyst composition, preparation history or catalyst family, so partial regression coefficients should not be assigned mechanistic meaning without controlled experiments.
4Conclusions
A literature-derived chemometric assessment was used to examine how heterogeneous biodiesel catalyst structure and reaction operation jointly organize reported performance. The curated hierarchy contained 218 heterogeneous observations, 133 operation-complete observations and 30 complete structure–operation–performance cases from 19 source studies. The small complete-case fraction demonstrates that structural reporting is a major constraint on literature-based catalyst modelling.
PCA retained four components explaining 85.69% of standardized variance. PC1 was dominated by reaction time and catalyst loading, whereas PC2 was dominated by SBET and pore volume, and PC3 contained a stronger active-basicity contribution. HCA produced three exploratory multivariate profiles, although their exact partition was sensitive to a small number of source studies.
In the broad 133-observation operation-only dataset, temperature and alcohol-to-oil ratio were positively associated with reported yield, while catalyst loading showed a negative association. Within the 30 matched complete cases, structural descriptors increased explained variance from 7.44% to 48.63%. Nevertheless, the strongest individual structural association, SBET, became borderline under study-clustered inference, and PLS showed negative study-level predictive performance.
The evidence therefore supports a literature-derived description of interacting structure and operation dimensions, but not a transferable predictive catalyst-selection model or causal ranking. Future progress depends on experimentally harmonized datasets in which catalyst structure, active-site chemistry, operating conditions, analytical yield definitions and durability metrics are measured consistently.
Acknowledgment
The authors acknowledge the Department of Chemistry, Faculty of Physical Sciences, University of Abuja, for academic and research support.
References
- [1]Knothe G, Razon LF. Biodiesel fuels. Progress in Energy and Combustion Science. 2017;58:36–59. https://doi.org/10.1016/j.pecs.2016.08.001
- [2]Osman AI, Nasr M, Farghali M, Rashwan AK, Abdelkader A, Al-Muhtaseb AH, et al. Optimizing biodiesel production from waste with computational chemistry, machine learning and policy insights: A review. Environmental Chemistry Letters. 2024;22(3):1005–1071. https://doi.org/10.1007/s10311-024-01700-y
- [3]Yusuf BO, Oladepo SA, Ganiyu SA. Efficient and sustainable biodiesel production via transesterification: Catalysts and operating conditions. Catalysts. 2024;14(9):581. https://doi.org/10.3390/catal14090581
- [4]Borges ME, Díaz L. Recent developments on heterogeneous catalysts for biodiesel production by oil esterification and transesterification reactions: A review. Renewable and Sustainable Energy Reviews. 2012;16(5):2839–2849. https://doi.org/10.1016/j.rser.2012.01.071
- [5]Jayakumar M, Karmegam N, Gundupalli MP, Gebeyehu KB, Asfaw BT, Chang SW, et al. Bioresource Technology. 2021;331:125054. https://doi.org/10.1016/j.biortech.2021.125054
- [6]Mukhtar A, Saqib S, Lin H, Hassan Shah MU, Ullah S, Younas M, et al. Current status and challenges in the heterogeneous catalysis for biodiesel production. Renewable and Sustainable Energy Reviews. 2022;157:112012. https://doi.org/10.1016/j.rser.2021.112012
- [7]Tobío-Pérez I, Díaz Dominguez Y, Rodríguez Machín L, Pohl S, Lapuerta M, Piloto-Rodríguez R. Biomass-based heterogeneous catalysts for biodiesel production: A comprehensive review. International Journal of Energy Research. 2022;46(4):3782–3809. https://doi.org/10.1002/er.7436
- [8]Oyekunle DT, Barasa M, Gendy EA, Tiong SK. Process Safety and Environmental Protection. 2023;177:844–867. https://doi.org/10.1016/j.psep.2023.07.064
- [9]Onukwuli OD, Ezeugo JNO, Nonso C, Nwosu-Obieogu K. Improving heterogeneous catalysis for biodiesel production process. Cleaner Chemical Engineering. 2022;3:100038. https://doi.org/10.1016/j.clce.2022.100038
- [10]Brereton RG. Chemometrics: Data analysis for the laboratory and chemical plant. Chichester: Wiley; 2003.
- [11]Lavine BK, Workman J. Chemometrics. Analytical Chemistry. 2008;80(12):4519–4531. https://doi.org/10.1021/ac800728t
- [12]Luadthong C, Khemthong P, Nualpaeng W, Faungnawakij K. Applied Catalysis A: General. 2016;525:68–75. https://doi.org/10.1016/j.apcata.2016.07.002
- [13]Ramos MJ, Casas A, Rodríguez L, Romero R, Pérez Á. Applied Catalysis A: General. 2008;346:79–85. https://doi.org/10.1016/j.apcata.2008.05.008
- [14]Martínez-Klimov ME, Ramírez-Vidal P, Roquero Tejeda P, Klimova TE. Catalysis Today. 2019. https://doi.org/10.1016/j.cattod.2019.08.027
- [15]Mongkolbovornkij P, Champreda V, Sutthisripok W, Laosiripojana N. Fuel Processing Technology. 2010;91:1510–1516. https://doi.org/10.1016/j.fuproc.2010.05.030
- [16]Chooi CY, Sim JH, Tee SF, Lee ZH. Sustainability. 2021;13:5849. https://doi.org/10.3390/su13115849
- [17]Hassan MAH, Alhumaimess MS, Alsohaimi IH, Essawy AA, Hussein MF, Alshammari HM, et al. ACS Omega. 2020;5:27811–27822. https://doi.org/10.1021/acsomega.0c02814
- [18]Farooq M, Ramli A, Naeem A, Noman M, Shah LA, Khattak NS, et al. International Journal of Energy Research. 2019;43:5438–5446. https://doi.org/10.1002/er.4646
- [19]Kingkam W, Nilgumhang K, Nuchdang S, Duangdee B, Puripunyavanich V, Rattanaphra D. Chiang Mai Journal of Science. 2022;49:1332–1343. https://doi.org/10.12982/CMJS.2022.083
- [20]Taufiq-Yap YH, Lee HV, Lau PL. Energy Exploration & Exploitation. 2012;30:853–866. https://doi.org/10.1260/0144-5987.30.5.853
- [21]Xu C, Sun J, Zhao B, Liu Q. Applied Catalysis B: Environmental. 2010;99:111–117. https://doi.org/10.1016/j.apcatb.2010.06.007
- [22]Yahaya M, Ramli I, Muhamad EN, Ishak NS, Nda-Umar UI, Taufiq-Yap YH. Catalysts. 2020;10:791. https://doi.org/10.3390/catal10070791
- [23]Shumaker JL, Crofcheck S, Tackett SA, Santillan-Jimenez E, Morgan T, Ji Y, et al. Applied Catalysis B: Environmental. 2008;82:120–130. https://doi.org/10.1016/j.apcatb.2008.01.010
- [24]Tabatabaei M, Aghbashlo M, Dehhaghi M, Panahi HKS, Mollahosseini A, Hosseini M, et al. Progress in Energy and Combustion Science. 2019;74:239–303. https://doi.org/10.1016/j.pecs.2019.06.001
- [25]Farouk SM, Tayeb AM, Abdel-Hamid SMS, Osman RM. Environmental Science and Pollution Research. 2024;31:12722–12747. https://doi.org/10.1007/s11356-024-32027-4
- [26]Ismaeel HK, Albayati TM, Al-Sudani FT, Salih IK, Dhahad HA, Cata Saady NM, et al. Chemical Engineering Research and Design. 2024;204:636–653. https://doi.org/10.1016/j.cherd.2024.02.048