Polytechnic Infrastructure and Energy Planning
Integrated Infrastructure, Energy Resilience and Intelligent Security Planning for Sustainable Technical Education in a Newly Established Nigerian Polytechnic: A Verified Engineering Case Study of Federal Polytechnic Ngodo Isuochi, Abia State, Nigeria
1Department of Electrical and Electronics Engineering Technology, Federal Polytechnic Ngodo-Isuochi, Isuochi, Abia State, Nigeria
2Department of Electrical/Electronics Engineering Technology, Ihechukwu Madubuike Institute of Technology, Nkwoagu-Amuda Isuochi, Umunneochi LGA, Abia State, Nigeria
Published October 2026
Abstract
Technical education institutions require reliable electricity, digital infrastructure, security, maintenance, and institutional capacity to support effective practical teaching. This study evaluates the verified infrastructure, energy, and security baseline of Federal Polytechnic Ngodo - Isuochi and proposes an engineering framework for improving energy resilience, laboratory continuity, intelligent security, and institutional growth.
A single-institution engineering case-study design was adopted. Institutional facilities and equipment inventories, solar-system nameplate data, supplied load measurements, and current enrolment and staff information were analyzed using descriptive statistics, electrical capacity calculations, photovoltaic (PV) yield modelling, battery-autonomy calculations, and scenario-based sizing. No unmeasured campus-wide demand or energy consumption data were fabricated.
The institution has a 500 kVA, 11/0.415 kV transformer and three decentralized solar installations, each comprising a 10 kVA inverter and 4.8 kWp PV array, giving 14.4 kWp total PV capacity. Three 5 kWh LiFePO₄ batteries provide 15 kWh nominal storage. Identified connected loads total 16.73 kW, including administration, ICT, library, and electrical/electronic practical facilities.
Assuming 4.8 peak-sun-hours daily and a 0.78 system factor, estimated PV generation is 53.91 kWh/day. The batteries provide approximately 11.4 kWh of theoretical usable energy, offering only 0.82–1.18 hours of autonomy for the three solar-supported loads. A six-hour laboratory-support scenario requires approximately 44.29 kWh of nominal battery storage and 8.99 kWp of PV capacity.
The study proposes an Integrated Smart Technical Education and Infrastructure Resilience Framework that prioritizes critical-load integration, laboratory electrification, battery expansion, intelligent security, predictive maintenance, and data-driven infrastructure planning.
Keywords: infrastructure integration; energy resilience; renewable energy; smart campus security; technical education; sustainable infrastructure planning
1Introduction
Technical and vocational education is fundamentally practical. In Electrical/Electronics Engineering Technology (EEET), competency formation depends on repeated exposure to electrical measurements, circuit construction, machine operation, electrical installation, maintenance, electronics, communication systems, troubleshooting, and safety procedures. The National Board for Technical Education (NBTE) curriculum for the National Diploma in Electrical and Electronics Engineering Technology reflects this practical orientation through course specifications and laboratory-oriented training requirements. The current NBTE curriculum was issued in November 2024 and provides a contemporary benchmark for interpreting laboratory and infrastructure readiness.
The physical presence of laboratories, however, does not automatically translate into practical educational capacity. A laboratory containing appropriate equipment but experiencing unreliable power supply, inadequate safety systems, poor maintenance, restricted operating hours, or weak scheduling remains operationally constrained. The same principle applies to ICT facilities and administrative systems. Consequently, infrastructure readiness should be understood as a system property arising from the interaction of physical assets, electricity, digital connectivity, security, maintenance, human resources, and institutional governance.
Energy resilience is particularly important in Nigeria because educational institutions frequently operate under uncertain electricity supply conditions. The resilience literature distinguishes resilience from simple reliability by considering the capacity of a system to withstand disruption, maintain essential functions, and recover or adapt after disruptive events. Jasiūnas et al. (2021) and Ahmadi et al. (2021) show that energy resilience is threat-dependent and increasingly connected with renewable generation, storage, digitalization and cybersecurity.
University and campus microgrid research has demonstrated the value of combining PV generation, battery energy storage, and intelligent energy management. Chedid et al. (2020) investigated PV-battery redesign under unreliable grid conditions, while Chedid and Sawwas (2021) applied genetic-algorithm-based sizing and rule-based energy management to a university campus. Ajiboye et al. (2022) demonstrated the value of data-driven planning for hybrid renewable energy management in a Nigerian smart-campus context.
More recent campus microgrid research has emphasized uncertainty, demand response, distributed energy resources, battery degradation, and optimization. Muqeet et al. (2021), for example, developed an energy-management approach incorporating renewable generation, battery storage, uncertainty, and demand response.
The smart-campus literature further indicates that campus transformation should not be reduced to the deployment of isolated digital devices. Polin et al. (2023) conceptualized the smart campus as an integrated physical-digital environment, while Polin et al. (2024) emphasized assessment frameworks for smart-campus development. Kourgiozou et al. (2021) similarly argued for holistic smart-energy pathways at campus scale.
Aghamolaei and Fallahpour (2023) identified energy systems, management and control, renewable energy, human factors, and smart technologies as important dimensions of campus decarbonization.
Security is another dimension of infrastructure resilience. As institutions introduce CCTV, access control, sensors, IoT devices and digital energy-management systems, physical and cyber-security boundaries become increasingly connected. Rajmohan et al. (2022) found that IoT security architecture remains fragmented across layers, while Aversano et al. (2021) showed the growing application of deep learning to IoT security while also identifying unresolved limitations and vulnerabilities.
Federal Polytechnic Ngodo Isuochi provides an appropriate case for this integrated investigation. The institution is newly established, operates from its take-off campus while permanent-site development continues, and already possesses dedicated E/E laboratories and workshops. It also has a 500 kVA transformer and three decentralised solar installations supporting administration, ICT and library loads. The central engineering problem is therefore how to integrate these existing assets with practical laboratory power, security, maintenance, and future institutional expansion.
This study makes five contributions. First, it establishes a verified engineering baseline using actual installed-system information rather than hypothetical campus assumptions. Second, it distinguishes measured connected loads from total campus demand. Third, it corrects and explicitly quantifies the very limited present battery-storage capacity. Fourth, it develops a scenario-based PV and battery sizing pathway for practical-laboratory continuity. Fifth, it integrates energy, laboratory, security, enrolment, and governance dimensions into an optimization-ready framework for sustainable technical education.
2Literature review
2.1Energy-system resilience and educational continuity
Jasiūnas et al. (2021) reviewed energy-system resilience as the ability of energy systems to withstand disruptive events and recover while maintaining essential functions. Their review is relevant to educational campuses because resilience depends on the interaction between the energy system and its threat environment. Ahmadi et al. (2021) further reviewed quantitative indicators and modelling approaches for resilience assessment. The implication is that campus resilience should be expressed through measurable variables such as critical-load coverage, storage duration, renewable contribution, recovery capability, and infrastructure redundancy.
Campus microgrid studies provide a direct engineering basis. Chedid et al. (2020) showed that PV and battery storage can redesign campus power systems operating under unreliable grid conditions. Chedid and Sawwas (2021) demonstrated a techno-economic planning approach using genetic-algorithm-based sizing and rule-based energy management. These studies support PV-battery systems as resilience assets but also indicate that sizing must be connected to actual load behaviour.
Ajiboye et al. (2022) provide an important Nigerian reference. Their study of hybrid renewable-energy management in a smart-campus environment demonstrates the value of detailed load and resource analysis and sensitivity analysis. Ondachi (2024), using the University of Abuja as a Nigerian case study, similarly shows the relevance of hybrid renewable systems for institutional electricity supply and the usefulness of simulation-based optimization.
However, the scale of those studies differs from the present case, which is a smaller polytechnic with a verified decentralized PV installation and a relatively modest identified load.
2.2Smart-campus planning
Polin et al. (2023) reviewed smart-campus development and emphasized the campus as a living laboratory in which digital technologies can support teaching, research, operations, and sustainability. Polin et al. (2024) subsequently developed an assessment framework for smart-campus maturity. These studies indicate that a smart campus should be assessed across multiple dimensions rather than by counting digital devices.
Kourgiozou et al. (2021) reviewed smart-energy systems in higher education and proposed a holistic decision-making perspective for integrating multiple energy vectors at campus scale. Ali et al. (2023) reviewed campus prosumer microgrids, energy-management architectures, storage technologies, and simulation tools, emphasizing that distributed generation and storage require effective energy-management strategies to become economically and operationally useful.
Oğuz and Güğül (2024) provide another useful insight: campus-level and building-level renewable-energy configurations can lead to materially different system sizes and performance outcomes. Their finding supports the present study's argument that decentralised solar installations should not automatically be assumed to constitute an optimized campus microgrid. The location of generation and storage relative to critical loads matters.
2.3Decarbonization and sustainability
Aghamolaei and Fallahpour (2023) reviewed university-campus decarbonization strategies and identified renewable energy, energy systems, management and control, human factors, and smart technologies among the relevant dimensions. Kourgiozou et al. (2021) similarly linked smart energy systems to longer-term net-zero pathways.
For Nigeria, Kamil et al. (2021) demonstrated through hybrid renewable-resource modelling that renewable-energy hybridization can provide substantial annual energy production relative to estimated institutional loads. Such work supports the feasibility of renewable-energy deployment in the Nigerian context but also reinforces the need for site-specific load and resource data.
2.4Intelligent security and IoT
Rajmohan et al. (2022) systematically reviewed IoT security patterns and architectures and found limited integration across the layers of IoT systems. Aversano et al. (2021) reviewed 69 studies on deep learning for IoT security and identified both opportunities and limitations. The literature therefore supports intelligent surveillance, anomaly detection, and sensor-based security but cautions that adding connected devices without a security architecture can introduce new vulnerabilities.
For a polytechnic, security has two simultaneous dimensions: protection of people and assets, and protection of the digital infrastructure that increasingly controls energy and security systems. A resilient smart-campus design should therefore include physical surveillance, access control, lighting, data governance, network segmentation, authentication and cyber-incident response.
2.5Synthesis of the literature
The verified literature converges on four propositions: (1) resilience is a system-level property rather than a single technology, (2) campus renewable-energy systems perform best when supported by demand measurement and energy-management strategies, (3) smart-campus development requires integrated physical, digital, and governance dimensions, and (4) security must be designed across both physical and cyber layers.
The unresolved issue is how these principles should be translated into a newly established Nigerian polytechnic in which physical infrastructure exists, but energy support is spatially fragmented, laboratory loads are outside the installed solar boundary, battery storage is limited, enrolment is still developing, and security infrastructure is incomplete.
This is the specific problem addressed by the present study.
3Research gap
Three principal gaps are identified.
- 1. Energy Infrastructure Integration Gap: Most campus energy studies focus on designing or optimizing energy systems from hypothetical baselines, with limited attention to institutions that have partially deployed renewable energy assets that are not yet integrated with practical laboratories.
- 2. Institutional and Contextual Gap: Existing smart-campus studies primarily focus on established universities and technologically advanced campuses, with limited research on newly established Nigerian polytechnics where practical training, accreditation readiness, security, staff capacity, and energy resilience must develop simultaneously.
- 3. Integrated Engineering Planning Gap: Few studies combine verified laboratory infrastructure, measured connected electrical load, existing solar photovoltaic (PV) and battery energy storage system (BESS) configurations, student enrolment, and physical-security readiness within a unified engineering planning framework.
4Research questions and analytical hypotheses
- RQ1. What are the verified infrastructure, electrical energy, and security baseline of Federal Polytechnic Ngodo Isuochi?
- RQ2. How much practical laboratory-connected load is currently outside the installed solar-energy supply boundary?
- RQ3. What is the present theoretical storage autonomy of the installed battery configuration?
- RQ4. What PV and battery capacities would be required under a defined laboratory-continuity scenario?
- RQ5. How can energy resilience, laboratory readiness, security, and institutional growth be represented within a unified optimization framework?
- RQ6. What infrastructure and policy interventions can improve the institution's readiness for sustainable growth and future accreditation?
4.1Analytical hypotheses
- H1: The institution's principal infrastructure challenge is integration and operational continuity rather than complete absence of physical infrastructure.
- H2: The existing battery configuration provides materially shorter autonomy than would be inferred from the PV and inverter nameplate capacities alone.
- H3: Integrating the E/E laboratories into a critical-load renewable-energy architecture would substantially improve practical-training resilience.
- H4: A staged, data-driven infrastructure strategy is more technically defensible than attempting to expand all infrastructure categories simultaneously.
Because this is a single-institution case study without repeated experimental observations or a multi-campus sample, the hypotheses are treated as analytical propositions and engineering hypotheses. Inferential significance testing is not claimed.
5Methodology
5.1Research design
A mixed descriptive-engineering case-study methodology was adopted. The study combines documentary verification, engineering calculations, scenario modelling, infrastructure assessment, and optimization formulation. The research does not claim experimental performance measurements where none were supplied.
The evidence hierarchy is: (1) verified nameplate or installed-system information; (2) institutional facility and equipment records; (3) supplied measured connected-load values; (4) calculated engineering quantities derived directly from verified values; and (5) scenario-based assumptions used solely for planning. This hierarchy prevents calculated values from being misrepresented as measured field observations.
5.2Data sources
The study used the institutional physical-facilities and Electrical and Electronic Engineering equipment inventory; installed transformer information; installed PV module and inverter information; battery nameplate information; measured connected-load values for identified buildings and laboratories; institutional enrolment and staffing information; verified information concerning existing security facilities; contemporary peer-reviewed literature; and the 2024 NBTE ND Electrical and Electronics Engineering Technology curriculum (National Board for Technical Education, 2024).
5.3Analytical tools
The analysis uses algebraic electrical calculations, descriptive statistics, scenario modelling, and a multi-objective optimization formulation.
The optimization model is presented as an engineering decision model rather than as a falsely claimed computational optimum because complete time-series load, solar irradiance, tariff, equipment-cost, and maintenance-cost datasets were not available.
6Institutional case-study description
Federal Polytechnic Ngodo Isuochi is a newly established Nigerian polytechnic operating from its take-off campus while permanent-site development continues. The institution currently has 400 staff, comprising 215 academic and 185 non-academic staff. The current student population for this study is 118.
Programmes include Accountancy, Business Administration/Management, Computer Science, Computer Engineering Technology, Electrical/Electronics Engineering Technology, Science Laboratory Technology and Statistics. All listed programmes are National Diploma programmes of two-year full-time duration in the institutional programme record.
The 2025/2026 Electrical and Electronic Engineering Technology enrolment supplied for the present study is two ND1 students and zero ND2 students. Computer Engineering Technology has one ND2 student. These values indicate that the institution remains in an early enrolment-growth phase.
The institutional facilities record identifies two programme-exclusive classrooms of 54 m² each with a capacity of 40, one exclusive 200 m² lecture theatre/hall with a capacity of 150, three shared 54 m² classrooms, and one shared 120 m² lecture hall. Dedicated E/E facilities comprise five 120 m² laboratories/workshops, each with a stated capacity of 30 students:
- Basic Electricity/Measurement and Instrumentation Laboratory
- Electronics/Telecommunications Laboratory
- Electrical Power and Machines Laboratory
- Electrical Installation/Maintenance and Repair Workshop
- Electronic Workshop
The inventory further records substantial laboratory equipment. The Basic Electricity/Measurement and Instrumentation Laboratory includes multiple ammeters, voltmeters, wattmeters, Megger testers, Wheatstone bridges, potentiometers, electronic trainers, oscilloscopes, oscillators, rheostats, earth-loop testers, and multimeters. The Power and Machines Laboratory contains transformers, power meters, transmission/distribution-line trainers, DC and AC machines, starters, dynamometer sets, transformer trainers, variable R/L/C loads and a machine-control trainer. The installation workshop contains wiring boards, drills, electrician tool kits, conduit-bending equipment, ELCBs, cable-jointing equipment, earth rods, cables, trunking equipment, Megger testers and maintenance equipment. The electronic and communications facilities include semiconductor trainers, transmitters/receivers, oscilloscopes, signal generators, IC/transistor testers, power supplies, amplifiers and circuit-construction trainers.
The facility inventory therefore supports the central premise of this study: the institution has meaningful physical and practical infrastructure, but its operational resilience depends on energy, maintenance, security and integration.
7Infrastructure assessment
7.1Physical infrastructure
The Electrical and Electronic Engineering Technology programme has five dedicated practical facilities of 120 m² each, giving a combined dedicated laboratory/workshop area of 600 m². At a nominal capacity of 30 students per facility, the combined stated capacity is 150 student places. However, simultaneous utilization is constrained by equipment availability, scheduling, safety and power.
The existence of the facilities is therefore not itself evidence of full operational readiness. The engineering assessment distinguishes asset presence from functional readiness.
7.2Laboratory equipment readiness
The inventory indicates that most listed equipment is recorded as being in good condition. This is a strong baseline for a newly established technical programme.
However, the inventory is primarily an asset record and does not provide measured utilization rates, calibration histories, preventive-maintenance records or practical-session energy profiles.
Accordingly, this study classifies equipment availability as documented rather than experimentally verified operational performance.
7.3Infrastructure readiness framework
A practical readiness vector is defined as:
where RP represents physical infrastructure, RE energy resilience, RL laboratory readiness, RICT digital infrastructure, RS security readiness, RM maintenance readiness and RG governance/accreditation readiness. The components are not assigned unsupported numerical scores. A future audit can score each component on a 0–1 or 0–100 scale using independently defined criteria.
8Energy modelling
8.1Transformer
The installed transformer is a MEKSAN 500 kVA, three-phase, 50 Hz distribution transformer with a primary voltage of 11 kV, a secondary voltage of 415/240 V (voltage ratio 11/0.415 kV), vector group Dyn11, a secondary full-load current of approximately 695.6 A and a primary full-load current of approximately 26.24 A. The theoretical secondary full-load current is:
This agrees with the supplied nameplate secondary current. The transformer rating should not be interpreted as actual campus demand or utilization. The presently identified connected load of 16.73 kW represents only the loads captured in this study.
8.2Existing PV architecture
Each of the three solar sites has 16 × 300 W JinkoSolar PV modules, one 10 kVA inverter, and one 5 kWh, 51.2 V LiFePO₄ battery. The PV capacity per site is:
The total PV capacity is:
The total inverter nameplate capacity is:
8.3Battery architecture
The battery nameplate identifies the Felicitysolar LPBF48100-M as a 51.2 V, 5 kWh lithium iron phosphate (LiFePO₄) battery, with a recommended charge/discharge power of 2.56 kW and scalability of up to eight units in parallel. Only one battery is installed per 10 kVA inverter. Therefore:
The installed battery-to-inverter ratio is:
The battery’s recommended charge/discharge power is:
This creates an important engineering constraint: the 2.56 kW recommended battery power is substantially below the 10 kVA inverter nameplate. The inverter may therefore not be able to draw its full AC nameplate power from the single battery without violating battery operating recommendations.
The exact permissible operating point must be confirmed against the inverter DC-input current, inverter battery-voltage range, battery-BMS compatibility, maximum continuous battery current, transient requirements, manufacturer-approved parallel configuration, and warranty conditions. This is an important finding that should be verified before any future battery expansion or inverter reconfiguration.
8.4Measured connected loads
The measured loads of the solar-supported buildings are 4.64 kW (administration), 3.25 kW (ICT) and 3.23 kW (library). Therefore:
The five Electrical and Electronic Engineering laboratory loads are:
- Power and Machines Laboratory: 1.46 kW
- Installation/Maintenance/Repair Workshop: 1.28 kW
- Electronic Workshop: 0.97 kW
- Basic Electricity/Measurement and Instrumentation Laboratory: 1.11 kW
- Electronics/Telecommunications Laboratory: 0.79 kW
Therefore:
The presently identified connected load is:
The laboratory load represents:
of the identified load, and the solar-supported buildings account for:
These percentages describe only the identified loads captured in this study; they are not campus-wide energy shares.
9PV sizing
9.1Existing PV yield
A planning estimate is used to illustrate the energy scale of the existing PV system. Because measured irradiance and inverter output data were not supplied, a peak-sun-hours assumption of 4.8 h/day and a system factor of 0.78 are adopted.
The corresponding annual planning yield is approximately:
This is a modelled planning estimate, not a measured annual generation value.
9.2Laboratory-support PV scenario
To provide a transparent engineering scenario, assume the five E/E practical facilities require their measured connected load for six hours per operational day.
The PV capacity required to supply this daily energy under the same planning assumptions is:
At 300 W per module:
Therefore, approximately 30 × 300 W modules, equivalent to 9.0 kWp, constitute a useful first-order planning configuration for six-hour daily laboratory-energy support under the stated assumptions.
This is not a final procurement design because laboratory schedules, motor starting currents, actual solar resource, wiring losses and battery charging requirements must be incorporated during detailed design.
10Battery sizing
10.1Present theoretical delivered energy
Assuming 80% usable depth of discharge (DoD) and 95% battery-side efficiency:
For the three installed batteries:
10.2Present theoretical autonomy
The theoretical autonomy at the measured loads of the administration, ICT and library buildings is:
A purely mathematical pooled-storage reference gives:
However, the pooled value must not be interpreted as actual cross-campus autonomy, because the three battery systems are decentralised and are not physically paralleled.
10.3Six-hour laboratory battery scenario
For six hours of full connected laboratory load:
The nominal battery capacity required at 80% DoD and 95% battery-side efficiency is:
Using 5 kWh battery modules:
Therefore, a minimum planning quantity of approximately nine 5 kWh batteries (45 kWh nominal storage) would be required for a six-hour full-connected-load laboratory scenario under the stated assumptions. This is a planning scenario, not a recommendation to place nine batteries on one inverter. The final architecture should distribute batteries and loads according to inverter DC limits, BMS requirements, laboratory feeder topology, motor starting requirements and manufacturer-approved parallel configurations.
11Security assessment
The verified security baseline includes perimeter fencing, a main gate, a back gate that is normally closed, one security post at the main gate and approximately 15–30 security personnel based on the institutional information supplied. Only one CCTV camera is presently identified, and it monitors the solar installation at the ICT unit.
No comprehensive internal perimeter-lighting system has been identified. No electronic access-control system or formal visitor-registration system has been identified. The institution also has no documented comprehensive campus-wide intelligent surveillance architecture in the data supplied for this study.
A Security Readiness Index (SRI) is therefore proposed:
where C is CCTV coverage, L lighting coverage, A access-control maturity, V visitor-management maturity, P perimeter protection and N network/cybersecurity readiness, and wC … wN are their weights. The weights must be established during a formal security audit rather than assumed in this study.
The recommended intelligent-security architecture should include perimeter CCTV coverage, solar-powered or protected security lighting, controlled main entrance, visitor registration, staff/student identification, network segmentation for security devices, centralized event logging, intrusion/anomaly detection, backup power for security equipment, and defined physical and cyber incident-response procedures.
The design should follow a defence-in-depth principle. Increasing connected cameras and sensors without secure network architecture would create additional cyber exposure.
12Engineering diagrams
Figures 1–6 show the existing and proposed engineering configurations.
Figure 1 shows the supply from the EEDC grid through the MEKSAN 500 kVA, 11/0.415 kV, Dyn11 transformer to the main distribution board, and the three existing independent solar branches: administration (16 × 300 W PV → 10 kVA inverter ↔ 1 × 5 kWh/51.2 V LiFePO₄ battery → 4.64 kW load), ICT (the same configuration → 3.25 kW load) and library (the same configuration → 3.23 kW load). It also shows the Electrical and Electronic Engineering laboratories separately as a proposed critical-load feeder with 5.61 kW identified load, proposed PV/BESS, a temporary 80 kVA generator, ATS/changeover, protection, earthing, an energy meter and a future EMS connection.
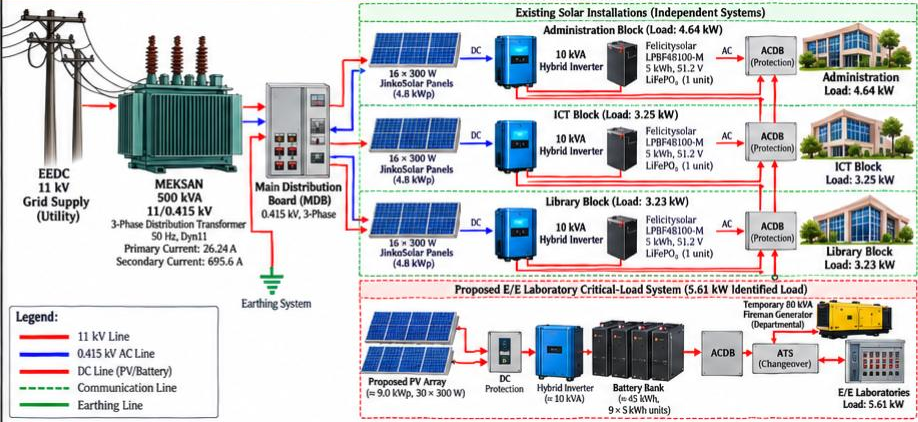
Figure 2 shows the PV subsystem of each site: 16 × 300 W JinkoSolar modules in two strings, combiner, DC isolator, DC surge protection device, MPPT/hybrid inverter interface, earthing and 4.8 kWp output. The three identical site configurations are shown side by side.
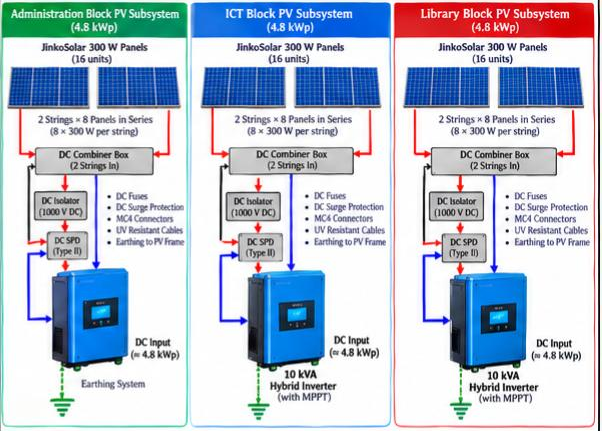
Figure 3 shows one Felicitysolar LPBF48100-M battery (51.2 V, 5 kWh, recommended 2.56 kW charge/discharge power) with BMS, RS485/CAN communication, DC protection, isolator, inverter DC terminals and earthing. It also shows a dashed future expansion path for additional parallel batteries, subject to manufacturer limits and inverter compatibility.
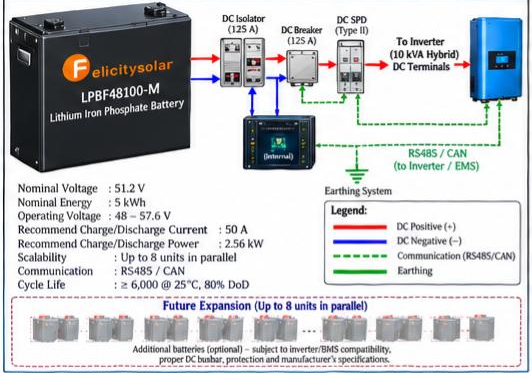
Figure 4 shows the proposed laboratory critical-load microgrid: PV → DC protection → MPPT/hybrid inverter → BESS → AC distribution board → ATS/changeover → laboratory critical-load feeder, with branches to the Electrical Power and Machines Laboratory, the Electrical Installation/Maintenance/Repair Workshop, the Electronic Workshop, the Basic Electricity/Measurement and Instrumentation Laboratory and the Electronics/Telecommunications Laboratory. It also shows the temporary 80 kVA generator as emergency backup, with electrical interlocks, breakers, SPDs, earthing, an energy meter and the EMS controller.
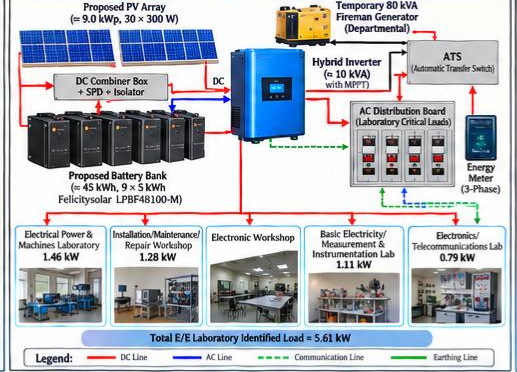
Figure 5 shows the proposed intelligent security architecture: perimeter CCTV → PoE/network switch → firewall/VLAN → central monitoring server, together with the gate camera, access control, visitor registration, security lighting, edge AI/anomaly detection, backup power, secure network and event logging.
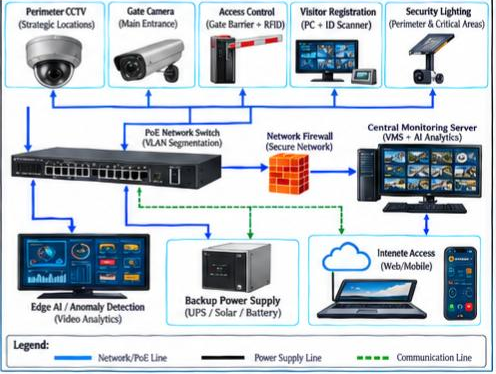
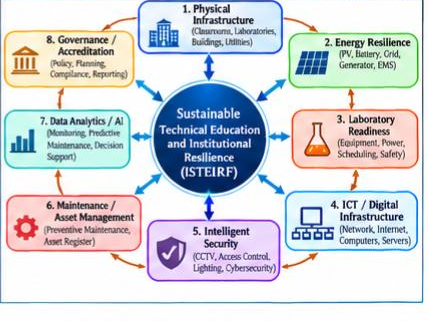
Figure 6 shows the eight connected layers of the proposed Integrated Smart Technical Education and Infrastructure Resilience Framework (ISTEIRF): (1) physical infrastructure, (2) energy resilience, (3) laboratory readiness, (4) ICT/digital infrastructure, (5) intelligent security, (6) maintenance/asset management, (7) data analytics/AI and (8) governance/accreditation. All layers converge on sustainable technical education and institutional resilience.
13Enrolment analysis
The institution currently has 118 students. The Electrical and Electronic Engineering Technology programme has two ND1 students and no ND2 students in the 2025/2026 information supplied. Computer Engineering Technology has one ND2 student.
The current Electrical and Electronic Engineering Technology enrolment therefore indicates a very early programme-growth stage. This has two implications. First, the present student count should not be used as evidence that the existing laboratory capacity is unnecessary. Technical education requires infrastructure before enrolment reaches its mature level, and accreditation and programme attractiveness depend partly on credible practical facilities. Second, current low utilization means that infrastructure planning should be scalable. Oversizing every infrastructure component for a hypothetical future population may impose unnecessary capital cost, while failing to provide reliable power and security could suppress future enrolment.
The institutional programme inventory for 2024/2025 also records enrolment in several other ND programmes, but parts of the extracted table are not sufficiently aligned to assign every displayed number confidently to a specific programme. Accordingly, only the current verified aggregate and clearly identified programme values are used for quantitative analysis.
14Statistical analysis
Because the study is a single institutional case with limited repeated observations, descriptive statistics are more defensible than inferential testing. The verified institutional indicators are given in Table 1.
| Indicator | Value |
|---|---|
| Total staff | 400 |
| Academic staff | 215 |
| Non-academic staff | 185 |
| Current student population | 118 |
| Transformer capacity | 500 kVA |
| Total PV capacity | 14.4 kWp |
| Total inverter capacity | 30 kVA |
| Total nominal battery storage | 15 kWh |
| Identified connected load | 16.73 kW |
| E/E laboratory connected load | 5.61 kW |
Academic staff constitute 53.75% of total staff, while non-academic staff constitute 46.25%. The student-to-total-staff ratio is approximately 0.295 students per staff member based on the supplied current counts. This unusual ratio is characteristic of an early-stage institution and should not be interpreted as an institutional efficiency indicator.
The identified Electrical and Electronics laboratory load represents 33.53% of the presently captured connected load. This is important because one-third of the identified load is associated directly with practical engineering facilities, yet those laboratories are outside the installed solar-energy boundary.
The 16.73 kW identified load is only 3.35% of the 500 kVA transformer rating. This is a screening comparison and not a transformer utilization factor because the campus-wide connected load and actual demand profile have not been fully measured.
15Integrated optimization model
The proposed model treats campus infrastructure planning as a multi-objective decision problem. Let the decision vector be:
where PPV is the installed PV capacity, EB the battery capacity, PINV the inverter capacity, NL the laboratory-energy capacity, NC the number of CCTV units, NLight the number of security-lighting units and NAccess the number of access-control units. The conceptual objective function is:
where Cannual is the annualized infrastructure and operating cost, Eunserved the energy not supplied to critical loads, Eemission the associated operational emissions, Rpenalty the resilience deficit, Spenalty the security-readiness deficit and w1 … w5 are stakeholder-defined weights. The power balance is expressed as:
The battery state of energy is represented by:
The battery constraints include:
The critical-load reliability (LCR) can be represented by:
A practical resilience target may then be specified as:
The model can impose a laboratory-priority constraint during grid outages:
Security readiness can be incorporated as a minimum constraint:
The optimization can subsequently be implemented using MILP, MINLP, genetic algorithms, particle swarm optimization or other suitable methods once time-series load, solar irradiance, tariff, equipment costs and reliability data become available. The present paper deliberately does not claim a numerical economic optimum because those data were not supplied.
16Results
16.1Verified energy-system baseline
The verified installed system comprises 14.4 kWp PV, 30 kVA total inverter capacity and 15 kWh nominal battery storage. The architecture is decentralized across administration, ICT and library buildings. The existing energy architecture is summarized in Table 2.
| Location | PV | Inverter | Battery | Measured load |
|---|---|---|---|---|
| Administration | 4.8 kWp | 10 kVA | 5 kWh | 4.64 kW |
| ICT | 4.8 kWp | 10 kVA | 5 kWh | 3.25 kW |
| Library | 4.8 kWp | 10 kVA | 5 kWh | 3.23 kW |
| Total | 14.4 kWp | 30 kVA | 15 kWh | 11.12 kW |
16.2Laboratory energy gap
The connected loads of the five Electrical and Electronic Engineering practical facilities are given in Table 3.
| Facility | Connected load |
|---|---|
| Electrical Power & Machines Laboratory | 1.46 kW |
| Electrical Installation/Maintenance/Repair Workshop | 1.28 kW |
| Electronic Workshop | 0.97 kW |
| Basic Electricity/Measurement & Instrumentation Laboratory | 1.11 kW |
| Electronics/Telecommunications Laboratory | 0.79 kW |
| Total | 5.61 kW |
The five facilities are not currently powered by the installed solar systems. Their operational energy pathway is therefore structurally different from that of administration, ICT and the library.
16.3Storage autonomy
The corrected single-battery architecture changes the resilience interpretation substantially. The installed battery at each site provides only about 3.8 kWh of theoretically deliverable energy under the adopted assumptions. This corresponds to less than 1.2 hours at each measured site load.
The implication is not that the installed solar system is ineffective. Rather, PV generation and battery storage perform different functions. The present system has meaningful PV generation capacity but relatively small storage capacity. It is therefore better characterized as a renewable-energy-supported system with limited short-duration storage rather than a long-duration backup system.
16.4PV generation scenario
The 14.4 kWp PV system yields approximately 53.91 kWh/day under the stated planning assumptions. This is more than the 33.66 kWh/day scenario energy requirement of the five laboratories at 5.61 kW for six hours. However, this comparison does not prove that the existing PV system can supply the laboratories because the generation is spatially distributed, the laboratories are not presently connected to the PV systems, generation is time-varying and storage is limited.
16.5Future laboratory sizing scenario
The six-hour laboratory scenario requires approximately 8.99 kWp PV and 44.29 kWh nominal battery storage. A practical first-order configuration is approximately 9.0 kWp PV and 45 kWh nominal battery storage, subject to detailed electrical design.
This scenario indicates that laboratory electrification is technically feasible within a moderate expansion of the existing renewable-energy architecture. It also indicates that battery storage, rather than PV nameplate alone, is the more immediate resilience constraint.
17Discussion against international literature
The results are consistent with the resilience literature in one important respect: the institution's energy problem cannot be solved by looking only at installed generation capacity.
Jasiūnas et al. (2021) emphasize that resilience depends on the system and the disruption. In the present case, the system contains a 500 kVA transformer and 14.4 kWp of PV, yet practical laboratories remain vulnerable because the laboratories are outside the solar supply boundary and battery capacity is limited.
The corrected battery configuration also illustrates why nameplate-based resilience assessments can be misleading. The total PV capacity is 14.4 kWp and inverter capacity is 30 kVA, but only 15 kWh of nominal storage is installed. The resulting 0.5 kWh/kVA battery-to-inverter ratio is low for long-duration backup.
This is consistent with the broader campus-microgrid literature, which treats storage sizing and energy-management strategy as critical elements rather than secondary additions.
The findings align with Chedid et al. (2020), who demonstrated the value of PV-battery systems under unreliable grid conditions. However, the present study extends that logic by identifying a spatial integration problem: existing PV and batteries serve administrative, ICT and library loads while practical engineering laboratories remain outside the renewable-energy boundary.
Ajiboye et al. (2022) emphasized data-driven campus energy planning. The present study supports this principle but also shows the importance of data hierarchy. Before an optimization algorithm is applied, the installed equipment configuration must be verified. The battery correction in this study changed the calculated storage capacity from an initially assumed 90 kWh to the verified 15 kWh. This is an important methodological lesson for institutional energy research.
Oğuz and Güğül (2024) demonstrated that campus-level and building-level renewable configurations can lead to different sizing outcomes. The decentralized architecture at Ngodo Isuochi illustrates this issue directly. Each site operates independently, which simplifies local deployment but limits energy sharing. A future campus microgrid could improve flexibility if interconnection is technically and economically justified.
The smart-campus findings also agree with Polin et al. (2023, 2024). A smart campus should not be defined by CCTV cameras, IoT devices or digital dashboards alone. The present case requires a coordinated physical-digital architecture involving energy, laboratory operation, security, maintenance and governance.
The security findings are consistent with Rajmohan et al. (2022) and Aversano et al. (2021). A future intelligent-security system should not simply increase the number of cameras. It should establish secure architecture, data governance, network segmentation and appropriate analytics.
18Sensitivity and uncertainty analysis
18.1PV-resource sensitivity
Table 4 gives the estimated daily PV yield for different peak-sun-hours, using the 14.4 kWp installed PV capacity and the same system factor of 0.78.
| Peak-sun-hours (h/day) | Estimated daily PV yield (kWh/day) |
|---|---|
| 3.5 | 39.31 |
| 4.0 | 44.93 |
| 4.8 | 53.91 |
| 5.5 | 61.78 |
The results show that the planning estimate is sensitive to solar resource. The difference between 3.5 and 5.5 peak-sun-hours/day is approximately 22.47 kWh/day. Therefore, actual site irradiance and PV output monitoring should be implemented before final expansion sizing.
18.2System-factor sensitivity
Table 5 gives the estimated daily PV yield for different system factors at 4.8 peak-sun-hours/day.
| System factor | Estimated daily PV yield (kWh/day) |
|---|---|
| 0.70 | 48.38 |
| 0.78 | 53.91 |
| 0.85 | 58.75 |
18.3Battery-availability sensitivity
For one 5 kWh battery at the administration load of 4.64 kW, theoretical autonomy varies with depth of discharge and battery-side efficiency. At 70% DoD and 90% efficiency, delivered energy is 3.15 kWh and autonomy is about 0.68 h. At 90% DoD and 97% efficiency, delivered energy is 4.37 kWh and autonomy is about 0.94 h. The central planning case of 80% DoD and 95% efficiency gives 0.82 h.
This confirms that uncertainty in battery operating assumptions is meaningful but does not change the main conclusion: one 5 kWh battery per 10 kVA inverter provides limited autonomy.
18.4Uncertainty classification
The status and main uncertainty of each input variable are classified in Table 6.
| Variable | Status | Main uncertainty |
|---|---|---|
| Transformer rating | Verified | None material for nameplate |
| PV module count/rating | Verified | Actual operating output |
| Inverter rating | Verified | Actual PF/DC constraints |
| Battery quantity | Verified | Actual usable capacity and BMS limits |
| Battery nameplate | Verified | Field operating condition |
| Building loads | Supplied measured values | Measurement duration and PF |
| Peak-sun-hours | Assumption | Seasonal/weather variation |
| System factor | Assumption | Temperature, wiring, inverter and soiling losses |
| Campus maximum demand | Not captured | Missing full-campus survey |
| Annual energy consumption | Not captured | Missing time-series metering |
| Tariff/costs | Not supplied | Prevents economic optimization |
| Security incidents | Not documented | Requires institutional security records |
19Engineering implications
The first engineering implication is that battery expansion should be prioritized based on critical-load requirements rather than inverter nameplate capacity alone. The present 10 kVA inverter/5 kWh battery pairing provides a high inverter-to-storage ratio.
Second, the Electrical and Electronic Engineering Technology laboratories should be considered critical educational loads. Their combined connected load of 5.61 kW is modest relative to the 500 kVA transformer rating but significant relative to the institution's renewable-energy storage capacity.
Third, a dedicated laboratory critical-load feeder should be developed. The feeder should include appropriate overcurrent protection, surge protection, earthing, isolation, ATS/changeover functionality and energy metering.
Fourth, the laboratory load contains electrical machines and workshop equipment. Motor starting currents and transient behaviour must therefore be considered before selecting the final inverter rating. A 10 kVA inverter may pass a steady-state screening calculation because 5.61 kW is below its nameplate, but actual motor starting performance must be confirmed.
Fifth, future PV and battery expansion should be designed as a coordinated system. Adding PV without adequate storage may increase daytime generation without improving outage resilience. Adding storage without sufficient PV may provide backup but create a charging-energy deficit.
Sixth, all future infrastructure should be metered. Minimum instrumentation should include PV generation, battery voltage/current/SOC, inverter output, critical-load feeder energy, grid availability and generator operation.
Seventh, the institution should maintain a digital asset register containing equipment identification, location, rating, installation date, condition, maintenance history and calibration status.
20Policy implications
The study supports six policy directions.
- 1. Institutional Energy Policy: Institutional energy policy should define critical loads. Administration, ICT, library, laboratories, security and emergency systems should not be treated identically during outages.
- 2. Renewable-Energy Procurement Policy: Renewable-energy projects should include storage, metering and energy-management requirements from the design stage.
- 3. Laboratory Infrastructure Policy: Laboratory infrastructure should be treated as a strategic educational asset. Reliable power for practical training should be included in institutional capital planning.
- 4. Security Policy: Security policy should integrate physical protection and cybersecurity. CCTV, access control and IoT devices should operate under an approved network and data-governance framework.
- 5. Enrolment-Linked Infrastructure Planning: Infrastructure expansion should be tied to enrolment forecasts and programme-accreditation requirements. The present low Electrical and Electronic Engineering Technology program enrolment should support staged expansion rather than indefinite postponement of practical infrastructure.
- 6. Institutional Data Governance: Future planning should rely on synchronized records for students, staff, energy, facilities, maintenance, and security.
21Conclusion
This study established a verified engineering baseline for Federal Polytechnic Ngodo Isuochi and demonstrated that the institution's principal infrastructure challenge is one of integration and resilience rather than simple infrastructure absence.
The institution has five dedicated E/E practical facilities, substantial documented laboratory equipment, a 500 kVA transformer and a decentralised renewable-energy system comprising 14.4 kWp PV and 30 kVA of inverter capacity. Verification of the installed battery configuration is critical: only one 5 kWh, 51.2 V LiFePO4 battery is installed per 10 kVA inverter. Consequently, total nominal battery storage is 15 kWh, not 90 kWh.
The corrected storage analysis shows that the present batteries provide only approximately 0.82–1.18 hours of theoretical autonomy at the measured loads of the administration, ICT and library buildings under the stated planning assumptions. The five E/E laboratories have a combined connected load of 5.61 kW and remain outside the installed solar supply boundary. This creates a direct resilience gap in the practical-training system.
The existing 14.4 kWp PV system is capable of producing approximately 53.91 kWh/day under the selected planning assumptions, but generation capacity alone does not guarantee laboratory continuity. A six-hour laboratory-support scenario requires approximately 8.99 kWp PV and 44.29 kWh nominal battery storage, equivalent to approximately nine 5 kWh batteries and thirty 300 W PV modules as a first-order planning reference. Final engineering design must consider load diversity, motor starting, irradiance, battery limits, inverter compatibility, protection and actual operating schedules.
The proposed Integrated Smart Technical Education and Infrastructure Resilience Framework connects physical infrastructure, energy resilience, laboratory readiness, ICT, intelligent security, maintenance, data analytics and governance. Its principal value is that it provides a staged engineering pathway that can grow with enrolment and institutional development.
The study therefore recommends a transition from isolated infrastructure projects to an integrated, metered and critically prioritized campus infrastructure strategy. Such an approach can improve educational continuity, support practical competency development, strengthen security, reduce dependence on temporary generation and improve the institution's long-term readiness for sustainable expansion and accreditation.
22Future research
Future work should establish a 12-month interval energy-monitoring dataset covering grid availability, PV generation, inverter output, battery SOC, critical-load consumption and generator operation. The next phase should also conduct:
- laboratory-by-laboratory load profiling
- motor-starting and transient analysis
- power-factor measurement
- battery degradation assessment
- solar-resource measurement
- full-campus maximum-demand determination
- techno-economic optimization
- carbon-emission assessment
- reliability and resilience indices
- security risk scoring
- IoT cybersecurity assessment
- AI-based anomaly detection
- digital-twin development
- experimental validation of the proposed laboratory microgrid
The future optimization study should use measured time-series data and compare centralized, decentralized and networked campus-energy architectures.
Data availability
The study is based on institutional information, an institutional physical-facilities/equipment inventory, installed-system nameplate information and supplied connected-load measurements. The underlying institutional records are not publicly deposited because they may contain internal operational information. Non-sensitive derived datasets and model parameters can be made available by the corresponding author upon reasonable request and subject to institutional authorization.
Ethics statement
This study did not involve human-subject experimentation, clinical data or intervention. No personally identifiable student or staff information was analyzed. The study used institutional infrastructure, equipment, energy and aggregate enrolment information for engineering planning. Institutional authorization should be obtained before public release of sensitive facility layouts, security-system details or operational records.
Acknowledgment
We sincerely appreciate the Tertiary Education Trust Fund (TETFund) for its financial support and sponsorship of this project. Their support has contributed significantly to this work, and through their assistance the project has achieved its objectives. We are deeply grateful for TETFund’s commitment to promoting research, knowledge advancement, and academic development.
References
- [1]Ahmadi S, Saboohi Y, Vakili A (2021). Frameworks, quantitative indicators, characters, and modeling approaches to analysis of energy system resilience: A review. Renewable and Sustainable Energy Reviews, 144, 110988. https://doi.org/10.1016/j.rser.2021.110988
- [2]Aghamolaei R, Fallahpour M (2023). Strategies towards reducing carbon emission in university campuses: A comprehensive review of both global and local scales. Journal of Building Engineering, 76, 107183. https://doi.org/10.1016/j.jobe.2023.107183
- [3]Ajiboye AA, Popoola SI, Adewuyi OB, Atayero AA, Adebisi B (2022). Data-driven optimal planning for hybrid renewable energy system management in smart campus: A case study. Sustainable Energy Technologies and Assessments, 52, 102189. https://doi.org/10.1016/j.seta.2022.102189
- [4]Ali A, Muqeet HA, Khan T, Hussain A, Waseem M, Niazi KAK (2023). IoT-enabled campus prosumer microgrid energy management, architecture, storage technologies, and simulation tools: A comprehensive study. Energies, 16(4), 1863. https://doi.org/10.3390/en16041863
- [5]Aversano L, Bernardi ML, Cimitile M, Pecori R (2021). A systematic review on deep learning approaches for IoT security. Computer Science Review, 40, 100389. https://doi.org/10.1016/j.cosrev.2021.100389
- [6]Chedid R, Sawwas A (2021). A techno-economic feasibility study of a green energy initiative for a university campus. International Journal of Smart Grid and Clean Energy, 10(3), 203–214. https://doi.org/10.12720/sgce.10.3.203-214
- [7]Chedid R, Sawwas A, Fares D (2020). Optimal design of a university campus micro-grid operating under unreliable grid considering PV and battery storage. Energy, 200, 117510. https://doi.org/10.1016/j.energy.2020.117510
- [8]Jasiūnas J, Lund PD, Mikkola J (2021). Energy system resilience—A review. Renewable and Sustainable Energy Reviews, 150, 111476. https://doi.org/10.1016/j.rser.2021.111476
- [9]Kamil KR, Yusuf AO, Yakubu SA, Seriki SB (2021). Renewable energy resources hybridization as an efficient and cost-effective alternative for electrification. Nigerian Journal of Technological Development, 18(3), 174–183. https://doi.org/10.4314/njtd.v18i3.2
- [10]Kourgiozou V, Commin A, Dowson M, Rovas D, Mumovic D (2021). Scalable pathways to net zero carbon in the UK higher education sector: A systematic review of smart energy systems in university campuses. Renewable and Sustainable Energy Reviews, 147, 111234. https://doi.org/10.1016/j.rser.2021.111234
- [11]Muqeet HA, Munir HM, Ahmad A, Sajjad IA, Jiang GJ, Chen HX (2021). Optimal operation of the campus microgrid considering the resource uncertainty and demand response schemes. Mathematical Problems in Engineering, 2021, 5569701. https://doi.org/10.1155/2021/5569701
- [12]National Board for Technical Education (2024). Curriculum and course specifications: National Diploma (ND) in Electrical and Electronics Engineering Technology. NBTE.
- [13]Oğuz C, Güğül GN (2024). A comparative configuration and decision of main restrictions of a renewable energy powered campus micro grid: A case study. Energy and Buildings, 322, 114685. https://doi.org/10.1016/j.enbuild.2024.114685
- [14]Ondachi PA (2024). Optimisation of an on-grid hybrid energy system: A case study of the main campus of the University of Abuja, Nigeria. ABUAD Journal of Engineering Research and Development, 7(1), 295–308. https://doi.org/10.53982/ajerd.2024.0701.30-j
- [15]Polin K, Yigitcanlar T, Limb M, Washington T (2023). The making of smart campus: A review and conceptual framework. Buildings, 13(4), 891. https://doi.org/10.3390/buildings13040891
- [16]Polin K, Yigitcanlar T, Washington T, Limb M (2024). Unpacking smart campus assessment: Developing a framework via narrative literature review. Sustainability, 16(6), 2494. https://doi.org/10.3390/su16062494
- [17]Rajmohan T, Nguyen PH, Ferry N (2022). A decade of research on patterns and architectures for IoT security. Cybersecurity, 5, 2. https://doi.org/10.1186/s42400-021-00104-7
- [18]United Nations (2015). Transforming our world: The 2030 Agenda for Sustainable Development. United Nations.