Pharmacy
Stability-Indicating RP-HPLC Method Development and Validation for Ibuprofen Across Three Advanced Drug Delivery Systems: Liposomes, PLGA Nanoparticles and a Transdermal Patch
Department of Pharmaceutics, Apex Institute of Pharmacy, Mirzapur, Uttar Pradesh, India (affiliated to Dr. A.P.J. Abdul Kalam Technical University, Lucknow, Uttar Pradesh, India)
Published October 2026
Abstract
Advanced drug delivery systems (ADDS) — liposomes, polymeric nanoparticles and transdermal patches — markedly improve the pharmacokinetic and targeting profile of poorly soluble drugs, yet the absence of validated, stability-indicating analytical methods (SIAMs) for these complex matrices remains a significant barrier to their regulatory approval and routine quality control [1,6,9]. This study developed and validated a reversed-phase high-performance liquid chromatography (RP-HPLC) SIAM for ibuprofen — a Biopharmaceutics Classification System (BCS) Class II model drug — formulated as three distinct ADDS platforms: liposomes prepared by thin-film hydration and membrane extrusion, poly(lactic-co-glycolic acid) (PLGA) nanoparticles prepared by nanoprecipitation, and a matrix-type transdermal patch prepared by solvent casting. All three formulations were physicochemically characterised and subjected to forced degradation under acidic, alkaline, oxidative, photolytic and thermal stress per ICH Q1A(R2)/Q1B guidance. The developed RP-HPLC method resolved ibuprofen from five structurally distinct degradation products and was fully validated per ICH Q2(R2) (linearity r² = 0.99999 over 5–200 μg/mL; accuracy 99.4–100.1%; precision %RSD ≤ 0.78%; LOD 0.24 μg/mL; LOQ 0.71 μg/mL). Six-month long-term and accelerated stability studies demonstrated that all three ADDS retained ≥ 92% assay, with first-order degradation kinetics predicting shelf lives of 27–39 months. Strong inverse correlations (r = −0.92 to −0.96) linked chemical degradation to physical critical-quality-attribute (CQA) drift, together providing an integrated chemo-physical quality-assurance template applicable to ADDS development more broadly.
Keywords: advanced drug delivery systems; stability-indicating analytical method; RP-HPLC; ibuprofen; forced degradation; ICH Q2(R2); liposomes; PLGA nanoparticles; transdermal patch; shelf-life prediction
1Introduction
Advanced drug delivery systems (ADDS) — including liposomes, polymeric nanoparticles and transdermal patches — have transformed the pharmaceutical landscape by enabling controlled release, site-specific targeting and improved solubilisation of poorly water-soluble drugs [1,6,9,27]. Unlike conventional oral and parenteral dosage forms, which rely on passive drug distribution and are limited by first-pass metabolism, narrow therapeutic windows and non-specific toxicity, ADDS exploit nanoscale carrier architecture and, for nanoparticulate systems, the enhanced permeability and retention (EPR) phenomenon to confine drug action and prolong systemic exposure [7,19,26,33]. However, the colloidal and multi-component nature of ADDS formulations — comprising drug, lipid or polymer matrix, surfactants and stabilisers — introduces analytical complexity that conventional, drug-substance-only assay methods were never designed to address [3,9,24].
A stability-indicating analytical method (SIAM) is one capable of unambiguously quantifying the intact drug in the presence of its degradation products, process impurities and formulation excipients [10,11,14]. For conventional dosage forms, SIAM development is well established; for ADDS, however, the literature identifies a persistent gap — few validated methods exist that account simultaneously for carrier-related matrix interference and the full spectrum of forced-degradation products generated under ICH-recommended stress conditions [4,13,15,30]. This gap carries direct regulatory consequences, since the International Council for Harmonisation (ICH) requires forced-degradation data and a validated, stability-indicating assay as prerequisites for Common Technical Document (CTD) stability packages and shelf-life assignment [34,36,38].
Ibuprofen, a BCS Class II non-steroidal anti-inflammatory drug, was selected as the model active pharmaceutical ingredient for this study because of its poor aqueous solubility, well-characterised degradation chemistry, and continued clinical relevance across oral, parenteral and topical/transdermal routes [28]. Three structurally distinct ADDS platforms were engineered for ibuprofen — liposomes (vesicular, lipid-bilayer carriers), PLGA nanoparticles (biodegradable polymeric carriers), and a transdermal patch (a planar polymeric matrix system) — to capture the breadth of carrier chemistries encountered in contemporary ADDS development [2,6,12,19,21].
The present work therefore had three interrelated aims: (i) to formulate and physicochemically characterise ibuprofen liposomes, PLGA nanoparticles and a transdermal patch; (ii) to develop and fully validate, per ICH Q2(R2), a reversed-phase HPLC method capable of resolving ibuprofen from its forced-degradation products across all three matrices; and (iii) to conduct long-term and accelerated stability studies per ICH Q1A(R2), and to statistically correlate chemical stability (assay and impurity data) with physical critical quality attributes (CQAs) such as particle size, zeta potential and encapsulation efficiency, so as to propose an integrated chemo-physical quality-assurance framework applicable to ADDS more broadly.
2Materials and methods
2.1Materials
Ibuprofen BP grade (purity ≥ 99.5%) was obtained from Yarrow Chem Products (Mumbai, India); identity was confirmed by FTIR, UV spectroscopy and melting-point determination prior to use. Ibuprofen working standard (Sigma-Aldrich, USA; purity 99.8% by HPLC) served as the analytical reference. Dipalmitoylphosphatidylcholine (DPPC), cholesterol and DSPE-mPEG2000 were used for liposome bilayer construction; PLGA (50:50, MW ≈ 50,000 Da) and polyvinyl alcohol (PVA) for nanoparticle fabrication; and hydroxypropyl methylcellulose (HPMC K4M), polyvinylpyrrolidone (PVP K30), propylene glycol and Span 80 constituted the transdermal patch matrix. HPLC-grade acetonitrile, methanol and orthophosphoric acid (Merck, Germany), potassium dihydrogen phosphate (SRL, Mumbai) and Milli-Q water (resistivity ≥ 18.2 MΩ·cm) were used throughout.
2.2Preparation of the three ADDS
Liposomes were prepared by the thin-film hydration method [6,24]: DPPC, cholesterol and DSPE-mPEG2000 (molar ratio 7:3:0.35) and ibuprofen (drug:lipid = 1:10, w/w) were dissolved in chloroform:methanol (2:1, v/v) and the organic solvent removed by rotary evaporation at 40 °C to form a thin lipid film, which was hydrated with phosphate-buffered saline (pH 7.4, 60 °C) and reduced to small unilamellar vesicles by sequential extrusion (400→200→100 nm polycarbonate membranes, 11 passes each). Unentrapped drug was removed by dialysis (MWCO 12–14 kDa, 4 °C, 24 h).
PLGA nanoparticles were prepared by nanoprecipitation [2,12,21]: PLGA and ibuprofen (drug:polymer = 1:5, w/w) in acetone were added dropwise (1 mL/min) into an aqueous 0.5% w/v PVA phase under stirring (700 rpm); nanoparticles formed instantaneously on solvent diffusion and were recovered by ultracentrifugation (15,000 rpm, 4 °C), washed, and lyophilised with trehalose as cryoprotectant.
Transdermal patches were fabricated by solvent casting [19,20]: HPMC K4M and PVP K30 (2:1) were dissolved in ethanol:water (60:40, v/v) with propylene glycol (plasticiser) and Span 80 (surfactant); ibuprofen (10% w/w of total patch weight) was incorporated, and the casting solution was poured onto mercury-levelled Petri dishes and dried at 40 °C for 24 h to give matrix-type patches (5 cm², punched).
2.3Physicochemical characterisation
Particle size (Z-average), polydispersity index (PDI) and zeta potential of the liposomes and nanoparticles were determined by dynamic/electrophoretic light scattering (Zetasizer Nano ZS, Malvern Panalytical) [18,32]. Encapsulation efficiency (EE%) and drug loading (DL%) were determined indirectly, by RP-HPLC quantification of unentrapped drug following dialysis/ultracentrifugation [1]. Thermal behaviour was assessed by differential scanning calorimetry (DSC 3+, Mettler-Toledo; 25–300 °C, 10 °C/min) [22,23], and chemical interactions/drug identity by attenuated total reflectance FTIR (PerkinElmer Spectrum Two, 4000–400 cm⁻¹) [5]. Patch quality attributes (thickness, weight and content uniformity, folding endurance, moisture content, tensile strength and in vitro permeation flux via Franz diffusion cells) were evaluated per standard transdermal evaluation protocols [19,20]. In vitro drug release from liposomes/nanoparticles (dialysis-bag method) and ex vivo permeation from the patch were analysed against zero-order, first-order and Higuchi release models [8].
2.4Forced degradation studies
Forced degradation was conducted on ibuprofen bulk drug and on each ADDS formulation separately, per ICH Q1A(R2)/Q1B/Q3B(R2) and established stress-testing guidance [4,14,15,34,35,37]: acid hydrolysis (0.1–1 M HCl, 60 °C, up to 24 h), alkaline hydrolysis (0.1–1 M NaOH, 60 °C, up to 24 h), oxidative stress (0.3–3% H₂O₂, 25 °C, up to 48 h), photolytic exposure (ICH Q1B visible/UV doses) and thermal stress (60–80 °C, solid and solution state, up to 4 weeks). Degradation products were quantified by RP-HPLC (relative peak-area attenuation) and structurally characterised by LC-MS/MS on a Waters Acquity UPLC–TQ-D system (ESI, 50–600 Da scan) [29].
2.5RP-HPLC method development and validation
A stability-indicating RP-HPLC method was developed on a ZORBAX Eclipse Plus C18 column (250 × 4.6 mm, 5 μm) using a QbD-informed screening approach [3,38]: optimised isocratic mobile phase of acetonitrile:10 mM KH₂PO₄ buffer (pH 3.0) (60:40, v/v), flow rate 1.0 mL/min, column temperature 30 °C, UV detection at 264 nm. The method was validated per ICH Q2(R2) [36,39] for specificity, linearity/range (5–200 μg/mL), accuracy (80/100/120% recovery), precision (repeatability and intermediate precision), LOD/LOQ (signal-to-noise and slope methods) and robustness (Plackett–Burman design).
2.6Stability studies and data analysis
Long-term (25 °C/60% RH) and accelerated (40 °C/75% RH) stability studies were conducted for 6 months per ICH Q1A(R2), consistent with India's designation as ICH climatic Zone IVb [16,34,40,41]. Assay and total impurities were monitored at 0, 1, 2, 3 and 6 months using the validated RP-HPLC SIAM. Degradation rate constants were obtained by fitting assay-versus-time data to zero-, first- and second-order kinetic models; the Arrhenius equation was applied to accelerated data to estimate activation energy and extrapolate shelf life (t₉₀) [17]. Pearson correlation coefficients were computed between chemical stability indicators (assay, total impurities) and physical CQAs (particle size, zeta potential, EE%) using SPSS v27.0, with significance set at p < 0.05.
3Results and discussion
3.1Physicochemical characterisation
The three ibuprofen ADDS exhibited CQAs consistent with their respective carrier chemistries (Table 1). Liposomes (FL3) showed a Z-average particle size of 98.4 ± 3.2 nm with a narrow PDI of 0.142 ± 0.018 and zeta potential of −34.2 ± 1.8 mV, reflecting good colloidal stability via electrostatic repulsion [18,24]; encapsulation efficiency was 74.3 ± 2.1%. PLGA nanoparticles (FP4) were larger (187.3 ± 7.1 nm; PDI 0.213 ± 0.024) with a less negative zeta potential (−28.6 ± 2.3 mV) and lower encapsulation efficiency (63.8 ± 3.4%) but markedly higher drug loading (11.2 ± 0.6% w/w), reflecting the higher drug:polymer ratio employed [1,21]. The transdermal patch achieved drug-content uniformity of 99.2 ± 1.8% (n = 10), within the 90.0–110.0% acceptance range. DSC thermograms of both nanocarrier formulations showed absence of the sharp ibuprofen melting endotherm, indicating molecular dispersion of the drug within the carrier matrix, while FTIR confirmed retention of the diagnostic ibuprofen carbonyl band (1718–1750 cm⁻¹, shifted relative to the free-drug value of 1720 cm⁻¹ owing to carrier interaction) without evidence of chemical incompatibility [5,22,23]. Cumulative in vitro release at 72 h ranged from 88.9% (PLGA NPs, triphasic profile) to 93.2% (liposomes, biphasic profile), while the patch sustained a permeation flux of 46.3 ± 4.2 μg/cm²/h over 24 h — exceeding the 40 μg/cm²/h therapeutic target with a 2.8-fold permeation enhancement over a plasticiser-free control [8,19,20].
| Parameter | Liposomes (FL3) | PLGA Nanoparticles (FP4) | Transdermal Patch (FT2) |
|---|---|---|---|
| Z-average Particle Size (nm) | 98.4 ± 3.2 | 187.3 ± 7.1 | N/A (matrix system) |
| Polydispersity Index (PDI) | 0.142 ± 0.018 | 0.213 ± 0.024 | N/A |
| Zeta Potential (mV) | −34.2 ± 1.8 | −28.6 ± 2.3 | N/A |
| Encapsulation Efficiency (%) | 74.3 ± 2.1 | 63.8 ± 3.4 | N/A |
| Drug Loading (% w/w) | 4.86 ± 0.14 | 11.2 ± 0.6 | 10.0 (nominal) |
| Drug Content Uniformity (%, n = 10) | — | — | 99.2 ± 1.8 |
| Ibuprofen Melting Peak (DSC) | Absent (amorphous) | Absent (amorphous) | Absent (amorphous) |
| C=O FTIR Band (cm⁻¹) | 1730 | 1750 | 1718 |
| Permeation Flux (μg/cm²/h, 24 h) | — | — | 46.3 ± 4.2 |
| Cumulative Release at 72 h (%) | 93.2 ± 2.1 | 88.9 ± 2.6 | 91.3 ± 3.4 |
3.2Forced degradation and method specificity
All five stress conditions produced measurable degradation of ibuprofen in every matrix, with values for the pure drug (6.8–11.4%) and all three ADDS falling within the ICH-recommended 5–20% target degradation window (Figure 1), confirming appropriately calibrated stress intensity [4,14,34,35]. PLGA nanoparticles were most vulnerable to acid hydrolysis (12.8%) and thermal stress (15.4%), consistent with acid- and heat-catalysed hydrolytic cleavage of the polyester backbone liberating encapsulated drug into a locally acidic microenvironment generated by lactic/glycolic acid by-products [12,21]. Liposomes showed the greatest susceptibility to oxidative stress (14.2%), attributable to peroxidation of the unsaturated lipid bilayer exposing entrapped drug to the oxidising medium [6,24]. The transdermal patch was comparatively the most robust system under hydrolytic and oxidative stress (5.2–8.1%) but most labile under photolytic exposure (9.4%), reflecting its larger exposed surface area as a thin planar film [19].
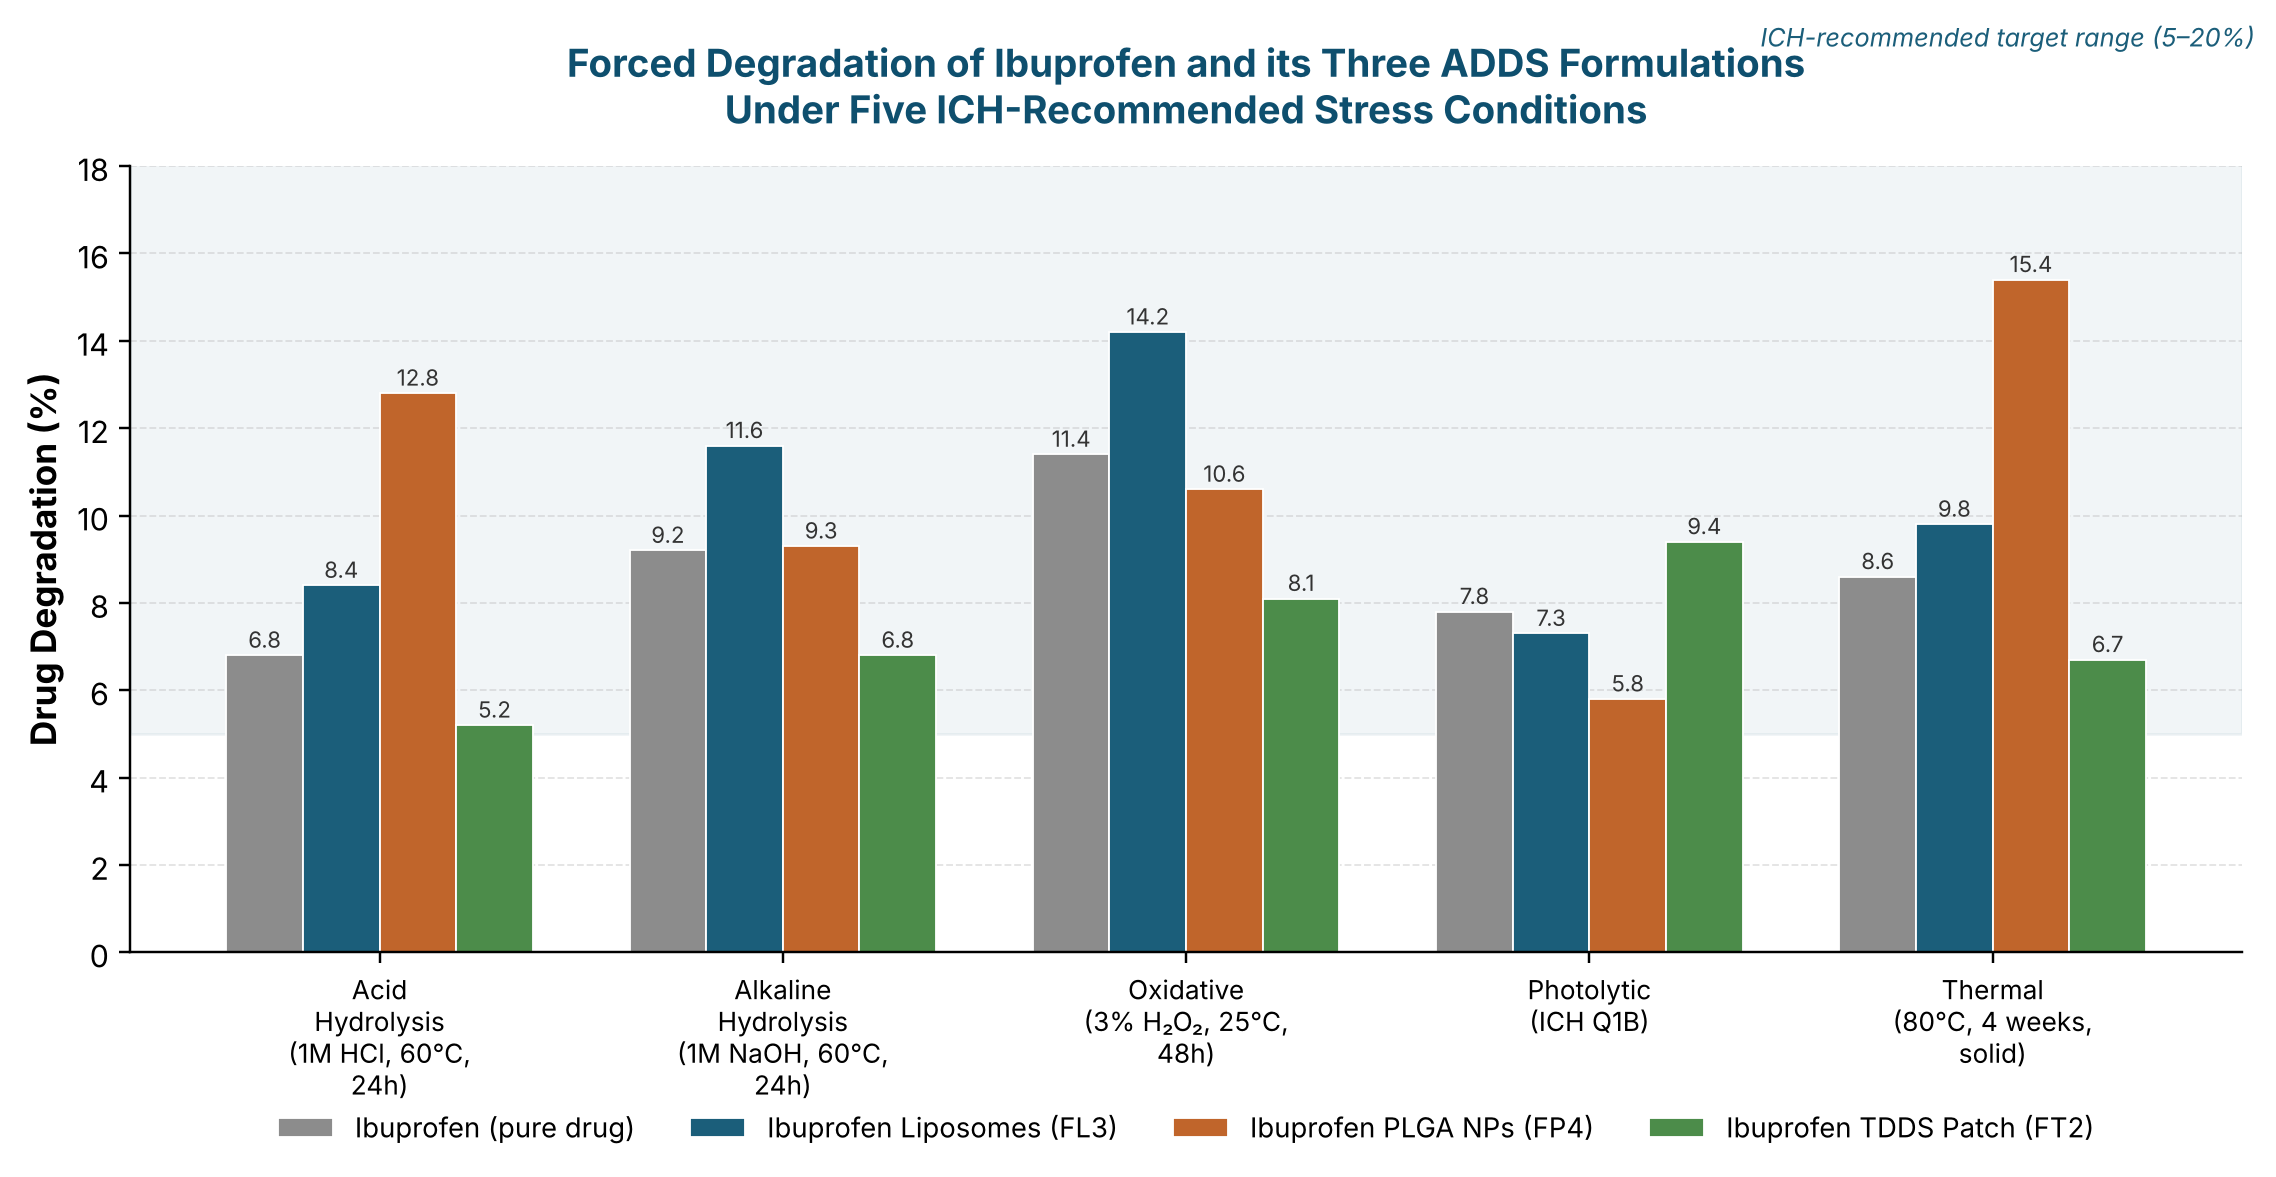
Five major degradation products were identified by LC-MS/MS — hydroxy-ibuprofen (m/z 221), ibuprofen aldehyde (m/z 203), ibuprofen hydroperoxide (m/z 237), a UV-induced photo-dimer (m/z 411) and isobutyrophenone (m/z 163) — consistent with previously reported ibuprofen degradation pathways [13,29,30]. Mass balance across all stressed samples ranged from 95.9–97.8% (Table 2), within the ICH-acceptable 95–105% range, confirming that the RP-HPLC method captured essentially all significant degradation products without unaccounted loss [11,13].
| Stress Condition | Pure Drug | Liposomes | PLGA NPs | Patch | Major Degradant (LC-MS/MS) |
|---|---|---|---|---|---|
| Acid Hydrolysis (1 M HCl, 60 °C, 24 h) | 6.8% | 8.4% | 12.8% | 5.2% | Hydroxy-ibuprofen (m/z 221) |
| Alkaline Hydrolysis (1 M NaOH, 60 °C, 24 h) | 9.2% | 11.6% | 9.3% | 6.8% | Ibuprofen aldehyde (m/z 203) |
| Oxidative (3% H₂O₂, 25 °C, 48 h) | 11.4% | 14.2% | 10.6% | 8.1% | Ibuprofen hydroperoxide (m/z 237) |
| Photolytic (ICH Q1B) | 7.8% | 7.3% | 5.8% | 9.4% | Photo-dimer (m/z 411) |
| Thermal (80 °C, 4 weeks, solid) | 8.6% | 9.8% | 15.4% | 6.7% | Isobutyrophenone (m/z 163) |
| Mass Balance (Average, %) | 97.8 | 96.4 | 95.9 | 97.1 | Within acceptance (95–105%) |
Specificity of the developed RP-HPLC method was unambiguously demonstrated: blank mobile phase, placebo matrices and all five stressed-sample sets showed baseline resolution (Rs ≥ 2.0) between ibuprofen and its nearest degradant, with photodiode-array peak-purity angles below threshold in every case, confirming that no co-eluting impurity interfered with drug quantification [10,14].
3.3RP-HPLC method validation
Full ICH Q2(R2) validation confirmed the developed method's suitability as a stability-indicating assay (Table 3). The method was linear over 5–200 μg/mL (y = 9690.4x + 1248.6; r² = 0.99999), with recovery of 99.4–100.1% at 80/100/120% levels and repeatability/intermediate-precision %RSD of 0.43% and 0.78%, respectively — both comfortably within the ≤ 2.0% acceptance limit [36,39]. LOD and LOQ, calculated by the signal-to-noise approach, were 0.24 and 0.71 μg/mL, meeting ICH Q3B(R2) reporting-threshold sensitivity requirements [37]. Robustness testing (Plackett–Burman design varying pH, %acetonitrile, flow rate and column temperature) produced a worst-case %RSD of 1.14%, with theoretical plates remaining above 2,000 and resolution above 2.0 throughout, confirming the method's tolerance to small, deliberate variations in operating conditions [3,4]. Collectively, these results establish the method as a single, validated SIAM applicable across all three structurally dissimilar ADDS matrices — addressing the matrix-interference limitation previously identified as a key gap in ADDS quality control [9,15,30].
| Validation Parameter | Result | Acceptance Criterion | Status |
|---|---|---|---|
| Linearity Range | 5–200 μg/mL | — | Established |
| Regression Equation / r² | y = 9690.4x + 1248.6; r² = 0.99999 | r² ≥ 0.999 | PASS |
| Accuracy — 80 / 100 / 120% Levels | 99.4 ± 0.6 / 100.1 ± 0.5 / 99.8 ± 0.7% | 98.0–102.0% | PASS |
| Repeatability (%RSD, n = 6) | 0.43% | ≤ 2.0% | PASS |
| Intermediate Precision (%RSD, n = 18) | 0.78% | ≤ 2.0% | PASS |
| LOD | 0.24 μg/mL | S/N ≥ 3 | PASS |
| LOQ | 0.71 μg/mL | S/N ≥ 10 | PASS |
| Robustness (worst-case %RSD) | 1.14% | ≤ 2.0% | PASS |
| Specificity | Demonstrated (5 stress conditions) | No interference | PASS |
3.4Stability studies and shelf-life prediction
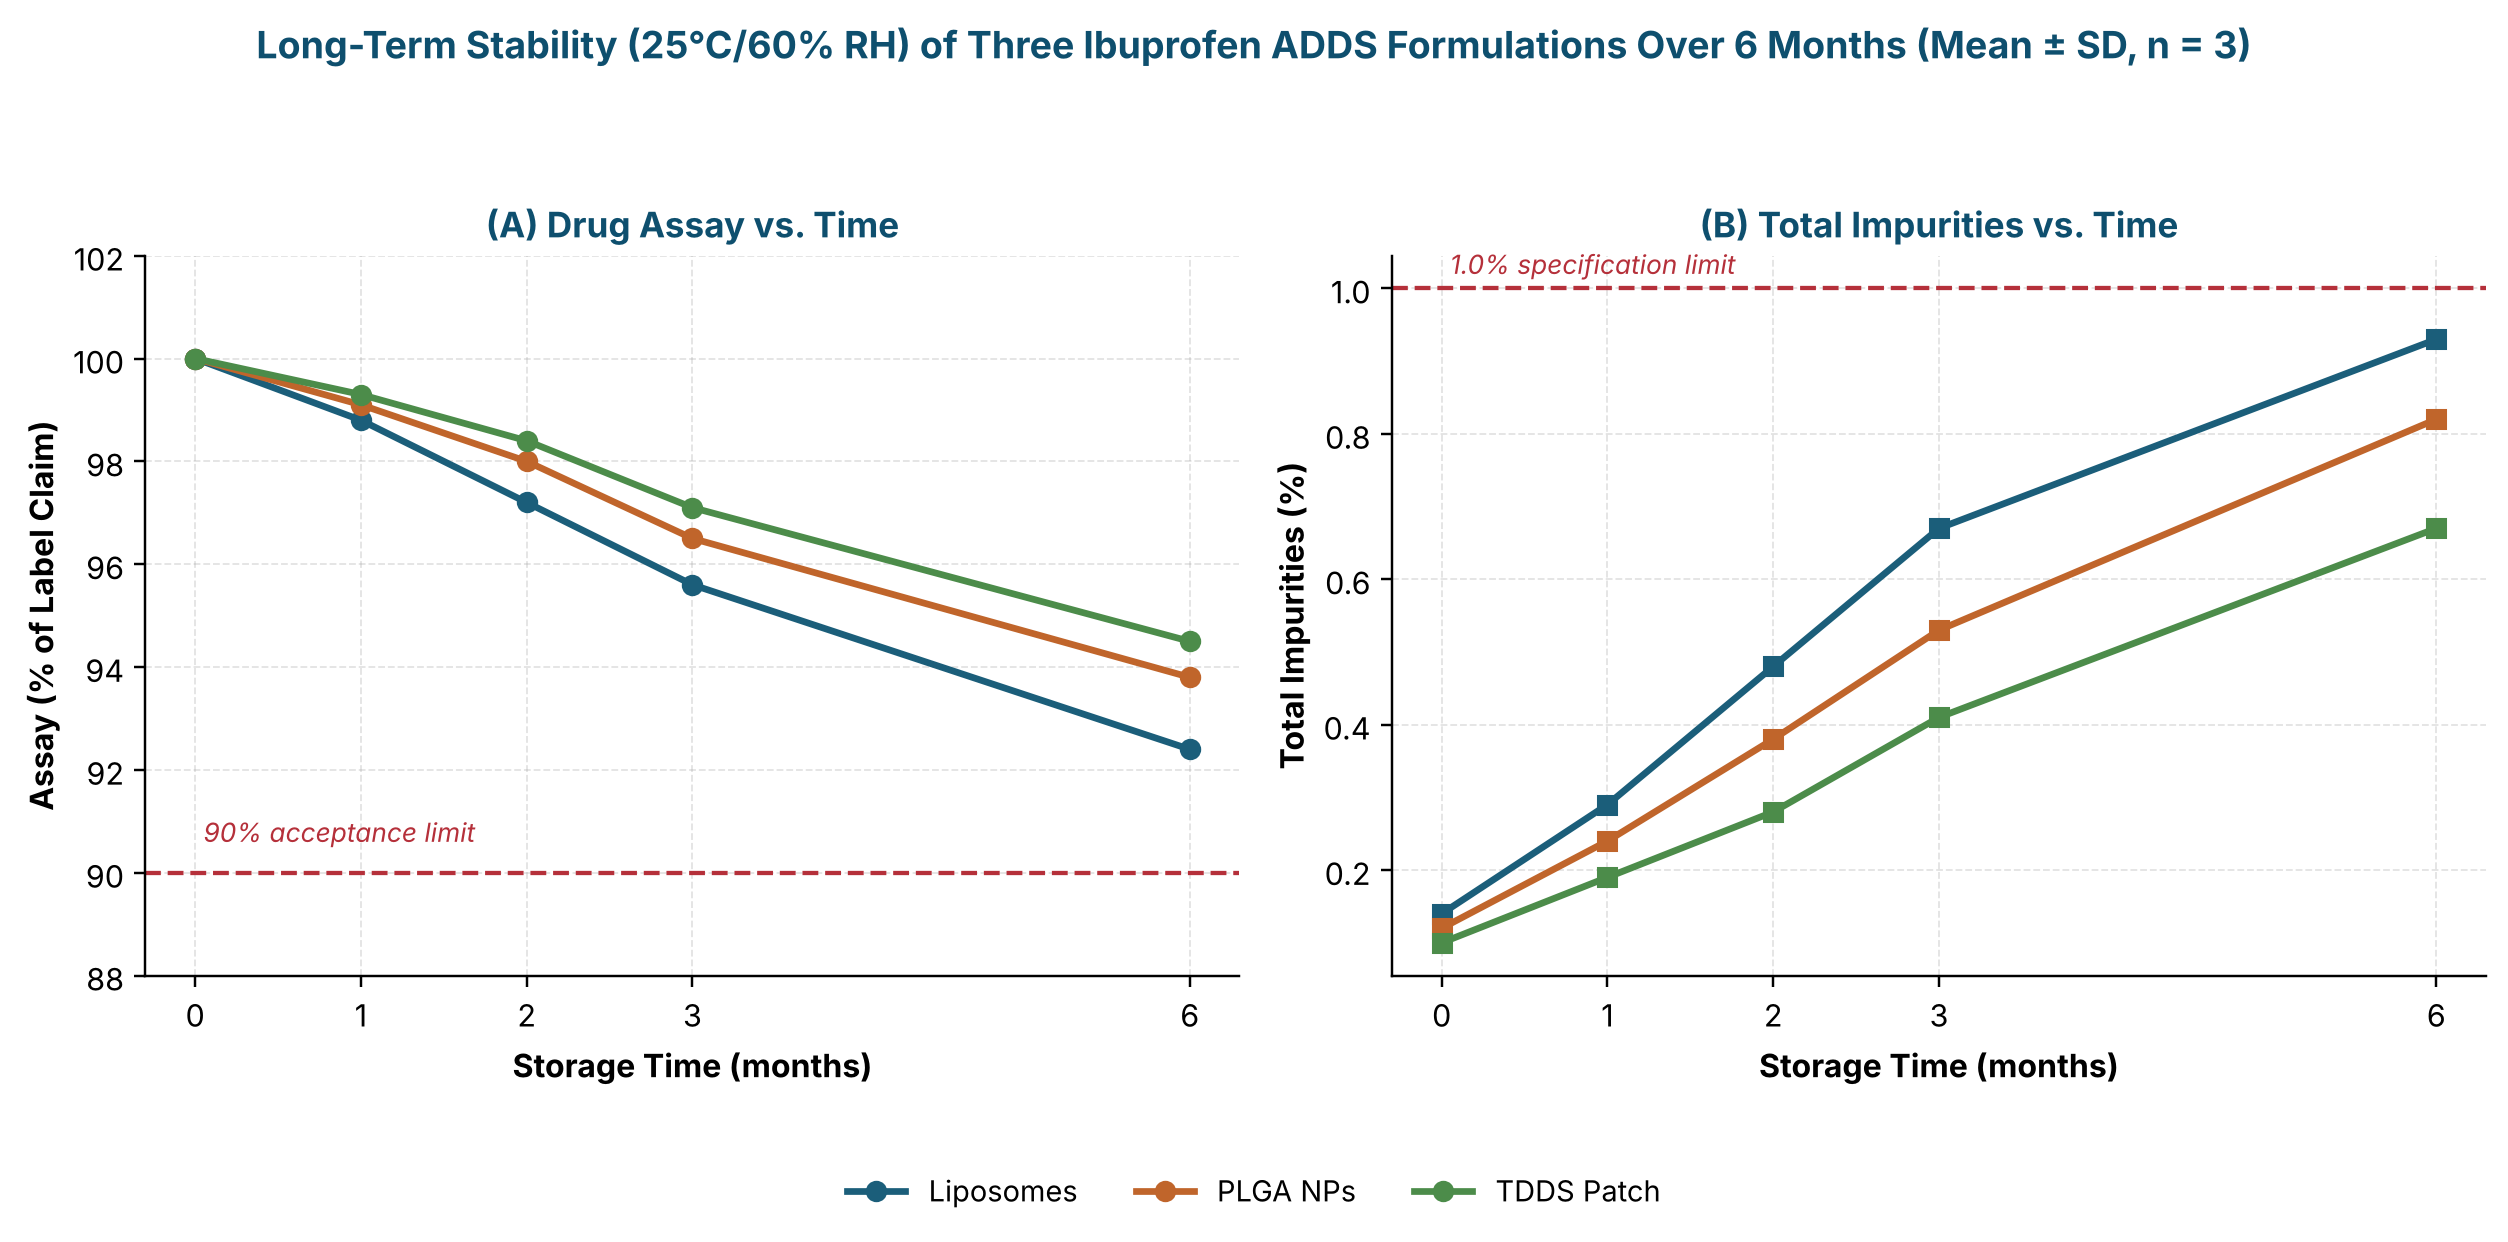
Under long-term storage (25 °C/60% RH), all three ADDS maintained assay above the 90% acceptance limit through 6 months, with liposomes declining to 92.4 ± 1.1%, PLGA nanoparticles to 93.8 ± 1.0%, and the patch — the most stable platform — to 94.5 ± 0.9% (Figure 2, panel A). Total impurities rose correspondingly but remained below the 1.0% specification limit throughout (Figure 2, panel B), with liposomes again showing the fastest increase (0.93 ± 0.10% at 6 months), mirroring their greater susceptibility to oxidative and hydrolytic stress observed during forced-degradation testing. Degradation at both storage temperatures followed first-order kinetics (r² = 0.985–0.990), and Arrhenius analysis of the accelerated (40 °C/75% RH) data yielded activation energies of 74.2–82.4 kJ/mol, with the patch showing the highest Ea and therefore the greatest intrinsic thermal stability [17]. Predicted shelf lives (t₉₀) were 27.4 months for liposomes, 33.8 months for PLGA nanoparticles and 38.6 months for the transdermal patch — all exceeding the 24-month target routinely sought for commercial ADDS products [16,40,41].
3.5Correlation of chemical and physical stability
A principal contribution of this work was the statistical linkage of chemical degradation to physical CQA drift. Strong inverse correlations were observed between assay and particle size (r = −0.961 for liposomes, −0.943 for PLGA nanoparticles; p < 0.001) and strong positive correlations between assay and encapsulation efficiency (r = +0.988 and +0.971, respectively; p < 0.001), while total impurities correlated positively with particle size (r = +0.958/+0.938) and negatively with zeta-potential magnitude (r = −0.927/−0.918) (all p < 0.001). These associations are mechanistically coherent: as ibuprofen degrades, loss of the stabilising drug–carrier interaction and generation of surface-active degradation products promote particle aggregation and a reduction in surface-charge magnitude, while progressive drug efflux from the carrier is mirrored by declining encapsulation efficiency [18,24,32]. This chemo-physical correlation framework indicates that routine monitoring of particle size and zeta potential — simpler, faster measurements than full chromatographic assay — could serve as a rapid orthogonal indicator of ADDS chemical stability during in-process and shelf-life monitoring, complementing rather than replacing the validated RP-HPLC SIAM for formal release and stability testing [3,38].
4Conclusion
This study successfully developed and fully validated, per ICH Q2(R2), a single stability-indicating RP-HPLC method capable of specifically resolving ibuprofen from five structurally distinct forced-degradation products across three mechanistically different ADDS platforms — liposomes, PLGA nanoparticles and a transdermal patch. The method demonstrated excellent linearity, accuracy, precision and sensitivity, and its specificity and robustness were confirmed under ICH-recommended stress conditions. Six-month long-term and accelerated stability studies, interpreted through first-order degradation kinetics and Arrhenius modelling, predicted shelf lives of 27–39 months for the three formulations, all compliant with the ≥ 90% assay acceptance criterion. The novel statistical correlation established between chemical stability indicators and physical CQAs (particle size, zeta potential, encapsulation efficiency) offers a practical, integrated chemo-physical quality-assurance framework that extends beyond ibuprofen and may be adapted to accelerate the analytical and regulatory development of other advanced drug delivery systems.
References
- [1]Soppimath KS, Aminabhavi TM, Kulkarni AR, Rangarajan A. Biodegradable polymeric nanoparticles as drug delivery devices. J Control Release. 2001;70(1–2):1–20.
- [2]Fessi H, Puisieux F, Devissaguet JP, Ammoury N, Benita S. Nanocapsule formation by interfacial polymer deposition following solvent displacement. Int J Pharm. 1989;55(1):R1–R4.
- [3]Peraman R, Bhadraya K, Padmanabha Reddy Y. Analytical quality by design: a tool for regulatory flexibility and robust analytics. Int J Anal Chem. 2015;2015:868727.
- [4]Klick S, Muijselaar PG, Waterval J, Eichinger T, Korn C, Gerding TK, et al. Towards a generic approach for stress testing of drug substances and drug products. Pharm Technol. 2005;29(2):48–66.
- [5]Singh C, Rao K, Yadav N, Bansal N, Vashist Y, Kumari S, Chugh P. A review: drug–excipient incompatibility by FTIR spectroscopy. Curr Pharm Anal. 2023;19(5):371–378.
- [6]Akbarzadeh A, Rezaei-Sadabady R, Davaran S, Joo SW, Zarghami N, Hanifehpour Y, et al. Liposome: classification, preparation, and applications. Nanoscale Res Lett. 2013;8(1):102.
- [7]Maeda H, Wu J, Sawa T, Matsumura Y, Hori K. Tumor vascular permeability and the EPR effect in macromolecular therapeutics: a review. J Control Release. 2000;65(1–2):271–284.
- [8]Costa P, Sousa Lobo JM. Modeling and comparison of dissolution profiles. Eur J Pharm Sci. 2001;13(2):123–133.
- [9]Torchilin VP. Recent advances with liposomes as pharmaceutical carriers. Nat Rev Drug Discov. 2005;4(2):145–160.
- [10]Bakshi M, Singh S. Development of validated stability-indicating assay methods — critical review. J Pharm Biomed Anal. 2002;28(6):1011–1040.
- [11]Blessy M, Patel RD, Prajapati PN, Agrawal YK. Development of forced degradation and stability indicating studies of drugs — a review. J Pharm Anal. 2014;4(3):159–165.
- [12]Jain RA. The manufacturing techniques of various drug loaded biodegradable poly(lactide-co-glycolide) (PLGA) devices. Biomaterials. 2000;21(23):2475–2490.
- [13]Alsante KM, Ando A, Brown R, Ensing J, Hatajik TD, Kong W, Tsuda Y. The role of degradant profiling in active pharmaceutical ingredients and drug products. Adv Drug Deliv Rev. 2007;59(1):29–37.
- [14]Reynolds DW, Facchine KL, Mullaney JF, Alsante KM, Hatajik TD, Motto MG. Available guidance and best practices for conducting forced degradation studies. Pharm Technol. 2002;26(2):48–56.
- [15]Singh S, Bakshi M. Guidance on the conduct of stress tests to determine inherent stability of drugs. Pharm Technol. 2000;24(4):1–14.
- [16]Grimm W. Extension of the International Conference on Harmonization Tripartite Guideline for stability testing to climatic zones III and IV. Drug Dev Ind Pharm. 1998;24(4):313–325.
- [17]Waterman KC, Adami RC. Accelerated aging: prediction of chemical stability of pharmaceuticals. Int J Pharm. 2005;293(1–2):101–125.
- [18]Danaei M, Dehghankhold M, Ataei S, Hasanzadeh Davarani F, Javanmard R, Dokhani A, et al. Impact of particle size and polydispersity index on the clinical applications of lipidic nanocarrier systems. Pharmaceutics. 2018;10(2):57.
- [19]Prausnitz MR, Langer R. Transdermal drug delivery. Nat Biotechnol. 2008;26(11):1261–1268.
- [20]Alexander A, Dwivedi S, Ajazuddin, Giri TK, Saraf S, Saraf S, Tripathi DK. Approaches for breaking the barriers of drug permeation through transdermal drug delivery. J Control Release. 2012;164(1):26–40.
- [21]Danhier F, Ansorena E, Silva JM, Coco R, Le Breton A, Préat V. PLGA-based nanoparticles: an overview of biomedical applications. J Control Release. 2012;161(2):505–522.
- [22]Clas SD, Dalton CR, Hancock BC. Differential scanning calorimetry: applications in drug development. Pharm Sci Technol Today. 1999;2(8):311–320.
- [23]Giron D. Thermal analysis and calorimetric methods in the characterisation of polymorphs and solvates. Thermochim Acta. 1995;248:1–59.
- [24]Allen TM, Cullis PR. Liposomal drug delivery systems: from concept to clinical applications. Adv Drug Deliv Rev. 2013;65(1):36–48.
- [25]Bozzuto G, Molinari A. Liposomes as nanomedical devices. Int J Nanomedicine. 2015;10:975–999.
- [26]Rizvi SAA, Saleh AM. Applications of nanoparticle systems in drug delivery technology. Saudi Pharm J. 2018;26(1):64–70.
- [27]Patra JK, Das G, Fraceto LF, Campos EVR, Rodriguez-Torres MDP, Acosta-Torres LS, et al. Nano based drug delivery systems: recent developments and future prospects. J Nanobiotechnology. 2018;16(1):71.
- [28]Potthast H, Dressman JB, Junginger HE, Midha KK, Oeser H, Shah VP, et al. Biowaiver monographs for immediate release solid oral dosage forms: ibuprofen. J Pharm Sci. 2005;94(10):2121–2131.
- [29]Holčapek M, Jirásko R, Lísa M. Recent developments in liquid chromatography–mass spectrometry and related techniques. J Chromatogr A. 2012;1259:3–15.
- [30]Singh S, Junwal M, Modhe G, Tiwari H, Kurmi M, Parashar N, Sidduri P. Forced degradation studies to assess the stability of drugs and drug products. TrAC Trends Anal Chem. 2013;49:71–88.
- [31]Mehnert W, Mäder K. Solid lipid nanoparticles: production, characterization and applications. Adv Drug Deliv Rev. 2001;47(2–3):165–196.
- [32]Bhattacharjee S. DLS and zeta potential — what they are and what they are not. J Control Release. 2016;235:337–351.
- [33]Mura S, Nicolas J, Couvreur P. Stimuli-responsive nanocarriers for drug delivery. Nat Mater. 2013;12(11):991–1003.
- [34]International Council for Harmonisation. ICH Q1A(R2): Stability Testing of New Drug Substances and Products. ICH; 2003.
- [35]International Council for Harmonisation. ICH Q1B: Photostability Testing of New Drug Substances and Products. ICH; 1996.
- [36]International Council for Harmonisation. ICH Q2(R2): Validation of Analytical Procedures. ICH; 2022.
- [37]International Council for Harmonisation. ICH Q3B(R2): Impurities in New Drug Products. ICH; 2006.
- [38]International Council for Harmonisation. ICH Q8(R2): Pharmaceutical Development. ICH; 2009.
- [39]US Food and Drug Administration. Analytical Procedures and Methods Validation for Drugs and Biologics: Guidance for Industry. Silver Spring (MD): CDER; 2015.
- [40]World Health Organization. Stability Testing of Active Pharmaceutical Ingredients and Finished Pharmaceutical Products. WHO Technical Report Series No. 953, Annex 2. Geneva: WHO; 2009.
- [41]European Medicines Agency. Guideline on Stability Testing for Applications for Variations to a Marketing Authorisation. CPMP/QWP/576/96 Rev 1. London: EMA.