Pharmacy
Assessment of Paracetamol Toxicity in the Presence of Sugar in Rats
Faculty of Pharmacy, Integral University, Lucknow, Uttar Pradesh, India
Published October 2026
Abstract
Paracetamol (PCM)–induced hepatotoxicity is a major cause of drug-related liver injury, while the role of dietary sugar in modulating this toxicity remains unclear. This study evaluated the dose-dependent effect of sugar on PCM-induced liver damage in rats. Hepatotoxicity was induced using paracetamol, followed by co-administration of sugar at 50% and 100% concentrations. Liver injury was assessed using body and relative liver weight, serum biochemical markers (ALT, AST, ALP), oxidative stress parameters, and histopathology. Paracetamol significantly increased relative liver weight (7.50 ± 0.35%) compared to normal controls (4.80 ± 0.20%) and elevated ALT (140.0 ± 4.5 U/L), AST (155.0 ± 6.4 U/L), and ALP (260.0 ± 8.0 U/L) levels (p < 0.001). Lipid peroxidation increased markedly, with MDA levels rising to 3.80 ± 0.25 nmol/mg protein versus 1.20 ± 0.15 nmol/mg protein in controls, alongside reduced antioxidant enzymes. Co-administration of 50% sugar partially attenuated PCM-induced toxicity, whereas 100% sugar aggravated oxidative stress (MDA: 4.50 ± 0.30 nmol/mg protein) and liver damage. These findings suggest that moderate sugar intake may offer limited hepatoprotection, while excessive sugar worsens PCM-induced liver injury.
Keywords: paracetamol; hepatotoxicity; sugar; oxidative stress
1Introduction
The liver is a vital metabolic organ responsible for maintaining systemic homeostasis through its roles in nutrient metabolism, detoxification, protein synthesis, immune regulation, and bile production. Owing to its central involvement in drug metabolism, the liver is particularly vulnerable to toxic insults, making drug-induced liver injury a major clinical concern. Among commonly used drugs, paracetamol (acetaminophen, PCM) is one of the leading causes of acute liver failure worldwide, especially following overdose.
Paracetamol-induced hepatotoxicity is primarily mediated through its bioactivation to the reactive metabolite N-acetyl-p-benzoquinone imine (NAPQI), which depletes intracellular glutathione (GSH), induces oxidative stress, disrupts mitochondrial function, and triggers inflammatory responses, ultimately leading to hepatocyte necrosis. Despite the availability of N-acetylcysteine as an antidote, dietary and metabolic factors are increasingly recognized as important modifiers of PCM toxicity.
Sugar consumption is an integral part of modern diets and plays a crucial role in hepatic glucose metabolism and energy homeostasis. Glucose availability can influence glutathione synthesis, insulin signaling, oxidative stress, and hepatic enzyme activity. While moderate glucose intake may support hepatic detoxification by replenishing energy and antioxidant reserves, excessive sugar consumption has been linked to insulin resistance, oxidative stress, fatty liver disease, and altered drug metabolism.
Emerging evidence suggests that dietary sugar may interact with PCM metabolism by modulating hepatic pathways involved in glucuronidation, oxidative stress, and inflammatory signaling. However, the extent to which different concentrations of sugar influence PCM-induced hepatotoxicity remains poorly understood. Therefore, investigating the dose-dependent effects of sugar on PCM-induced liver injury is essential for understanding diet–drug interactions and improving clinical and nutritional recommendations.
Although paracetamol-induced hepatotoxicity has been widely investigated, important research gaps still remain. Most existing studies primarily focus on pharmacological or therapeutic interventions, while the role of dietary factors, particularly sugar, in modulating paracetamol-induced liver toxicity has received limited attention. Moreover, the available literature presents conflicting findings regarding whether sugar exerts protective or harmful effects on hepatic oxidative stress and detoxification pathways. There is also a lack of systematic, dose-dependent experimental studies evaluating the impact of varying sugar concentrations on paracetamol-induced hepatotoxicity. Additionally, comprehensive investigations integrating biochemical liver markers, oxidative stress parameters, and histopathological changes under combined sugar and paracetamol exposure are insufficient. Mechanistic insights explaining how sugar-mediated metabolic alterations influence antioxidant defenses and liver architecture during paracetamol toxicity are also poorly understood. These gaps underscore the necessity for a systematic evaluation of the dose-dependent influence of sugar on paracetamol-induced liver injury.
The present study aimed to evaluate the dose-dependent effect of sugar on paracetamol-induced hepatotoxicity in experimental animals. The objectives of this study were to induce hepatotoxicity in experimental animals using paracetamol and to evaluate the effect of different concentrations of sugar on body weight and relative liver weight in paracetamol-treated animals. The study also aimed to assess liver function by estimating serum biochemical markers such as alanine aminotransferase (ALT), aspartate aminotransferase (AST), and alkaline phosphatase (ALP). Furthermore, oxidative stress was evaluated by measuring lipid peroxidation (MDA) and antioxidant parameters including reduced glutathione (GSH), superoxide dismutase (SOD), and catalase. Histopathological alterations in liver tissue following paracetamol and sugar co-administration were examined, and the study sought to determine whether moderate or high sugar intake attenuates or exacerbates paracetamol-induced liver damage.
2Materials and methods
2.1Experimental animals
Male Sprague-Dawley rats, weighing between 140–180 g, were sourced from the Central Animal Facility, CSIR-CDRI, Lucknow. Prior to the initiation of experiments, the animals were acclimatized for seven days under controlled laboratory conditions. They were housed in polypropylene cages, with no more than five rats per cage, to ensure adequate space and minimize stress. All procedures were carried out in the Departmental Animal Facility, Faculty of Pharmacy, Integral University, Lucknow. The housing environment was maintained at a constant temperature of , with relative humidity between 50–60%, and a 12-hour light/dark cycle. Throughout the study, the animals had free access to a standard pellet diet and water ad libitum.
2.2Experimental design
A total of twenty male Sprague-Dawley rats (Rattus norvegicus) were randomly divided into four groups, with five animals in each group. The study was conducted over a 14-day period. Baseline body weights of all rats were recorded prior to the initiation of treatment. The treatment regimens assigned to each group are summarized in Table 1.
| S. No. | Group (n = 5) | Treatment, dose, route and duration |
|---|---|---|
| 1 | Normal Control | Normal saline (0.9% NaCl), 1 mL/rat, administered orally once daily for 14 days, along with a standard diet. |
| 2 | Toxic Control I | Paracetamol at 640 mg/kg body weight (p.o.), dissolved in normal saline, administered once daily for 14 days. |
| 3 | Test Group I (Toxic Control II) | Paracetamol at 640 mg/kg body weight (p.o.), dissolved in 50% sugar solution, administered once daily for 14 days. |
| 4 | Test Group II (Toxic Control III) | Paracetamol at 640 mg/kg body weight (p.o.), dissolved in 100% sugar solution, administered once daily for 14 days. |
Throughout the experimental period, the rats were monitored daily for behavioral changes, signs of toxicity, or mortality. Body weights were recorded weekly, and final weights were measured on Day 14. On the last day of treatment, animals were anesthetized with ketamine hydrochloride (100 mg/kg, intraperitoneally). Blood samples were collected, followed by euthanasia, and liver tissues were harvested for subsequent biochemical and histopathological analyses.
2.3Serum and liver tissue homogenate preparation
Approximately 4–5 mL of blood was collected from each rat and transferred into plain collection tubes. The samples were left undisturbed at room temperature for 30 minutes to allow clot formation, followed by centrifugation at 3000 rpm for 10 minutes. The separated serum was carefully aspirated and stored for subsequent biochemical analyses. Simultaneously, liver tissues were excised, rinsed thoroughly with ice-cold phosphate-buffered saline (PBS), blotted dry, and weighed. A 10% (w/v) homogenate was prepared in PBS (25 mM, pH 7.4) using a tissue homogenizer. The homogenates were centrifuged at 1700 rpm for 10 minutes, and the resulting supernatant was preserved at −20 °C until further biochemical evaluation. For histopathological examination, a portion of the liver was fixed in 10% neutral buffered formalin.
2.4Parameters assessed
2.4.1Physical parameters
Body weights were recorded prior to euthanasia. After sacrifice under anesthesia, livers were excised, rinsed with cold saline, and blotted dry. The relative liver weight was calculated as described by Höring et al. (2021):
2.4.2Gross examination
Excised livers were visually inspected for changes in color, texture, and morphology to detect any gross pathological alterations.
2.4.3Biochemical parameters (serum)
Serum levels of alanine transaminase (ALT), aspartate aminotransferase (AST), and alkaline phosphatase (ALP) were measured using commercial diagnostic kits (Span Diagnostic Ltd., Surat, India) on a Shimadzu UV spectrophotometer, following manufacturer protocols.
2.4.4Alanine aminotransferase (ALT/SGPT)
ALT (also known as SGPT) is a key enzyme in amino acid metabolism, primarily localized in the liver. Elevated serum ALT levels serve as a sensitive biomarker of hepatocellular injury. Alanine aminotransferase (ALT) catalyzes the reversible transamination reaction between L-alanine and α-ketoglutarate, producing pyruvate and L-glutamate. The pyruvate formed is subsequently reduced to lactate by the action of lactate dehydrogenase (LDH), accompanied by the oxidation of reduced nicotinamide adenine dinucleotide (NADH) to NAD⁺.
The rate of decrease in NADH concentration is directly proportional to ALT activity and is monitored kinetically by measuring the decline in absorbance at 340 nm. During the initial incubation phase, endogenous pyruvate present in the serum sample is rapidly reduced by LDH, thereby eliminating interference and ensuring assay specificity.
The working reagent was prepared freshly by mixing Reagent 2 with Reagent 1 in a ratio of 1:4 (i.e., 1 mL of Reagent 2 added to 4 mL of Reagent 1). The mixture was gently homogenized before use. Serum or plasma (100 µL) was pipetted into a test tube labeled as “test.” To this, 1000 µL of the working reagent was added. The contents were mixed thoroughly, and the mixture was immediately aspirated into the analyser for kinetic measurement.
The analyzer was calibrated using purified distilled water as a blank. Absorbance measurements were recorded at 340 nm, beginning after an initial delay of 60 seconds, and subsequently monitored at 30-second intervals up to 120 seconds. From these kinetic readings, the mean change in absorbance per minute (ΔA/min) was calculated to determine the reaction rate. ALT activity was calculated using the following equation:
where the kinetic factor (F) is defined as:
in which M is the molar extinction coefficient of NADH at 340 nm (6.22 × 10³ L·mol⁻¹·cm⁻¹), TV the total reaction volume (sample volume + reagent volume), SV the sample volume, P the optical path length (cm) and 10⁶ the conversion factor for expressing enzyme activity in U/L.
2.4.5Aspartate aminotransferase (AST/SGOT)
Aspartate aminotransferase (AST) catalyzes the reversible transfer of an amino group from L-aspartate to α-ketoglutarate, resulting in the formation of oxaloacetate and L-glutamate. The oxaloacetate produced is subsequently reduced to L-malate by the enzyme malate dehydrogenase (MDH), with the simultaneous oxidation of reduced nicotinamide adenine dinucleotide (NADH) to NAD⁺.The rate of oxidation of NADH is directly proportional to AST activity and is monitored kinetically by measuring the decrease in absorbance at 340 nm. To eliminate potential interference from endogenous pyruvate present in serum samples, lactate dehydrogenase (LDH) is included in the reagent system.
The working AST reagent was freshly prepared by mixing Reagent 2 with Reagent 1 in a ratio of 1:4 (i.e., 1 mL of Reagent 2 added to 4 mL of Reagent 1). The solution was mixed gently and used immediately for analysis.
Serum or plasma sample (100 µL) was pipetted into a test tube labeled “Test.” Subsequently, 1000 µL of the working AST reagent was added. The contents were mixed thoroughly and immediately aspirated into the analyzer for kinetic measurement. The analyser was calibrated using purified distilled water as a blank. Absorbance readings were then recorded at 340 nm, beginning after an initial delay of 60 seconds and subsequently measured at 30‑second intervals up to 120 seconds. From these kinetic measurements, the mean change in absorbance per minute (ΔA/min) was calculated to determine the reaction rate. AST activity was calculated using the following equation:
where ΔA/min is the mean change in absorbance per minute and K is the kinetic factor (1746), as specified by the reagent manufacturer, derived from:
with M, TV, SV, P and 10⁶ as defined for Equation (3).
2.4.6Alkaline phosphatase (ALP)
Alkaline phosphatase (ALP) catalyses the hydrolysis of p-nitrophenyl phosphate (pNPP) in an alkaline medium in the presence of magnesium ions (Mg²⁺) and diethanolamine, which acts as a phosphate acceptor. This enzymatic reaction results in the formation of inorganic phosphate and p-nitrophenol. Under alkaline conditions, p-nitrophenol is converted to its yellow-colored ionized form, the intensity of which is directly proportional to ALP activity. The rate of formation of p-nitrophenol is measured kinetically by monitoring the increase in absorbance at 405 nm using a UV–Visible spectrophotometer.
ALP activity was determined using either a one-reagent or a two-reagent kinetic method. In the one-reagent method, 1000 µL of working reagent and 20 µL of serum or plasma were mixed thoroughly; after an initial delay of 60 seconds, the change in absorbance was recorded at 405 nm every minute for 3 minutes, and the mean change in absorbance per minute (ΔA/min) was calculated. In the two-reagent method, 800 µL of Reagent 1 and 200 µL of Reagent 2 were mixed and incubated for 25 seconds; 20 µL of serum or plasma was then added and mixed thoroughly, and after an initial delay of 60 seconds absorbance was read at 405 nm at one-minute intervals for 3 minutes to obtain the mean ΔA/min. ALP activity was calculated using the following equation:
where ΔA/min is the mean change in absorbance per minute and K is the kinetic factor (2712), as specified by the reagent manufacturer.
2.4.7Total bilirubin
Total bilirubin levels were determined using the Roche Cobas C111 automated chemistry analyzer based on the diazo reaction principle. In this method, bilirubin reacts with a diazo reagent in a strongly acidic medium (pH 1–2) in the presence of a solubilizing agent to form azobilirubin, a colored compound. The intensity of the color formed is directly proportional to the total bilirubin concentration and is measured photometrically. All measurements were performed strictly according to the manufacturer’s instructions, and results were expressed as mg/dL.
2.4.8Antioxidant parameters (liver tissue)
Lipid peroxidation was assessed by estimating malondialdehyde (MDA), a well-established marker of oxidative membrane damage, following a standard thiobarbituric acid reactive substances (TBARS) protocol (Ohkawa et al., 1979). Briefly, 0.2 mL of liver tissue homogenate was mixed with 0.2 mL of 8.1% sodium dodecyl sulfate, 1.5 mL of 20% acetic acid, and 1.5 mL of 8% thiobarbituric acid. Subsequently, 4 mL of distilled water was added, and the mixture was heated at 95 °C for 60 minutes. After cooling to room temperature, the final volume was adjusted to 5 mL. A butanol–pyridine mixture (15:1, v/v) was added, followed by vortexing for 2 minutes. The mixture was centrifuged at 3000 rpm for 10 minutes, and the organic layer was collected. Absorbance was measured at 532 nm using a spectrophotometer against a reagent blank. MDA levels were expressed as nanomoles of TBARS per milligram of protein.
Reduced glutathione (GSH) content in liver tissue was estimated using the method described by Sedlak and Lindsay. Liver homogenate was treated with 10% trichloroacetic acid and centrifuged to precipitate proteins. An aliquot (0.1 mL) of the resulting supernatant was mixed with 2 mL of phosphate buffer (pH 8.4), 0.5 mL of 5,5′-dithiobis-(2-nitrobenzoic acid) (DTNB), and 0.4 mL of double-distilled water. The mixture was vortexed, and absorbance was recorded at 412 nm within 15 minutes using a Shimadzu UV PC-1600 spectrophotometer (Japan). GSH levels were expressed as nanomoles per milligram of protein.
Superoxide dismutase (SOD) activity was measured according to the method described by Nandi and Chatterjee. The reaction mixture consisted of 2.860 mL of Tris buffer (50 mM, pH 8.5), 0.1 mL of EDTA solution, 0.02 mL of liver homogenate, and 0.02–0.08 mL of pyrogallol. The rate of autoxidation of pyrogallol was monitored by measuring the increase in absorbance at 420 nm using a Shimadzu UV PC-1600 spectrophotometer, with an appropriate blank. SOD activity was expressed as units per milligram of protein.
Catalase activity was determined using hydrogen peroxide as the substrate, following the method of Aebi (1984). Briefly, 0.1 mL of liver homogenate was added to 1.9 mL of phosphate-buffered saline (PBS, pH 7.0) in a 3 mL quartz cuvette. The reaction was initiated by the addition of 1 mL of 30 mM hydrogen peroxide. The decomposition of hydrogen peroxide was monitored by recording the decrease in absorbance at 240 nm using a Shimadzu UV–Visible spectrophotometer. Catalase activity was expressed as units per milligram of protein.
2.5Histopathological examination of liver tissue
Liver samples were fixed in 10% neutral buffered formalin for histopathological evaluation. The fixed tissues were processed routinely, embedded in paraffin wax, and sectioned at a thickness of 5 µm using a rotary microtome (HM 325, Thermo Scientific, UK). The sections were stained with hematoxylin and eosin (H&E) and examined under an Olympus DP 72 light microscope (Tokyo, Japan) for histoarchitectural alterations.
2.6Statistical analysis
All experimental data were expressed as mean ± standard error of the mean (SEM). Statistical analysis was performed using SPSS software (version 20.0, IBM Corporation, New York, USA) and Microsoft Excel 2013 (Redmond, WA, USA). Group comparisons were conducted using one-way analysis of variance (ANOVA), followed by post hoc tests including Dunnett’s and Tukey’s multiple comparison tests. Additional statistical analysis and graphical representations were performed using GraphPad Prism software (version 6.0). A p-value of <0.05 was considered statistically significant, while p <0.001 was considered highly significant.
3Results and discussion
3.1Effects of paracetamol in combination with sugar on body weight and relative liver weight
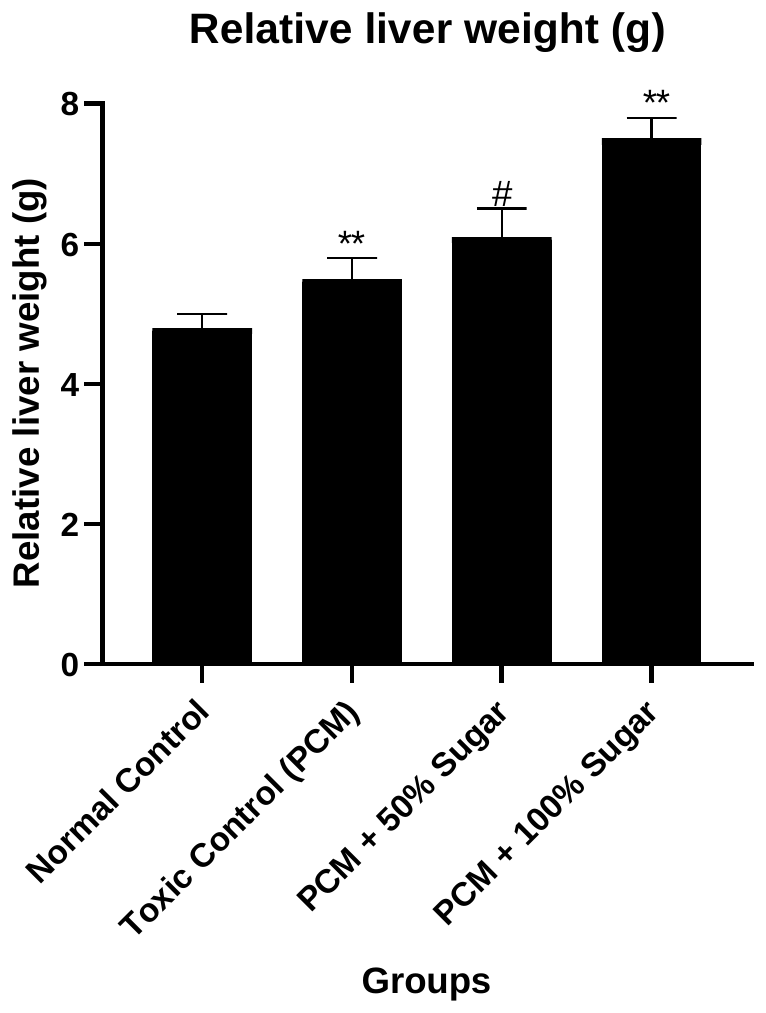
After 14 days of treatment, no significant changes in body weight were observed in the normal control group (p > 0.05). In contrast, rats treated with paracetamol (PCM) showed a reduction in final body weight compared to the normal control group, indicating paracetamol-induced systemic toxicity. Relative liver weight was significantly increased in the PCM-treated group compared to the normal control group (p < 0.01), suggesting hepatic enlargement associated with liver injury. Co-administration of sugar along with PCM resulted in a dose-dependent modulation of body weight and relative liver weight. Rats receiving PCM with 50% sugar exhibited body weight changes comparable to the normal control group, while relative liver weight showed a reduction compared to the PCM group. Notably, administration of 100% sugar along with PCM produced a significant decrease in relative liver weight compared to the PCM-treated group (p < 0.05), indicating an attenuation of PCM-induced hepatomegaly. Overall, sugar supplementation modulated PCM-induced alterations in body weight and relative liver weight in a dose-dependent manner, with higher sugar concentration showing a more pronounced protective effect against paracetamol-induced liver enlargement (Table 2; Figure 1).
| Group | Initial weight (g) | Final weight (g) | Weight gain/loss (g) | Relative liver weight (g) |
|---|---|---|---|---|
| Normal Control | 150 ± 5.2 | 155 ± 4.9 | 5.0 ± 0.5 | 4.8 ± 0.2 |
| Toxic Control (PCM) | 153 ± 4.8 | 150 ± 3.9 | −3.0 ± 0.6 | 5.5 ± 0.3** |
| PCM + 50% Sugar | 151 ± 5.5 | 147 ± 6.0 | −4.0 ± 0.5 | 6.1 ± 0.4# |
| PCM + 100% Sugar | 152 ± 6.3 | 145 ± 5.7 | −7.0 ± 1.1 | 7.5 ± 0.3# |
Values are expressed as mean ± SEM (n = 6). One-way ANOVA followed by Dunnett’s and Tukey’s multiple comparison tests. **p < 0.001 vs. normal control; #p < 0.05 vs. PCM group.
3.2Effects of paracetamol in combination with sugar on liver enzymes
Administration of paracetamol (PCM) resulted in a marked elevation of serum liver enzymes compared to the normal control group, indicating significant hepatocellular damage. The PCM-treated group showed a significant increase in alanine aminotransferase (ALT), aspartate aminotransferase (AST), and alkaline phosphatase (ALP) activities when compared with the normal control group (p < 0.001). Co-administration of sugar along with PCM further influenced serum enzyme levels. Rats treated with PCM in combination with 50% sugar exhibited slightly higher levels of ALT, AST, and ALP compared to the PCM-alone group. Similarly, treatment with 100% sugar along with PCM produced a further increase in these enzyme levels. The elevation in enzyme activities followed a dose-dependent trend with increasing sugar concentration (Table 3; Figure 2).
| Group | ALT (U/L) | AST (U/L) | ALP (U/L) |
|---|---|---|---|
| Normal Control | 35.0 ± 2.1 | 45.0 ± 3.0 | 120.0 ± 5.0 |
| Toxic Control (PCM) | 140.0 ± 4.5 | 155.0 ± 6.4 | 260.0 ± 8.0 |
| PCM + 50% Sugar | 145.0 ± 4.6 | 160.0 ± 6.8 | 280.0 ± 9.0 |
| PCM + 100% Sugar | 150.0 ± 5.8 | 165.0 ± 7.2 | 290.0 ± 10.0 |
Values are expressed as mean ± SEM (n = 6). One-way ANOVA followed by Dunnett’s and Tukey’s multiple comparison tests. p < 0.001 compared to normal control; #p < 0.05 compared to PCM group.
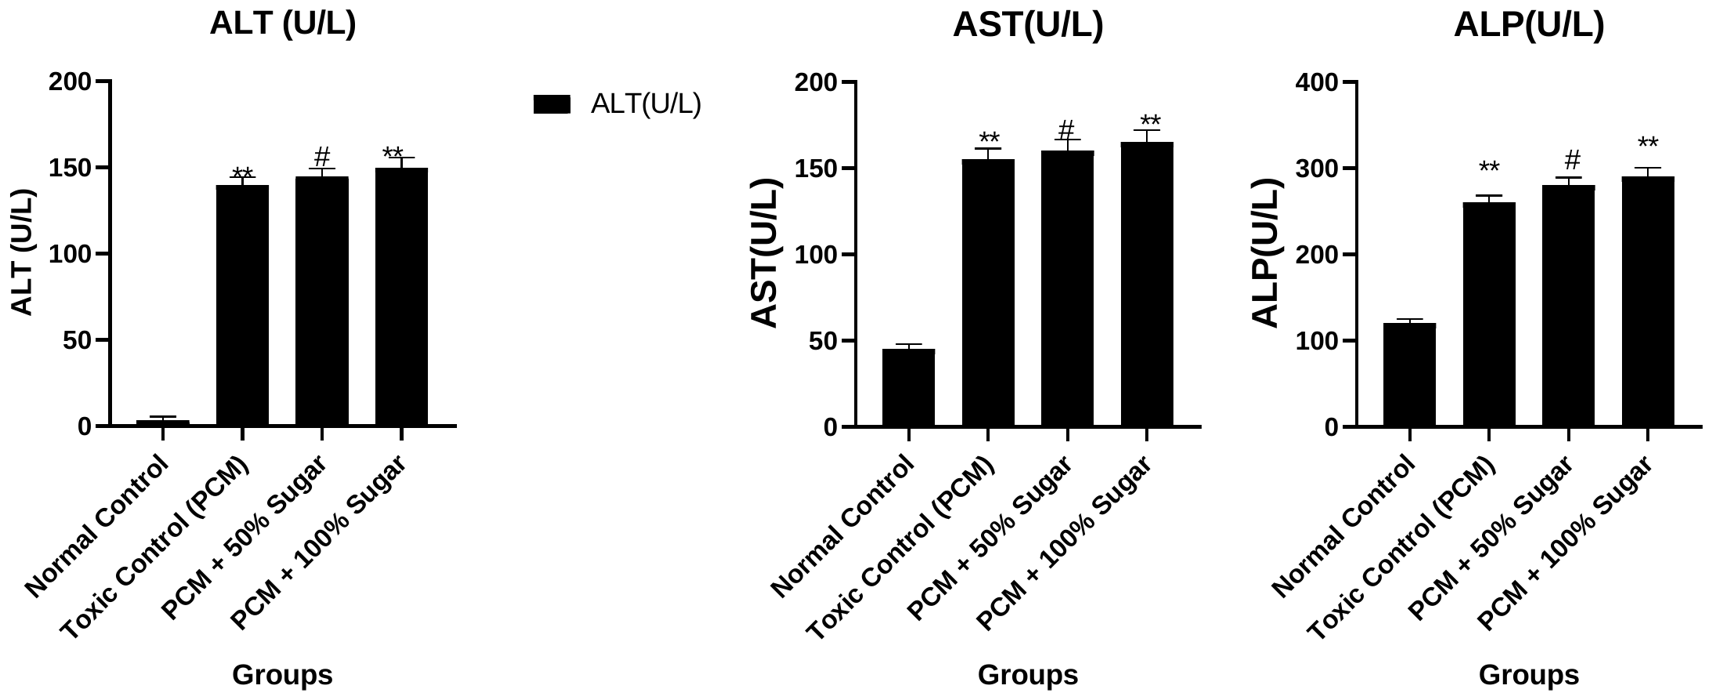
Paracetamol (PCM) administration caused significant hepatotoxicity, as evidenced by increased relative liver weight and marked elevations in serum ALT, AST, and ALP levels compared to the normal control group. Co-administration of sugar at 50% concentration slightly reduced relative liver weight; however, liver enzyme levels remained markedly elevated, indicating persistent hepatocellular damage. In the 100% sugar group, despite a further reduction in relative liver weight, ALT, AST, and ALP activities remained high, suggesting ongoing liver stress. Overall, sugar supplementation failed to normalize biochemical markers of liver injury, and higher sugar concentration appeared to exacerbate PCM-induced hepatotoxicity rather than providing hepatoprotection.
3.3Effects on oxidative stress parameters
3.3.1Lipid peroxidation
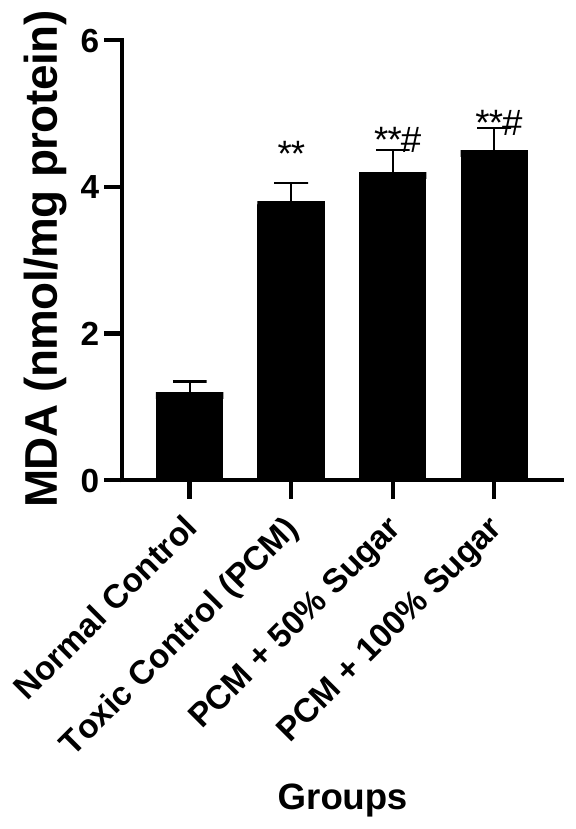
Lipid peroxidation in liver tissue was assessed by measuring malondialdehyde (MDA) levels. Compared with the normal control group, MDA levels were significantly increased in all treated groups, including the paracetamol (PCM), PCM + 50% sugar, and PCM + 100% sugar groups (p < 0.001).
Furthermore, co-administration of sugar with PCM resulted in a significant additional increase in MDA levels in both the 50% and 100% sugar-treated groups compared to the PCM-alone group (p < 0.05), indicating enhanced lipid peroxidation (Table 4; Figure 3).
| Group | MDA (nmol/mg protein) |
|---|---|
| Normal Control | 1.20 ± 0.15 |
| Toxic Control (PCM) | 3.80 ± 0.25** |
| PCM + 50% Sugar | 4.20 ± 0.30**,# |
| PCM + 100% Sugar | 4.50 ± 0.30**,# |
Values are expressed as mean ± SEM (n = 6). One-way ANOVA followed by Dunnett’s and Tukey’s tests. **p < 0.001 vs. normal control; #p < 0.05 vs. PCM group.
3.3.2Reduced glutathione, superoxide dismutase and catalase
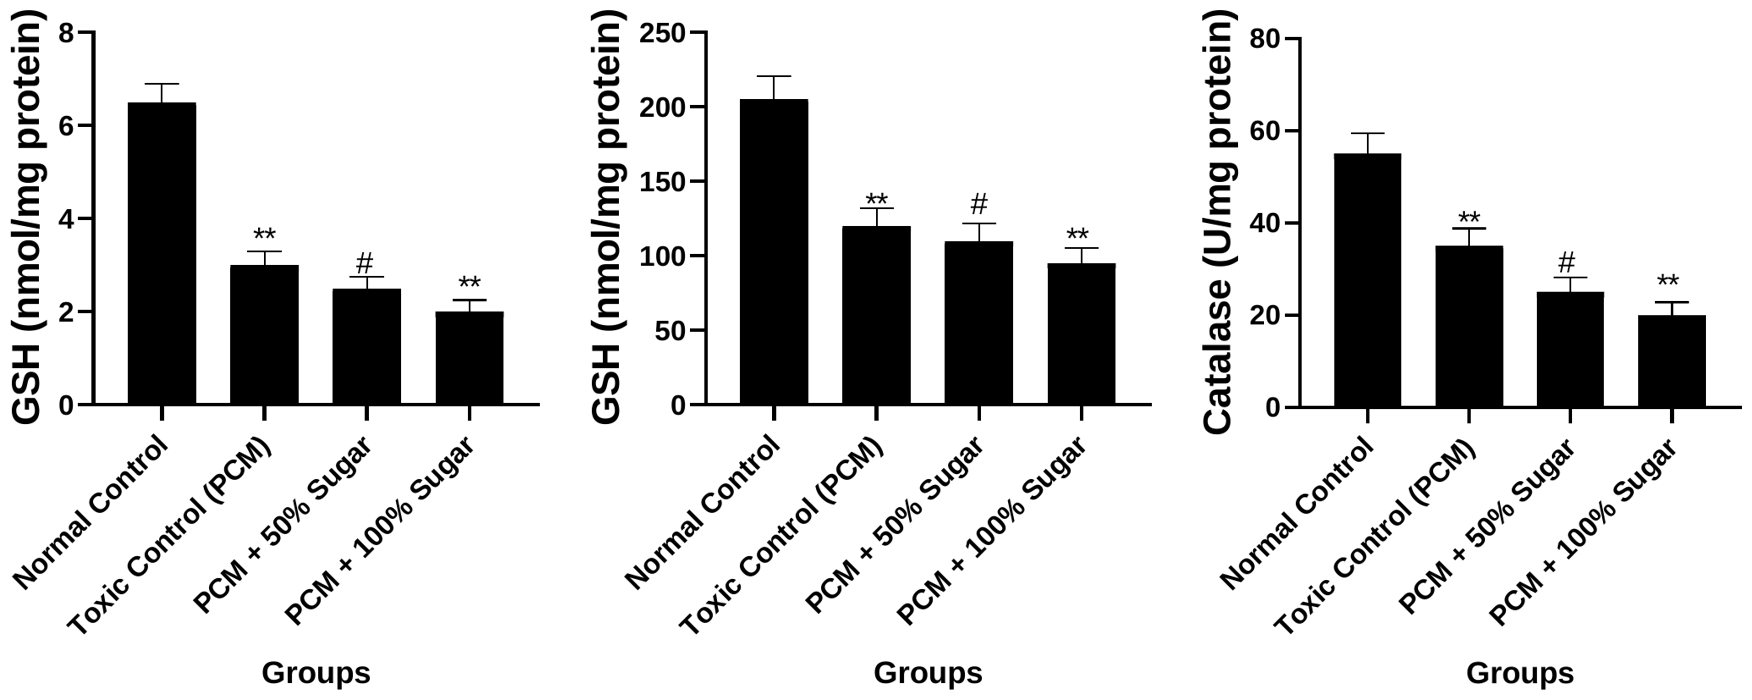
The effects of paracetamol (PCM) and sugar co-administration on antioxidant parameters in liver tissue are presented in Table 5. Compared to the normal control group, hepatic levels of reduced glutathione (GSH), superoxide dismutase (SOD), and catalase were significantly decreased in all treated groups, including PCM, PCM + 50% sugar, and PCM + 100% sugar groups (p < 0.001).
Furthermore, co-administration of sugar with PCM resulted in a further significant reduction in GSH, SOD, and catalase activities in both the 50% and 100% sugar-treated groups compared to the PCM-alone group (p < 0.05). The decrease in antioxidant enzyme levels was more pronounced at the higher sugar concentration (Table 5; Figure 4).
| Group | GSH (nmol/mg protein) | SOD (U/mg protein) | Catalase (U/mg protein) |
|---|---|---|---|
| Normal Control | 6.50 ± 0.40 | 205.0 ± 15.5 | 55.0 ± 4.5 |
| Toxic Control (PCM) | 3.00 ± 0.30** | 120.0 ± 12.0** | 35.0 ± 3.8** |
| PCM + 50% Sugar | 2.50 ± 0.25**,# | 110.0 ± 11.5**,# | 25.0 ± 3.2**,# |
| PCM + 100% Sugar | 2.00 ± 0.25**,# | 95.0 ± 10.2**,# | 20.0 ± 2.8**,# |
Values are expressed as mean ± SEM (n = 6). One-way ANOVA followed by Dunnett’s and Tukey’s tests. **p < 0.001 vs. normal control; #p < 0.05 vs. PCM group.
3.4Histopathological evaluation of liver
Histopathological examination of liver sections from the vehicle control group showed normal hepatic architecture with well-arranged hepatocytes, intact sinusoidal spaces, and centrally located nuclei, indicating no pathological alterations. In contrast, the paracetamol (PCM)-treated group exhibited marked hepatic damage characterized by extensive coagulative necrosis, prominent hemorrhage, and inflammatory cell infiltration, predominantly in the centrilobular and midzonal regions, while periportal areas remained relatively spared. The liver sections are shown in Figure 5.
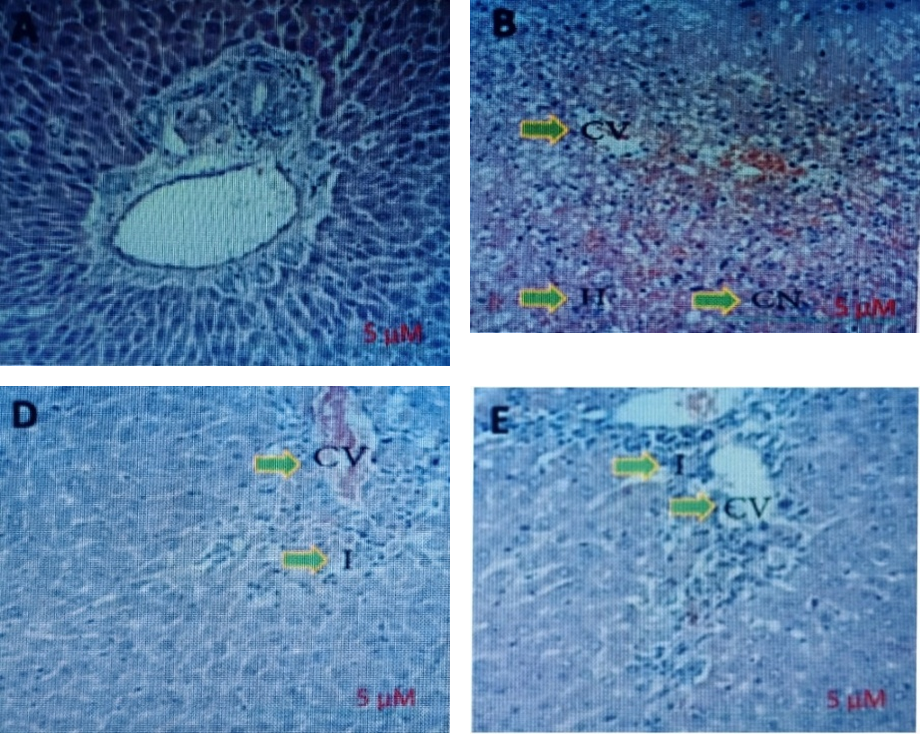
These findings confirm severe paracetamol-induced hepatotoxicity. Liver sections from the PCM + 50 mg/kg sugar group showed mild to moderate hepatic injury, with focal coagulative necrosis and lobular inflammation. Although the severity of damage was reduced compared to the PCM group, the normal lobular architecture was not fully restored. In the PCM + 100 mg/kg sugar group, liver sections exhibited near-normal architecture with mild inflammatory changes and occasional residual necrosis. However, complete recovery was not observed, indicating persistent hepatic stress. Overall, histopathological findings demonstrate that paracetamol induces significant liver damage, particularly in centrilobular regions, and co-administration of sugar does not provide complete hepatoprotection, with residual necrosis and inflammation evident even at higher sugar doses.
4Conclusion
The present study evaluated the influence of different concentrations of sugar on paracetamol (PCM)-induced hepatotoxicity in rats by assessing body weight changes, liver enzyme levels, oxidative stress markers, and histopathological alterations. The results demonstrate that the effect of sugar on PCM-induced liver injury is dose dependent. Moderate sugar supplementation (50%) showed partial protective effects against PCM-induced hepatotoxicity, as evidenced by comparatively lower liver enzyme levels, reduced oxidative stress, and mild histological improvement in liver architecture. In contrast, high sugar supplementation (100%) failed to confer hepatoprotection and, in several parameters, exacerbated liver injury, oxidative stress, and tissue damage. Overall, these findings suggest that while moderate sugar intake may exert limited hepatoprotective effects, excessive sugar consumption can aggravate PCM-induced liver toxicity. Therefore, careful regulation of dietary sugar intake may be important during exposure to hepatotoxic drugs such as paracetamol. Further studies are warranted to clarify the underlying mechanisms and to define safe thresholds of sugar consumption in the context of drug-induced liver injury.
References
- [1]Aebi H (1984). Catalase in vitro. Methods in Enzymology, 105, 121–126.
- [2]Arifin M et al. (2026). Fructose diet–induced liver injury through oxidative stress: A systematic review of preclinical studies. Journal of Nutrition and Metabolism, 2026, 1644860.
- [3]Baharuddin B (2024). The impact of fructose consumption on human health: Effects on obesity, hyperglycemia, diabetes, uric acid, and oxidative stress with a focus on the liver. Cureus, 16(9), e70095.
- [4]Bancroft JD, Gamble M (2008). Theory and practice of histological techniques (6th ed.). Churchill Livingstone/Elsevier.
- [5]Basciano H, Federico L, Adeli K (2005). Fructose, insulin resistance, and metabolic dyslipidemia. Nutrition & Metabolism, 2, 5.
- [6]Chiu S, Sievenpiper JL, de Souza RJ, Cozma AI, Mirrahimi A, Carleton AJ, Ha V, Di Buono M, Jenkins AL, Leiter LA, Wolever TMS, Don-Wauchope AC, Beyene J, Kendall CWC, Jenkins DJA (2014). Effect of fructose on markers of non-alcoholic fatty liver disease (NAFLD): A systematic review and meta-analysis of controlled feeding trials. European Journal of Clinical Nutrition, 68(4), 416–423.
- [7]Ellman GL (1959). Tissue sulfhydryl groups. Archives of Biochemistry and Biophysics, 82(1), 70–77.
- [8]Federico A, Rosato V, Masarone M, Torre P, Dallio M, Romeo M, Persico M (2021). The role of fructose in non-alcoholic steatohepatitis: Old relationship and new insights. Nutrients, 13(4), 1314.
- [9]James LP, Mayeux PR, Hinson JA (2003). Acetaminophen-induced hepatotoxicity. Drug Metabolism and Disposition, 31(12), 1499–1506.
- [10]Jegatheesan P, De Bandt JP (2017). Fructose and NAFLD: The multifaceted aspects of fructose metabolism. Nutrients, 9(3), 230.
- [11]Jollow DJ, Mitchell JR, Potter WZ, Davis DC, Gillette JR, Brodie BB (1973). Acetaminophen-induced hepatic necrosis. II. Role of covalent binding in vivo. Journal of Pharmacology and Experimental Therapeutics, 187(1), 195–202.
- [12]Kakkar P, Das B, Viswanathan PN (1984). A modified spectrophotometric assay of superoxide dismutase. Indian Journal of Biochemistry and Biophysics, 21(2), 130–132.
- [13]Kind PRN, King EJ (1954). Estimation of plasma phosphatase by determination of hydrolysed phenol with amino-antipyrine. Journal of Clinical Pathology, 7(4), 322–326.
- [14]Larson AM, Polson J, Fontana RJ, Davern TJ, Lalani E, Hynan LS, Reisch JS, Schiødt FV, Ostapowicz G, Shakil AO, Lee WM (2005). Acetaminophen-induced acute liver failure: Results of a United States multicenter, prospective study. Hepatology, 42(6), 1364–1372.
- [15]Lodge M, Dykes R, Kennedy A (2024). Regulation of fructose metabolism in nonalcoholic fatty liver disease. Biomolecules, 14(7), 845.
- [16]Lowry OH, Rosebrough NJ, Farr AL, Randall RJ (1951). Protein measurement with the Folin phenol reagent. Journal of Biological Chemistry, 193(1), 265–275.
- [17]Mahmood ND, Mamat SS, Kamisan FH, Yahya F, Kamarolzaman MFF, Nasir N, Mohtarrudin N, Md Tohid SF, Zakaria ZA (2014). Amelioration of paracetamol-induced hepatotoxicity in rat by the administration of methanol extract of Muntingia calabura L. leaves. BioMed Research International, 2014, 695678.
- [18]Mai BH, Yan LJ (2019). The negative and detrimental effects of high fructose on the liver, with special reference to metabolic disorders. Diabetes, Metabolic Syndrome and Obesity, 12, 821–826.
- [19]Mitchell JR, Jollow DJ, Potter WZ, Gillette JR, Brodie BB (1973). Acetaminophen-induced hepatic necrosis. IV. Protective role of glutathione. Journal of Pharmacology and Experimental Therapeutics, 187(1), 211–217.
- [20]Muriel P, López-Sánchez P, Ramos-Tovar E (2021). Fructose and the liver. International Journal of Molecular Sciences, 22(13), 6969.
- [21]Ohkawa H, Ohishi N, Yagi K (1979). Assay for lipid peroxides in animal tissues by thiobarbituric acid reaction. Analytical Biochemistry, 95(2), 351–358.
- [22]Organisation for Economic Co-operation and Development (OECD) (2001). Test No. 423: Acute oral toxicity – Acute toxic class method. OECD Guidelines for the Testing of Chemicals, Section 4. OECD Publishing.
- [23]Ramachandran A, Jaeschke H (2017). Mechanisms of acetaminophen hepatotoxicity and their translation to the human pathophysiology. Journal of Clinical and Translational Research, 3(Suppl 1), 157–169.
- [24]Ramachandran R, Kakar S (2009). Histological patterns in drug-induced liver disease. Journal of Clinical Pathology, 62(6), 481–492.
- [25]Reitman S, Frankel S (1957). A colorimetric method for the determination of serum glutamic oxalacetic and glutamic pyruvic transaminases. American Journal of Clinical Pathology, 28(1), 56–63.
- [26]Rumack BH, Matthew H (1975). Acetaminophen poisoning and toxicity. Pediatrics, 55(6), 871–876.
- [27]Senthilkumar R, Chandran R, Parimelazhagan T (2014). Hepatoprotective effect of Rhodiola imbricata rhizome against paracetamol-induced liver toxicity in rats. Saudi Journal of Biological Sciences, 21(5), 409–416.
- [28]World Health Organization (WHO) (2015). Guideline: Sugars intake for adults and children. WHO Press.
- [29]Yahya F, Mamat SS, Kamarolzaman MFF, Seyedan AA, Jakius KF, Mahmood ND, Shahril MS, Suhaili Z, Mohtarrudin N, Susanti D, Somchit MN, Teh LK, Salleh MZ, Zakaria ZA (2013). Hepatoprotective activity of methanolic extract of Bauhinia purpurea leaves against paracetamol-induced hepatic damage in rats. Evidence-Based Complementary and Alternative Medicine, 2013, 636580.
- [30]Yan M, Huo Y, Yin S, Hu H (2018). Mechanisms of acetaminophen-induced liver injury and its implications for therapeutic interventions. Redox Biology, 17, 274–283.
- [31]Yu ZZ, Varahala S, Lim SLC, Marenah MC, Wattacheril J (2025). The impact of high fructose corn syrup on liver injury and glucose metabolism: A systematic review. Frontiers in Nutrition, 12, 1724398.
- [32]Zakaria ZA, Yahya F, Mamat SS, Mahmood ND, Mohtarrudin N, Taher M, Hamid SSA, Teh LK, Salleh MZ (2016). Hepatoprotective action of various partitions of methanol extract of Bauhinia purpurea leaves against paracetamol-induced liver toxicity: Involvement of the antioxidant mechanisms. BMC Complementary and Alternative Medicine, 16, 175.