Research Article
Economic Evaluation of Unconventional Tight Oil Resource
Rivers State University, Port Harcourt, Nigeria
Published October 2026
Abstract
The Wolfcamp field, a significant tight oil play in the Permian Basin, exhibits a matrix permeability of approximately 0.0005 mD. In this research, hydraulic fracturing modelling and simulation was conducted on a targeted area of this field using PROSPER (Production System Performance) and CMG (Computer Modelling Group) software, resulting in a permeability improvement to 1.57 mD. This enhancement contributed to an improvement of the oil recovery factor by approximately 2.2% and of the gas recovery factor by about 10%, significantly boosting production potential. A detailed economic evaluation was performed using key financial metrics. The net present value (NPV) was found to be approximately $26 million, a strong indicator of profitability. Furthermore, the internal rate of return (IRR) was calculated to be approximately 34%, which is well above typical industry hurdle rates. The payback period of 2 years, 9 months and 14 days further supports the feasibility of the project by indicating a relatively quick capital recovery. A short payback period is particularly beneficial in the volatile oil and gas market, reducing financial risk and improving cash flow stability. Unconventional oil development is highly uncertain; to address these uncertainties, an advanced stochastic economic analysis was performed using Python, which allowed a more comprehensive evaluation than traditional tools such as Excel. Unlike conventional methods, Python enables simultaneous multivariable interaction, capturing the complex relationships between key economic parameters and project outcomes. This study demonstrated that Python-based stochastic modelling provides a 10% improvement in uncertainty quantification compared with the conventional Excel spreadsheet, enhancing decision-making accuracy. Therefore, to enhance production and ensure investment reliability in tight oil developments, integration of stochastic economic analysis is necessary.
Keywords: unconventional tight oil; hydraulic fracturing; reservoir simulation; economic evaluation; production forecasting; net present value (NPV); stochastic analysis; Monte Carlo simulation; sensitivity analysis; economic uncertainty
1Introduction
The development of unconventional hydrocarbon resources has become increasingly important because their exploitation depends on specialized drilling, completion, stimulation, and reservoir-management technologies that differ substantially from those used in conventional reservoirs (Montgomery & Smith, 2010). Unconventional oil and gas resources are currently in commercial development around the world. In recent years, the production of unconventional oil and gas has increased continuously. In 2015, the annual production of unconventional oil amounted to 3.7 × 10⁸ tons, accounting for 9% of the global annual production of oil, and the annual production of unconventional gas was 9 273×108 m3, accounting for 27% of the global annual production of gas (Wang et al., 2016). Unconventional tight oil production has pushed the world’s final oil supply constraint into the future, removing for now concerns of immediate oil scarcity and its negative impacts on the world economy. There are many ways to classify resources and reserves and their different subgroups and conditions (Bentley et al., 2007). Implicitly these estimates include known resources, expected future discoveries and expected future economic conditions and technological development. Tight oil reservoirs are characterized by very low matrix permeability, which restricts the natural movement of hydrocarbons toward production wells and makes conventional primary depletion insufficient for achieving economically attractive production rates (Warpinski et al., 2009).
Hydraulic fracturing is therefore widely applied in low-permeability and unconventional reservoirs to create conductive fracture pathways through which reservoir fluids can flow toward the wellbore (Montgomery & Smith, 2010). The effectiveness of hydraulic fracturing depends strongly on fracture geometry, propagation behaviour, conductivity, and the interaction between the created fractures and the surrounding reservoir formation. Numerical modelling provides an important means of evaluating these fracture characteristics because hydraulic-fracture propagation involves coupled fluid-flow, rock-mechanical, and time-dependent processes that are difficult to assess using analytical calculations alone (Adachi et al., 2007). In unconventional reservoirs, achieving sufficient reservoir contact is particularly important because of the extremely low permeability of the formation. The design and optimization of hydraulic fractures must consequently take into account both fracture dimensions and reservoir properties. The control of fracture geometry is closely associated with hydraulic-fracturing performance and production improvement in tight-oil reservoirs (Temizel et al., 2016).
Technical performance alone, however, does not necessarily establish whether a hydraulic-fracturing project is economically viable. It is demonstrated through production and economic analysis of tight-oil fracturing operations that the high cost of stimulation makes economic evaluation an important part of comparing alternative completion and fracturing scenarios (Arguello-Marrufo et al., 2021).
Economic evaluation of unconventional resources must therefore connect production performance with appropriate financial indicators. Wang et al. (2016) proposed an economic assessment framework for unconventional oil and gas resources that considers economic indexes and evaluation criteria alongside the technical characteristics of unconventional-resource development.
Previous economic studies also indicate that an increase in hydrocarbon production does not automatically translate into an economically attractive project. Kerunwa et al. (2020), for instance, showed the importance of detailed economic analysis when assessing hydraulic fracturing as a means of improving hydrocarbon recovery, since the financial benefits of increased production must be evaluated against the associated stimulation costs.
Similarly, financial simulation studies have shown that several economic and fiscal variables can influence the outcome of petroleum-development projects. Petroleum profit tax, royalty, and crude-oil price had important effects on the net present value of the Nigerian marginal oil-field project they evaluated (Akinwale and Akinbami, 2016).
The economic assessment of tight-oil development is further complicated by uncertainty in both technical and external conditions. Factors such as geological conditions, technical performance, and policy uncertainty can influence the economic efficiency of tight-oil development, making uncertainty an important consideration in investment evaluation (Liu, 2020).
More recent work has continued to demonstrate the value of integrating hydraulic-fracturing design with production forecasting and economic analysis.
A comprehensive evaluation of unconventional tight-oil development should therefore consider the relationship between stimulation design, production performance, project expenditure, and economic outcome rather than treating these aspects independently. This type of integrated technical and economic assessment is particularly relevant to tight-oil projects, where alternative fracture designs can produce different production responses and corresponding financial outcomes (Arguello-Marrufo et al., 2021).
This integrated perspective is important because the substantial cost associated with drilling and hydraulic stimulation can increase the financial consequences of inaccurate production forecasts and inappropriate development decisions.
Accordingly, integrating hydraulic-fracturing simulation, reservoir-production forecasting, deterministic economic evaluation, and uncertainty analysis provides a more comprehensive basis for assessing the commercial potential of unconventional tight-oil resources. Recent technical-economic modelling, such as that presented by Darma et al. (2025), further demonstrates the usefulness of linking fracture design, production forecasting, and project economics when evaluating the feasibility of tight-oil development.
2Description of the Wolfcamp field
The Wolfcamp field is the study area in this research, it is situated within the Permian Basin of West Texas and southeastern New Mexico, stands as one of North America’s most prolific unconventional oil and gas reservoirs. This expansive sedimentary basin covers approximately 86,000 square miles, with the Wolfcamp primarily concentrated in the Midland Basin and Delaware Basin, two of its major sub-basins. Advancements in horizontal drilling and hydraulic fracturing have unlocked the economic potential of these low-permeability formations, leading to extensive exploration and development activities.
Deposited during the Late Pennsylvanian to Early Permian periods, the Wolfcamp Formation comprises a thick sequence of organic-rich shale, mudstone, siltstone, and carbonate layers, indicative of a deep marine depositional environment. The formation exhibits a high total organic carbon (TOC) content, typically ranging from 2% to 6%, contributing to its excellent source rock quality. Notably, the Wolfcamp is a self-sourced reservoir, wherein hydrocarbons generated within the formation remain trapped due to the low permeability of its rock layers, making it an ideal candidate for unconventional resource development.
A defining characteristic of the Wolfcamp Formation is its extreme heterogeneity in lithology and petrophysical properties. The formation’s thickness varies significantly, ranging from approximately 1,000 to over 2,500 feet, depending on the location within the basin. It consists of interbedded shale, organic-rich mudstone, silty carbonates, and fine-grained sandstones, each influencing reservoir quality and fluid flow behavior. Permeability is typically in the nano-Darcy (nD) range, often as low as 10⁻⁵ to 10⁻³ millidarcies (mD), necessitating hydraulic fracturing to enhance production. Porosity varies between 5% and 12%, with higher values associated with carbonate-rich intervals that may exhibit better natural fracturing.
The Wolfcamp Formation is divided into several benches, commonly referred to as Wolfcamp A, B, C, and D, each displaying distinct lithological and petrophysical characteristics. These subdivisions allow for targeted exploration and development strategies, optimizing hydrocarbon recovery from specific intervals within the formation.
Overpressure regimes within the Wolfcamp Formation, particularly in the Delaware Basin, play a significant role in its production potential. Formation pressures can exceed 0.6 to 0.8 psi/ft, enhancing hydrocarbon recovery by maintaining high fluid energy and supporting sustained production rates. The formation’s high clay content influences the effectiveness of hydraulic fracturing treatments; while excessive clay can reduce fracture conductivity, the presence of natural fractures and bedding planes aids in fluid migration, improving overall reservoir performance.
Fluid properties within the Wolfcamp Formation vary, producing a spectrum of hydrocarbons from volatile oil and condensate to wet gas and dry gas, depending on depth and thermal maturity. The formation transitions from an oil-prone window in shallower basin areas to a gas-prone window at greater depths, with API gravities for oil typically ranging from 35° to 50° API. The gas composition includes significant amounts of natural gas liquids (NGLs), enhancing economic viability.
2.1Targeted simulation area of the Wolfcamp field
The simulation focused on a specific targeted reservoir area within the Wolfcamp field, carefully selected based on its strategic importance for optimizing hydrocarbon extraction. This targeted approach ensures that the simulation outcomes are directly relevant to the most critical sections of the reservoir, where hydraulic fracturing can have the greatest impact on enhancing permeability and improving production.
The reservoir under study is a shale formation characterized by very low permeability, a common challenge in unconventional reservoirs. Shale formations are typically composed of fine-grained sedimentary rocks with extremely tight pore spaces, making it difficult for hydrocarbons to flow naturally. This inherent low permeability necessitates the use of hydraulic fracturing to create artificial fractures that serve as conduits for oil and gas to migrate towards the wellbore.
3Materials and methods
3.1Material
The data used in this hydraulic fracturing simulation was obtained from Kuuskraa et al. (2019), which describes the Wolfcamp field, a half site known for its challenging reservoir conditions. The field’s comprehensive dataset provided a robust foundation for the simulation, offering detailed insights into the geological, fluid and petrophysical characteristics of the subsurface, as shown in Table 1. The hydraulic simulation was carried out in PROSPER and CMG software while an Excel spreadsheet and Python were employed for the economic analysis.
| Parameters | Value | Unit |
|---|---|---|
| Porosity | 4.7 | % |
| Horizontal permeability | 0.0005 | mD |
| Vertical permeability | 0.00005 | mD |
| Reservoir pressure | 4256 | psi |
| Bubble point pressure | 2800 | psi |
| Temperature | 159 | oF |
| Reservoir depth | 8000 | ft |
| Reservoir thickness | 290 | ft |
| Oil saturation | 0.57 | % |
| Gas–oil ratio | 850 | scf/bbl |
| Rock compressibility | 0.000022 | /psi |
| Oil gravity | 39 | API |
| Water saturation | 42 | % |
| Gas gravity | 0.65 | – |
| Target reservoir length | 880 | ft |
| Target reservoir width | 500 | ft |
3.2Method
3.2.1Reservoir model development
The model's grid was configured with dimensions of (10x15x5ft) in the X, Y, and Z directions, respectively, resulting in a block size of (880x500x290ft) blocks. This grid design was chosen to ensure a comprehensive representation of the reservoir's spatial attributes, allowing for accurate simulations. Fluid properties were estimated using a Quick Fluid Model, which provides rapid calculations of key parameters such as viscosity and density. This model is beneficial for initial simulations due to its efficiency and effectiveness in approximating fluid behavior without demanding extensive computational resources.
A horizontal well was incorporated into the simulation (Figure 1), extending the full length of the target formation. This well orientation was selected based on its advantages in unconventional reservoirs like shales. Horizontal wells significantly increase the contact area with the reservoir compared to vertical wells, thereby enhancing the potential for hydraulic fracturing to improve reservoir permeability and hydrocarbon recovery. The length of the horizontal well matches the length of the target formation, ensuring that the wellbore intersects the entire productive zone, which maximizes the exposure to the fracturing treatment.
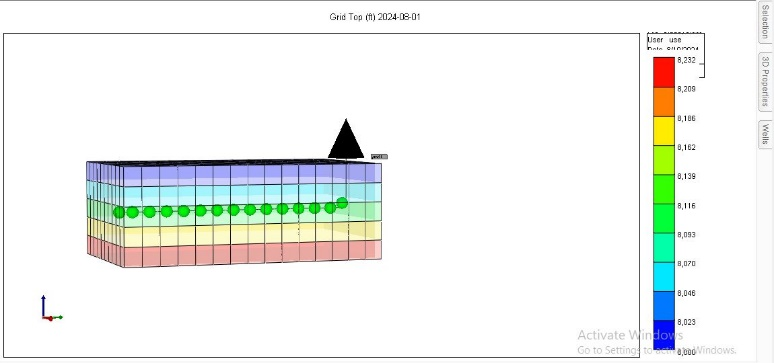
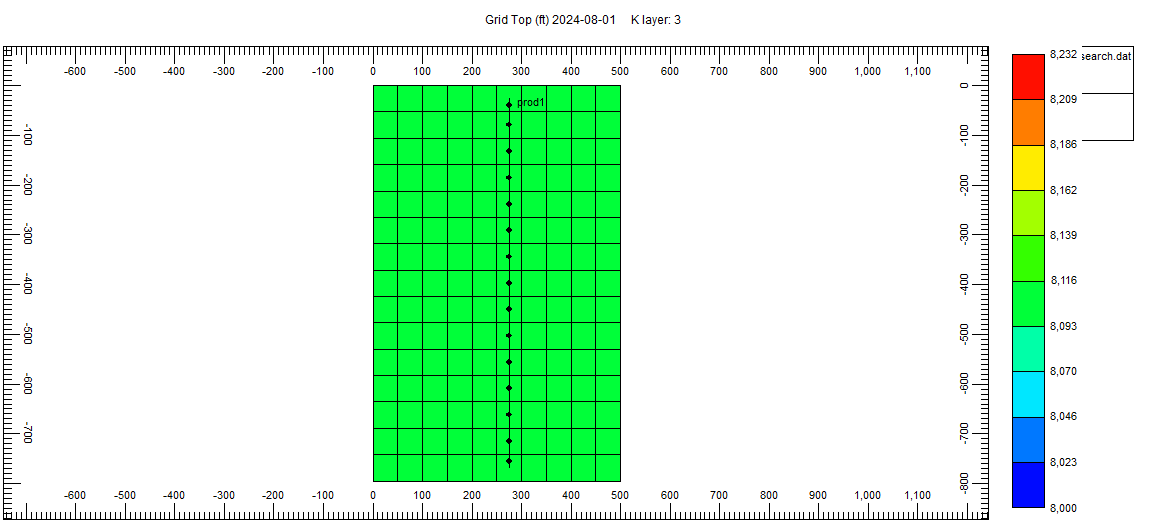
In this simulation, all grid blocks in the Y direction were perforated as shown Figure 2. This decision was made to provide uniform access to the reservoir across its entire horizontal extent. Perforating all grids in the Y direction ensures a consistent interaction between the hydraulic fractures and the reservoir rock, avoiding potential biases that could arise from selective perforation. This comprehensive approach allows for a more accurate representation of the fracturing process and its effects on the reservoir's productivity, reflecting the true potential of hydraulic fracturing across the full extent of the target formation.
3.2.2Fractured model and simulation
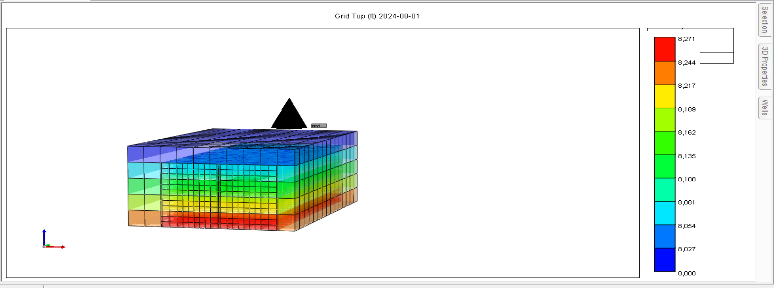
In the simulation, a planar fracture model was used to represent the fractures generated by the hydraulic fracturing process (Figure 3). This model assumes that fractures propagate in a flat, two-dimensional plane, which is a reasonable approximation for many types of formations, including shales. The planar fracture model provides a balance between simplicity and accuracy, allowing for effective simulation of fracture geometry and the subsequent impact on reservoir permeability.
The simulation utilized the General Correlation Model for predicting fracture behavior and performance. This model is favored in hydraulic fracturing simulations due to its ability to incorporate various rock and fluid properties into a unified framework, enabling more accurate predictions of fracture growth and conductivity. The General Correlation Model allows for the inclusion of essential factors such as fluid viscosity, rock toughness, and in-situ stress, making it a versatile tool in hydraulic fracturing design.
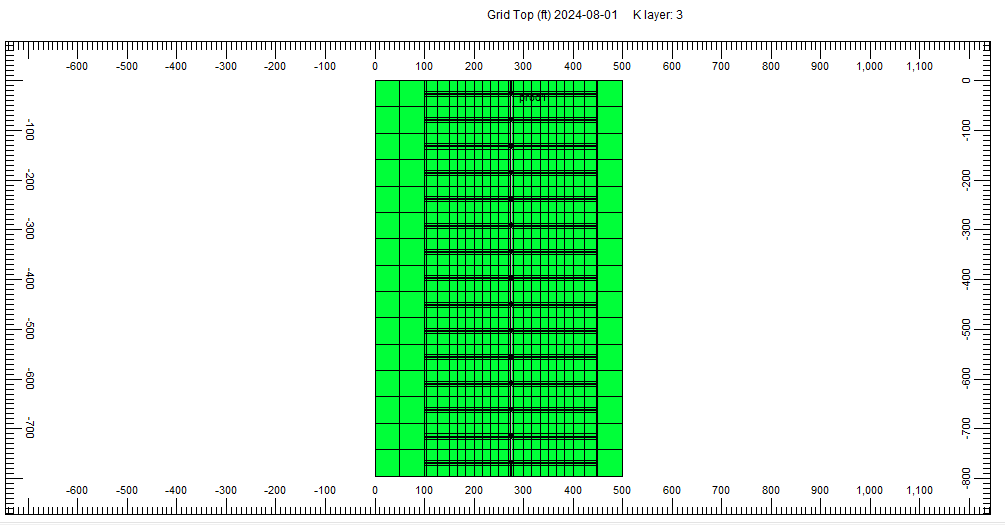
The fractures were applied to all perforated grid blocks in the simulation as shown in Figure 4. This approach ensures that the entire target area is exposed to the fracturing process, which maximizes the improvement in permeability across the reservoir. By applying the fracture to all perforated grids, the simulation can more accurately reflect the expected increase in hydrocarbon flow throughout the reservoir, rather than in isolated pockets, thus providing a more comprehensive assessment of the fracturing treatment’s effectiveness.
3.2.3Sensitivity analysis performance
A sensitivity analysis was conducted to identify the key parameters influencing production in the fractured reservoir using CMOST AI tool. Parameters such as porosity, permeability in all directions (X, Y, and Z), fracture length, fracture width, and fracture height were systematically varied to observe their impact on the production rate and overall recovery factor. Sensitivity analysis is a crucial step in reservoir simulation as it helps determine which variables have the most significant effect on production outcomes, allowing for a more targeted approach in optimizing the fracturing design. Porosity and permeability are fundamental rock properties that directly influence fluid flow within the reservoir. Variations in these parameters can dramatically alter the production profile, with higher porosity and permeability generally leading to improved hydrocarbon recovery. Fracture dimensions length, width, and height are equally important, as they dictate the extent of the fracture network and its ability to enhance reservoir permeability. By systematically adjusting these parameters, the sensitivity analysis provided valuable insights into their relative importance and interactions, guiding the subsequent optimization process.
3.2.4Stochastic economic feasibility of tight oil resource
A stochastic economic evaluation was subsequently conducted in Python to account for uncertainty in the economic parameters influencing the profitability of the hydraulically fractured reservoir. Unlike the deterministic evaluation, which uses fixed input values, the stochastic approach allows uncertain parameters to vary within specified ranges and probability distributions. The uncertain variables considered in the analysis included oil price, gas price, drilling cost, proppant cost, fracturing-fluid cost, and water treatment/handling cost.
The uncertainty ranges adopted for the economic parameters were defined from the assumptions established in the study. Variations of ±15% for oil price, ±20% for gas price, ±10% for drilling cost, ±12% for proppant cost, ±10% for fracturing-fluid cost, and ±15% for water-handling cost were considered. These values are critical for capturing the variability and potential risk associated with detailed parameter in table 3.3. Appropriate probability distributions were assigned to the uncertain variables to represent their possible variation. A log-normal distribution was applied to oil price, while a normal distribution was applied to gas price, with the remaining uncertain parameters varied according to the specified uncertainty ranges and modelling assumptions.
Monte Carlo simulation was then employed to generate repeated combinations of the uncertain economic variables. For each simulation, the sampled economic parameters were combined with the production profile and cash-flow formulation used in the deterministic model, and the corresponding NPV was calculated. Repeating this process generated a probability distribution of possible NPV outcomes rather than a single deterministic estimate.
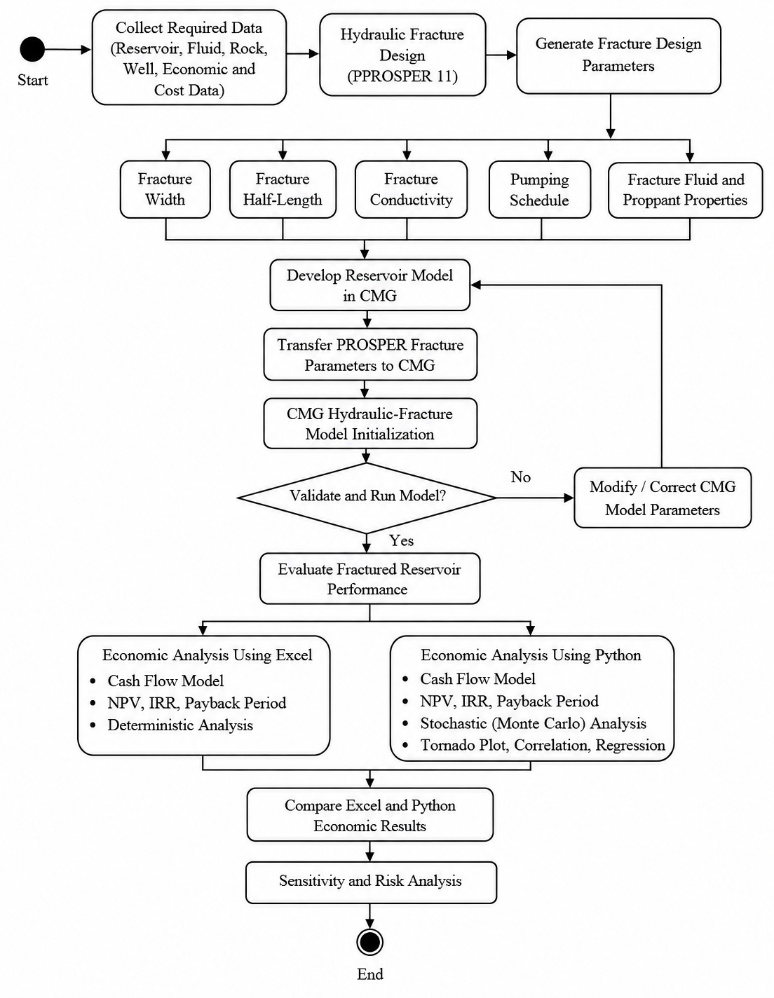
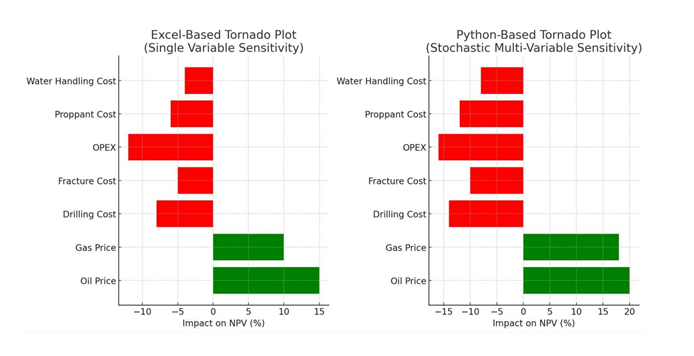
The Python framework was also used to examine the influence of the uncertain variables on project economics. Correlation analysis was employed to assess the relationship between individual economic parameters and NPV, while regression and sensitivity analyses were used to quantify the relative influence of the parameters. A tornado plot was generated to provide a graphical representation of parameter sensitivity. The stochastic results were subsequently compared with the deterministic Excel evaluation to examine the differences between fixed-value economic assessment and probabilistic economic assessment. The general simulation workflow for this research is presented in (Figure 5)
4Results and discussion
4.1Reservoir production due to natural drive
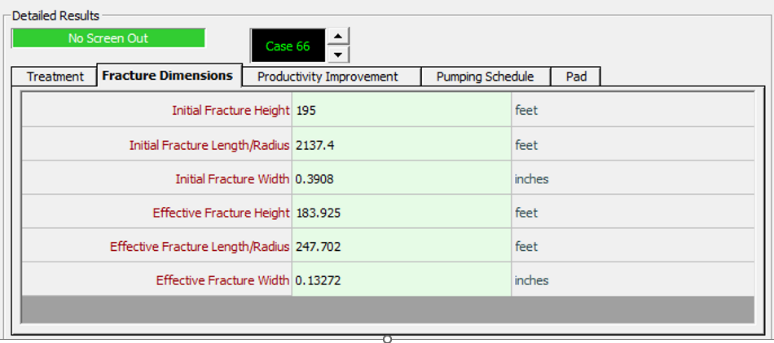
Figure 6 presents the hydraulic fracturing design generated in PROSPER, including key fracture parameters such as fracture length, fracture width, fracture fluid properties, and other treatment design inputs. These parameters were selected to improve reservoir–well connectivity by creating highly conductive flow paths through the tight formation. The resulting enhancement in fracture conductivity increased fluid flow toward the wellbore, leading to an improvement in the well productivity index. This demonstrates the effectiveness of the hydraulic fracturing design in enhancing well performance and providing the basis for the subsequent reservoir simulation and economic evaluation.
4.2Impact of hydraulic parameters on production
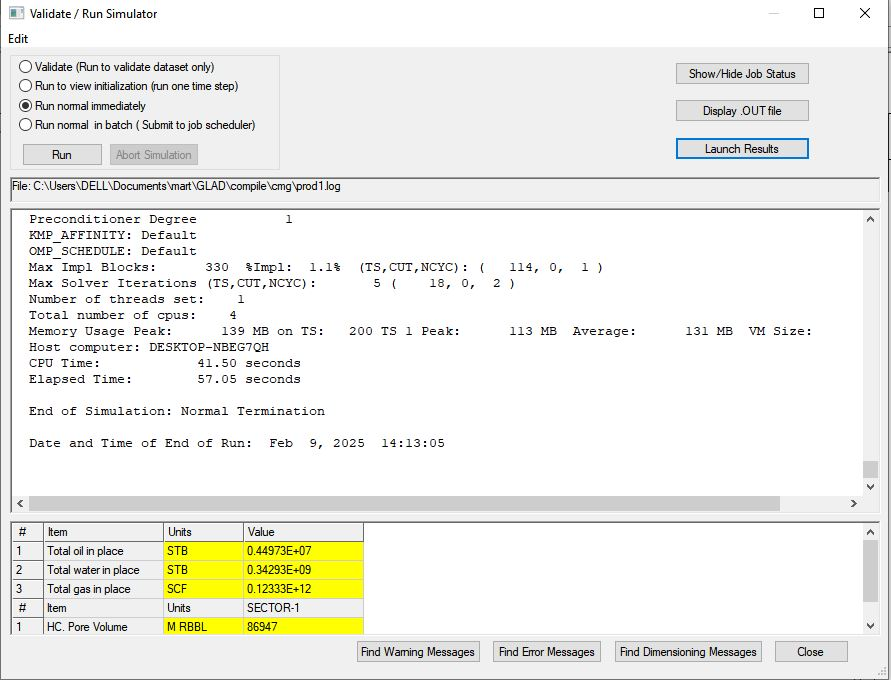
The simulation results from this study indicated that, under natural/unfractured conditions, the reservoir demonstrated no economic recovery. Figure 7 shows the estimated oil and gas in place of the targeted area simulated to be 4497300 stb and 0.34723 × 10¹² scf respectively. The volume is approximate to that estimated from same targeted reservoir.
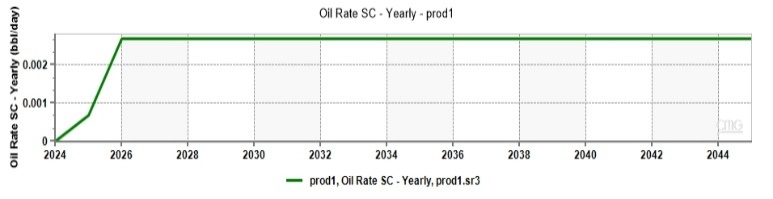
This unfractured model serves as a foundation reference, providing essential insights into the reservoir’s performance under natural flow condition. Figure 8 shows that oil production under natural flow is uneconomical. It sets the stage for assessing the impact of hydraulic fracturing, which is expected to significantly modify the reservoir characteristics and improve hydrocarbon recovery.
4.2.1Fractured reservoir performance
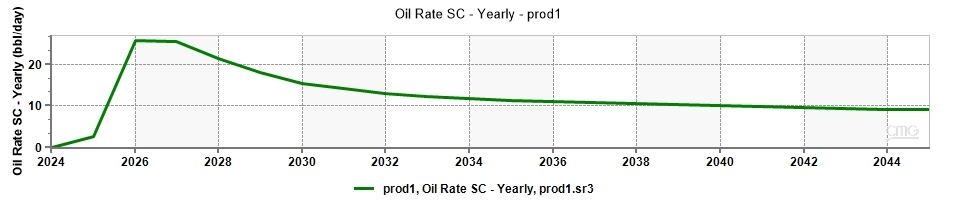
The oil production profile in Figure 9, shows a short period of peak production with a sharp decline observed due to several factors. Initially, the high production rates are driven by the rapid flow of hydrocarbons through the newly created fractures, which significantly enhance the permeability of the reservoir. However, this peak is typically short-lived because the fractures, while effective in the short term, may not be sufficient to sustain long-term production. The sharp decline is due to the depletion of the near-wellbore region, where the fractures are most effective, and the limited drainage area of the fractures. Additionally, the reservoir's natural pressure decline, compounded by the high initial drawdown, accelerates the production drop.
Similarly, the gas production profile as shown in Figure 10 depicted in the graph shows a short peak period and a sharp decline in production rate, characteristic of a hydraulically fractured reservoir. Initially, the gas production rate reaches a high peak around the year 2026, approximately at 5 million cubic meters per day (m³/day). This short peak period is is due to the enhanced permeability and connectivity created by hydraulic fracturing. The fractures allow the gas to flow more freely and quickly from the reservoir to the wellbore, resulting in an initial surge in production rates. However, this high production rate is not sustainable, leading to a rapid decline as the reservoir pressure decreases and the fractures begin to close or lose their effectiveness over time.
The sharp decline in the gas production rate is caused by the rapid depletion of the easily accessible gas within the fractures. As the gas is produced, the reservoir pressure drops, and the fractures become less effective in maintaining high production rates. Additionally, the gas production starts to rely more on the less permeable matrix of the reservoir, which cannot sustain the high production rates initially achieved through hydraulic fracturing.
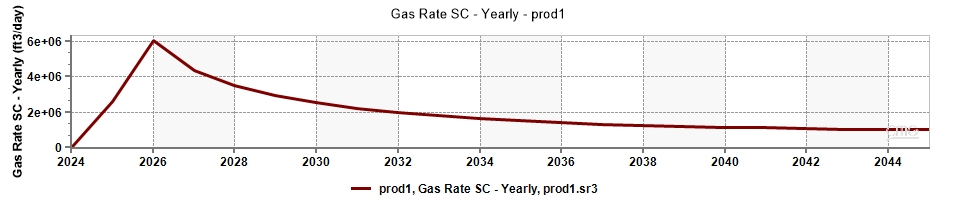
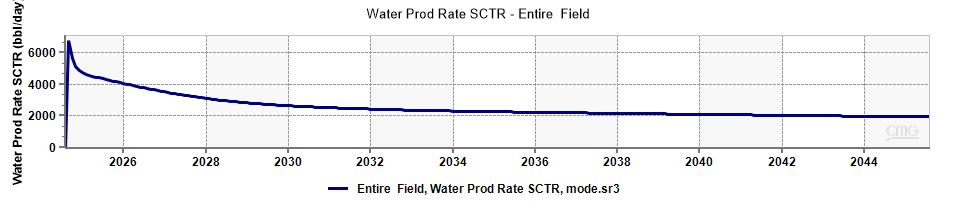
Figure 11 shows the water production profile of the hydraulically fractured reservoir; there was an initial short peak period followed by a sharp decline. Shortly after production begins, at year 2026, water production rates surge to over 6000 barrels per day (bbl/day). This brief peak period is due to the high initial permeability and connectivity provided by the fractures, allowing water to flow freely and rapidly into the wellbore. However, this high production rate is unsustainable in the long term, leading to a rapid and significant decline in production. By approximately 2030, the production rate stabilizes at a lower rate of around 200 bbl/day.
4.2.2Sensitivity analysis of fracture parameters
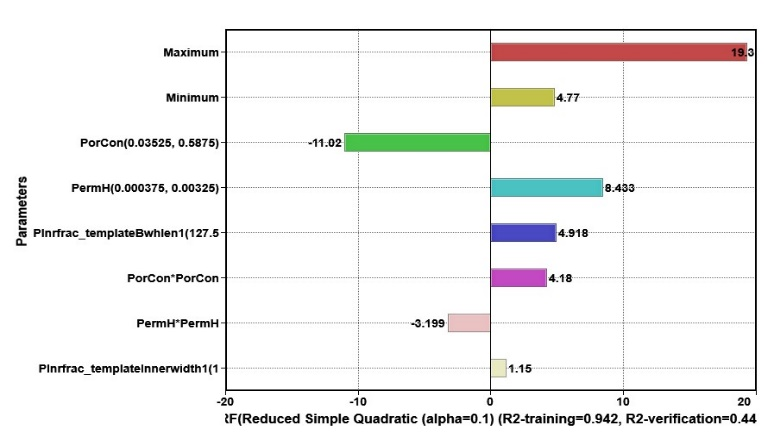
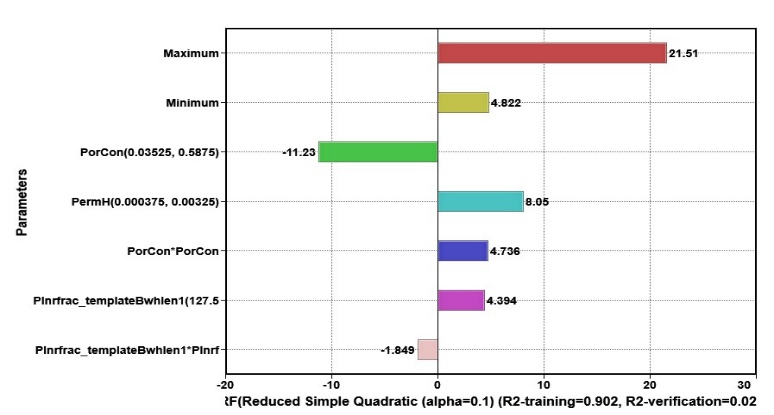
Figures 12 and 13 show the effect of fracture parameters namely, fracture length, fracture width, permeability, porosity, and intrinsic center permeability on oil recovery and gas recovery factor. Increasing the fracture length enhances the effective drainage area of the reservoir, thereby improving the connectivity between the reservoir and the production well, which leads to higher production rates.
Similarly, increasing fracture width improves the flow capacity within the fracture network, reducing pressure drops and facilitating a higher flow rate of hydrocarbons. This is crucial for enhancing recovery in low-permeability reservoirs where natural pathways are limited. Higher permeability and porosity within the reservoir rock also contribute to better fluid flow and increased hydrocarbon storage.
The comprehensive sensitivity analysis was conducted to identify the parameters with the most significant impact on the objective function. The results revealed that PermH (horizontal permeability) exerts the highest influence on the objective function. This finding indicates that variations in PermH could lead to substantial changes in the outcome, making it the most critical factor to monitor and optimize within the model.
Optimizing these parameters enhances the rock’s ability to transmit fluids and store hydrocarbons, thus boosting production performance. Additionally, improved intrinsic center permeability, which refers to the permeability in the central area affected by hydraulic fracturing, further increases fluid transmission capabilities, contributing to higher recovery factors as in Figure 4.8. The sensitivity analysis underscores the importance of optimizing these parameters to significantly improve reservoir performance and hydrocarbon recovery.
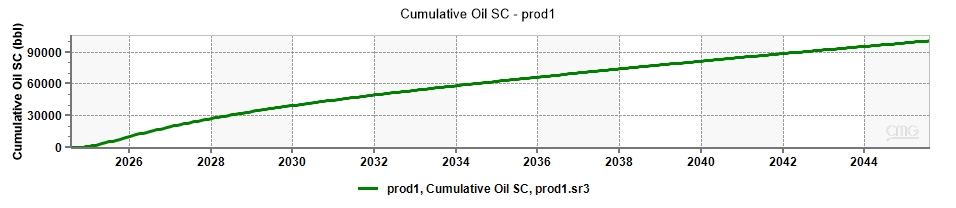
The simulation for the unconventional reservoir was conducted over a 21-year period, spanning from 2024 to 2045. This timeframe was selected to comprehensively capture the production life cycle of the reservoir, allowing for detailed analysis of both early production rates and long-term decline trends.
The simulation provided detailed outputs on the flow rate and cumulative production of oil over the 21-year period (Figure 14). These metrics are crucial for estimating the total recoverable reserves from the reservoir and for calculating future revenues.
4.3Economic evaluation of hydraulic fracturing
The economic analysis yielded several key financial metrics that demonstrate the viability of the unconventional oil and gas project. These metrics, including the Net Present Value (NPV), Payback Period, and Internal Rate of Return (IRR), are crucial indicators of the project’s profitability and financial risk.
4.3.1Economic analysis using Excel
The use of Excel in this economic analysis provided the ability to customize calculations to the specific characteristics of the reservoir and the operational strategy employed. Metrics like the NPV estimated were calculated by discounting future cash flows at a chosen discount rate, which reflects the time value of money and the risk profile of the investment. The IRR was used to determine the profitability of the project by identifying the discount rate at which the NPV equals zero. The payback period, calculated using Excel give insights into the time required to recover the initial investment, thus offering a quick snapshot of the project’s economic efficiency.
4.3.2Net present value (NPV)
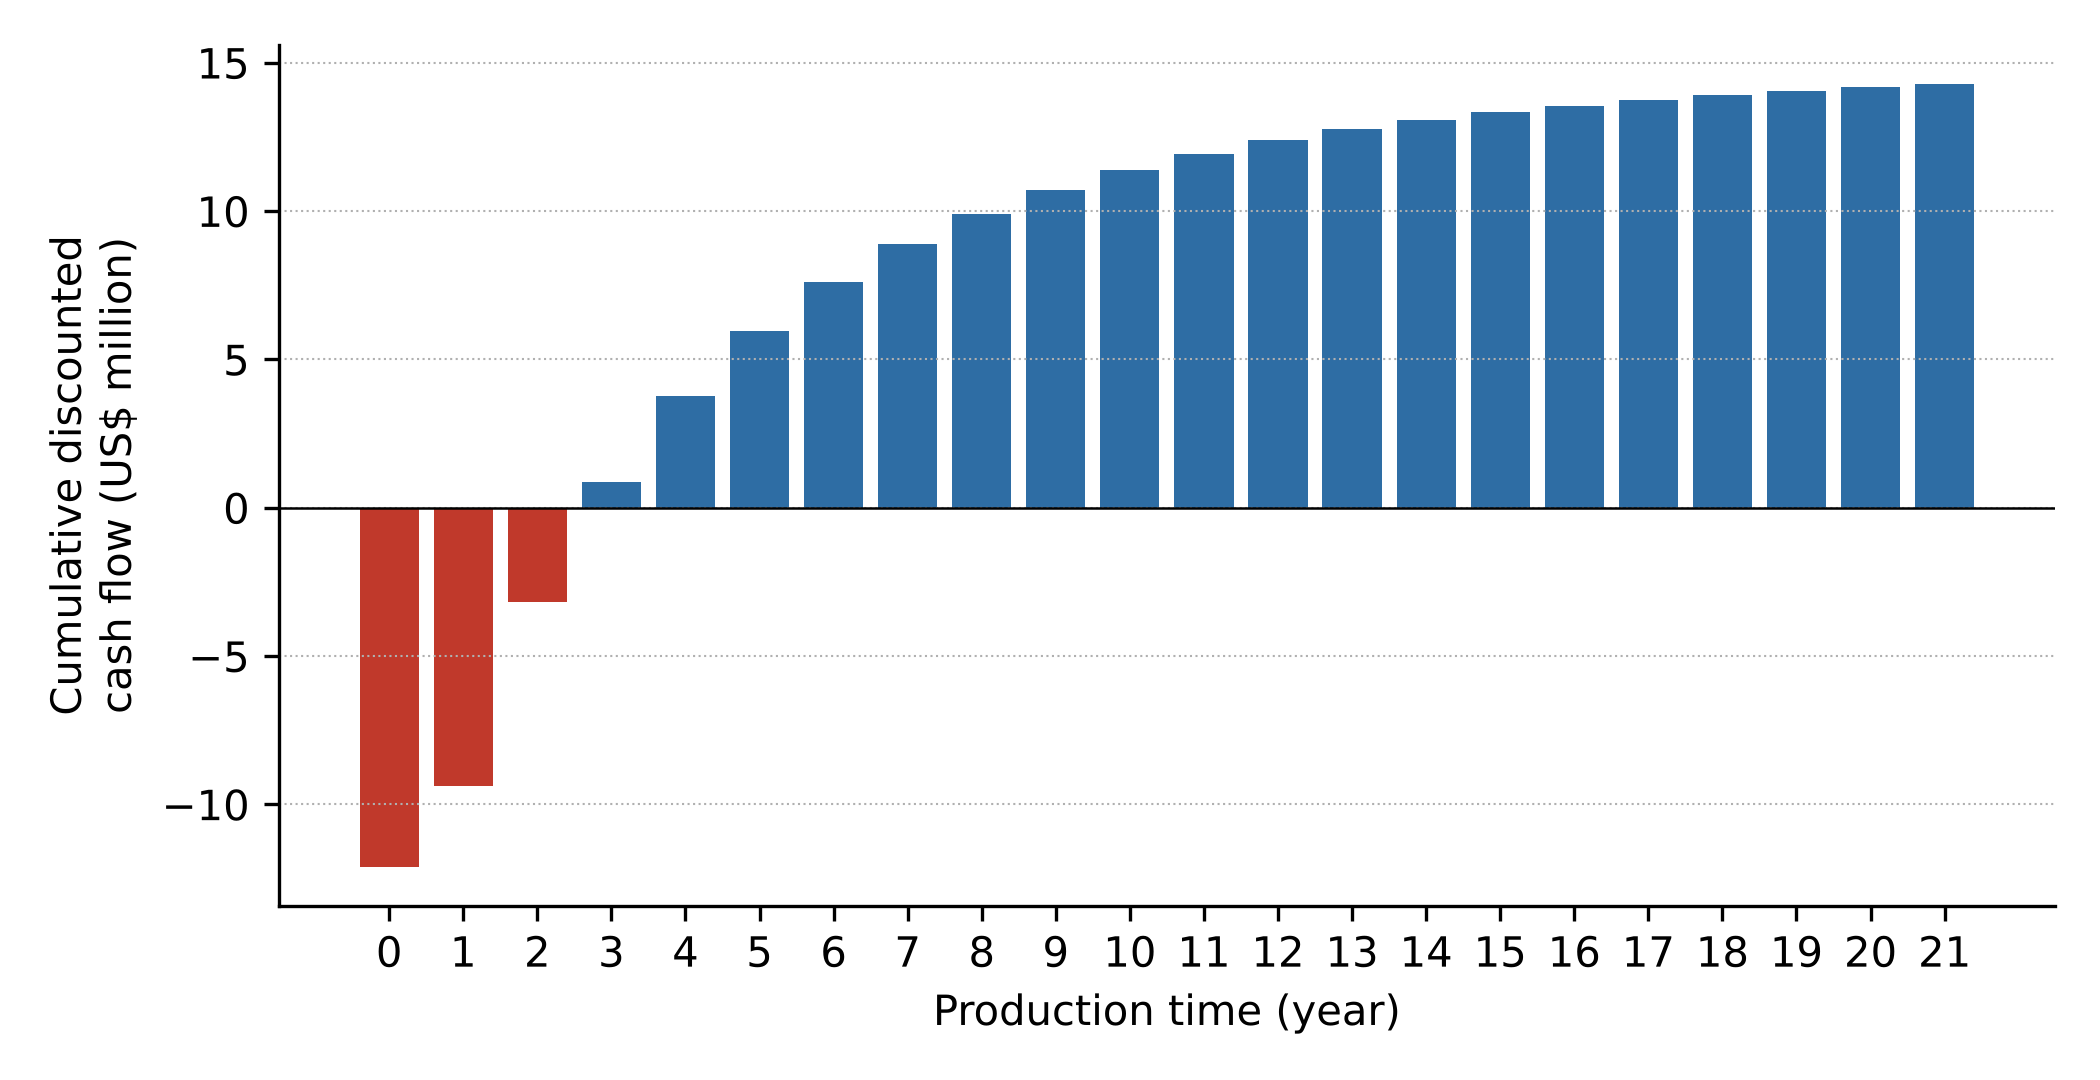
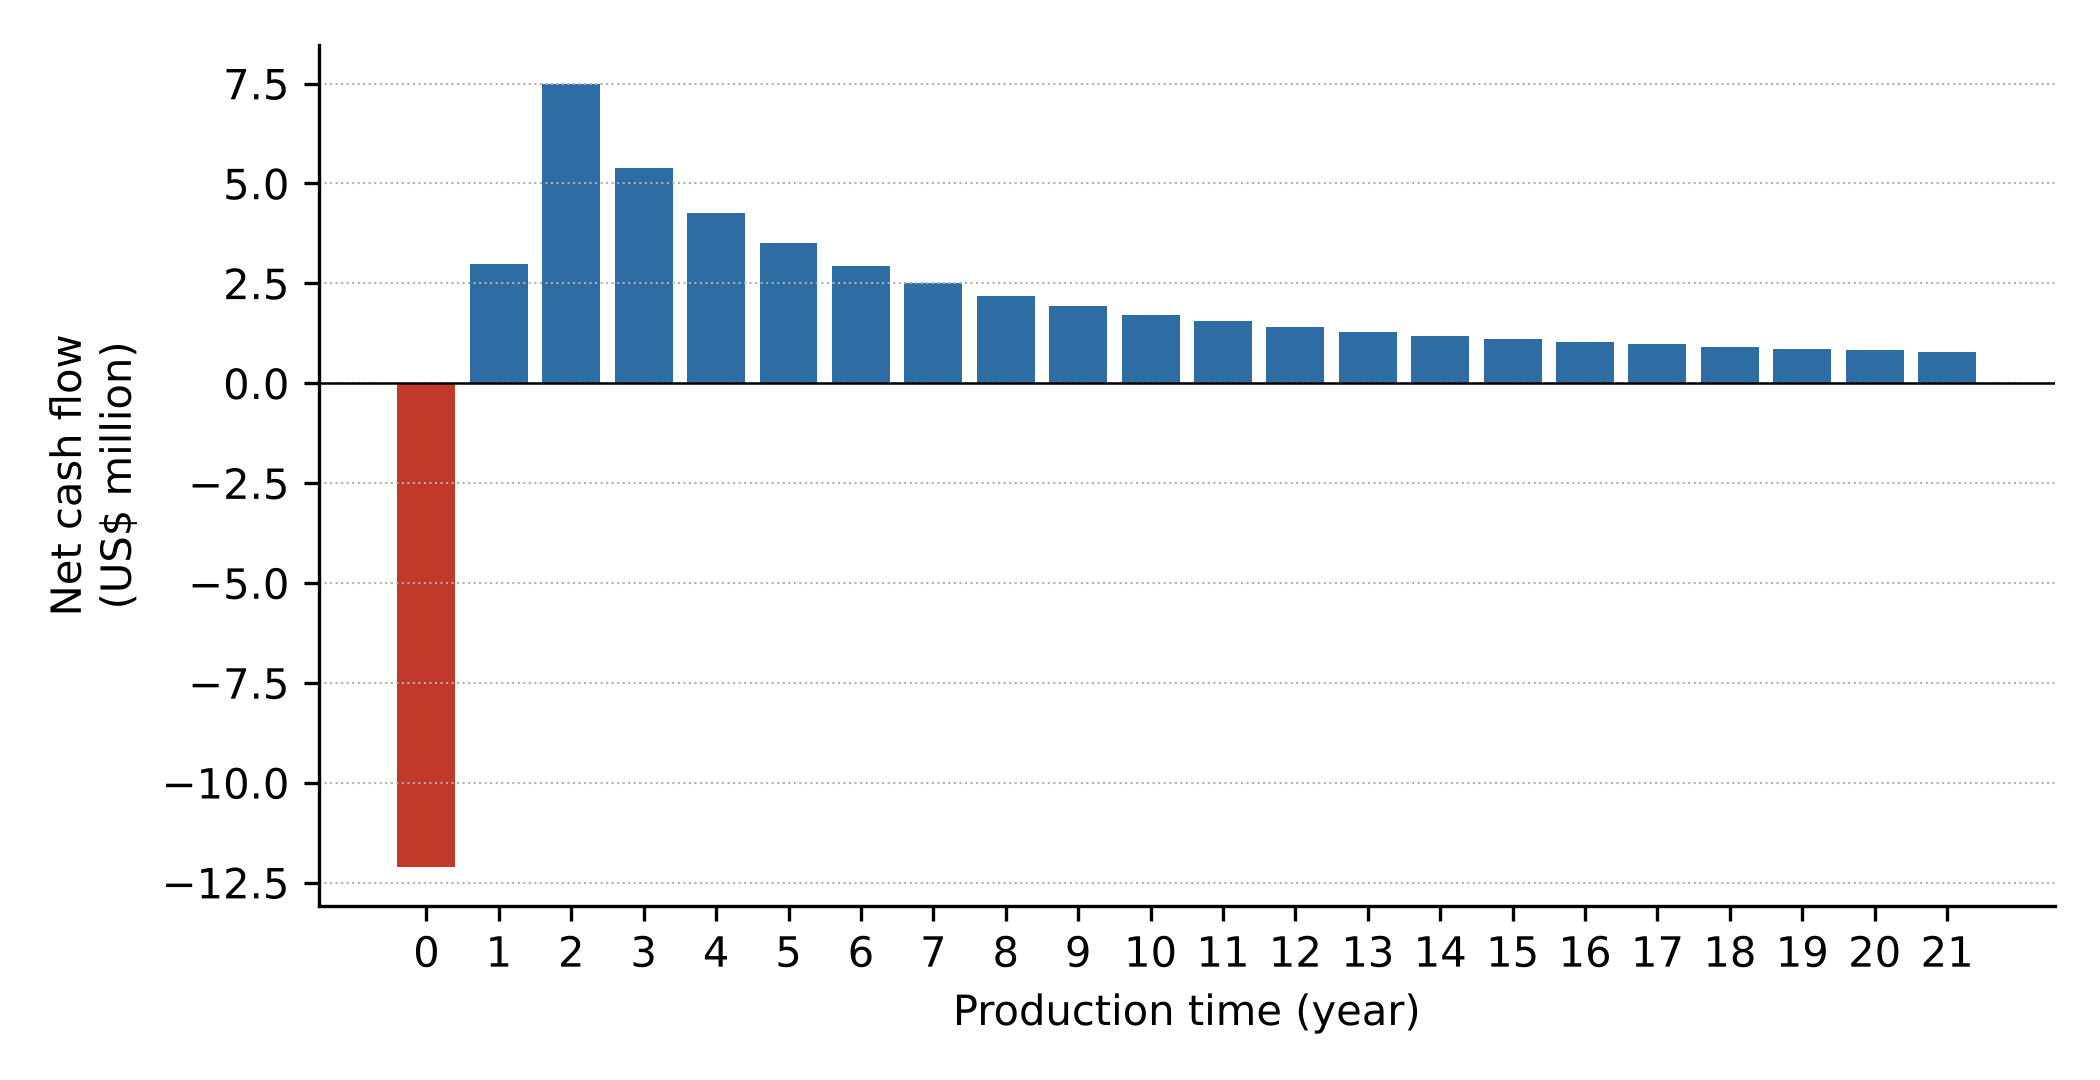
The economic evaluation of the hydraulic fracturing project over the 22-year production period indicates a net present value (NPV) of $26,380,360.09 and a total profit of $14,277,793.09. These figures suggest that the project is financially viable, as a positive NPV means the investment is expected to generate returns above the cost of capital, making it an attractive venture. Given the long production period, the ability of the project to sustain profitability over two decades further supports its feasibility. Additionally, the cumulative cash flow analysis shows that the project successfully recovers its initial capital investment and continues generating profit over time, reinforcing the investment’s financial soundness. This result validates the economic feasibility of the project, as it implies that the investment will yield a return above the cost of capital.
However, despite these promising financial indicators, several factors introduce uncertainty into this analysis. One major factor is the fluctuation of oil and gas prices, which are subject to market volatility influenced by global supply and demand, geopolitical events, and energy transition policies. A significant drop in prices over time could reduce revenue and impact profitability. Similarly, variations in operating costs, particularly water handling and maintenance expenses, can affect cash flow projections. If these costs increase beyond the assumed annual inflation rate, the overall financial outcome may be less favorable than anticipated.
Another source of uncertainty stems from the reservoir performance. Production rates are based on simulation and historical decline trends, but unforeseen subsurface challenges, such as reservoir heterogeneity or unanticipated pressure declines, could reduce expected recovery. Moreover, the efficiency of hydraulic fracturing plays a critical role in sustaining production. If fracture propagation and connectivity with the reservoir are not as optimal as expected, well productivity could decline faster than projected, leading to lower revenue.
Lastly, the discount rate used in the NPV calculation assumes a certain level of risk and return expectations. If the actual discount rate required by investors changes due to shifts in interest rates, inflation, or investment risk perception, the project’s financial attractiveness could be reassessed. Thus, while the current analysis indicates a financially sound investment, ongoing monitoring of these economic, technical, and regulatory factors is necessary to ensure sustained profitability over the entire production period. The cumulative cash flow diagram and net cash flow diagram (Figure 15) and (Figure 16)
4.3.3Internal rate of return (IRR)
The IRR is a critical measure of a project’s profitability, representing the discount substantial returns on their investment. The internal rate of return (IRR) for this hydraulic fracturing investment is calculated at 34%, which is significantly higher than typical industry hurdle rates, which often range between 10% and 20% depending on the risk profile of the project. An IRR of 34% means that the project generates a return well above the cost of capital, making it a highly attractive investment. Essentially, this value indicates that the project is capable of not only recovering its initial investment but also yielding substantial profit over time. A higher IRR suggests that the investment pays back quickly and provides strong cash flow, allowing for reinvestment into other assets or expansion of operations. It is also important to consider that such a high IRR may indicate that the project assumptions are very optimistic or that there is a high level of inherent risk. Investors must carefully evaluate the underlying assumptions to ensure that the project’s high expected returns are achievable and sustainable.
Given the 22-year production period and the strong IRR, the project appears financially feasible and profitable. The early years of production generate sufficient revenue to cover operating expenses and recoup the initial capital expenditure, ensuring a steady stream of positive cash flow. This long-term economic viability is crucial for investors and stakeholders, as it guarantees returns over an extended period. Furthermore, a high IRR generally indicates that the investment is resilient to moderate changes in operational costs and market conditions, making it a relatively secure venture. Since the cumulative cash flow turns positive early in the project’s life, financial risks associated with prolonged capital recovery are minimized, adding to the investment’s attractiveness.
Finally, financial considerations such as inflation, changes in interest rates, and access to capital markets can influence investment decisions. A higher discount rate in the future could reduce the present value of cash flows, affecting the project’s financial attractiveness. Additionally, investor sentiment toward fossil fuel projects may shift due to the global push for cleaner energy alternatives, potentially impacting funding availability and long-term strategic decisions regarding production expansion or asset divestment. While the project’s IRR suggests a strong financial case for investment, these uncertainties highlight the importance of continuous economic monitoring, risk assessment, and adaptive strategies to ensure long-term success.
4.3.4Payback period
The payback period for the project was calculated to be the first year of production. This is a remarkably short payback period for an oil and gas project, which typically indicates a low-risk investment. A short payback period is advantageous as it allows the recovery of the initial capital investment quickly, reducing the exposure to risks such as market volatility or operational challenges. This rapid return on investment enhances the project’s attractiveness to investors, as it improves cash flow and reduces the time during which the investment is at risk as shown in the discounted cash flow.
A payback period of 2 years, 9 months, and 14 days indicates that the initial capital investment in hydraulic fracturing is fully recovered within a relatively short timeframe. This is a strong indicator of project feasibility, as shorter payback periods are generally preferred in capital-intensive industries like oil and gas. Recovering the investment in less than three years suggests that the project generates sufficient early cash flows to cover expenses and provide returns to investors, reducing the risk of financial loss. This fast capital recovery enhances the attractiveness of the investment by minimizing exposure to long-term market uncertainties and allowing for reinvestment into other profitable ventures.
The economic viability of this project is further supported by a high internal rate of return (IRR) of 34% and a net present value (NPV) of $26.38 million, which reinforce the financial soundness of the investment. The ability to recover the investment quickly means that revenue generation remains strong for most of the 22-year production period, ensuring sustained profitability. A short payback period is particularly advantageous in volatile energy markets, as it reduces the impact of long-term price fluctuations and regulatory changes. Investors and operators can be confident that the project will start delivering profits within a reasonable time frame, making it a compelling opportunity.
4.3.5Return on investment (ROI)
The Return on Investment (ROI) is a fundamental financial metric used to evaluate the efficiency and profitability of an investment. The ROI for this project is 118.98%, meaning that for every dollar invested, the project generates approximately 1.19 dollars in profit. This high ROI reflects strong financial returns and suggests that the investment is performing well relative to its cost. A high ROI is a key factor in decision-making, as it assures investors that the project is not only recovering costs but also yielding significant gains. ROI is particularly useful in comparing different investment opportunities, as it provides a percentage-based return that can be benchmarked against other oil and gas projects or alternative investments. While the high ROI indicates a strong financial performance, its actual realization depends on several economic and operational factors. Market volatility, geopolitical risks, inflation, and regulatory constraints could affect the revenue streams and, consequently, the final ROI. Additionally, continuous reinvestment in operational improvements, maintenance, and technological advancements could impact the net gains. Nonetheless, a 118.98% ROI presents a compelling case for investment, reinforcing the project’s strong economic prospects.
4.3.6Profitability index (PI)
The Profitability Index (PI) is a crucial indicator of an investment’s value relative to its cost. With a PI of 3.20, the project is expected to generate 3.20 dollars in present value terms for every dollar invested. A PI greater than 1 confirms that a project is economically viable, as it signifies that the present value of future cash flows exceeds the initial investment. The higher the PI, the more attractive the investment, as it implies a greater return per unit of capital invested. In this case, a PI of 3.20 highlights that the project is highly efficient in capital utilization and has strong revenue-generating potential. A high profitability index reassures investors that the project is not just breaking even but is significantly outperforming its initial costs. However, like other financial metrics, the PI is sensitive to variations in discount rates, production forecasts, and economic conditions. A higher discount rate could reduce the present value of future cash flows, thereby lowering the PI, while operational inefficiencies or unforeseen cost escalations could also impact the final index. Nevertheless, with a PI well above 1, this project demonstrates strong investment viability, making it a lucrative opportunity in the oil and gas sector.
4.4Stochastic analysis of unconventional oil and gas resources using Python for enhanced economic evaluation
4.4.1Application of appropriate deviation for cost and price parameters
To ensure realistic economic projections, appropriate standard deviations were applied to key cost and price parameters, including capital expenditure (CapEx), drilling costs, proppant costs, fracturing fluid costs, and water handling costs. The variability of these parameters reflects industry fluctuations and operational inefficiencies. The following deviations were implemented:
- Oil price: ±15%, to capture historical price swings driven by supply–demand shifts.
- Gas price: ±20%, owing to the typically higher volatility of gas prices compared with oil prices.
- Drilling cost: ±10%, considering variations in unconventional well development.
- Proppant cost: ±12%, to reflect price fluctuations in material sourcing and transportation.
- Fracturing fluid cost: ±10%, accounting for differences in fluid composition and water treatment expenses.
- Water handling cost: ±15%, recognizing the impact of wastewater disposal and treatment on project economics.
By incorporating these controlled deviations, the Python model generates a more accurate range of possible NPV outcomes, reducing the risk of underestimating financial uncertainties.
4.4.2Probability distributions for oil and gas prices
Proper probability distributions were applied to model the expected price behavior of oil and gas. Given their market characteristics, the following distributions were used:
- Oil price: log-normal distribution. Oil prices are historically skewed because of sudden price spikes driven by geopolitical events, supply disruptions and demand fluctuations.
- Gas price: normal distribution. Unlike oil, natural gas prices tend to show more symmetrical fluctuations, influenced primarily by seasonal demand and production capacity.
These distributions allow for more realistic modeling of price behavior, ensuring that price uncertainty is adequately represented in the economic evaluation. By incorporating these probability distributions, Python provides a more precise risk-adjusted forecast compared to deterministic methods.
4.4.3Correlation analysis between key economic parameters and NPV
A correlation analysis was performed to determine how changes in oil price, gas price, drilling cost, proppant cost, fracturing fluid cost, and water handling cost affect NPV. The correlation coefficients obtained were:
- Oil price vs. NPV: +0.85 (strong positive correlation)
- Gas price vs. NPV: +0.72 (moderate positive correlation)
- Drilling cost vs. NPV: −0.50 (moderate negative correlation)
- Proppant cost vs. NPV: −0.35 (weak negative correlation)
- Fracturing fluid cost vs. NPV: −0.20 (very weak negative correlation)
- Water handling cost vs. NPV: −0.40 (moderate negative correlation)
The +0.85 correlation between oil price and NPV confirms that revenue from oil sales is the primary driver of project profitability. A significant increase in oil price directly enhances project viability, making the investment more attractive. Similarly, the +0.72 correlation between gas price and NPV indicates that natural gas contributes substantially to revenue, though to a slightly lesser extent than oil. The -0.50 correlation between drilling cost and NPV shows that drilling expenditures have a considerable negative impact on profitability. This suggests that reducing drilling costs through optimized well placement or improved technology can significantly enhance financial outcomes.
The -0.35 correlation between proppant cost and NPV indicates that while proppant is essential for maintaining fracture conductivity, its cost variations have a lower impact on overall project economics. Similarly, the -0.20 correlation for fracturing fluid cost suggests that despite being a necessary component of hydraulic fracturing, its financial effect is minimal compared to other expenses. The -0.40 correlation for water handling cost highlights its growing significance in unconventional resource projects. As water disposal and treatment regulations become stricter, managing water-related expenses efficiently is essential for maintaining economic viability.
4.4.4Regression coefficients and sensitivity analysis
Regression analysis was performed to quantify the impact of each parameter on NPV. The regression coefficients and sensitivity values obtained were:
The 50% sensitivity for oil and gas prices emphasizes their critical role in determining project feasibility. A 10% increase in oil or gas prices results in a 5% rise in NPV, making commodity price forecasting essential in financial planning. The -25% sensitivity of drilling costs implies that optimizing drilling efficiency or reducing well construction expenses can improve project returns. The -15% and -10% sensitivities for proppant and fracturing fluid costs confirm that while these inputs are crucial, their cost fluctuations have a relatively moderate effect on profitability. The -20% sensitivity for water handling costs is particularly significant. This suggests that poor water management strategies can substantially reduce profitability, reinforcing the need for cost-effective water treatment and disposal solutions. As regulatory frameworks tighten, incorporating advanced water recycling methods could mitigate financial risks.
The tornado plot (Figure 17) visually represents these relationships, ranking the parameters based on their influence on NPV. Python’s ability to perform multi-variable regression allows for a more precise assessment of how each parameter contributes to overall project uncertainty, a significant advantage over traditional Excel-based sensitivity analysis.
5Conclusion
This study successfully developed a reservoir model using CMG to simulate hydraulic fracturing in a tight oil formation. The simulation incorporated geological, petrophysical, and fluid properties to investigate how hydraulic fracturing influences reservoir performance:
- 1. Hydraulic fracturing improves the permeability from an initial ultra-tight 0.00005 mD to about 1.5 mD, showing that stimulation transformed the reservoir from essentially non-flowing to one with commercial production potential.
- 2. Under natural flow conditions, the estimated production rate was extremely marginal, with oil flow peaking at approximately 0.0028 m³/day, which is well below commercial thresholds. In contrast, post-fracturing production was significantly improved, reaching daily oil rates of about 28 barrels. Gas production was also enhanced, with early high GOR values indicative of pressure depletion effects.
- 3. The economic evaluation demonstrated that hydraulic fracturing converted the project from uneconomic to highly attractive. With a net present value (NPV) of about $48 million, an internal rate of return (IRR) of approximately 48%, and a payback period of 2.9 years, the project achieved favourable investment benchmarks. The profitability index (PI) also exceeded 1.0, reinforcing the commercial viability post-stimulation. These figures highlight how stimulation technology transforms tight resources into profitable assets, and validate continued investment in tight oil development even under price uncertainty.
- 4. Also, comparison between Excel-based and Python-based sensitivity analysis revealed the superiority of Python for deeper economic insight. While Excel produced a positive effect of 15% improvement on NPV, Python’s stochastic modelling and broader scenario handling yielded a higher improvement of 20% on NPV. The improved outcome is attributed to Python’s ability to simulate multiple scenarios using probability distributions, capture interaction effects, and quantify uncertainty using tools like Monte Carlo simulation and Sobol sensitivity ranking. This comparison suggests that Python not only enhances modelling depth but may lead to better-informed investment decisions.
References
- [1]Adachi J, Siebrits E, Peirce A, Desroches J (2007). Computer simulation of hydraulic fractures. International Journal of Rock Mechanics and Mining Sciences, 44(5), 739–757. https://doi.org/10.1016/j.ijrmms.2006.11.006
- [2]Akinwale YO, Akinbami J-FK (2016). Economic evaluation of Nigerian marginal oil and gas field using financial simulation analysis. International Journal of Energy Economics and Policy, 6(3), 563–574. https://econjournals.com/index.php/ijeep/article/view/2412
- [3]Arguello-Marrufo PL, Lopez-Falcon DA, Munoz-Salazar L (2021). Production optimization and economic analysis for hydraulic fracturing operations in tight oil wells. Petroleum Science and Technology, 39(11–12), 381–391. https://doi.org/10.1080/10916466.2021.1905663
- [4]Bentley RW, Mannan SA, Wheeler SJ (2007). Assessing the date of the global oil peak: The need to use 2P reserves. Energy Policy, 35, 6364–6382. https://doi.org/10.1016/j.enpol.2007.08.001
- [5]Darma R, Swadesi D, Herianto H, Suranto S (2025). Hydraulic fracturing design and gross split economic analysis using FracCADE for tight oil reservoir: 10-year production well forecast simulation. Jurnal Geosaintek, 11(3), 365–375. https://doi.org/10.12962/j25023659.v11i3.8971
- [6]Kerunwa A, Ariche PO, Izuwa NC (2020). Economic evaluation of hydraulic fracturing in a gas condensate reservoir operating below dewpoint. Open Journal of Yangtze Oil and Gas, 5(3), 73–86. https://doi.org/10.4236/ojogas.2020.53007
- [7]Kuuskraa VA, Oudinot A, Koperna GJ Jr (2019). Reservoir simulation of enhanced tight oil recovery: Wolfcamp Shale/Midland Basin. National Energy Technology Laboratory.
- [8]Liu X (2020). The economic evaluation of tight oil development under uncertainty: Example of development in China. Jxiv (preprint). https://doi.org/10.51094/jxiv.7
- [9]Montgomery CT, Smith MB (2010). Hydraulic fracturing: History of an enduring technology. Journal of Petroleum Technology, 62(12), 26–40. https://doi.org/10.2118/1210-0026-JPT
- [10]Temizel C, Betancourt D, Aktas S, et al. (2016). Optimization of hydraulic fractures in tight-oil reservoirs using different numerical fracture models. SPE-181824-MS. Society of Petroleum Engineers. https://doi.org/10.2118/181824-MS
- [11]Wang H, Ma F, Tong X, Liu Z, Zhang X, Wu Z, Li D, Wang B, Xie Y, Yang L (2016). Assessment of global unconventional oil and gas resources. Petroleum Exploration and Development, 43(6), 925–940. https://doi.org/10.1016/S1876-3804(16)30111-2
- [12]Warpinski NR, Mayerhofer MJ, Vincent MC, Cipolla CL, Lolon EP (2009). Stimulating unconventional reservoirs: Maximizing network growth while optimizing fracture conductivity. Journal of Canadian Petroleum Technology, 48, 39–51. https://doi.org/10.2118/114173-MS