RCM and Integrity of Aging Oil and Gas Assets
Reliability-Centered Maintenance and Mechanical Integrity Management for Aging Onshore Oil and Gas Production Facilities
1STIS Nigeria Limited, Nigeria
2Independent Researcher, Nigeria
3Mining and Upgrading Operations, Suncor Energy, Fort McMurray, Alberta, Canada
4Department of Mechanical Engineering, Faculty of Engineering, Nnamdi Azikiwe University, Awka, Anambra State, Nigeria
Published November 2022
Abstract
Many onshore oil and gas production facilities now operate beyond their design life, yet their maintenance programmes still follow calendar intervals set when the equipment was new, ignoring rising corrosion and hidden-failure rates. This study develops an integrated reliability-centered maintenance and mechanical integrity framework for a representative 25-year-old onshore facility, evaluated over a 15-year life extension. Active failure modes are optimized with Weibull renewal and delay-time models under a risk cap for safety and environmental consequences. Static equipment is managed by risk-based inspection with corrosion-rate updating and inspection effectiveness. Protective devices receive age-dependent proof-test intervals. Inputs are representative published values, not field data. Against the legacy calendar programme, reliability-centered task selection cut rotating-equipment failures by 53 percent and cost by 26 percent. Static-equipment loss of containment events fell from 16.9 to 7.1 with static intervals and to 4.6 with age-adaptive inspection. Only the age-adaptive strategy kept every safety instrumented function within its SIL 2 limit, and it reduced failures on demand by 60 percent. The integrated strategy cost USD 23.5 million over 15 years, 23 percent less than legacy and 5 percent more than static reliability-centered maintenance. That premium averts about one additional loss of containment or failure on demand per USD 0.4 million. The advantage widens as corrosion accelerates. With five failure records, poorly estimated failure models raised expected cost by 22 percent.
Keywords: reliability-centered maintenance; mechanical integrity; ageing facilities; risk-based inspection; delay-time model; proof testing; onshore oil and gas
1Introduction
A large share of onshore oil and gas production capacity in the United States and elsewhere is delivered by facilities that were built decades ago and that now operate beyond the design life assumed when their equipment was specified. Separators, heater-treaters, produced-water systems, flowlines, storage tanks, compressors and pumps on these sites have been exposed for many years to produced fluids that contain carbon dioxide, hydrogen sulfide, water and solids, and their condition reflects that history [1–3]. Regulators and researchers have documented that ageing is not a matter of calendar age alone but of the accumulated degradation, obsolescence and loss of knowledge that affect equipment containing hazardous fluids [1, 2, 4, 5]. Pipeline and gathering system failure statistics show that corrosion remains a leading cause of loss of containment in oil and gas service [6–8], and storage tank accident reviews show that the consequences of integrity failures in ageing storage can be severe [9–11]. Fired heaters, boilers and furnaces in upstream service add a further class of ageing equipment whose reliability and integrity must be managed together [12], and risk-based process engineering has been proposed as a way of strengthening reliability across complex natural gas infrastructure [13]. The global cost of corrosion has been estimated at several percent of gross domestic product, much of it avoidable through better management [14].
Maintenance programmes on these facilities are often inherited from the original operator or the original equipment manufacturer, with fixed calendar intervals for overhauls, inspections and proof tests that were set when the equipment was new [15–17]. Reliability-centered maintenance (RCM) offers a structured alternative: each function and failure mode is analysed, its consequences are classified, and a task is selected only if it is technically feasible and worth doing [18–20]. RCM has been applied successfully to rotating equipment and reciprocating compressors [21, 22], and its integration with reliability, availability and maintainability analysis has been demonstrated [23]. Mechanical integrity programmes for static equipment, built on risk-based inspection (RBI) and fitness-for-service assessment, have developed in parallel through industry standards and research [24–27].
These two traditions are rarely integrated, and neither is routinely adapted to ageing. RCM studies typically assume that failure-time distributions are stationary and that the optimal task interval, once found, can be applied for the remaining life [28, 29]. Mechanical integrity programmes may update corrosion rates at each inspection, but inspection intervals are often set by maximum code intervals rather than by risk [24, 26, 30]. Proof-test intervals for safety instrumented functions are usually fixed at the design stage, even though failure rates of valves and switches exposed to produced fluids increase with age [3, 4]. Reviews of maintenance optimization have noted that the gap between models and practice persists, partly because of the data that models require and partly because models address single failure modes rather than the facility as a whole [31–33]. Studies of maintenance work-order data show that the records needed to estimate failure models are frequently incomplete or miscoded [34–36].
This paper addresses these gaps by developing and demonstrating an integrated RCM and mechanical integrity framework for ageing onshore production facilities. It makes four contributions. First, it combines RCM task selection for active failure modes, using Weibull renewal and delay-time models with a risk constraint for safety and environmental consequences, with RBI for static equipment and age-dependent failure-finding intervals for hidden failures, in a single facility-level evaluation [18, 24, 37]. Second, it compares a legacy calendar programme, an RCM programme with static intervals and an integrated age-adaptive programme over a 15-year life-extension horizon, quantifying cost, loss of containment, failures on demand, downtime and safety integrity level (SIL) compliance. Third, it tests how the ranking of the strategies changes as corrosion accelerates with rising water cut, a characteristic of mature fields [38, 39]. Fourth, it quantifies the cost of poor maintenance data by estimating failure models from small and misrecorded samples [40, 41]. The paper then reviews the relevant literature and presents the methods, results, discussion and conclusions.
2Literature review
This section reviews the six bodies of literature on which the framework draws: the RCM methodology and its applications; maintenance strategy selection and criticality analysis; maintenance performance measurement, total productive maintenance and maintenance data quality; ageing, corrosion and damage mechanisms in oil and gas equipment; risk-based inspection, fitness-for-service and remaining strength assessment; and mathematical models for maintenance and inspection optimization. The review emphasizes the elements that the framework integrates and the gaps that motivate it, following the view that maintenance management is a cycle of strategy, planning, execution and assessment that must be supported by suitable models and data [42–44]. It also reflects the terminology of the European maintenance standards, which define failure modes, maintenance types and performance indicators in a consistent way [45–47].
2.1Reliability-centered maintenance
RCM originated in civil aviation and was later codified in evaluation criteria that require any RCM process to identify functions, functional failures, failure modes, failure effects and consequences, and to select tasks that are applicable and effective [18]. Reviews of maintenance systems describe RCM alongside total productive maintenance and condition-based maintenance as the principal frameworks for maintenance planning [19, 48, 49], and a SWOT analysis of RCM identified its strengths in systematic logic and its weaknesses in data requirements and implementation effort [20]. Applications in oil and gas include an improved RCM method for reciprocating compressor units that combined the analytic hierarchy process with fuzzy comprehensive evaluation [22]. RCM has been used to determine tasks for rotating equipment [21], to establish maintenance plans by quantitative analysis [28], to manage railway infrastructure on the basis of reliability analysis [29] and to plan maintenance in ethanol plants [50]. RCM has also been combined with reliability, availability and maintainability analysis [23]. Reliability engineering and failure analysis methods for complex engineering systems supply the failure mode and failure distribution inputs on which RCM decisions rest [51], and predictive maintenance and condition monitoring practice in critical power and energy infrastructure provides the condition-based tasks that RCM logic selects for evident wear-out modes [52]. Data-driven reliability analysis of natural gas compressors has shown how operational data can feed such programmes [53]. Criticality analysis, which ranks assets before detailed RCM, has been performed with the analytic network process for identifying critical components [54].
2.2Maintenance strategy selection and criticality
Selecting the most suitable maintenance strategy for each asset has been treated extensively as a multi-criteria decision problem. Early work applied the analytic hierarchy process (AHP) to strategy selection [55] and multi-attribute approaches to the policy selection problem [56], building on the AHP method [57, 58] and its applications in operations management [59, 60]. Reviews of the strategy selection problem catalogue the methods used and their limitations [61], and a conceptual framework links strategy selection to the performance of the maintenance function [62]. Fuzzy AHP combined with grey relational analysis and TOPSIS [63], fuzzy AHP with TOPSIS [64], fuzzy analytic network process [65], hybrid multi-criteria methods [66], integer linear programming [67], multi-criterion decision models [68], goal programming with AHP and TOPSIS [69] and ELECTRE-SORT [70] have all been proposed. Applications include rolling stock [71], electric power distribution [72], multi-component systems [73], marine settings with risk evaluation [74], sustainable maintenance in manufacturing [75] and rubber industries [76], and the alignment between business and maintenance strategies [77]. Quantitative frameworks for policy development [78], decision analysis using computerized maintenance management systems [79] and reviews of time-based and condition-based maintenance [48] provide further foundations. Condition-based maintenance itself rests on diagnostics and prognostics [80], and the decision to act on risk analysis results has been examined critically [81].
Criticality analysis ranks equipment before strategy selection. Multi-criterion classification [82], fuzzy reasoning [83], empirical formulae [84], AHP-based criticality in refineries [85], power plants [86, 87], medical equipment [88], petrochemical plants [89] and process plants [90] and short-term decision support for task prioritization [91] have been reported. Failure mode and effects analysis provides the risk priority logic underlying many of these methods, and its risk evaluation approaches have been reviewed [92]; fuzzy FMEA has been applied to compressed natural gas systems [93] and fuzzy risk analysis to mechanical systems in process industries [94]. Multi-criteria classification of spare parts extends criticality to inventory decisions [95]. A risk-based process engineering framework for natural gas infrastructure applies the same ranking logic at system level, directing reliability effort to the elements whose failure most affects gas supply [13].
2.3Maintenance performance, total productive maintenance and data quality
Maintenance performance measurement provides the indicators against which RCM and mechanical integrity programmes are judged. Reviews of maintenance performance metrics [96] and performance measurement and management [97], frameworks of indicators for the maintenance function [98], terminology for value-driven maintenance [99] and the European key performance indicator standard [46] define the field. Recent work integrates sustainability into maintenance performance [100–103], proposes fuzzy sustainability assessment [104], surveys sustainable maintenance measures [105] and discusses triple-bottom-line dashboards [106]. In oil and gas, sustainability has been incorporated into the performance assessment of offshore facilities [107], maintenance management systems for upstream operations have been reviewed [16] and refinery maintenance indicators have been prioritized with fuzzy TOPSIS and AHP [108]. Studies have linked maintenance to productivity and profitability [109], examined maintenance in specific industries [110], applied lean thinking [111], described maintenance excellence [15], surveyed maintenance practices [17] and reviewed advanced maintenance services [43] and the contributions of maintenance to sustainable manufacturing [44]. Conceptual models have linked materials readiness to maintenance-driven supply chain performance [112] and inventory availability to plant uptime in energy facilities [113], showing that maintenance performance depends on the supply of spares as well as on task selection. Maintenance personnel qualification [47] and training effectiveness [114] complete the organizational picture.
Total productive maintenance and overall equipment effectiveness (OEE) provide an alternative perspective that emphasizes operator involvement and loss elimination [115]. Reviews of OEE [116, 117], practical guidance on OEE as a measure of operational improvement [118], cross-functional teams [119], line-level OEE [120], overall resource effectiveness [121] and performance measurement systems [122] describe the approach. Case studies cover TPM implementation [123], OEE assessment for improvement potential [124], workover rigs in oilfields [125], process industries [126], fuzzy OEE [127], micro downtime [128], TPM in flexible manufacturing [129], TQM and TPM [130], the five-whys technique [131] and mining equipment [132].
All of these approaches depend on maintenance data. Computerized maintenance management systems (CMMS) support decision making [133, 134], but the work orders they hold are often incomplete, inconsistently coded and written in free text [34, 40]. Methods for cleaning historical work-order data for reliability analysis [35], categorization errors in data entry [36], technical language processing [135–137], the derivation of key performance indicators from work orders [138, 139] and automated data collection to improve data quality [140] have been reported. Machine learning and data-driven methods for industrial automation and process control [141] and interpretable machine learning for early failure prediction in distributed energy assets [142] offer further ways to extract failure information, but they too depend on the quality of the underlying records. These studies show that the data needed to estimate failure models are rarely available in the volume and quality that optimization models assume.
2.4Ageing, corrosion and damage mechanisms
Ageing of process plant has been studied systematically by the UK Health and Safety Executive, which defined ageing as deterioration that affects safety and integrity and proposed management principles for equipment containing hazardous fluids or pressure [1, 2]. Life extension decision making for safety-critical systems has been reviewed [3], and condition assessment, remaining useful life prediction and selection of life extension strategies have been studied for ageing offshore assets [4, 5], together with guidelines for asset management of offshore facilities [143]. Integrated risk and asset management with RBI has been applied in oil and gas [26], and the reliability and integrity management of fired heaters, boilers and furnaces in upstream oil and gas has been reviewed [12].
Internal carbon dioxide corrosion is the dominant degradation mechanism in many production systems. Studies of this mechanism have addressed the transition between low and supercritical partial pressures [144], iron carbonate morphology [145], the effects of impurities [146, 147], pipeline steels in dense CO2 [148, 149] and oil-water emulsion flow [150]. Protection strategies against internal corrosion [151], corrosion rate prediction for carbon steel in oil and gas environments [39], localized corrosion and mitigation in oil and gas steels [152] and internal corrosion in oil pipelines [153] have been described. Microbiologically influenced corrosion has been reviewed in terms of mechanisms [154] and studied on buried pipelines [155]. Corrosion management and material selection for crude oil export equipment in marine environments have also been reviewed [156]. Gathering pipelines in mature fields show strong section-to-section differences in corrosion [38], and failures of elbows and welds in gathering systems have been analysed [157].
Erosion-corrosion arises where sand and high velocities coexist. Studies have addressed the synergy between erosion and corrosion in CO2 [158], shale gas production pipe [159], materials for the resources industry [160], oil-sand slurries [161], passive carbon steel [162], elbows [163], water injection lines [164], sand fines [165], intermittent flow [166], steels in crude oil [167], velocity effects [168] and experimental methods [169]. Because erosion-corrosion is driven by entrained solids, CFD-driven design of fluid-particle separation and filtration systems is relevant to its control upstream of the affected piping [170]. Corrosion under insulation (CUI) is a further major mechanism for ageing plant, reviewed as a critical issue for the oil and gas industry [171, 172] and addressed by guidelines and standards [173–175]. Experimental and field studies have examined CUI severity and detection [176], marine environments [177], refinery failures [178], Arabian Gulf exposure [179], dissolved metal ions [180], drain holes in jacketing [181], fuzzy prediction of CUI [182], non-destructive inspection of insulated equipment [183] and piping reliability under CUI [184].
Atmospheric storage tanks suffer floor and shell corrosion and are associated with fire and explosion accidents. Reviews of tank accidents [9, 10], fire scenarios [185], external floating roof tanks [186], recent fuel storage fires [187], oil depot accidents [188], catastrophic failures [189], the Buncefield incident [11], hazard assessment [190], fire risk management [191], fixed-roof tank explosions [192] and buckling under fire [193] show why tank integrity matters. Tank design follows API Standard 650 [194].
2.5Risk-based inspection, fitness-for-service and remaining strength
Risk-based inspection prioritizes inspection by the probability and consequence of failure and has been integrated with asset management in oil, gas and petrochemical plants [26]; inspection of pressure vessels follows API 510 [24]. An early risk-based model for inspection and maintenance of cross-country petroleum pipelines [195] was followed by a risk-based inspection concept for fitness-for-service assessment of ageing pressure vessels on offshore joint venture facilities [27], optimal inspection planning for onshore pipelines subject to external corrosion [196], probabilistic modelling of corroded pipelines at inspection time [197] and models of non-destructive testing results in RBI [198]. Bayesian approaches to the failure risk of oil and gas pipelines have been reviewed [199], and sustainability-based risk analysis of pipelines has been proposed [200]. Reviews of pipeline failure prediction models [201], failure analyses of pipelines in oil and gas [6, 202] and in-line inspection, corrosion growth rate and data management [203, 204] support inspection planning, as do comparisons of discontinuity inspection methods [205] and analyses of composite repairs [206]. Reviews of NDT-based integrity management and corrosion risk assessment for refinery process equipment [30], of NDT methods for predictive failure analysis in mechanical systems [207] and of non-intrusive inspection of pressure vessels, which reduces shutdown frequency and operating cost [208], describe the techniques that determine inspection effectiveness. Where corrosion damage is repaired by welding, NDT methods for weld integrity evaluation [209] and welding inspection standards and quality assurance practices [210] govern the acceptance of the repair. For buried lines, GIS applications in utility asset management [211] and UAV-based pipeline and corridor monitoring [212] supply the location and external condition data that inspection planning requires.
Fitness-for-service assessment under API 579-1/ASME FFS-1 [25, 213], including fatigue assessment [214], and failure assessment diagrams [215–218] determine whether a degraded component can remain in service; applications include pressure vessels with crack-like flaws [219]. Flaw assessment under BS 7910 [220], the remaining strength of corroded pipelines under ASME B31G [221, 222], DNV-RP-F101 [223], CSA Z662 [224] and best practice for pipeline defect assessment [225] provide the codified methods. A large literature evaluates burst pressure models for corroded pipelines [226–230], develops limit load solutions [231], finite element and numerical analyses [232–235], failure pressure methods [236, 237], interaction rules for multiple defects [238], models for flawless and high-strength pipes [239, 240], fracture equations [241], metal-loss criteria [242], residual strength and life prediction [243], reliability analyses [244, 245] and machine-learning predictors [246–250].
2.6Maintenance and inspection optimization models
Reviews of maintenance optimization classify models by system structure, degradation model, decision variables and criteria [31, 32, 251], and surveys of maintainability and replacement [252], multi-unit systems [253], multi-component systems [254, 255] and the chemical and process industries [33] show the breadth of the field. Classical age and periodic replacement policies are set out in maintenance theory [256], discrete replacement policies [257], random maintenance policies [258] and replacement first or last [259]. Recent work has examined continuous versus discrete scheduled times [260], two failure modes [261], age replacement versus minimal repair [262], discrete-time age replacement for phase-type lifetimes [263], coherent systems [264], dependent components [265], one-cycle criteria [266], random working cycles [267], hybrid preventive maintenance under competing failures [268] and age-based group maintenance of degrading units [269].
The delay-time concept, in which a defect becomes detectable some time before it causes failure, underpins inspection interval optimization. Its development by Christer and colleagues [270–272], reviews of delay-time operational research [37, 273], the delay time modelling framework [274], parameter estimation from deficient data [275], subjective estimation of the delay-time distribution [276] and applications in manufacturing [277] established the method. Extensions include a safety constraint [278], two types of inspections [279], three-stage failure processes [280], multi-component and multi-failure mode models [281], renewal ergodicity in block inspection [282], postponed replacement [283], two-phase inspection of preparedness systems [284], inspection for maximum future reliability [285], concrete structures [286], inspection policies for production facilities [287], fixed periodic schedules [288], fully subjective approaches [289], multi-criteria determination of inspection intervals [290] and joint optimization with spare parts [291, 292].
Multi-component systems with economic dependence allow maintenance to be grouped or performed opportunistically. Reviews of economic dependence [293], dynamic influences [294], control policies [295], generalized group maintenance [296], opportunistic replacement [297] and opportunistic maintenance [298] define the area. Dynamic grouping [299–302], condition-based multi-component maintenance [303–312], inspection and opportunistic replacement [313], non-homogeneous opportunity arrivals [314], utility systems [315], multistage manufacturing [316], variable horizons [317], dependent main and auxiliary components [318], gravity windows [319], delay-time opportunistic scheduling [320], offshore riser grouping [321], geographically dispersed assets [322], load sharing [323, 324], redundant systems [325], multi-system networks [326], manufacturing systems [327], opportunistic planning frameworks [328], component importance [329], two-component inspection with failure interaction [330–332], block replacement with failure dependence [333], genetic algorithms and Monte Carlo simulation [334, 335], human factors in grouping [336, 337] and joint maintenance and spare parts optimization [338, 339] have been studied. Supply chain studies for gas processing plants extend this link between maintenance and materials to procurement, supply chain resilience and supply chain risk management [340–342].
Failure data analysis for repairable systems connects these models to field data. Trend testing for failure-limited data [343], selection of time-to-failure models by trend analysis [344], power law processes estimated by expectation-maximization [345], unobserved heterogeneity in power law processes [346], non-homogeneous Poisson processes with frailty [347, 348], censored data [41], imperfect repair models [349–352] and past-dependent partial repairs [353] have been reported. Life-cycle cost and maintenance cost analyses include condition-based maintenance enabled by prognostics [354], importance analysis guided maintenance of repairable systems [355], cost-based importance analysis under different maintenance strategies [356], cost-benefit optimization of maintained structures by renewal models [357] and Bayesian updating of infrastructure reliability from condition data [358]. Equipment-specific studies relevant to production facilities address gas pressure-regulating installations [359], hydro-turbines [360], heat exchanger fouling [361–364], gas turbine and power machinery prognostics [365–367], centrifugal compressor degradation [368] and competing failure processes [369].
Maintenance itself can introduce failures. Human error has been incorporated into maintenance models [370], analysed in pre- and post-maintenance risk [371], integrated into condition-based maintenance optimization [372], evaluated in nuclear plants [373] and assessed by human reliability methods for refineries [374]. Integration of human factors into process hazard analysis [375] and the perceptions of maintenance personnel on petroleum production facilities [376] show that maintenance and safety are closely linked. Conceptual models for incident prevention in industrial maintenance engineering [377], for data-driven occupational safety risk control in large energy projects [378] and for balancing productivity and safety compliance in high-risk drilling [379] make the same point at the organizational level.
2.7Research gap
The literature offers mature methods for each element of maintenance and integrity management, but four gaps limit their use on ageing onshore facilities. First, RCM, RBI and proof-test optimization are usually applied separately, so their combined effect on facility cost and risk is not evaluated [23, 26, 33]. Second, optimal intervals are usually computed under stationary assumptions, whereas corrosion rates and hidden-failure rates rise with facility age and water cut [1, 3, 38]. Third, risk constraints for safety and environmental consequences are seldom imposed explicitly in interval optimization, although the delay-time literature has shown how this can be done [81, 278]. Fourth, the effect of maintenance data quality on the value of optimization is rarely quantified, even though work-order studies show that data problems are widespread [34, 36, 40]. The framework presented next addresses each of these gaps.
3Methods
This section describes the integrated framework, the representative facility, the models used for active, static and hidden failure modes, the three maintenance strategies that were compared, the data quality experiment and the computational implementation. The framework follows the RCM requirement that each failure mode be assigned a task that is applicable and effective given its consequences [18, 19], and the mechanical integrity requirement that static equipment be inspected on the basis of risk and remaining life [24, 27]. The models are deliberately standard so that the contribution lies in their integration and in the treatment of ageing rather than in new mathematics: renewal-reward and delay-time models for active failure modes [37, 256], a stochastic wall-thinning model with imperfect inspection for static equipment [196–198] and an age-dependent average probability of failure on demand for hidden failures [278]. All parameter values are representative values chosen within ranges reported in the literature cited for each equipment type; they are not field data from a specific facility, and the results should be read as a demonstration of the framework rather than as estimates for any particular site.
3.1Integrated framework
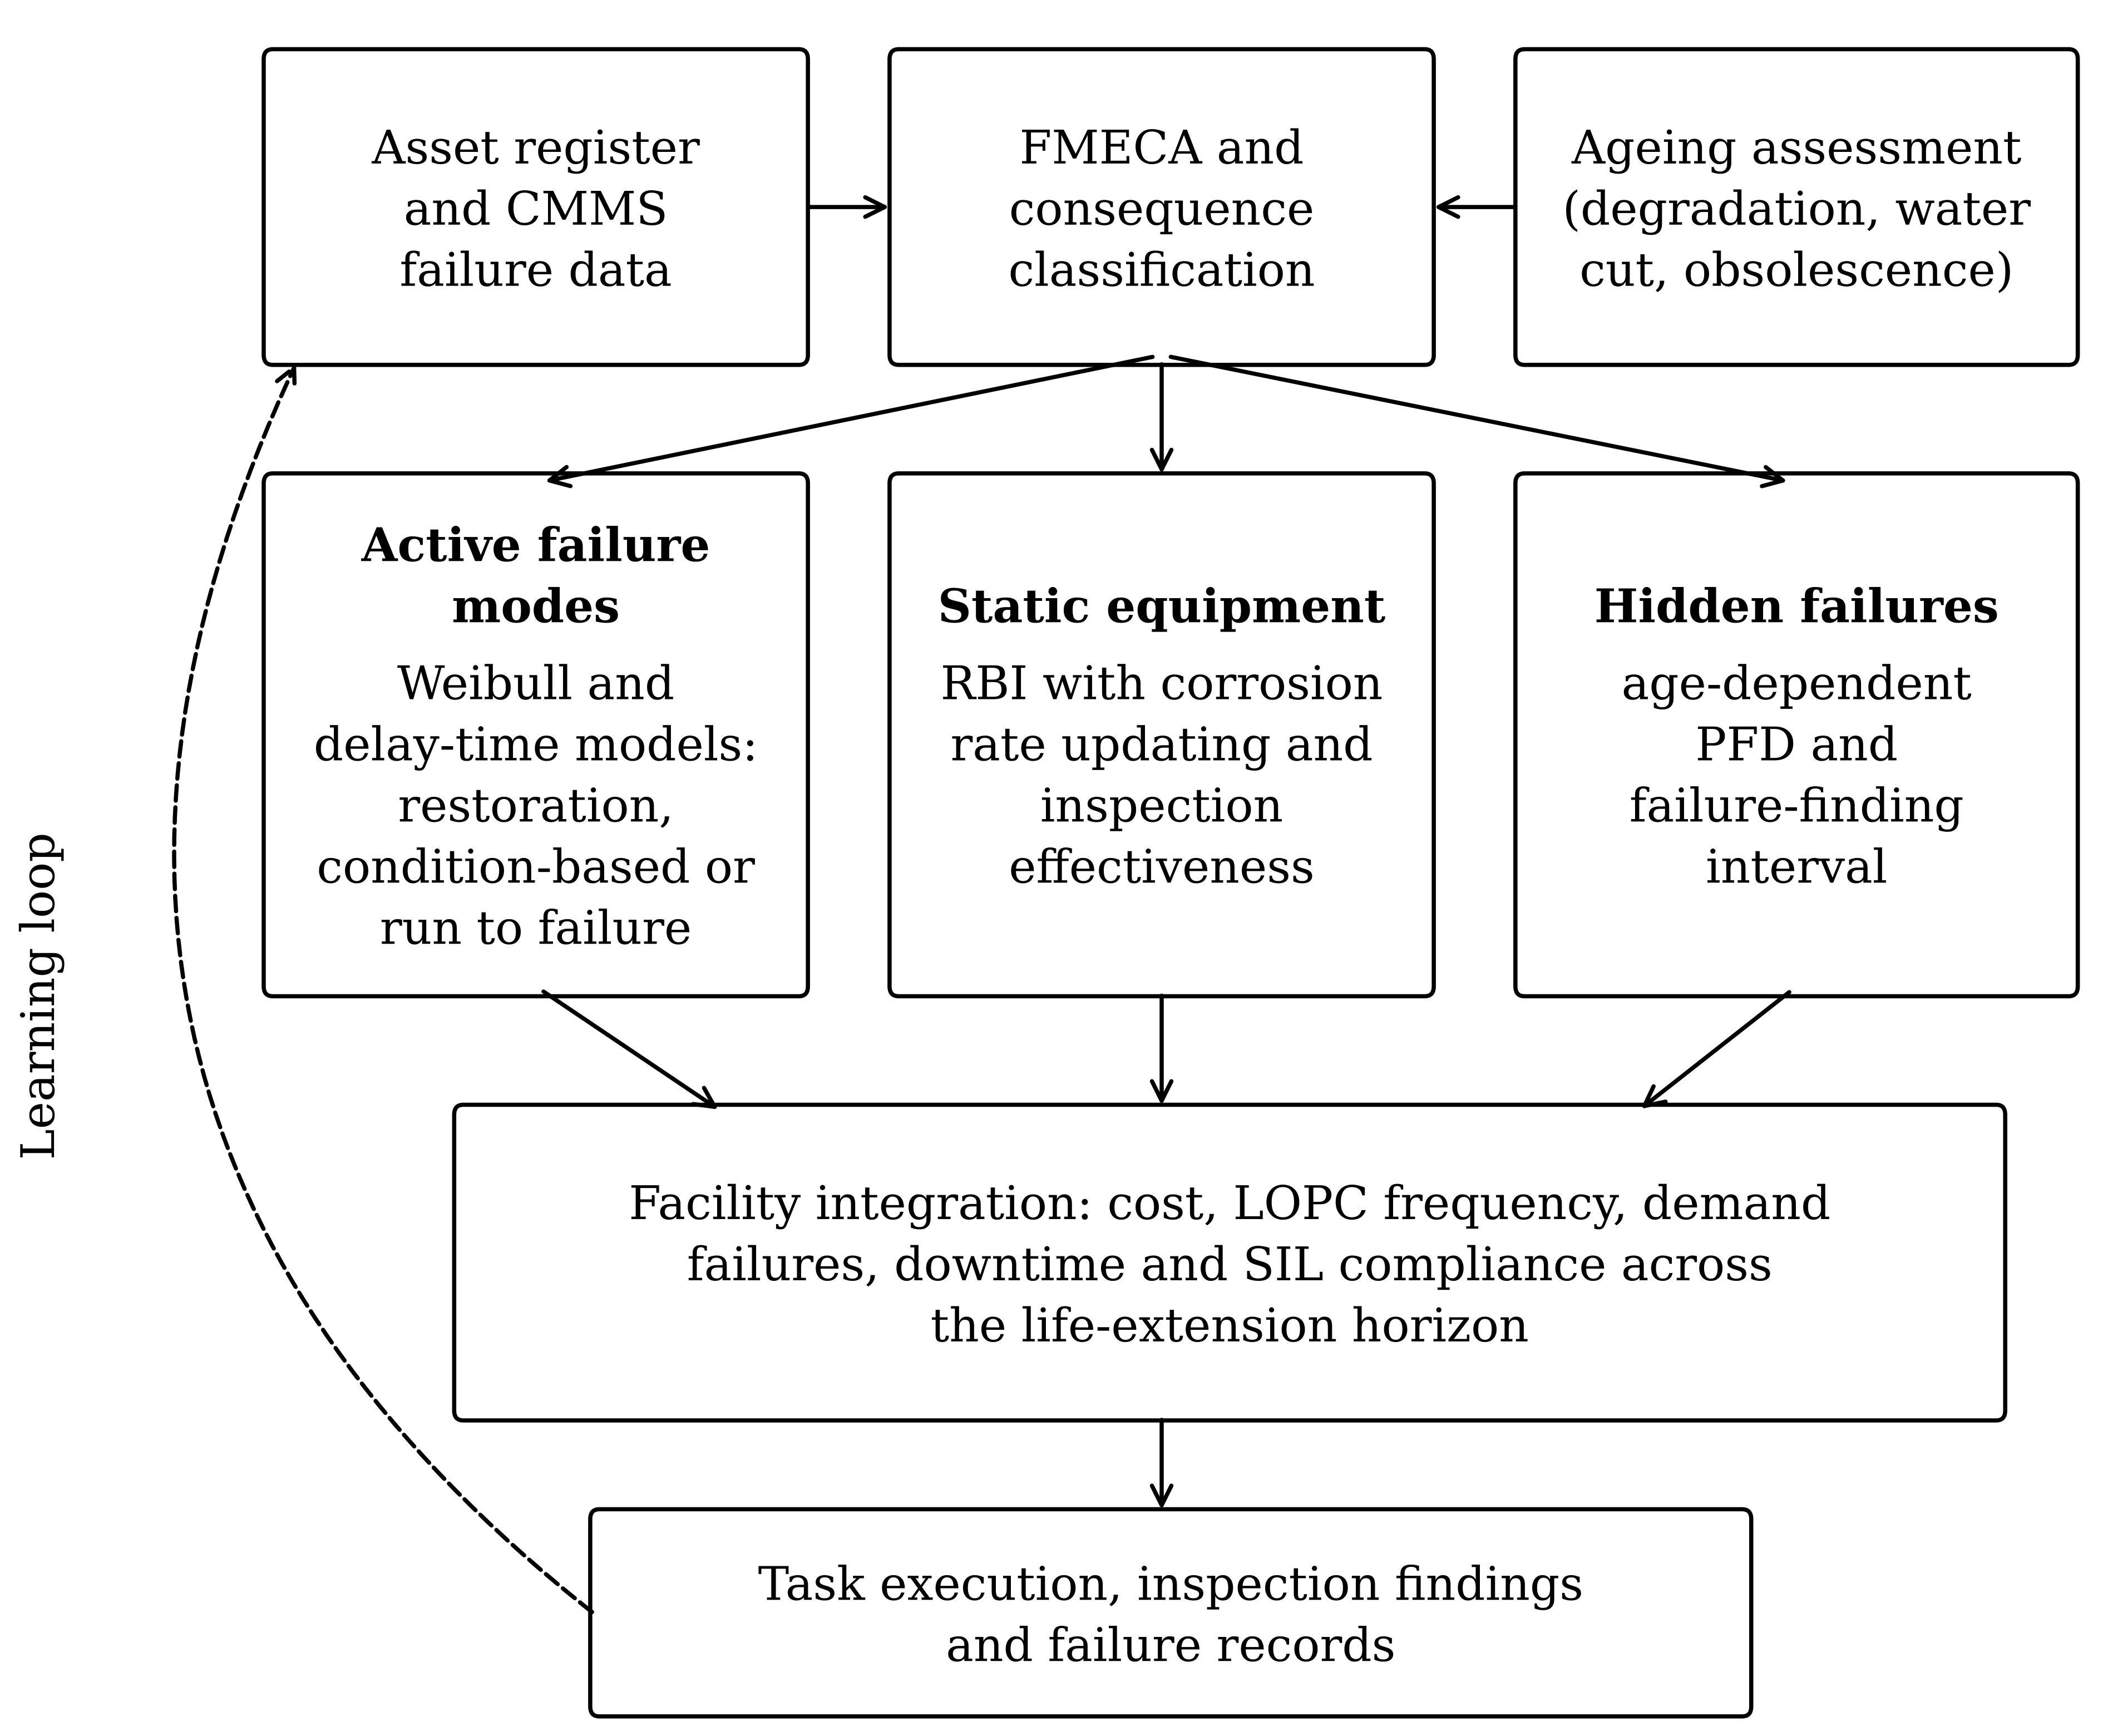
Figure 1 shows the framework. The asset register and CMMS failure records, the failure modes, effects and criticality analysis (FMECA) and an ageing assessment that covers degradation mechanisms, water cut and obsolescence feed a consequence classification of each failure mode as safety, environmental or operational, and as evident or hidden [1, 18, 92]. Active failure modes, which are evident and arise in rotating and fired equipment, are assigned to run-to-failure, scheduled restoration or condition-based tasks by renewal-reward and delay-time models [256, 270]. Static equipment, whose dominant failure mechanisms are corrosion and erosion, is managed by RBI with corrosion-rate updating and explicit inspection effectiveness [26, 203]. Hidden failures of protective devices are managed by failure-finding tasks with age-dependent intervals [3]. The three streams are integrated at facility level to give cost, loss of primary containment (LOPC) frequency, failures on demand, equipment downtime and SIL compliance across the life-extension horizon, and task execution, inspection findings and failure records return to the CMMS through a learning loop [34, 35].
3.2Representative facility
The representative facility is an onshore oil and gas production and processing site that has been in service for 25 years and is to be operated for a further 15 years, to age 40. It comprises reciprocating gas compressors driven by gas engines, crude transfer and water injection pumps, heater-treaters, separators, produced-water and gas piping, buried flowlines, crude storage tanks and the associated safety instrumented and relief systems. Equipment counts and failure modes were chosen to reflect such sites, drawing on reported failure behaviour of gas compressors [22, 53], compressor and turbine degradation [365, 368], heat transfer and fired equipment [12, 361, 362], corrosion in gathering and production systems [38, 157] and storage tanks [9, 189]. Costs are in 2022 United States dollars and include parts, labour, lost production and clean-up for failures, but exclude any monetary valuation of injury, which is reported separately as event frequencies. Cash flows were discounted at 8 percent per year when net present values are reported [354, 357].
3.3Active failure modes
Six active failure modes were modelled (Table 1). For each, a defect initiates at a random age that follows a Weibull distribution and becomes a functional failure after a delay time that follows an exponential distribution [37, 270, 274]:
where and are the Weibull shape and scale parameters and is the mean delay time. Three task types were considered. Under run to failure, the item is renewed at failure, time , at failure cost . Under scheduled restoration, the item is restored at age at preventive cost if it has not failed. Under condition-based maintenance, the item is monitored at interval at cost per check, and each check during the delay window detects the defect with probability , after which it is restored at cost [279, 280, 288]. The long-run cost rate of each policy was evaluated by the renewal-reward theorem [256, 357]:
estimated by simulating 60,000 renewal cycles per policy, with the cycle length including the downtime of corrective or planned work. For scheduled restoration without monitoring this reduces to the classical age replacement expression [256, 260]:
where is the survival function of the time to failure. Following the RCM consequence logic and the delay-time model with a safety constraint [18, 278], the selected task minimized subject to a cap on the failure rate for modes with safety or environmental consequences:
with set at 0.005 failures per item-year for safety consequences and 0.25 per item-year for environmental consequences. Restoration ages were searched from 0.1 to 2 times and monitoring intervals from 0.1 to 1.5 times .
| Code | Failure mode | Items | Consequence | Shape, scale (yr) | Delay (d) | Cp / Cf / Ci (USD k) | Detection |
|---|---|---|---|---|---|---|---|
| R1 | Reciprocating compressor valves | 4 | Operational | 1.8, 1.6 | 29 | 10 / 70 / 0.4 | 0.85 |
| R2 | Compressor main bearing and crosshead | 4 | Operational | 2.6, 7.0 | 91 | 55 / 380 / 1.2 | 0.75 |
| R3 | Gas engine driver top end | 4 | Operational | 3.2, 3.5 | 55 | 45 / 160 / 0.8 | 0.70 |
| R4 | Crude transfer pump mechanical seal | 6 | Environmental | 1.3, 2.2 | 18 | 6 / 38 / 0.3 | 0.60 |
| R5 | Water injection pump plunger packing | 4 | Operational | 1.6, 1.2 | 22 | 5 / 25 / 0.3 | 0.70 |
| R6 | Heater-treater fire tube | 5 | Safety | 3.5, 14.0 | 365 | 90 / 650 / 3.0 | 0.80 |
3.4Static equipment
Five static equipment classes were modelled (Table 2), covering internal CO2 corrosion of separators [39, 145], microbiologically influenced corrosion and pitting of produced-water piping [154, 155], corrosion under insulation of gas piping [171, 184], corrosion of crude storage tank floors [189, 194] and internal corrosion of buried flowlines [38, 153]. Each item has a wall-thinning rate drawn from a lognormal distribution with the class mean and coefficient of variation, representing item-to-item variability in fluids, flow and protection. The remaining wall thickness at facility age evolves as a gamma-type increment process [196, 357]:
where has unit mean and coefficient of variation 0.5, and is an acceleration factor that represents rising corrosivity as water cut increases in a maturing field [38, 164]:
with per year in the base case, so that corrosion rates double between ages 20 and 40. Loss of containment occurs when falls below a leak threshold ; the item is then repaired or replaced at failure cost and its wall is restored. Inspections measure the wall at the most corroded location with probability , the inspection effectiveness, and otherwise measure a less corroded location, so that the loss is underestimated by a random 20 to 60 percent; measurement error has a standard deviation of 0.2 mm [197, 198, 205]. Inspection effectiveness values of 0.5, 0.7 and 0.85 were used for spot ultrasonic thickness measurement, targeted thickness measurement and risk-based selection of techniques such as automated ultrasonic and guided wave testing, consistent with the effectiveness categories used in RBI and in reviews of NDT for predictive failure analysis [26, 183, 203, 207].
At each inspection the corrosion rate is estimated from the measurement . The long-term rate uses the wall loss since the item was last renewed, and the short-term rate uses the change since the previous inspection, following API 510 [24]:
where is the nominal wall, the age at renewal, the minimum required thickness and the estimated remaining life. Repair or replacement at cost restores the wall. The decision rules differ by strategy and are described under the strategies compared below.
| Code | Equipment and mechanism | Items | Nominal, minimum and leak wall (mm) | Mean rate (mm/yr) | CoV | Ci / Cr / Cf (USD k) |
|---|---|---|---|---|---|---|
| C1 | Separator vessels, internal CO2 corrosion | 8 | 16.0 / 10.0 / 5.0 | 0.18 | 0.5 | 8 / 180 / 2,200 |
| C2 | Produced-water piping, MIC and pitting | 24 | 7.1 / 3.0 / 1.0 | 0.12 | 0.7 | 2.5 / 45 / 450 |
| C3 | Gas piping, corrosion under insulation | 20 | 6.0 / 2.8 / 1.0 | 0.10 | 0.8 | 4 / 60 / 900 |
| C4 | Crude storage tank floors | 6 | 6.35 / 2.54 / 0.5 | 0.09 | 0.6 | 40 / 250 / 1,800 |
| C5 | Buried flowlines, internal corrosion | 40 | 6.0 / 2.5 / 1.0 | 0.11 | 0.7 | 3 / 35 / 350 |
To give every strategy the same starting condition, the history of each item from age 0 to age 25 was simulated under the legacy programme with common random numbers, and the strategies were applied from age 25. Each class was simulated with 1,500 replications of all items.
3.5Hidden failures
Three classes of protective devices were modelled (Table 3): pressure safety valves that fail to open, emergency shutdown (ESD) valves that fail to close and high-high level switches that fail on demand. Their dangerous undetected failure rates increase linearly with facility age, reflecting fouling, wax, scale and seal deterioration in produced-fluid service [3, 4]:
The average probability of failure on demand over a proof-test interval , with proof-test coverage and the untested fraction revealed only at overhaul every years, was approximated as [3, 278]:
The expected cost per device-year is the test cost plus the expected cost of failures on demand , where is the demand rate and the consequence cost. Minimizing this cost gives the familiar square-root interval, which was then constrained so that the SIL 2 limit of 0.01 is respected:
| Code | Device and failure mode | Items | Base failure rate (/yr) | Ageing factor (/yr) | Demand rate (/yr) | Consequence (USD M) | Test cost (USD k) |
|---|---|---|---|---|---|---|---|
| H1 | Pressure safety valves, fail to open | 60 | 0.003 | 0.04 | 0.02 | 3.0 | 1.8 |
| H2 | Emergency shutdown valves, fail to close | 25 | 0.008 | 0.04 | 0.10 | 1.5 | 2.2 |
| H3 | High-high level switches, fail on demand | 30 | 0.012 | 0.03 | 0.10 | 0.8 | 0.6 |
3.6Strategies compared
Table 4 defines the three strategies. S0 represents the legacy calendar programme typical of inherited maintenance plans [15, 16]. S1 represents a conventional RCM programme in which tasks and intervals are optimized once, using the historical average behaviour of the equipment, and then held constant [28, 29]. S2 is the integrated, age-adaptive programme proposed here. S1 and S2 use the same tasks for active failure modes, because Weibull renewal of rotating components is not affected by facility age in the model; they differ in the treatment of static equipment and hidden failures. For S1, the fixed inspection interval for each static class was chosen by simulation to minimize total cost under the assumption of no corrosion acceleration (), which mirrors the use of historical rates to set intervals. For S2, a baseline inspection campaign covers all static items within the first two years of the horizon, and each subsequent interval is half the estimated remaining life, using the greater of the long-term and short-term rates, bounded between one and ten years, as in API 510 practice [24]:
Items with below two years or are repaired. S2 uses more effective inspection techniques at 1.4 times the unit inspection cost, reflecting the higher cost of the automated and non-intrusive methods that reviews of pressure vessel inspection describe [208].
| Element | S0 Legacy calendar | S1 RCM, static intervals | S2 Integrated RCM and MI, age-adaptive |
|---|---|---|---|
| Active failure modes | Calendar overhauls (R1 2 yr, R2 5 yr, R3 2.5 yr), run to failure (R4, R5), 5-yearly fire tube inspection (R6) | RCM task selection with risk cap | Same as S1 |
| Static inspection interval | Fixed legacy (5 to 10 yr) | Optimized once assuming constant corrosion rate | Half remaining life, 1 to 10 yr, with baseline campaign |
| Corrosion rate used | Long-term | Long-term | Greater of long-term and short-term |
| Repair criterion | Measured wall below minimum | Wall projected below minimum before next inspection | Remaining life below 2 yr or wall below minimum |
| Inspection effectiveness | 0.5 | 0.7 | 0.85 at 1.4 times cost |
| Proof-test interval | Fixed (PSV 5 yr, ESD 1 yr, switches 1 yr) | Optimized once at historical average failure rate | Re-optimized each year at current failure rate, SIL 2 constrained |
| Proof-test coverage | 0.7 | 0.9 | 0.9 |
3.7Data quality experiment
To quantify the value of maintenance data, failure models for R2 and R3 were estimated from samples of , 10, 20, 40 and 80 records drawn from the true Weibull distribution, with random right-censoring that left about 40 percent of records as suspensions [41, 344]. The Weibull parameters were estimated by maximizing the censored log-likelihood [41, 347]:
where is the recorded time and equals one for a failure and zero for a suspension. The restoration age that is optimal for the estimated parameters was then applied to the true distribution, and the cost penalty relative to the true optimum was recorded over 400 replications; if the estimated shape parameter did not exceed 1.05, run to failure was selected, as RCM logic requires [18, 256]. A second experiment replaced 30 percent of records with misrecorded failures at random ages, representing the categorization and data entry errors reported in CMMS studies [35, 36, 40].
3.8Implementation
The models were implemented in Python with NumPy and SciPy. Renewal-reward cost rates were estimated from 60,000 simulated cycles per policy with fixed random seeds, static equipment from 1,500 replications per class with common random numbers across strategies, and the corrosion acceleration sensitivity from 800 replications per class for between 0 and 0.10 per year. The Monte Carlo standard error of the facility-level expected LOPC count was below 2 percent of its mean in all strategies. Simulation of maintained systems in this way follows established practice in maintenance optimization [31, 334, 335]. Intervals were rounded to whole days for monitoring tasks, to hundredths of a year for restorations and to whole years for static inspections, so that the reported policies can be scheduled directly in a CMMS.
4Results
This section reports the RCM task selection for active failure modes, the performance of the static equipment strategies, the proof-test results for hidden failures, the facility-level comparison, the sensitivity to corrosion acceleration and the data quality experiment. Results are reported as expected values over the 15-year horizon from age 25 to age 40 unless stated otherwise, consistent with the life-cycle perspective adopted in cost-based maintenance studies [354, 357]. Because the inputs are representative rather than site-specific, the relative differences between strategies are more informative than the absolute values, an interpretation that is standard for comparative maintenance policy studies [31, 32].
4.1RCM task selection for active failure modes
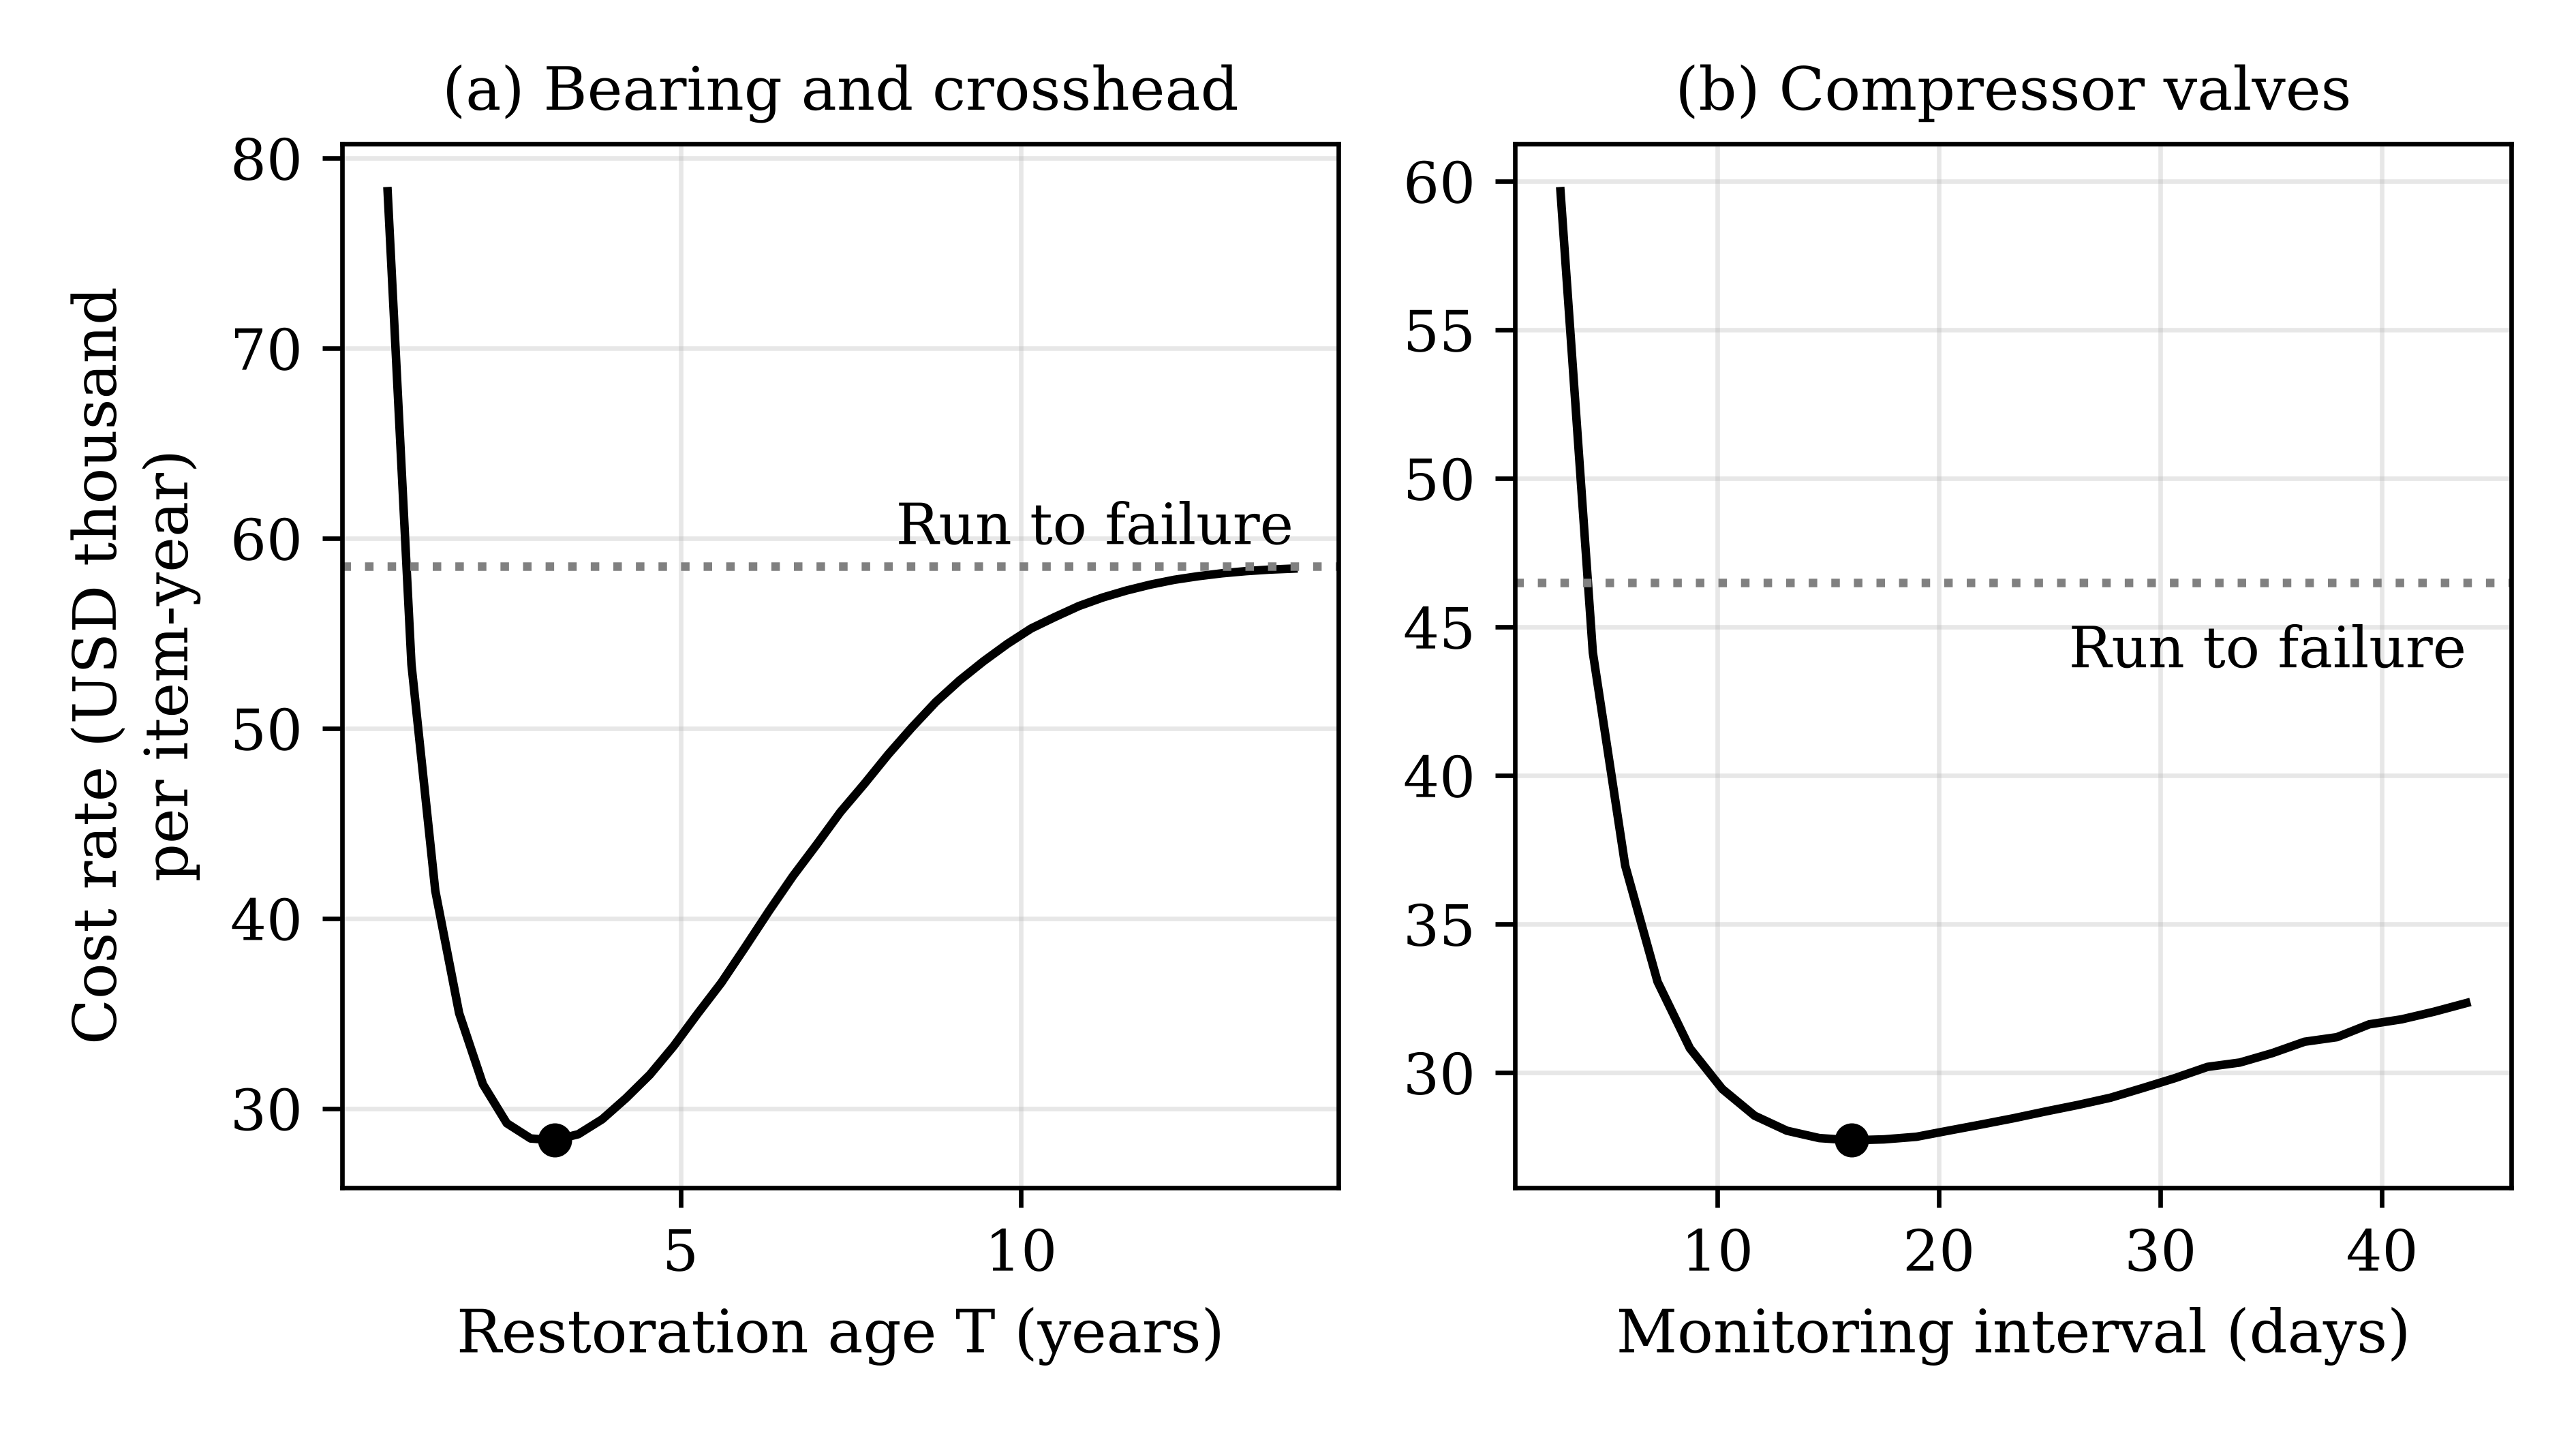
Table 5 shows the task selected for each active failure mode. Condition-based monitoring was selected for the compressor valves and the transfer pump seals, at intervals of about 16 and 15 days, which correspond to routine monitoring rounds or online monitoring. Scheduled restoration was selected for the compressor bearings and crossheads at 3.15 years, the gas engine top end at 2.1 years, the water injection pump packing at 0.66 years and the heater-treater fire tubes at 5.6 years. For the fire tubes, the risk cap was binding: the legacy 5-yearly inspection gave 0.065 failures per item-year, thirteen times the cap, whereas scheduled restoration at 5.6 years gave 0.004. Figure 2 shows the cost-rate curves for two modes. For the compressor bearings, the cost rate has a clear minimum at 3.15 years that is less than half the run-to-failure cost rate, which reflects the strong wear-out () and the large ratio of failure to preventive cost [256, 260]. For the compressor valves, the cost rate is flat between about 12 and 25 days, so the monitoring interval can be set by practical considerations within that band.
| Code | Selected task | Interval | Legacy cost (USD k/yr) | RCM cost (USD k/yr) | Legacy failures (/yr) | RCM failures (/yr) |
|---|---|---|---|---|---|---|
| R1 | Condition-based | 16 d | 40.8 | 27.7 | 0.556 | 0.196 |
| R2 | Scheduled restoration | 3.15 yr | 33.8 | 28.3 | 0.067 | 0.032 |
| R3 | Scheduled restoration | 2.1 yr | 31.1 | 30.3 | 0.104 | 0.072 |
| R4 | Condition-based | 15 d | 18.3 | 18.1 | 0.481 | 0.242 |
| R5 | Scheduled restoration | 0.66 yr | 22.0 | 17.9 | 0.880 | 0.474 |
| R6 | Scheduled restoration | 5.6 yr | 43.7 | 18.5 | 0.065 | 0.004 |
At facility level, RCM task selection reduced the 15-year cost of the active failure modes from USD 12.58 million to USD 9.28 million, or 26 percent, and the expected number of failures from 144.6 to 68.6, or 53 percent. Failures with safety or environmental consequences fell from 48.2 to 22.1. Equipment downtime fell from 28.0 to 24.1 item-days per year; the reduction was smaller than the reduction in failures because the selected restorations themselves take equipment out of service.
4.2Static equipment
Table 6 reports the static equipment results by class. Over the 15-year horizon, the legacy programme produced 16.9 expected LOPC events, of which 3.8 had safety consequences. S1 reduced these to 7.1 and 1.3, and S2 to 4.6 and 0.9. Relative to S1, S2 reduced LOPC by 35 percent and safety LOPC by 26 percent. The optimized fixed intervals in S1 were 7 years for separators and produced-water piping, 5 years for CUI-prone gas piping and 8 years for tank floors and flowlines. The largest absolute reductions were in buried flowlines and produced-water piping, which have many items, high variability in corrosion rate and relatively low inspection cost per item.
| Code | S1 interval (yr) | S0 LOPC | S1 LOPC | S2 LOPC | S0 cost (USD M) | S1 cost (USD M) | S2 cost (USD M) |
|---|---|---|---|---|---|---|---|
| C1 | 7 | 0.29 | 0.10 | 0.07 | 1.51 | 1.43 | 1.57 |
| C2 | 7 | 3.72 | 1.58 | 1.02 | 2.20 | 1.52 | 1.47 |
| C3 | 5 | 3.48 | 1.17 | 0.88 | 3.70 | 2.13 | 2.03 |
| C4 | 8 | 0.77 | 0.28 | 0.14 | 1.99 | 1.73 | 1.99 |
| C5 | 8 | 8.60 | 3.94 | 2.47 | 3.81 | 2.53 | 2.44 |
| Total | 16.86 | 7.07 | 4.59 | 13.20 | 9.34 | 9.50 |
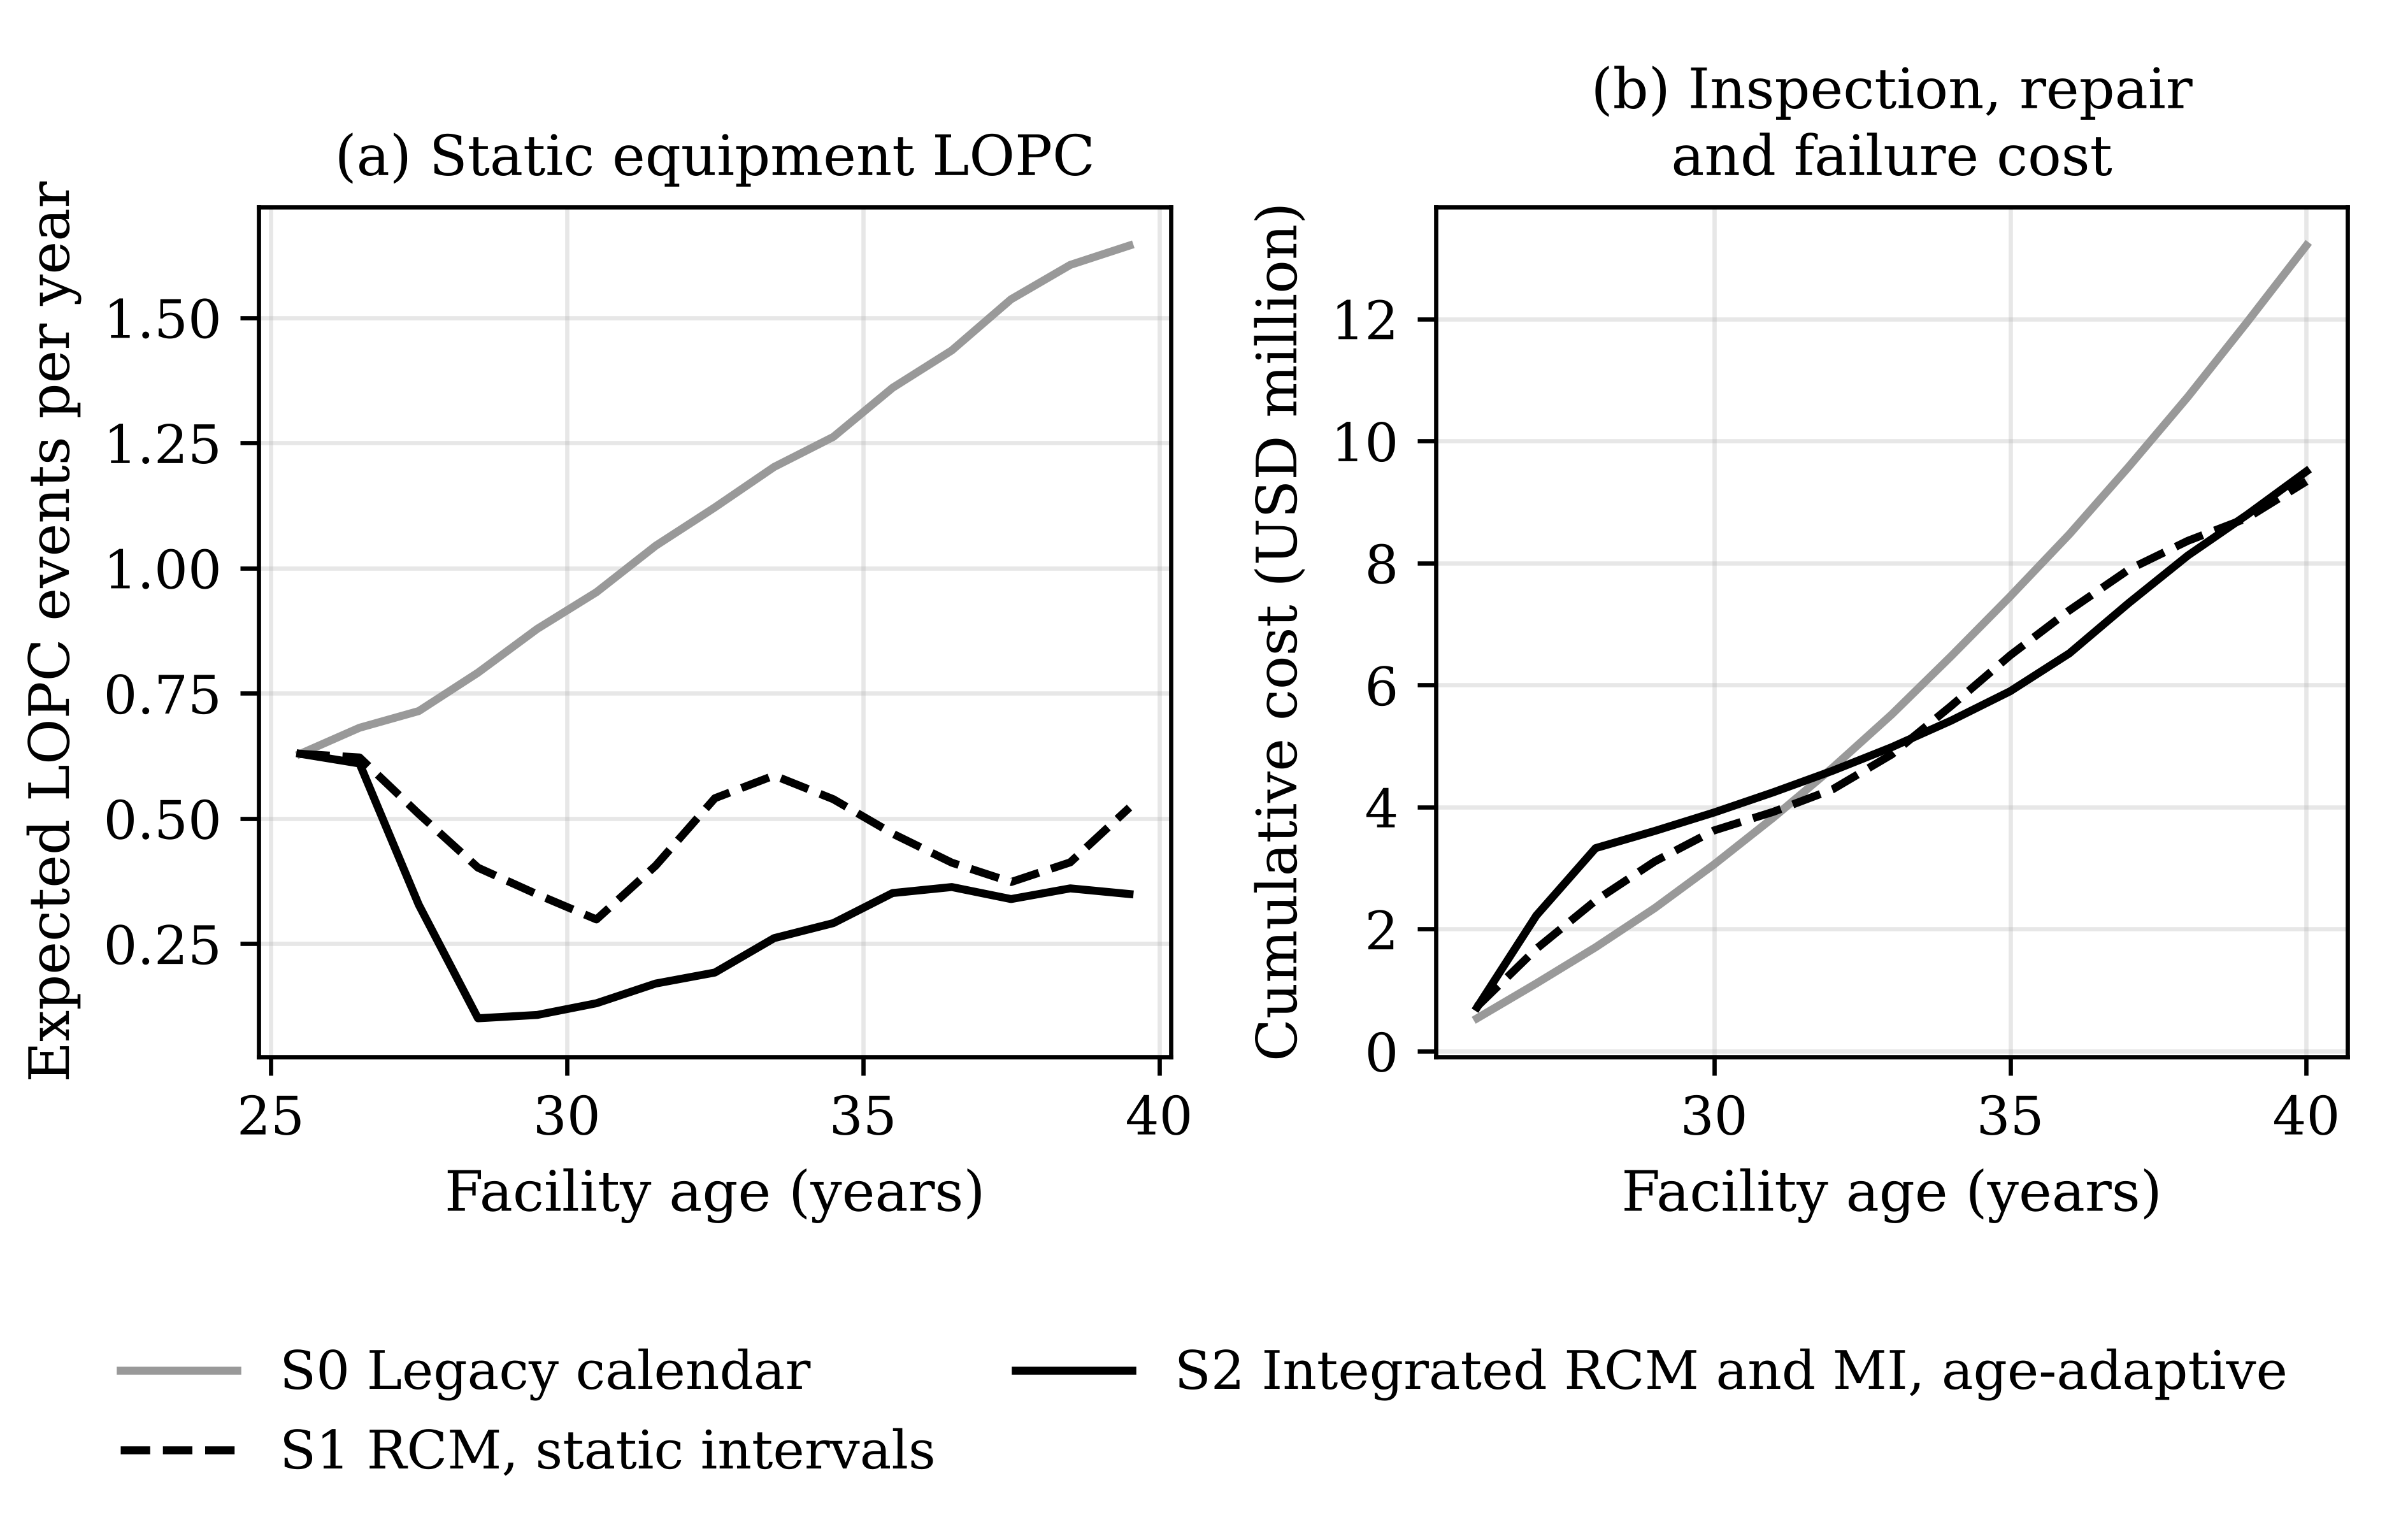
Figure 3 shows how the strategies diverge over time. Under S0, the expected LOPC frequency rises steadily from 0.63 per year at age 25 to 1.65 per year at age 40, because fixed intervals and spot inspections cannot keep pace with accelerating corrosion. Under S1, the frequency falls after the first inspections but rises again in the middle of the horizon as intervals set for historical corrosion rates become too long. Under S2, the baseline campaign brings the frequency down to about 0.1 per year by age 28, after which it rises slowly to about 0.35 per year as acceleration continues. The cumulative static cost of S2 is higher than that of S1 in the early years because of the baseline campaign, but the two converge by age 40 at about USD 9.3 to 9.5 million, and both are well below the USD 13.2 million of S0, whose costs are dominated by failures [14, 26].
4.3Hidden failures
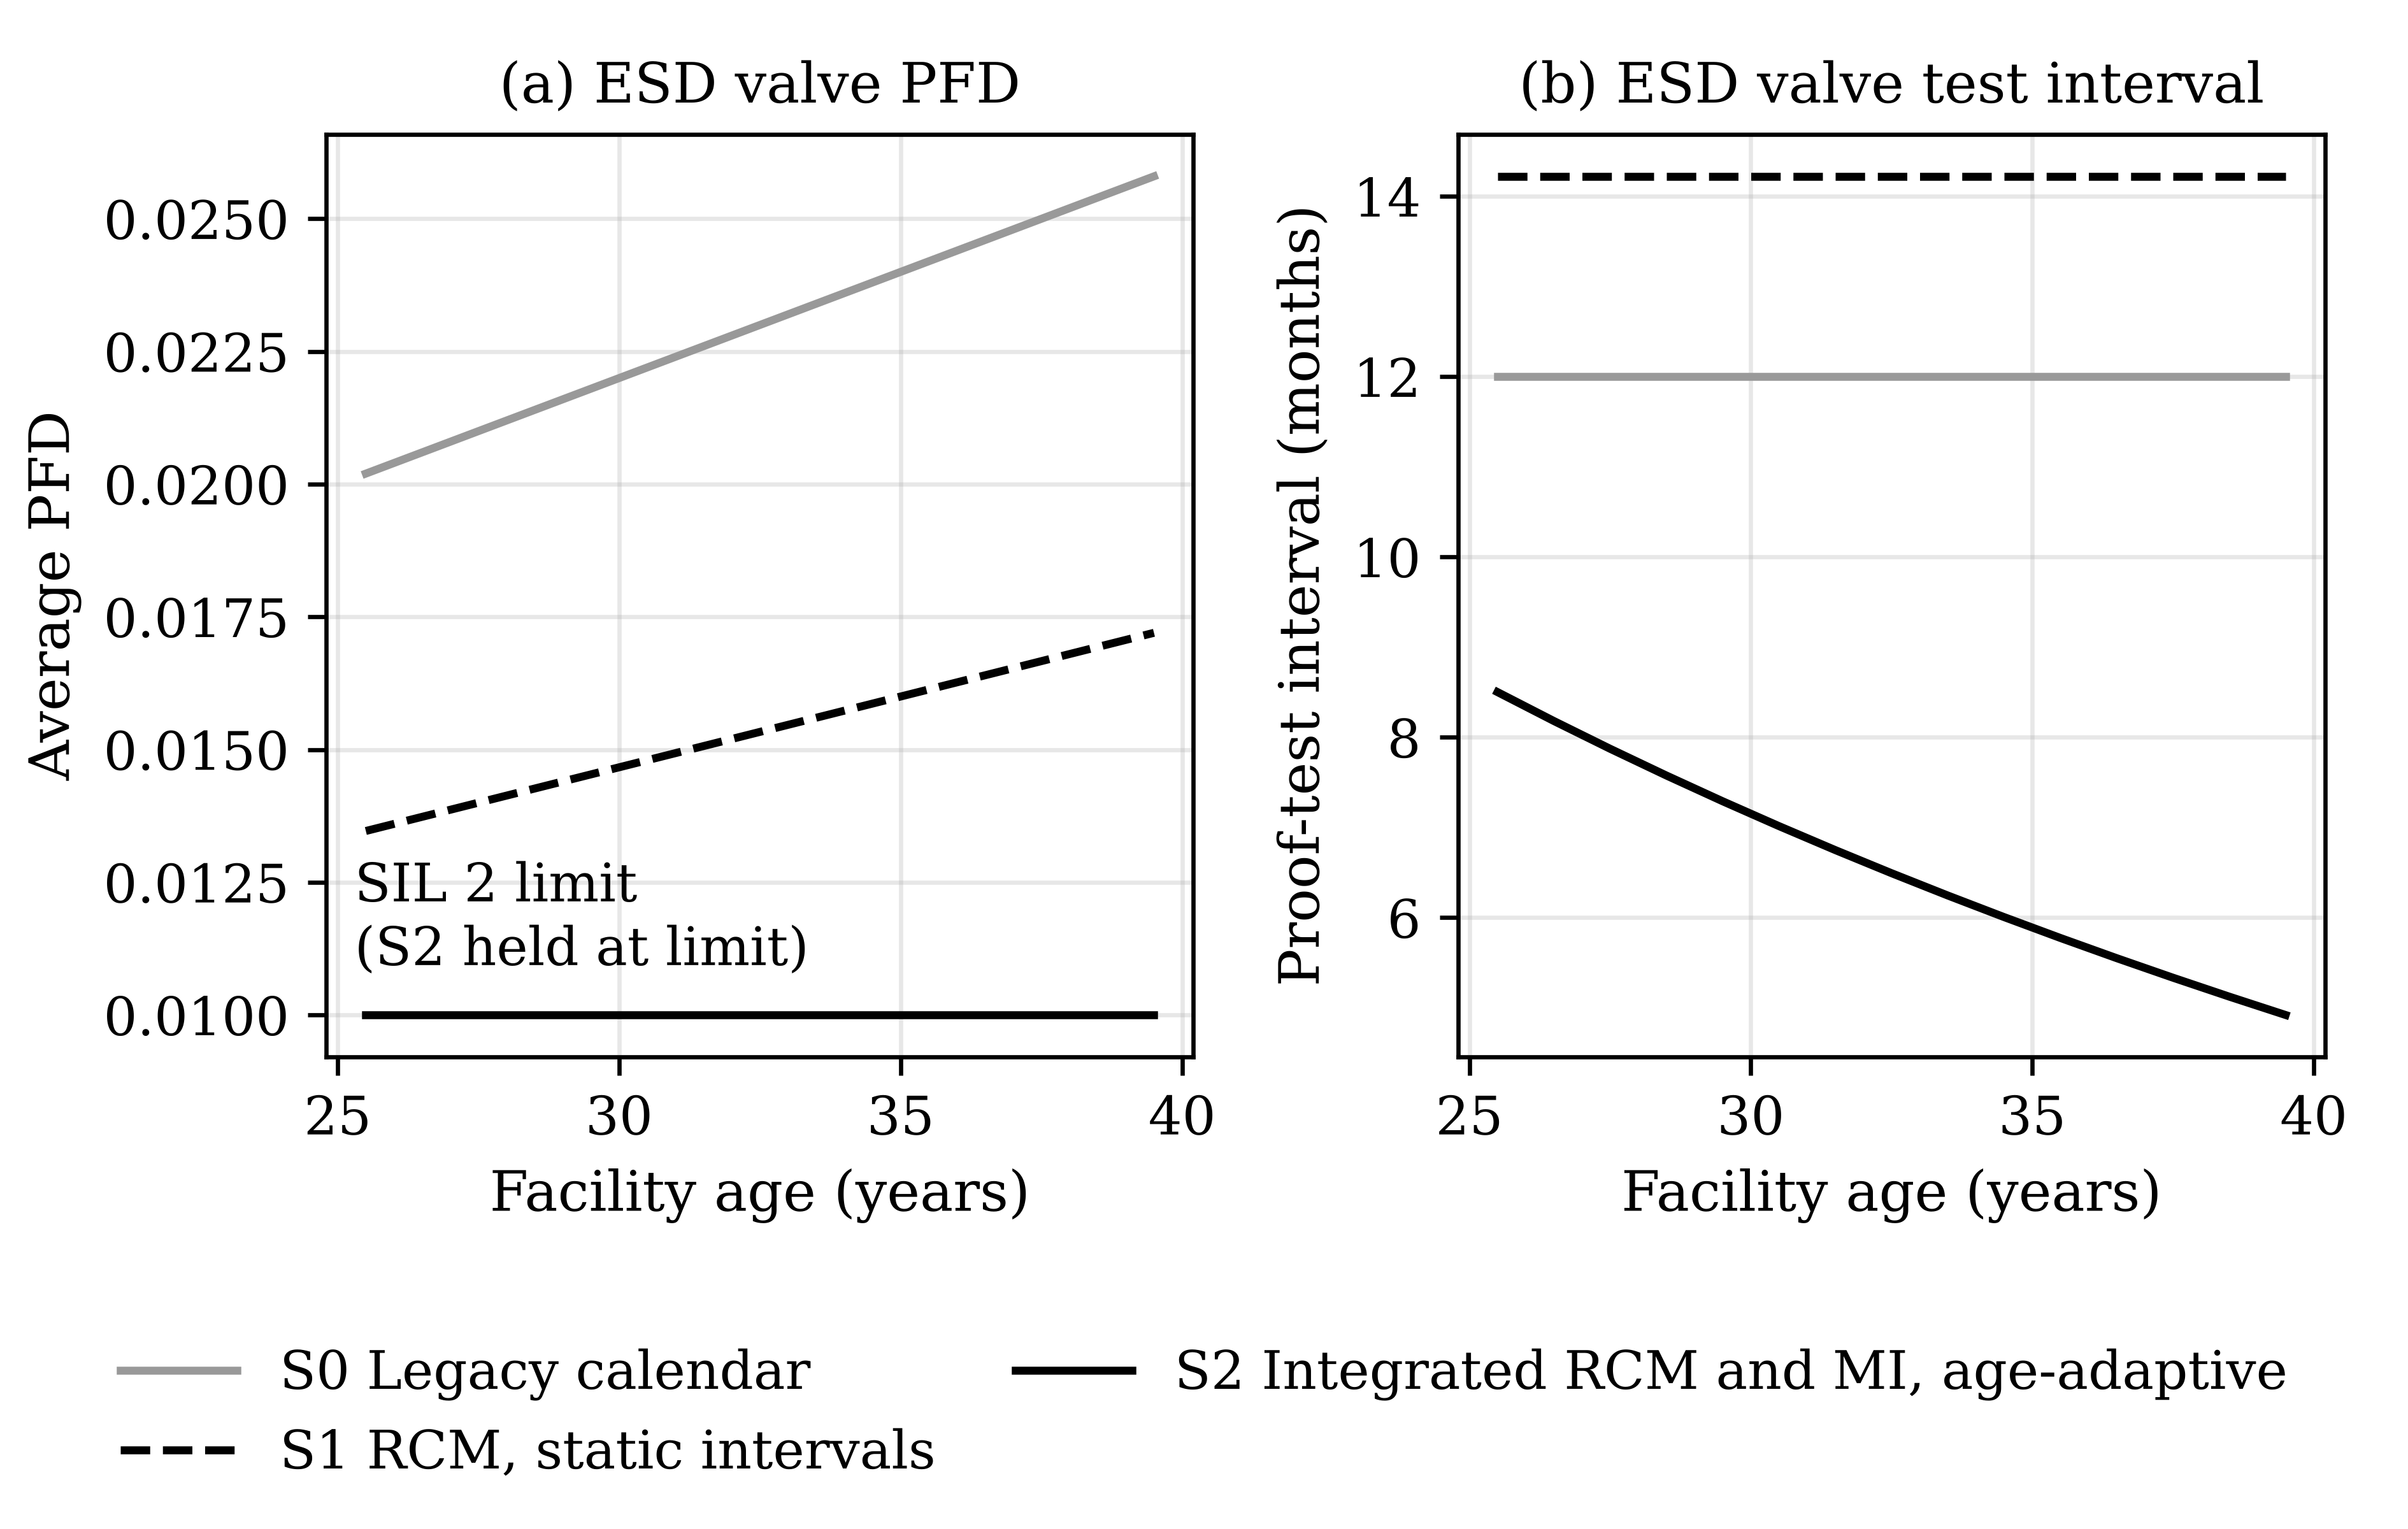
Table 7 reports the proof-test results. Under S0 the average PFD of all three device classes exceeded the SIL 2 limit throughout the horizon, reaching 0.021, 0.026 and 0.033 for pressure safety valves, ESD valves and level switches by age 40. Under S1, the higher coverage and optimized intervals reduced PFD by about a third, but because the intervals were set at the historical average failure rate, PFD still exceeded 0.01 in every year and rose to between 0.016 and 0.017 by age 40. Only S2, which re-optimized intervals each year at the current failure rate, kept every class at or below the limit in every year. To do so, S2 shortened the ESD valve test interval from 8.5 months at age 25 to 4.9 months at age 40 (Figure 4), the level switch interval from 4.6 to 2.2 months and the pressure safety valve interval from 3.0 to 2.2 years. Expected failures on demand over the horizon fell from 2.52 under S0 to 1.47 under S1 and 1.00 under S2. The pattern matches the life extension literature, which warns that protective systems degrade with age and that test regimes fixed at design cannot be assumed to remain adequate [3, 4].
| Code | Strategy | Interval at age 25 | Interval at age 40 | PFD at age 25 | PFD at age 40 | Test cost (USD k) | Failures on demand |
|---|---|---|---|---|---|---|---|
| H1 | S0 | 5.0 yr | 5.0 yr | 0.0161 | 0.0205 | 324 | 0.33 |
| H1 | S1 | 3.9 yr | 3.9 yr | 0.0123 | 0.0157 | 421 | 0.25 |
| H1 | S2 | 3.0 yr | 2.2 yr | 0.0100 | 0.0100 | 635 | 0.18 |
| H2 | S0 | 12 mo | 12 mo | 0.0202 | 0.0258 | 825 | 0.86 |
| H2 | S1 | 14 mo | 14 mo | 0.0135 | 0.0172 | 696 | 0.58 |
| H2 | S2 | 8.5 mo | 4.9 mo | 0.0100 | 0.0100 | 1,549 | 0.38 |
| H3 | S0 | 12 mo | 12 mo | 0.0265 | 0.0328 | 270 | 1.33 |
| H3 | S1 | 8.2 mo | 8.2 mo | 0.0128 | 0.0159 | 397 | 0.65 |
| H3 | S2 | 4.6 mo | 2.2 mo | 0.0100 | 0.0100 | 1,035 | 0.45 |
4.4Facility-level comparison
Table 8 combines the three streams. The integrated age-adaptive strategy S2 had a 15-year cost of USD 23.46 million, 23 percent below the USD 30.55 million of S0 and 5.4 percent above the USD 22.27 million of S1; in present value terms at 8 percent the figures were USD 14.03, 17.40 and 13.36 million. Relative to S1, S2 spent USD 1.16 million more on inspection, USD 1.71 million more on proof testing and USD 0.35 million more on repair, and recovered USD 1.35 million in avoided static failure costs and USD 0.67 million in avoided costs of failures on demand. It averted 2.48 LOPC events and 0.47 failures on demand, so the net premium of USD 1.19 million corresponds to about USD 0.40 million per averted event, or USD 0.23 million in present value terms. Relative to S0, S2 averted 12.3 LOPC events, 2.8 safety LOPC events and 1.5 failures on demand while saving USD 7.1 million. The cost of averting an event under S2 is modest compared with the failure costs assumed for the static classes, which range from USD 0.35 to 2.2 million per event, consistent with the economic case for proactive integrity management made in corrosion cost and asset integrity studies [14, 26].
| Measure | S0 Legacy | S1 RCM static | S2 Integrated |
|---|---|---|---|
| Active failure mode cost (USD M) | 12.58 | 9.28 | 9.28 |
| Active failures | 144.6 | 68.6 | 68.6 |
| Equipment downtime (item-days per year) | 28.0 | 24.1 | 24.1 |
| Static inspection cost (USD M) | 1.24 | 1.19 | 2.35 |
| Static repair cost (USD M) | 2.12 | 4.28 | 4.63 |
| Static failure cost (USD M) | 9.84 | 3.87 | 2.52 |
| Static LOPC events | 16.86 | 7.07 | 4.59 |
| Static LOPC events with safety consequence | 3.77 | 1.27 | 0.95 |
| Proof-test cost (USD M) | 1.42 | 1.51 | 3.22 |
| Expected cost of failures on demand (USD M) | 3.35 | 2.14 | 1.46 |
| Failures on demand | 2.52 | 1.47 | 1.00 |
| Years meeting SIL 2 for all classes (of 15) | 0 | 0 | 15 |
| Total cost (USD M) | 30.55 | 22.27 | 23.46 |
| Present value at 8 percent (USD M) | 17.40 | 13.36 | 14.03 |
4.5Sensitivity to corrosion acceleration
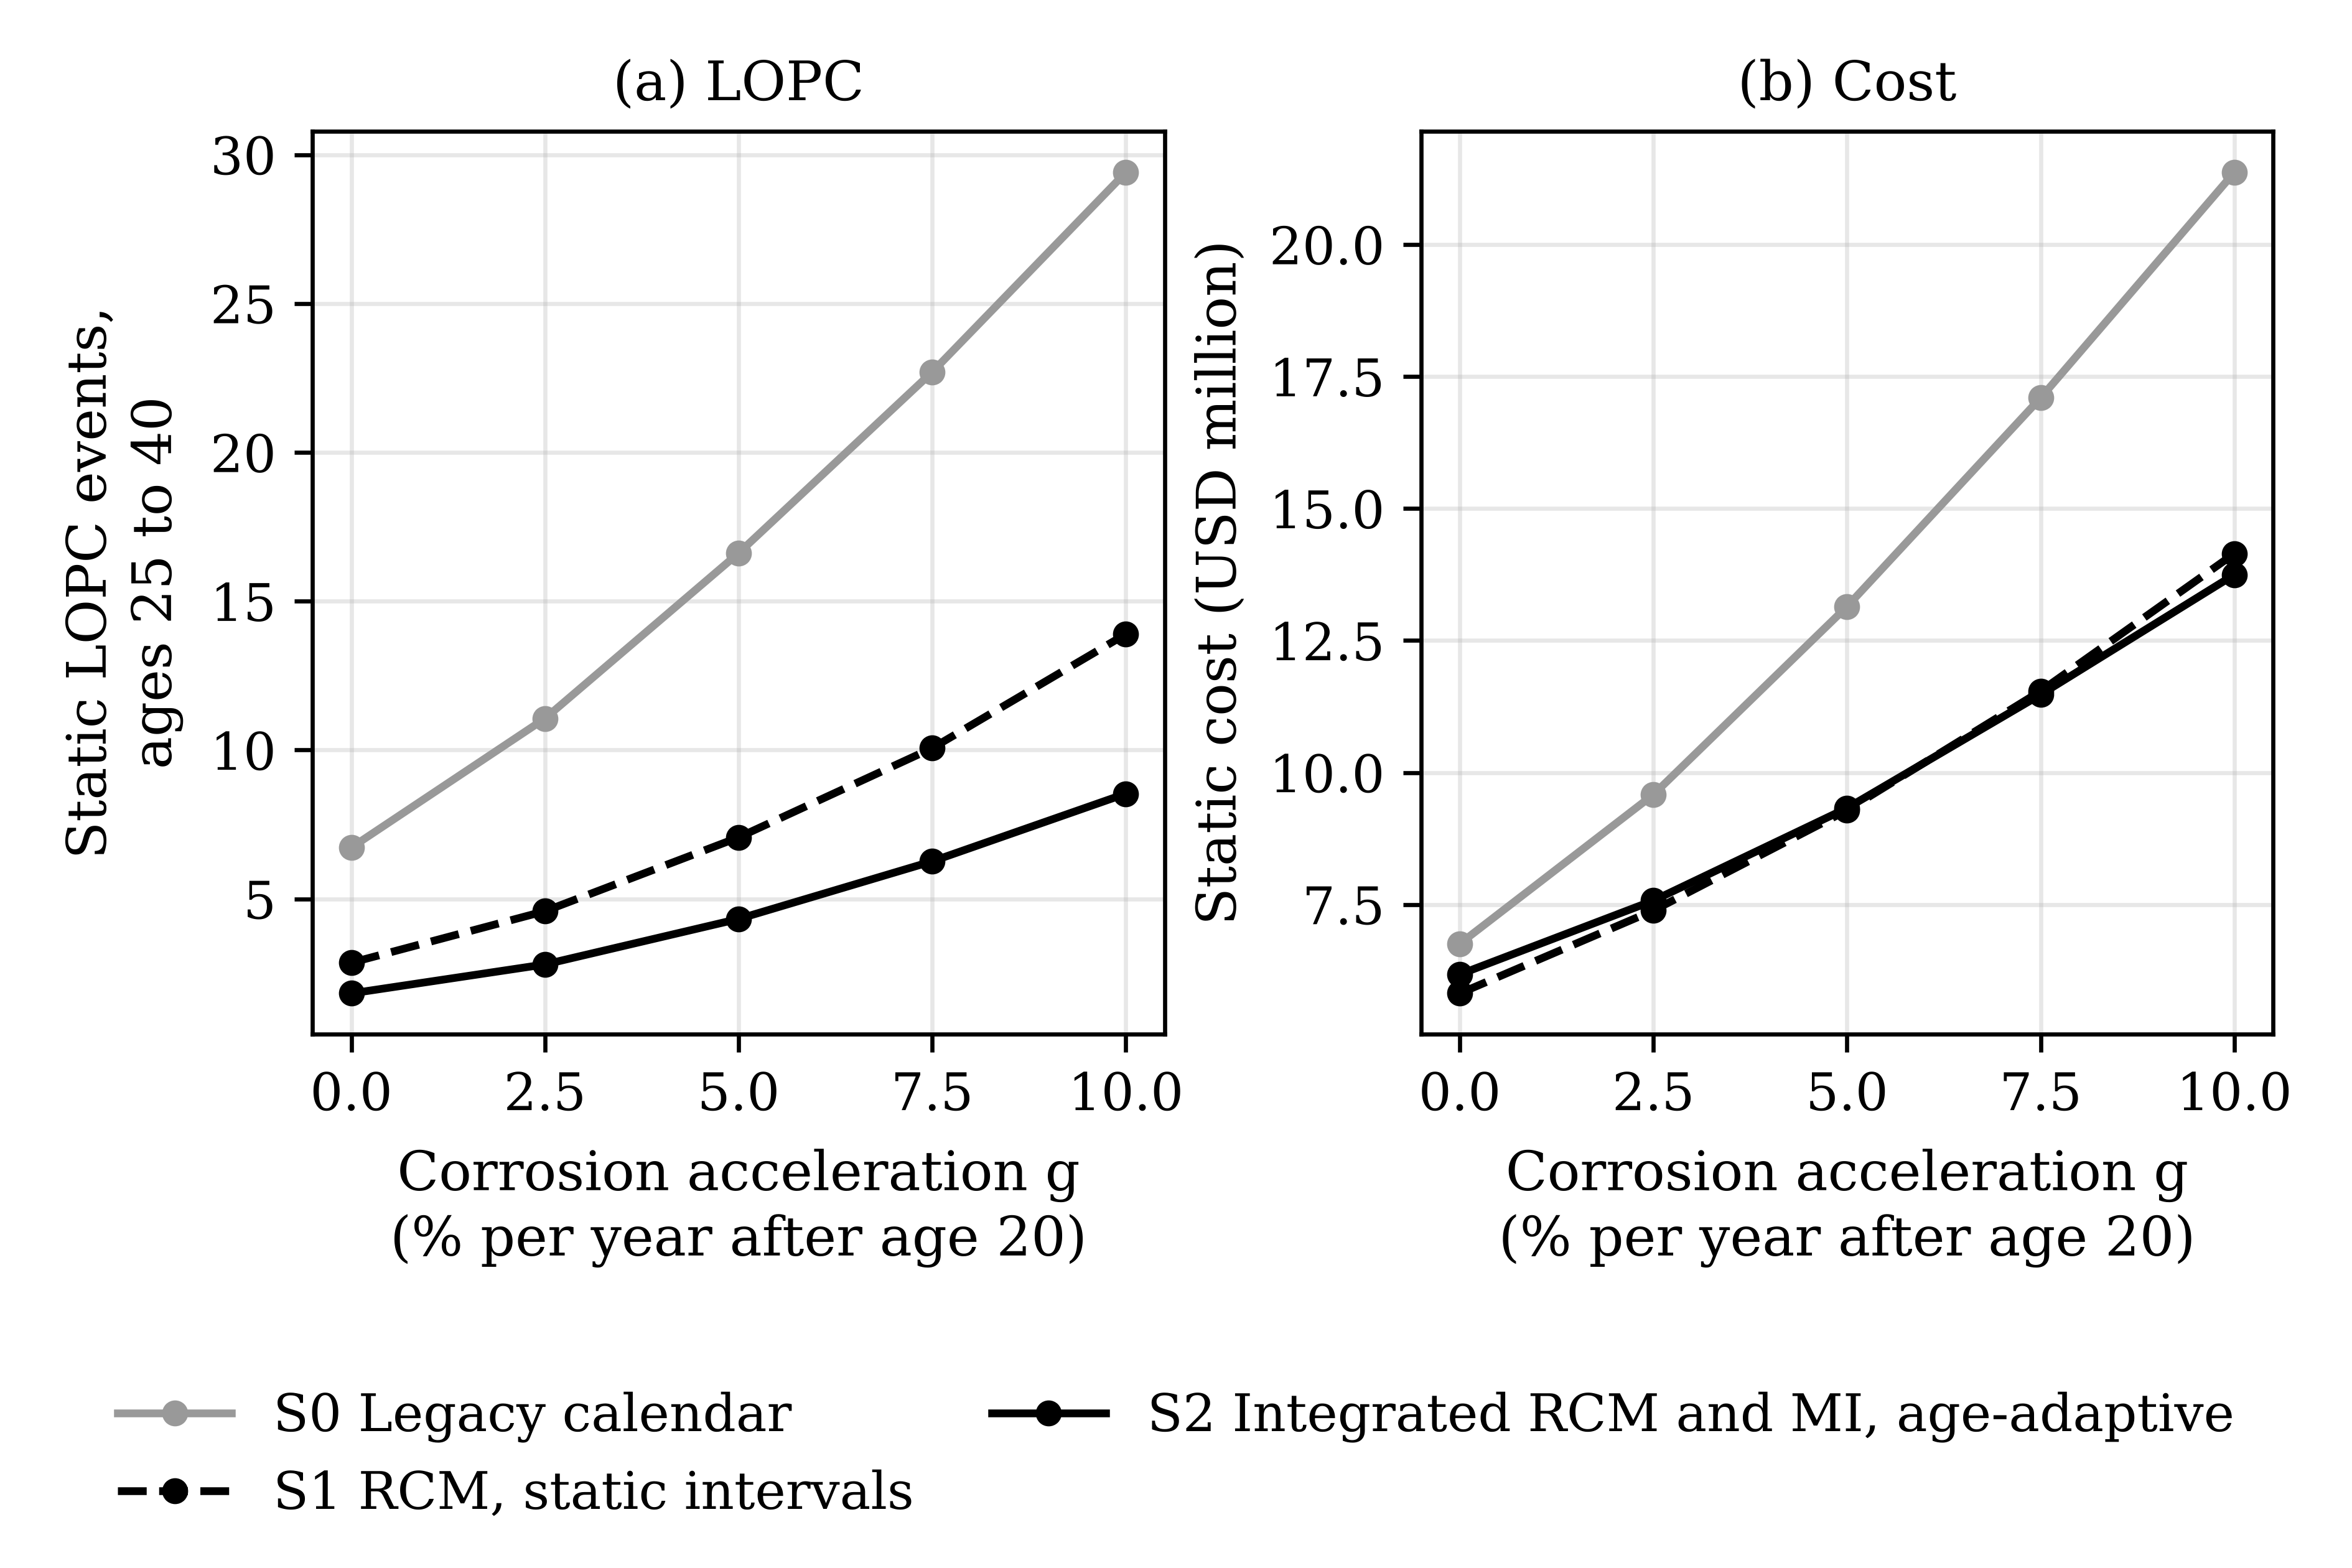
Figure 5 shows how the static equipment results change with the corrosion acceleration rate . With no acceleration, S1 is the cheapest static strategy at USD 5.82 million against USD 6.18 million for S2, although S2 still has fewer LOPC events, 1.83 against 2.86. As acceleration increases, the cost advantage of S1 disappears: the two are equal at , and at and S2 is both cheaper, at USD 11.48 and 13.75 million against USD 11.54 and 14.15 million, and safer, with 6.3 and 8.5 LOPC events against 10.1 and 13.9. The legacy strategy deteriorates fastest, from 6.7 LOPC events at to 29.4 at . The results confirm that the value of age-adaptive intervals lies in their robustness to degradation that is faster than history suggests [3, 38, 39].
4.6Value of maintenance data
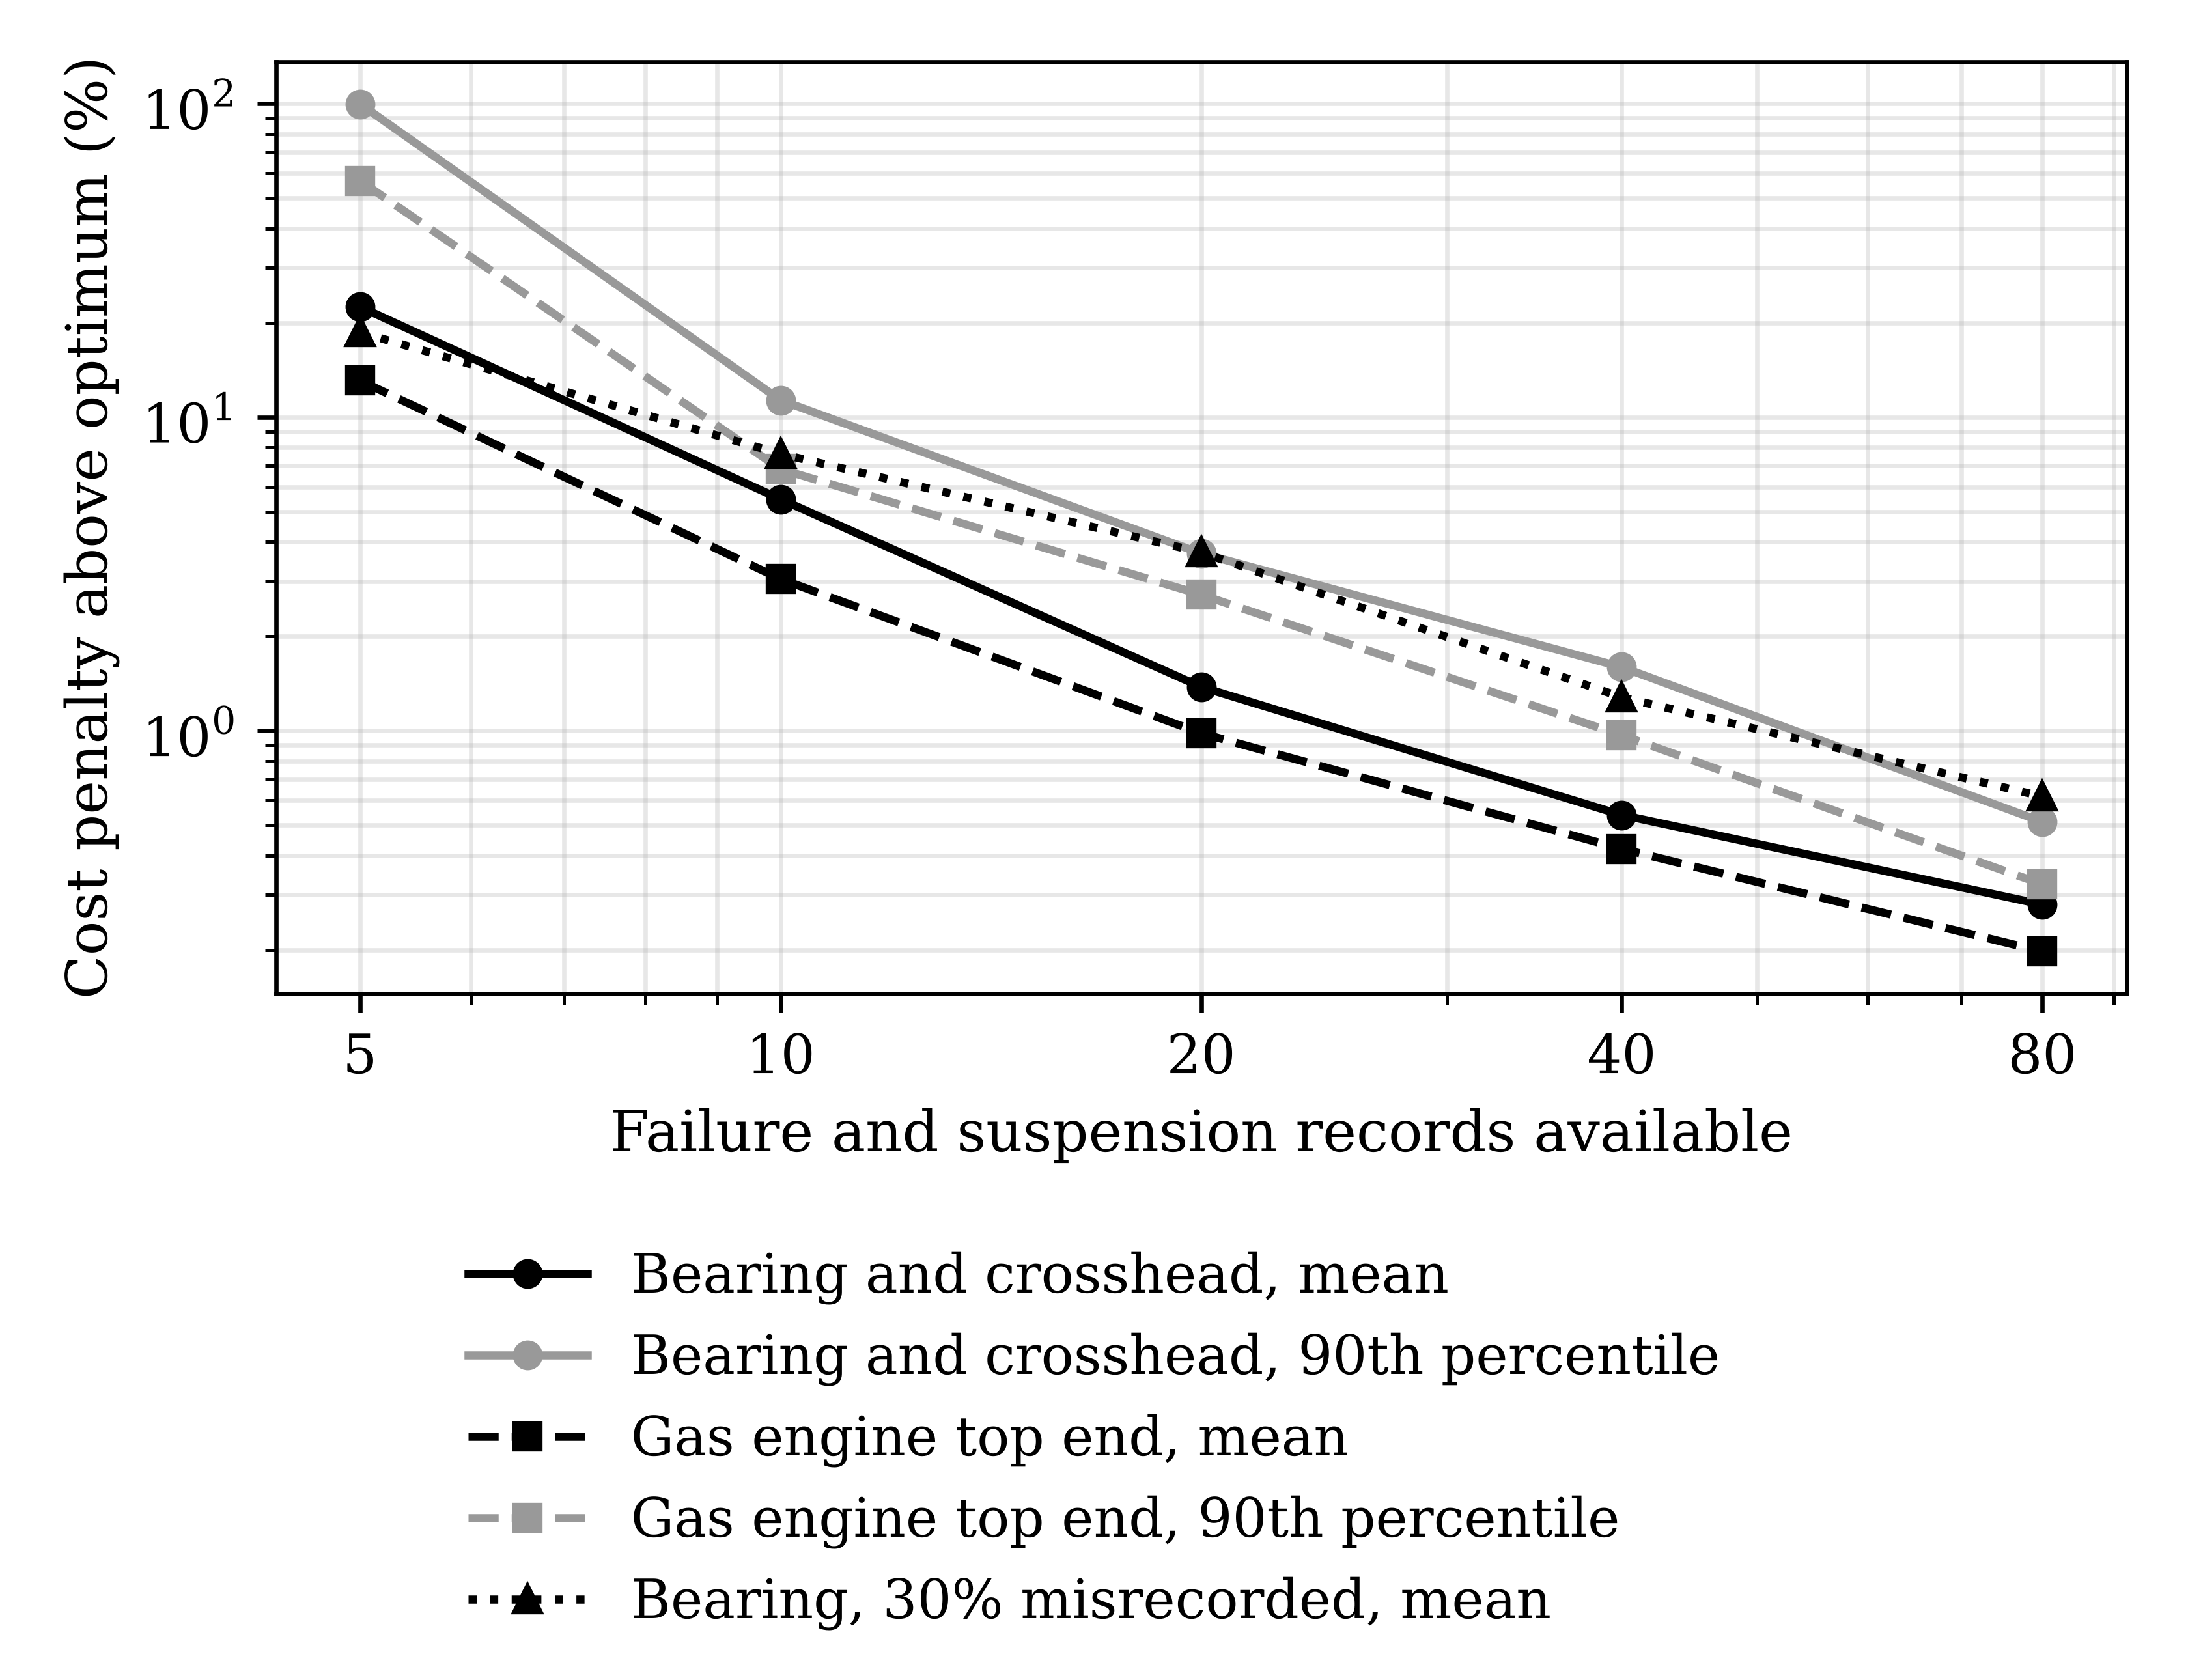
Table 9 and Figure 6 report the data quality experiment. With five records, the restoration age selected from estimated parameters raised the expected cost of the compressor bearing mode by 22.5 percent on average above the true optimum, and by 99.8 percent at the 90th percentile; for the gas engine top end the figures were 13.1 and 56.8 percent. The penalty fell quickly with sample size: with 20 records, the mean penalty was 1.4 and 1.0 percent, and with 80 records, 0.3 and 0.2 percent. The estimated shape parameter was biased upward in small samples, a known property of maximum likelihood estimation with few failures [41, 346]. When 30 percent of the records were misrecorded, the shape parameter was biased towards random failure, with a median of 2.04 at 80 records against a true value of 2.6, and the mean penalty remained above 0.6 percent even with 80 records and was 3.7 percent with 20 records, more than twice the penalty with clean data. These results quantify the claim, made in studies of work-order data, that data quality limits the benefits of reliability analysis [34, 35, 40].
| Records | R2 mean | R2 90th percentile | R2 median shape estimate | R3 mean | R3 90th percentile | R2 misrecorded mean | R2 misrecorded median shape estimate |
|---|---|---|---|---|---|---|---|
| 5 | 22.5 | 99.8 | 3.21 | 13.1 | 56.8 | 18.7 | 2.50 |
| 10 | 5.5 | 11.3 | 2.90 | 3.1 | 6.8 | 7.6 | 2.24 |
| 20 | 1.4 | 3.7 | 2.85 | 1.0 | 2.7 | 3.7 | 2.13 |
| 40 | 0.5 | 1.6 | 2.68 | 0.4 | 1.0 | 1.3 | 2.06 |
| 80 | 0.3 | 0.5 | 2.66 | 0.2 | 0.3 | 0.6 | 2.04 |
5Discussion
This section interprets the results in relation to the literature, draws implications for the management of ageing onshore facilities, considers how the framework can be implemented with the data and organization that such facilities typically have, and sets out the limitations of the study. The discussion is guided by the view that maintenance and integrity management must balance cost, risk and performance across the life cycle [42, 354, 357], and by the evidence from ageing studies that the management of deterioration, rather than calendar age itself, determines the safety of older plant [1–3]. It also draws on the observation that the gap between maintenance optimization models and practice is often organizational and data-related rather than mathematical [31, 32, 377].
5.1Principal findings
Three findings stand out. First, RCM task selection alone produced the largest single cost reduction, because the legacy programme combined over-maintenance of some modes, such as frequent compressor valve overhauls, with under-maintenance of others, such as run-to-failure of seals and packing and infrequent fire tube inspection. This confirms the experience of RCM applications to compressors and rotating equipment, in which much of the value of RCM comes from reallocating effort between failure modes rather than increasing it [21, 22]. The binding risk cap for heater-treater fire tubes illustrates that, for modes with safety consequences, RCM logic can require a more intensive task than cost alone would justify, consistent with the safety-constrained delay-time model [278] and with the RCM evaluation criteria [18].
Second, static intervals optimized once on historical behaviour lose effectiveness as facilities age. S1 reduced static LOPC events by 58 percent relative to the legacy programme, but its frequency rose again in the middle of the horizon and it failed to keep any class of protective device within its SIL 2 limit. Age-adaptive intervals in S2 removed a further 35 percent of static LOPC events and brought all safety instrumented functions into compliance, at a cost premium of about 5 percent over S1. This supports the argument of life extension studies that ageing must be managed by continual reassessment of condition and remaining life rather than by extending existing programmes [3–5], and it is consistent with risk-based inspection of ageing pressure vessels for fitness-for-service [27] and with optimal inspection planning for corroding onshore pipelines [196].
Third, the advantage of the integrated strategy grows as corrosion accelerates. When corrosion rates remain at historical levels, S1 is cheaper but less safe; when they rise by 5 percent per year or more after age 20, S2 is at least as cheap and substantially safer. Because water cut, and with it corrosivity, typically increases as fields mature [38, 164], the conditions under which S2 dominates are the conditions that ageing onshore facilities are most likely to face. The data quality experiment adds that these benefits depend on the maintenance records available: with fewer than about ten clean records per failure mode, or with substantial misrecording, the expected cost penalty of optimized restoration ages is several percent and can be much larger in unfavourable samples [34, 40, 41].
5.2Implications for practice
For operators planning the life extension of an onshore facility, the results suggest a sequence of actions. The first is an RCM review of active failure modes, focusing on those with high failure costs, strong wear-out and safety or environmental consequences, using criticality analysis to set priorities [82, 85, 89, 90] and multi-criteria methods where consequences are difficult to monetize [55, 61, 63]. The second is a baseline integrity campaign for static equipment, using inspection techniques selected for the damage mechanism, such as automated ultrasonic or guided wave testing for internal and under-insulation corrosion [171, 183, 205, 208], followed by intervals based on remaining life and the greater of long-term and short-term corrosion rates [24, 30]. Where thinning approaches the minimum thickness, fitness-for-service assessment and remaining strength methods can justify continued operation or define repair [25, 221, 223, 225]. The third is an annual review of proof-test intervals for safety instrumented functions and relief devices, using failure rates updated from proof-test results, so that intervals shorten as devices age [3, 278].
The integrated strategy also changes how maintenance performance should be measured. Indicators that reward low inspection cost or long intervals would favour S1 in the early years of a life extension, even though S2 performs better over the horizon. Maintenance performance frameworks that combine leading indicators, such as inspection backlog, proof-test compliance and remaining-life coverage, with lagging indicators such as LOPC events would better reflect the value of age-adaptive management [96–98]. The European indicator standard [46], and sustainability-oriented indicator sets [100, 102, 103] provide a starting point. Integration of opportunistic maintenance, in which inspections and restorations are grouped when equipment is shut down for other reasons, could reduce the cost premium of S2 further [293, 298, 299].
5.3Data and organizational requirements
The framework requires failure and inspection data of a quality that many ageing facilities do not have. The data quality experiment shows that the marginal value of additional clean records is high up to about 20 records per failure mode and modest beyond that, which suggests that pooling records across similar equipment, using generic data as prior information and cleaning historical work orders are worthwhile investments [35, 135, 136]. Technical language processing of free-text work orders can recover failure information that is not coded [137–139], and automated data collection can reduce entry errors [128, 140]. Bayesian updating of reliability from condition data provides a principled way to combine generic and site-specific information [199, 358]. Interpretable machine learning for early failure prediction [142] and data-driven methods drawn from industrial automation [141] can use the same records, provided that their inputs are cleaned first. For buried flowlines, GIS-based asset registers and UAV corridor surveys can add location and external condition data to the CMMS record [211, 212]. Trend tests and models for repairable systems should be used to check whether failure rates are changing over time before a stationary model is adopted [343–345].
Organizationally, the integrated framework crosses the boundaries between maintenance, inspection and instrumentation functions, which in many companies have separate budgets and systems [16, 17, 77]. Total productive maintenance experience shows that cross-functional teams and operator involvement are needed to sustain improvement [115, 119, 123], and studies of maintenance personnel and training show that competence must be maintained as the workforce changes [47, 114, 376]. The higher task frequencies of S2 also place demands on materials readiness and spare parts supply, so procurement and supply chain planning for gas processing plants should be aligned with the revised maintenance plan [112, 113, 341]. Because maintenance tasks can themselves introduce failures, increasing the frequency of restorations and proof tests should be accompanied by attention to maintenance error, for example through human reliability analysis of critical tasks [370, 371, 374, 375].
5.4Relation to maintenance optimization research
The models used here are deliberately standard, but the results bear on several strands of research. The delay-time model remains a practical way to set monitoring intervals when defect detection is imperfect [37, 270, 273], and the flat cost-rate curves for some modes support the use of practical intervals within a band rather than a precise optimum [277, 288]. The static equipment model is close to the stochastic deterioration models used for maintained structures [286, 357], and the inspection effectiveness parameter links it to probability of detection models used in RBI [197, 198]. Extending the framework to multi-component economic dependence [254, 293, 294], imperfect repair [350, 351, 353], competing failure processes [268, 369] and joint optimization of spare parts [113, 292, 338] would increase realism. Machine-learning prognostics for compressors and turbines [52, 365, 367, 368] and data-driven burst strength models for corroded pipelines [246–248] could supply the condition information that age-adaptive intervals require.
5.5Limitations
The study has several limitations. All parameters are representative values selected from published ranges rather than data from a specific facility, so the absolute results should not be transferred to any site without recalibration [31, 32]. Failure modes were modelled independently, without economic or stochastic dependence between them, which ignores opportunities for grouping and the possibility of cascading failures [293, 333]. Corrosion was represented by a single acceleration function common to all classes, whereas in practice different mechanisms respond differently to water cut, temperature and solids [158, 164, 171]. The consequence of failures on demand was represented by an expected cost rather than a full consequence analysis, and injury was reported as event frequency without monetary valuation [81, 278]. Finally, the data quality experiment considered only Weibull estimation for two failure modes; corrosion rate estimation from inspection data is also subject to data quality problems that were represented only through inspection effectiveness [198, 203].
6Conclusion
This study developed an integrated reliability-centered maintenance and mechanical integrity framework for ageing onshore oil and gas production facilities and demonstrated it on a representative 25-year-old facility over a 15-year life extension. The framework assigns RCM tasks to active failure modes with a risk cap for safety and environmental consequences, manages static equipment by risk-based inspection with corrosion-rate updating and inspection effectiveness, and sets proof-test intervals for protective devices that shorten as failure rates rise with age.
Relative to a legacy calendar programme, RCM task selection halved active failures and reduced their cost by about a quarter. Static intervals optimized once on historical behaviour cut static loss of containment by more than half but left every class of protective device above its SIL 2 limit. The integrated age-adaptive strategy removed a further third of static loss of containment events, kept all protective devices within their limits in every year and reduced failures on demand by 60 percent relative to the legacy programme, at a cost 23 percent below the legacy programme and 5 percent above the static RCM programme. The advantage of the integrated strategy grew as corrosion accelerated, and the value of all optimized programmes depended on having more than a handful of clean failure records per mode.
For operators, the results support a sequence of RCM review, baseline integrity campaign with remaining-life-based intervals and annual review of proof-test intervals as the core of a life extension programme, supported by investment in maintenance data. Further work should calibrate the framework with field data from ageing onshore facilities, add dependence between failure modes and opportunistic grouping, and extend the treatment of data quality to inspection and corrosion monitoring records.
References
- [1]Health and Safety Executive. Plant ageing: Management of equipment containing hazardous fluids or pressure (research report RR509). HSE Books. 2006.
- [2]Health and Safety Executive. Plant ageing study, phase 1 report (research report RR823). HSE Books. 2010.
- [3]Shafiee M, Animah I. Life extension decision making of safety critical systems: An overview. Journal of Loss Prevention in the Process Industries. 2017;47:174–188.
- [4]Animah I, Shafiee M. Condition assessment, remaining useful life prediction and life extension decision making for offshore oil and gas assets. Journal of Loss Prevention in the Process Industries. 2018;53:17–28.
- [5]Animah I, Shafiee M, Simms N, et al. Selection of the most suitable life extension strategy for ageing offshore assets using a life-cycle cost-benefit analysis approach. Journal of Quality in Maintenance Engineering. 2018;24(3):311–330.
- [6]Azzam MM. Failure analysis of pipelines in the oil and gas industry. Pipeline Engineering: Design, Failure, and Management (IntechOpen). 2022. https://doi.org/10.5772/intechopen.108140
- [7]Dai L, Wang D, Wang T. Analysis and comparison of long-distance pipeline failures. Journal of Petroleum Engineering. 2017;2017:3174636.
- [8]Adebayo A, Dada AS. An evaluation of the causes of oil pipeline incidents in oil and gas industries in niger delta region of Nigeria. Journal of Engineering and Applied Sciences. 2008;3:279–281.
- [9]Chang JI, Lin CC. A study of storage tank accidents. Journal of Loss Prevention in the Process Industries. 2006;19(1):51–59.
- [10]Zheng B, Chen GH. Storage tank fire accidents. Process Safety Progress. 2011;30(3):291–293.
- [11]Herbert I. The UK buncefield incident: The view from a UK risk assessment engineer. Journal of Loss Prevention in the Process Industries. 2010;23:913–920.
- [12]Obetta PC. Reliability and integrity management of fired heaters, boilers and furnaces in upstream oil and gas: A review. Iconic Research and Engineering Journals. 2019;3(5):599–626. https://doi.org/10.64388/IREV3I5-1722580
- [13]Asibor E, Isong DE. Risk-based process engineering framework for strengthening reliability across complex natural gas infrastructure systems. Iconic Research and Engineering Journals. 2019;3(2):1020–1060. https://doi.org/10.64388/IREV3I2-1723153
- [14]Koch G, Varney J, Thompson N, Moghissi O. International measures of prevention, application, and economics of corrosion technologies study (IMPACT). NACE International. 2016.
- [15]Campbell JD, Jardine AKS. Maintenance excellence: Optimizing equipment life-cycle decisions. CRC Press. 2001.
- [16]Wan Mahmood WH, Ab Rahman MN, Deros BM, Mazli H. Maintenance management system for upstream operations in oil and gas industry: A case study. International Journal of Industrial and Systems Engineering. 2011;9(3):317–329.
- [17]Alsyouf I. Maintenance practices in swedish industries: Survey results. International Journal of Production Economics. 2009;121(1):212–223.
- [18]SAE International. Evaluation criteria for reliability-centered maintenance (RCM) processes (SAE JA1011). SAE International. 1999. https://doi.org/10.4271/JA1011_199908
- [19]Emovon I, Norman RA, Murphy AJ. Elements of maintenance systems and tools for implementation within the framework of reliability centred maintenance: A review. Journal of Mechanical Engineering and Technology. 2016;8(2):1–34.
- [20]Gupta G, Mishra RP. A SWOT analysis of reliability centered maintenance framework. Journal of Quality in Maintenance Engineering. 2016.
- [21]Priyanta D, Siswantoro N, Sukandar RA. Determination of maintenance task on rotary equipment using reliability centered maintenance II method. International Journal of Marine Engineering Innovation and Research. 2019;4(3). https://doi.org/10.12962/J25481479.V4I3.5572
- [22]Zou B, et al. Improved RCM method by AHP-FCE for the maintenance strategy of reciprocating compressor unit. Proceedings of the 15th IEEE Conference on Industrial Electronics and Applications (ICIEA 2020). 2020;124–129. https://doi.org/10.1109/ICIEA48937.2020.9248219
- [23]De Sanctis I, Paciarotti C, Di Giovine O. Integration between RCM and RAM: A case study. International Journal of Quality & Reliability Management. 2016;33(6):852–880. https://doi.org/10.1108/IJQRM-02-2015-0026
- [24]American Petroleum Institute. API 510: Pressure vessel inspection code: In-service inspection, rating, repair, and alteration (11th ed.). American Petroleum Institute. 2022.
- [25]American Petroleum Institute & American Society of Mechanical Engineers. API 579–1/ASME FFS-1: Fitness-for-service (3rd ed.). American Petroleum Institute / ASME. 2016.
- [26]Barkhordari A, Mahmoudian Y, Yousefi F, Zarei P, Moradi B. Risk and asset integrated management with risk-based inspection technique in oil, gas, and petrochemical industries. Occupational Hygiene and Health Promotion Journal. 2020;4(3):223–239.
- [27]Obetta PC. A risk-based inspection concept for fitness-for-service assessment of ageing pressure vessels on offshore joint venture facilities. Iconic Research and Engineering Journals. 2018;2(5):497–520. https://doi.org/10.64388/IREV2I5-1722578
- [28]Alebrant Mendes A, Duarte Ribeiro JL. Establishment of a maintenance plan based on quantitative analysis in the context of RCM in a JIT production scenario. Reliability Engineering & System Safety. 2014;127:21–29. https://doi.org/10.1016/j.ress.2014.03.004
- [29]Macchi M, Garetti M, Centrone D, Fumagalli L, Piero Pavirani G. Maintenance management of railway infrastructures based on reliability analysis. Reliability Engineering & System Safety. 2012;104:71–83.
- [30]Atta S, Tofah P, Kankam MA, Adenuga OM. A critical review of NDT based integrity management and corrosion risk assessment strategies for refinery process equipment. International Journal of Engineering and Modern Technology. 2020;6(2):19–46. https://doi.org/10.56201/ijemt.vol.6.no2.2020.pg19.46
- [31]de Jonge B, Scarf PA. A review on maintenance optimization. European Journal of Operational Research. 2020;285(3):805–824. https://doi.org/10.1016/j.ejor.2019.09.047
- [32]Van Horenbeek A, Pintelon L, Muchiri P. Maintenance optimization models and criteria. International Journal of System Assurance Engineering and Management. 2010;1(3):189–200. https://doi.org/10.1007/s13198-011-0045-x
- [33]Chin HH, Varbanov PS, Klemeš JJ, Benjamin MFD, Tan RR. Asset maintenance optimisation approaches in the chemical and process industries - a review. Chemical Engineering Research and Design. 2020;164:162–194. https://doi.org/10.1016/j.cherd.2020.09.034
- [34]Lukens S, Naik M, Saetia K, Hu X. Best practices framework for improving maintenance data quality to enable asset performance analytics. Annual Conference of the PHM Society. 2019;11(1).
- [35]Hodkiewicz M, Ho MTW. Cleaning historical maintenance work order data for reliability analysis. Journal of Quality in Maintenance Engineering. 2016;22(2):146. https://doi.org/10.1108/JQME-04-2015-0013
- [36]Sexton T, Hodkiewicz M, Brundage MP. Categorization errors for data entry in maintenance work orders. Proceedings of the Annual Conference of the PHM Society. 2019;11.
- [37]Wang W. An overview of the recent advances in delay-time-based maintenance modelling. Reliability Engineering & System Safety. 2012;106:165–178. https://doi.org/10.1016/j.ress.2012.04.004
- [38]Jiang X, Xu K, Guan X, Qu D, Song X, Zhang Q, et al. A comparative study on the corrosion of gathering pipelines in two sections of a shale gas field. Engineering Failure Analysis. 2021;121:105179. https://doi.org/10.1016/j.engfailanal.2020.105179
- [39]Asmara YP, Kurniawan T. Corrosion prediction for corrosion rate of carbon steel in oil and gas environment: A review. Indonesian Journal of Science and Technology. 2018;3(1):64–74. https://doi.org/10.17509/ijost.v3i1.10808
- [40]Conte A, Bolland C, Phan L, Brundage M, Sexton T. The impact of data quality on maintenance work order analysis: A case study in HVAC work durations. Proceedings of the 6th European Conference of the Prognostics and Health Management Society 2021. 2021;105–115.
- [41]Regattieri A, Manzini R, Battini D. Estimating reliability characteristics in the presence of censored data: A case study in a light commercial vehicle manufacturing system. Reliability Engineering & System Safety. 2010;95(10):1093–1102.
- [42]Crespo Márquez A, Moreu de León P, Gómez Fernández JF, Parra Márquez C, López Campos M. The maintenance management framework: A practical view to maintenance management. Journal of Quality in Maintenance Engineering. 2009;15(2):167–178.
- [43]Iung B, Levrat E. Advanced maintenance services for promoting sustainability. Procedia CIRP. 2014;22:15–22.
- [44]Holgado M, Macchi M, Evans S. Exploring the impacts and contributions of maintenance function for sustainable manufacturing. International Journal of Production Research. 2020;58(23):7292–7310.
- [45]CEN. EN 13306:2017 maintenance - maintenance terminology. European Committee for Standardization. 2017.
- [46]European Committee for Standardization. Maintenance: Maintenance key performance indicators (EN 15341:2019). CEN. 2019.
- [47]European Committee for Standardization. Maintenance: Qualification of maintenance personnel (EN 15628:2014). CEN. 2014.
- [48]Ahmad R, Kamaruddin S. An overview of time-based and condition-based maintenance in industrial application. Computers & Industrial Engineering. 2012;63(1):135–149.
- [49]Mobley RK. An introduction to predictive maintenance (2nd ed.). Butterworth-Heinemann. 2002.
- [50]Silva, E. T. da, Piratelli, C. L., & Achcar, J. A. Estudo da manutenção de equipamentos de uma usina de etanol sob a metodologia MCC (manutenção centrada na confiabilidade). Revista Produção Online. 2020;20(4):1331–1353. https://doi.org/10.14488/1676-1901.v20i4.4130
- [51]Gideon EN, Adaramola TS, Fadero S. Reliability engineering and failure analysis in complex engineering systems. Iconic Research and Engineering Journals. 2019;2(11):703–727. https://doi.org/10.64388/IREV2I11-1722490
- [52]Adaramola TS, Fadero S, Gideon EN. Predictive maintenance and condition monitoring in critical power and energy infrastructure. Iconic Research and Engineering Journals. 2018;2(5):454–477. https://doi.org/10.64388/IREV2I5-1722489
- [53]Yu W, et al. A data-driven methodology for the reliability analysis of the natural gas compressor unit considering multiple failure modes. Energies. 2022;15(10):3557. https://doi.org/10.3390/EN15103557
- [54]Gupta G, Mishra RP. Identification of critical components using ANP for implementation of reliability centered maintenance. Procedia CIRP. 2018;69:905–909. https://doi.org/10.1016/j.procir.2017.11.122
- [55]Bevilacqua M, Braglia M. The analytic hierarchy process applied to maintenance strategy selection. Reliability Engineering & System Safety. 2000;70(1):71–83.
- [56]Bertolini M, Bevilacqua M, Bottani E. Multi-attribute approaches for maintenance policies selection problem. Advances in Safety and Reliability: Proceedings of the European Safety and Reliability Conference (ESREL 2005). 2005;1:187–195.
- [57]Saaty TL. The analytic hierarchy process. McGraw-Hill. 1980.
- [58]Saaty TL. Decision making with the analytic hierarchy process. International Journal of Services Sciences. 2008;1(1):83–98.
- [59]Subramanian N, Ramanathan R. A review of applications of analytic hierarchy process in operations management. International Journal of Production Economics. 2012;138(2):215–241.
- [60]Ho W, Ma X. The state-of-the-art integrations and applications of the analytic hierarchy process. European Journal of Operational Research. 2018;267(2):399–414.
- [61]Shafiee M. Maintenance strategy selection problem: An MCDM overview. Journal of Quality in Maintenance Engineering. 2015;21(4):378–402. https://doi.org/10.1108/JQME-09-2013-0063
- [62]Velmurugan RS, Dhingra T. Maintenance strategy selection and its impact in maintenance function: A conceptual framework. International Journal of Operations & Production Management. 2015;35:1622–1661.
- [63]Kirubakaran B, Ilangkumaran M. Selection of optimum maintenance strategy based on FAHP integrated with GRA-TOPSIS. Annals of Operations Research. 2016;245:285–313.
- [64]Hemmati N, Rahiminezhad Galankashi M, Imani D, Mokhatab Rafiei F. An integrated fuzzy-AHP and TOPSIS approach for maintenance policy selection. International Journal of Quality & Reliability Management. 2020;37:1275–1299.
- [65]Jamali N, Feylizadeh MR, Liu P. Prioritization of aircraft maintenance unit strategies using fuzzy analytic network process: A case study. Journal of Air Transport Management. 2021;93:102057.
- [66]Emovon I, Norman RA, Murphy AJ. Hybrid MCDM based methodology for selecting the optimum maintenance strategy for ship machinery systems. Journal of Intelligent Manufacturing. 2018;29:519–531.
- [67]Braglia M, Castellano D, Frosolini M. An integer linear programming approach to maintenance strategies selection. International Journal of Quality & Reliability Management. 2013;30:991–1016.
- [68]Faghihinia E, Mollaverdi N. Building a maintenance policy through a multi-criterion decision-making model. Journal of Industrial Engineering International. 2012;8:14.
- [69]Özcan EC, Ünlüsoy S, Eren T. A combined goal programming - AHP approach supported with TOPSIS for maintenance strategy selection in hydroelectric power plants. Renewable and Sustainable Energy Reviews. 2017;78:1410–1423.
- [70]Ishizaka A, Nemery P. Assigning machines to incomparable maintenance strategies with ELECTRE-SORT. Omega. 2014;47:45–59.
- [71]Cheng YH, Tsao HL. Rolling stock maintenance strategy selection, spares parts’ estimation, and replacements’ interval calculation. International Journal of Production Economics. 2010;128(1):404–412.
- [72]Carnero MC, Gómez A. Maintenance strategy selection in electric power distribution systems. Energy. 2017;129:255–272.
- [73]Shafiee M, et al. Maintenance strategy selection for multi-component systems using a combined analytic network process and cost-risk criticality model. Proceedings of the Institution of Mechanical Engineers, Part O: Journal of Risk and Reliability. 2019;233(2):89–104.
- [74]Carpitella S, et al. A risk evaluation framework for the best maintenance strategy: The case of a marine salt manufacture firm. Reliability Engineering & System Safety. 2021;205.
- [75]Ighravwe DE, Oke SA. Ranking maintenance strategies for sustainable maintenance plan in manufacturing systems using fuzzy axiomatic design principle and fuzzy-TOPSIS. Journal of Manufacturing Technology Management. 2017.
- [76]Amrina E, Yulianto A, Kamil I. Fuzzy multi criteria approach for sustainable maintenance evaluation in rubber industry. Procedia Manufacturing. 2019;33:538–545.
- [77]Pinjala SK, Pintelon L, Vereecke A. An empirical investigation on the relationship between business and maintenance strategies. International Journal of Production Economics. 2006;104:214–229.
- [78]Faccio M, et al. Industrial maintenance policy development: A quantitative framework. International Journal of Production Economics. 2014;147(PA):85–93.
- [79]Labib AW. A decision analysis model for maintenance policy selection using a CMMS. Journal of Quality in Maintenance Engineering. 2004;10(3):191–202.
- [80]Jardine AKS, Lin D, Banjevic D. A review on machinery diagnostics and prognostics implementing condition-based maintenance. Mechanical Systems and Signal Processing. 2006;20(7):1483–1510. https://doi.org/10.1016/J.YMSSP.2005.09.012
- [81]Backlund F, Hannu J. Can we make maintenance decisions on risk analysis results? Journal of Quality in Maintenance Engineering. 2002;8(1):77–91. https://doi.org/10.1108/13552510210420603
- [82]Hijes F, Cartagena J. Maintenance strategy based on a multicriterion classification of equipments. Reliability Engineering & System Safety. 2006;91(4):444–451.
- [83]Khanlari A, Mohammadi K, Sohrabi B. Prioritizing equipments for preventive maintenance (PM) activities using fuzzy rules. Computers & Industrial Engineering. 2008;54:169–184.
- [84]Stadnicka D, Antosz K, Ratnayake RMC. Development of an empirical formula for machine classification: Prioritization of maintenance tasks. Safety Science. 2014;63:34–41.
- [85]Jaderi F, Sa’idi E, Anvaripour B, Nabhani N. Criticality analysis for assets priority setting of abadan oil refinery using AHP and delphi techniques. International Journal of Engineering and Innovative Technology. 2012;2(6):48–53.
- [86]Singh RK, Kulkarni M. Criticality analysis of power-plant equipments using the analytic hierarchy process. International Journal of Industrial Engineering & Technology. 2013;3(4):1–14.
- [87]Jagtap HP, Bewoor AK. Use of analytic hierarchy process methodology for criticality analysis of thermal power plant equipment. Materials Today: Proceedings. 2017;4:1927–1936.
- [88]Taghipour S, Banjevic D, Jardine AKS. Prioritization of medical equipment for maintenance decisions. Journal of the Operational Research Society. 2010.
- [89]Guo L, Gao J, Yang J, Kang J. Criticality evaluation of petrochemical equipment based on fuzzy comprehensive evaluation and a BP neural network. Journal of Loss Prevention in the Process Industries. 2009;22(4):469–476.
- [90]Qi HS, Alzaabi RN, Wood AS, Jani M. A fuzzy criticality assessment system of process equipment for optimised maintenance management. International Journal of Computer Integrated Manufacturing. 2013;28(1):112–125.
- [91]Li L, Ni J. Short-term decision support system for maintenance task prioritization. International Journal of Production Economics. 2009;121:195–202.
- [92]Liu HC, Liu L, Liu N. Risk evaluation approaches in failure mode and effects analysis: A literature review. Expert Systems with Applications. 2013;40(2):828–838. https://doi.org/10.1016/J.ESWA.2012.08.010
- [93]Panchal D, Srivastava P. Qualitative analysis of CNG dispensing system using fuzzy FMEA-GRA integrated approach. International Journal of System Assurance Engineering and Management. 2019;10(1):44–56.
- [94]Srivastava A, Khanduja D, Ganesan S. Fuzzy methodology application for risk analysis of mechanical system in process industry. International Journal of System Assurance Engineering and Management. 2020;11(2):297–312.
- [95]Roda I, Macchi M, Fumagalli L, Viveros P. A review of multi-criteria classification of spare parts: From literature analysis to industrial evidences. Journal of Manufacturing Technology Management. 2014;25(4):528–549.
- [96]Kumar U, Galar D, Parida A, Stenström C, Berges L. Maintenance performance metrics: A state-of-the-art review. Journal of Quality in Maintenance Engineering. 2013.
- [97]Parida A, Kumar U, Galar D, Stenström C. Performance measurement and management for maintenance: A literature review. Journal of Quality in Maintenance Engineering. 2015.
- [98]Muchiri P, Pintelon L, Gelders L, Martin H. Development of maintenance function performance measurement framework and indicators. International Journal of Production Economics. 2011;131(1):295–302.
- [99]Stenström C, Parida A, Kumar U, Galar D. Performance indicators and terminology for value driven maintenance. Journal of Quality in Maintenance Engineering. 2013.
- [100]Franciosi C, Roda I, Voisin A, Miranda S, Macchi M, Iung B. Sustainable maintenance performances and EN 15341:2019: An integration proposal. Advances in Production Management Systems (APMS 2021), IFIP Advances in Information and Communication Technology. 2021;401–409.
- [101]Franciosi C, Voisin A, Miranda S, Riemma S, Iung B. Measuring maintenance impacts on sustainability of manufacturing industries: From a systematic literature review to a framework proposal. Journal of Cleaner Production. 2020;260:121065.
- [102]Franciosi C, Di Pasquale V, Iannone R, Miranda S. Multi-stakeholder perspectives on indicators for sustainable maintenance performance in production contexts: An exploratory study. Journal of Quality in Maintenance Engineering. 2020.
- [103]Ibrahim YM, Hami N, Othman SN. Integrating sustainable maintenance into sustainable manufacturing practices and its relationship with sustainability performance: A conceptual framework. International Journal of Energy Economics and Policy. 2019;9(4):30–39.
- [104]Jasiulewicz-Kaczmarek M, Żywica P, Gola A. Fuzzy set theory driven maintenance sustainability performance assessment model: A multiple criteria approach. Journal of Intelligent Manufacturing. 2021.
- [105]Sari E, Shaharoun AM, Ma’aram A, Yazid AM. Sustainable maintenance performance measures: A pilot survey in malaysian automotive companies. Procedia CIRP. 2015;26:443–448.
- [106]Sénéchal O. Research directions for integrating the triple bottom line in maintenance dashboards. Journal of Cleaner Production. 2017;142:331–342.
- [107]Olugu EU, Wong KY, Ee JYC, Mammedov YD. Incorporating sustainability and maintenance for performance assessment of offshore oil and gas platforms: A perspective. Sustainability. 2022;14(2):807.
- [108]Galante GM, La Fata CM. Combined fuzzy TOPSIS and AHP-based methodology for the prioritization of maintenance key performance indicators: Application to an oil refinery plant. Proceedings of the 2nd International Conference on System Reliability and Safety (ICSRS 2017). 2017;337–342. https://doi.org/10.1109/ICSRS.2017.8272845
- [109]Alsyouf I. The role of maintenance in improving companies’ productivity and profitability. International Journal of Production Economics. 2007;105:70–78.
- [110]Dowlatshahi S. The role of industrial maintenance in the maquiladora industry: An empirical analysis. International Journal of Production Economics. 2008;114:298–307.
- [111]Mostafa S, Lee SH, Dumrak J, Chileshe N, Soltan H. Lean thinking for a maintenance process. Production & Manufacturing Research. 2015;3:236–272.
- [112]Okonkwo CS, Agbabiaka J, Ogunwole O, Mayo W, Okeke OT. Conceptual model for materials readiness and maintenance-driven supply chain performance. International Journal of Multidisciplinary Research and Growth Evaluation. 2021;2(6):584–594. https://doi.org/10.54660/.IJMRGE.2021.2.6.584-594
- [113]Okonkwo CS, Ogunwole O, Okeke OT. Model for inventory availability and plant uptime improvement in energy facilities. Iconic Research and Engineering Journals. 2018;2(4):160–172. https://doi.org/10.64388/IREV2I4-1713120
- [114]Liu XW, Li CY, Dang S, Wang W, Qu J, Chen T, et al. Research on training effectiveness of professional maintenance personnel based on virtual reality and augmented reality technology. Sustainability. 2022;14:14351.
- [115]Nakajima S. Introduction to TPM: Total productive maintenance. Productivity Press. 1988.
- [116]Ng Corrales, L. d. C., Lambán, M. P., Hernandez Korner, M. E., & Royo, J. Overall equipment effectiveness: Systematic literature review and overview of different approaches. Applied Sciences. 2020;10:6469.
- [117]Muchiri P, Pintelon L. Performance measurement using overall equipment effectiveness (OEE): Literature review and practical application discussion. International Journal of Production Research. 2008;46:3517–3535. https://doi.org/10.1080/00207540601142645
- [118]Dal B, Tugwell P, Greatbanks R. Overall equipment effectiveness as a measure of operational improvement: A practical analysis. International Journal of Operations & Production Management. 2000;20:1488–1502. https://doi.org/10.1108/01443570010355750
- [119]Bamber CJ, Castka P, Sharp JM, Motara Y. Cross-functional team working for overall equipment effectiveness (OEE). Journal of Quality in Maintenance Engineering. 2003;9:223–238. https://doi.org/10.1108/13552510310493684
- [120]Braglia M, Frosolini M, Zammori F. Overall equipment effectiveness of a manufacturing line (OEEML). Journal of Manufacturing Technology Management. 2008;20:8–29. https://doi.org/10.1108/17410380910925389
- [121]Garza-Reyes JA. From measuring overall equipment effectiveness (OEE) to overall resource effectiveness (ORE). Journal of Quality in Maintenance Engineering. 2015;21:506–527. https://doi.org/10.1108/JQME-03-2014-0014
- [122]Jonsson P, Lesshammar M. Evaluation and improvement of manufacturing performance measurement systems: The role of OEE. International Journal of Operations & Production Management. 1999;19:55–78. https://doi.org/10.1108/01443579910244223
- [123]Gupta AK, Garg R. OEE improvement by TPM implementation: A case study. International Journal of IT, Engineering and Applied Sciences Research. 2012;1:115–124.
- [124]Ylipää T, Skoogh A, Bokrantz J, Gopalakrishnan M. Identification of maintenance improvement potential using OEE assessment. International Journal of Productivity and Performance Management. 2017;66:126–143.
- [125]Mansour H, Ahmad MM, Dhafr N, Ahmed H. Evaluation of operational performance of workover rigs activities in oilfields. International Journal of Productivity and Performance Management. 2013;62:204–218. https://doi.org/10.1108/17410401311295740
- [126]Palanisamy V. Implementing overall equipment effectiveness in a process industry. Indian Journal of Science and Technology. 2013;6:1–5. https://doi.org/10.17485/ijst/2013/v6isp6.17
- [127]Fekri Sari M, Avakh Darestani S. Fuzzy overall equipment effectiveness and line performance measurement using artificial neural network. Journal of Quality in Maintenance Engineering. 2019;25:340–354. https://doi.org/10.1108/JQME-12-2017-0085
- [128]Zennaro I, Battini D, Sgarbossa F, Persona A, De Marchi R. Micro downtime: Data collection, analysis and impact on OEE in bottling lines the san benedetto case study. International Journal of Quality & Reliability Management. 2018;35:965–995. https://doi.org/10.1108/IJQRM-11-2016-0202
- [129]Sharma R. Overall equipment effectiveness measurement of TPM manager model machines in flexible manufacturing environment: A case study of automobile sector. International Journal of Productivity and Quality Management. 2019;26:206–222. https://doi.org/10.1504/IJPQM.2019.097767
- [130]Singh K, Ahuja IPS. Assessing the business performance measurements for transfusion of TQM and TPM initiatives in the indian manufacturing industry. International Journal of Technology, Policy and Management. 2014;14:44. https://doi.org/10.1504/IJTPM.2014.058733
- [131]Benjamin SJ, Marathamuthu MS, Murugaiah U. The use of 5-WHYs technique to eliminate OEE’s speed loss in a manufacturing firm. Journal of Quality in Maintenance Engineering. 2015;21:419–435. https://doi.org/10.1108/JQME-09-2013-0062
- [132]Samatemba B, Zhang L, Besa B. Evaluating and optimizing the effectiveness of mining equipment; the case of chibuluma south underground mine. Journal of Cleaner Production. 2020;252:119697. https://doi.org/10.1016/j.jclepro.2019.119697
- [133]Rastegari A, Mobin M. Maintenance decision making, supported by computerized maintenance management system. 2016 Annual Reliability and Maintainability Symposium (RAMS). 2016;1–8.
- [134]Fernandez O, Labib AW, Walmsley R, Petty DJ. A decision support maintenance management system: Development and implementation. International Journal of Quality & Reliability Management. 2003;20(8):965–979.
- [135]Brundage MP, Sexton T, Hodkiewicz M, Dima A, Lukens S. Technical language processing: Unlocking maintenance knowledge. Manufacturing Letters. 2021;27:42–46. https://doi.org/10.1016/j.mfglet.2020.11.001
- [136]Sexton TB, Brundage MP. Nestor: A tool for natural language annotation of short texts. Journal of Research of the National Institute of Standards and Technology. 2019;124.
- [137]Sexton T, Brundage MP, Hoffman M, Morris KC. Hybrid datafication of maintenance logs from AI-assisted human tags. 2017 IEEE International Conference on Big Data (Big Data). 2017;1769–1777. https://doi.org/10.1109/BigData.2017.8258120
- [138]Brundage MP, Morris KC, Sexton T, Moccozet S, Hoffman M. Developing maintenance key performance indicators from maintenance work order data. International Manufacturing Science and Engineering Conference (ASME). 2018;51371:V003T02A027.
- [139]Navinchandran M, Sharp ME, Brundage MP, Sexton TB. Discovering critical KPI factors from natural language in maintenance work orders. Journal of Intelligent Manufacturing. 2021.
- [140]Wang TY, Pan HC. Improving the OEE and UPH data quality by automated data collection for the semiconductor assembly industry. Expert Systems with Applications. 2011;38:5764–5773. https://doi.org/10.1016/j.eswa.2010.10.056
- [141]Adaramola TS, Gideon EN, Fadero S. Machine learning and data-driven methods for industrial automation and process control. International Journal of Engineering and Modern Technology. 2020;6(3):103–128. https://doi.org/10.56201/ijemt.vol.6.no3.2020.pg103.128
- [142]Komi NM, Adamolekun A. Interpretable machine learning for early failure prediction in distributed renewable energy assets. International Journal of Multidisciplinary Research and Growth Evaluation. 2021;2(6):1015–1038. https://doi.org/10.54660/.IJMRGE.2021.2.6.1015-1038
- [143]Amaechi CV, Reda A, Kgosiemang IM, Ja’e IA, Oyetunji AK, Olukolajo MA, et al. Guidelines on asset management of offshore facilities for monitoring, sustainable maintenance, and safety practices. Sensors. 2022;22(19):7270. https://doi.org/10.3390/s22197270
- [144]Zhang Y, Pang X, Qu S, et al. Discussion of the CO2 corrosion mechanism between low partial pressure and supercritical condition. Corrosion Science. 2012;59:186–197.
- [145]Hua Y, Barker R, Charpentier T, et al. Relating iron carbonate morphology to corrosion characteristics for water-saturated supercritical CO2 systems. Journal of Supercritical Fluids. 2015;98:183–193.
- [146]Sun C, Sun J, Wang Y, et al. Synergistic effect of O2, H2S and SO2 impurities on the corrosion behavior of X65 steel in water-saturated supercritical CO2 system. Corrosion Science. 2016;107:193–203.
- [147]Choi YS, Nesic S, Young D. Effect of impurities on the corrosion behavior of CO2 transmission pipeline steel in supercritical CO2-water environments. Environmental Science & Technology. 2010;44(23):9233–9238.
- [148]Xiang Y, Xu M, Choi YS. State-of-the-art overview of pipeline steel corrosion in impure dense CO2 for CCS transportation: Mechanisms and models. Corrosion Engineering, Science and Technology. 2017;52(7):485–509. https://doi.org/10.1080/1478422X.2017.1304690
- [149]Cole IS, Corrigan P, Sim S, et al. Corrosion of pipelines used for CO2 transport in CCS: Is it a real problem? International Journal of Greenhouse Gas Control. 2011;5(4):749–756.
- [150]Li Q, Hu H, Cheng YF. Corrosion of pipelines in CO2 saturated oil-water emulsion flow studied by electrochemical measurements and computational fluid dynamics modeling. Journal of Petroleum Science and Engineering. 2016;147:408–415. https://doi.org/10.1016/j.petrol.2016.09.011
- [151]Sim S, Cole IS, Choi YS, et al. A review of the protection strategies against internal corrosion for the safe transport of supercritical CO2 via steel pipelines for CCS purposes. International Journal of Greenhouse Gas Control. 2014;29:185–199.
- [152]Alamri AH. Localized corrosion and mitigation approach of steel materials used in oil and gas pipelines: An overview. Engineering Failure Analysis. 2020;116:104735. https://doi.org/10.1016/j.engfailanal.2020.104735
- [153]Ilman, M. N., & Kusmono. Analysis of internal corrosion in subsea oil pipeline. Case Studies in Engineering Failure Analysis. 2014;2:1–8.
- [154]Kakooei S, Ismail MC, Ariwahjoedi B. Mechanisms of microbiologically influenced corrosion: A review. World Applied Sciences Journal. 2012;17(4):524–531.
- [155]Spark A, Wang K, Cole I, Law D, Ward L. Microbiologically influenced corrosion: A review of the studies conducted on buried pipelines. Corrosion Reviews. 2020;38(3):231–262.
- [156]Obetta PC, Ninduwezuor-Ehiobu N, Olisakwe HC. Corrosion management and material selection for crude oil export equipment in marine environments: A review. International Journal of Multidisciplinary Futuristic Development. 2020;1(1):92–110. https://doi.org/10.54660/IJMFD.2020.1.1.92-110
- [157]Qiao Q, Cheng G, Li Y, Wu W, Hu H, Huang H. Corrosion failure analyses of an elbow and an elbow-to-pipe weld in a natural gas gathering pipeline. Engineering Failure Analysis. 2017;82:599–616. https://doi.org/10.1016/j.engfailanal.2017.04.016
- [158]Islam MA, Farhat ZN. The synergistic effect between erosion and corrosion of API pipeline in CO2 and saline medium. Tribology International. 2013;68:26–34. https://doi.org/10.1016/j.triboint.2012.10.026
- [159]Chen Y, Wu H, Chen Y, Li P, Wang Q. Erosion-corrosion coupling analysis of shale gas production pipe. Engineering Failure Analysis. 2022;138:106308. https://doi.org/10.1016/j.engfailanal.2022.106308
- [160]Jones M, Llewellyn RJ. Erosion-corrosion assessment of materials for use in the resources industry. Wear. 2009;267:2003–2009. https://doi.org/10.1016/j.wear.2009.06.025
- [161]Tang X, Xu LY, Cheng YF. Electrochemical corrosion behavior of x-65 steel in the simulated oil-sand slurry. II: Synergism of erosion and corrosion. Corrosion Science. 2008;50:1469–1474. https://doi.org/10.1016/j.corsci.2008.01.019
- [162]Lu BT, Luo JL, Guo HX, Mao LC. Erosion-enhanced corrosion of carbon steel at passive state. Corrosion Science. 2011;53:432–440. https://doi.org/10.1016/j.corsci.2010.09.054
- [163]Jia W, Zhang Y, Li C, Luo P, Song X, Wang Y, et al. Experimental and numerical simulation of erosion-corrosion of 90° steel elbow in shale gas pipeline. Journal of Natural Gas Science and Engineering. 2021;89:103871. https://doi.org/10.1016/j.jngse.2021.103871
- [164]El-Sayed MH. Flow enhanced corrosion of water injection pipelines. Engineering Failure Analysis. 2015;50:1–6. https://doi.org/10.1016/j.engfailanal.2015.01.007
- [165]Khan R, Ya HH, Pao W, Majid MAA, Ahmed T, Ahmad A, et al. Effect of sand fines concentration on the erosion-corrosion mechanism of carbon steel 90° elbow pipe in slug flow. Materials. 2020;13:4601. https://doi.org/10.3390/ma13204601
- [166]Thaker J, Banerjee J. Influence of intermittent flow sub-patterns on erosion-corrosion in horizontal pipe. Journal of Petroleum Science and Engineering. 2016;145:298–320. https://doi.org/10.1016/j.petrol.2016.05.006
- [167]Wongpanya P, Saramas Y, Chumkratoke C, Wannakomol A. Erosion-corrosion behaviors of 1045 and J55 steels in crude oil. Journal of Petroleum Science and Engineering. 2020;189:106965. https://doi.org/10.1016/j.petrol.2020.106965
- [168]Stack MM, Abdulrahman GH. Mapping erosion-corrosion of carbon steel in oil-water solutions: Effects of velocity and applied potential. Wear. 2012;274–275:401–413. https://doi.org/10.1016/j.wear.2011.10.008
- [169]Xu Y, Liu L, Zhou Q, Wang X, Tan MY, Huang Y. An overview of major experimental methods and apparatus for measuring and investigating erosion-corrosion of ferrous-based steels. Metals. 2020;10:180. https://doi.org/10.3390/met10020180
- [170]Adewoyin MA, Ogunnowo EO, Fiemotongha JE, Igunma TO, Adeleke AK. Advances in CFD-driven design for fluid-particle separation and filtration systems in engineering applications. Iconic Research and Engineering Journals. 2021;5(3):347–365.
- [171]Cao Q, Pojtanabuntoeng T, Esmaily M, Thomas S, Brameld M, Amer A, et al. A review of corrosion under insulation: A critical issue in the oil and gas industry. Metals. 2022;12(4):561. https://doi.org/10.3390/met12040561
- [172]Javaherdashti R. Corrosion under insulation (CUI): A review of essential knowledge and practice. Journal of Materials Science & Surface Engineering. 2014;1:36–43.
- [173]Winnik S. Corrosion under insulation (CUI) guidelines (2nd ed.). Elsevier (European Federation of Corrosion). 2015.
- [174]NACE International. NACE SP0198–2017: Control of corrosion under thermal insulation and fireproofing materials: A systems approach. NACE International. 2017.
- [175]American Petroleum Institute. API RP 583: Corrosion under insulation and fireproofing (2nd ed.). American Petroleum Institute. 2021.
- [176]Eltai EO, Musharavati F, Mahdi E. Severity of corrosion under insulation (CUI) to structures and strategies to detect it. Corrosion Reviews. 2019. https://doi.org/10.1515/corrrev-2018-0102
- [177]Caines S, Khan F, Shirokoff J, Qiu W. Experimental design to study corrosion under insulation in harsh marine environments. Journal of Loss Prevention in the Process Industries. 2015;33:39–51. https://doi.org/10.1016/j.jlp.2014.10.014
- [178]Geary W. Analysis of a corrosion under insulation failure in a carbon steel refinery hydrocarbon line. Case Studies in Engineering Failure Analysis. 2013;1:249–256. https://doi.org/10.1016/j.csefa.2013.09.001
- [179]Eltai E, Alkhalifa K, Al-Rayashi A, Mahdi E, Hamouda AMS. Investigating the corrosion under insulation (CUI) on steel pipe exposed to Arabian Gulf sea water drops. Key Engineering Materials. 2016;689:148–153. https://doi.org/10.4028/www.scientific.net/KEM.689.148
- [180]Cao Q, Esmaily M, Liu RL, Birbilis N, Thomas S. Corrosion of mild steel under insulation: The effect of dissolved metal ions. Corrosion Engineering, Science and Technology. 2020;55:322–330. https://doi.org/10.1080/1478422X.2020.1734737
- [181]Pojtanabuntoeng T, Machuca LL, Salasi M, Kinsella B, Cooper M. Influence of drain holes in jacketing on corrosion under thermal insulation. Corrosion. 2015;71:1511–1520. https://doi.org/10.5006/1861
- [182]Mohsin KM, Mokhtar AA, Tse PW. A fuzzy logic method: Predicting corrosion under insulation of piping systems with modelling of CUI 3D surfaces. International Journal of Pressure Vessels and Piping. 2019;175:103929. https://doi.org/10.1016/j.ijpvp.2019.103929
- [183]Pechacek RW. NDT inspection of insulated vessels and piping for interior corrosion and corrosion under insulation. Materials Performance. 2004;43:28–32.
- [184]Mokhtar AA, Che Ismail M, Zainordin AB, Shahid S. A framework for estimating piping reliability subject to corrosion under insulation. MATEC Web of Conferences (ICPER 2014). 2014;13:03001.
- [185]Ahmadi O, Mortazavi SB, Mahabadi HA. Review of atmospheric storage tank fire scenarios: Costs and causes. Journal of Failure Analysis and Prevention. 2020;20:384–405. https://doi.org/10.1007/s11668-020-00846-5
- [186]Moshashaei P, Alizadeh SS, Khazini L, Asghari-Jafarabadi M. Investigate the causes of fires and explosions at external floating roof tanks: A comprehensive literature review. Journal of Failure Analysis and Prevention. 2017;17(5):1044–1052. https://doi.org/10.1007/s11668-017-0333-0
- [187]Mishra KB, Wehrstedt KD, Krebs H. Lessons learned from recent fuel storage fires. Fuel Processing Technology. 2013;107:166–172. https://doi.org/10.1016/j.fuproc.2012.08.003
- [188]Zhou Y, Zhao X, Zhao J, Chen D. Research on fire and explosion accidents of oil depots. Chemical Engineering Transactions. 2016;51:163–168. https://doi.org/10.3303/CET1651028
- [189]Cornell JR, Baker MA. Catastrophic tank failures: Highlights of past failures along with proactive tank designs. Proceedings of the US EPA Fourth Biennial Freshwater Spills Symposium, Cleveland, Ohio. 2002.
- [190]Nivolianitou Z, Argyropoulos C, Christolis M, Markatos N. A methodology for the hazard assessment in large hydrocarbon fuel tanks. Chemical Engineering Transactions. 2012;26:171–176.
- [191]Crippa C, Fiorentini L, Rossini V, Stefanelli R, Tafaro S, Marchi M. Fire risk management system for safe operation of large atmospheric storage tanks. Journal of Loss Prevention in the Process Industries. 2009;22(5):574–578.
- [192]Riezel Y. Explosion and fire in a gas-oil fixed roof storage tank: Case study and lessons learned. Process Safety Progress. 2002;21(1):67–73.
- [193]Godoy LA, Batista-Abreu JC. Buckling of fixed-roof aboveground oil storage tanks under heat induced by an external fire. Thin-Walled Structures. 2012;52:90–101.
- [194]American Petroleum Institute. API standard 650: Welded steel tanks for oil storage. American Petroleum Institute. 2007.
- [195]Dey PK. A risk-based model for inspection and maintenance of cross-country petroleum pipeline. Journal of Quality in Maintenance Engineering. 2001;7:25–43. https://doi.org/10.1108/13552510110386874
- [196]Gomes WJS, Beck AT, Haukaas T. Optimal inspection planning for onshore pipelines subject to external corrosion. Reliability Engineering & System Safety. 2013;118:18–27. https://doi.org/10.1016/j.ress.2013.04.011
- [197]Alamilla JL, Oliveros J, García-Vargas J. Probabilistic modelling of a corroded pressurized pipeline at inspection time. Structure and Infrastructure Engineering(2), 91–104; 2009.
- [198]Schoefs F, Boéro J. The αδ method for modeling NDT results in risk based inspection of corroded steel wharves. Matériaux & Techniques. 2013;101(5–6):507. https://doi.org/10.1051/mattech/2013081
- [199]Soomro AA, Mokhtar AA, Kurnia JC, Lashari N, Sarwar U, Jameel SM, et al. A review on Bayesian modeling approach to quantify failure risk assessment of oil and gas pipelines due to corrosion. International Journal of Pressure Vessels and Piping. 2022;200:104841. https://doi.org/10.1016/j.ijpvp.2022.104841
- [200]Shahriar A, Sadiq R, Tesfamariam S. Risk analysis for oil & gas pipelines: A sustainability assessment approach using fuzzy based bow-tie analysis. Journal of Loss Prevention in the Process Industries. 2012;25:505–523.
- [201]Zakikhani K, Nasiri F, Zayed T. A review of failure prediction models for oil and gas pipelines. Journal of Pipeline Systems Engineering and Practice. 2020;11:03119001. https://doi.org/10.1061/(ASCE)PS.1949-1204.0000407
- [202]Ahmed SK, Kabir G. An integrated approach for failure analysis of natural gas transmission pipeline. CivilEng. 2021;2:87–119.
- [203]Vanaei HR, Eslami A, Egbewande A. A review on pipeline corrosion, in-line inspection (ILI), and corrosion growth rate models. International Journal of Pressure Vessels and Piping. 2017;149:43–54. https://doi.org/10.1016/j.ijpvp.2016.11.007
- [204]Ma Q, Tian G, Zeng Y, Li R, Song H, Wang Z, et al. Pipeline in-line inspection method, instrumentation and data management. Sensors. 2021;21(11):3862. https://doi.org/10.3390/s21113862
- [205]Coramik M, Ege Y. Discontinuity inspection in pipelines: A comparison review. Measurement. 2017;111:359–373. https://doi.org/10.1016/j.measurement.2017.07.058
- [206]Budhe S, Banea MD, Rohem NRF, Sampaio EM, de Barros S. Failure pressure analysis of composite repair system for wall loss defect of metallic pipelines. Composite Structures. 2017;176:1013–1019.
- [207]Ogunnowo EO, Adewoyin MA, Fiemotongha JE, Igunma TO, Adeleke AK. Systematic review of non-destructive testing methods for predictive failure analysis in mechanical systems. Iconic Research and Engineering Journals. 2020;4(4):207–222.
- [208]Obetta PC, Ninduwezuor-Ehiobu N, Olisakwe HC. Advances in non-intrusive inspection of pressure vessels: Reducing shutdown frequency and OPEX in oil and gas operations. International Journal of Multidisciplinary Research and Growth Evaluation. 2021;2(6):1137–1153. https://doi.org/10.54660/.IJMRGE.2021.2.6.1137-1153
- [209]Atta S, Tofah P, Adenuga OM. Advances in non-destructive testing methods for weld integrity evaluation in high-capacity power infrastructure. International Journal of Engineering and Modern Technology. 2021;7(1):20–47. https://doi.org/10.56201/ijemt.vol.7.no1.2021.pg20.47
- [210]Atta S, Adjaklo E, Asomani E, Adenuga OM. Advances in welding inspection standards and quality assurance practices in large-scale power generation projects. International Journal of Engineering and Modern Technology. 2022;8(5):101–124. https://doi.org/10.56201/ijemt.v8.no5.2022.pg101.124
- [211]Dagodzo D, Ahiaeke Patrick MC. A review of GIS applications in utility asset management and infrastructure planning. Iconic Research and Engineering Journals. 2021;5(3):468–492. https://doi.org/10.64388/IREV5I3-1716085
- [212]Dagodzo D, Ahiaeke Patrick MC. UAV-based pipeline and corridor monitoring: A review of current practices and emerging technologies. Iconic Research and Engineering Journals. 2020;3(10):574–597. https://doi.org/10.64388/IREV3I10-1716084
- [213]Anderson TL, Osage DA. API 579: A comprehensive fitness-for-service guide. International Journal of Pressure Vessels and Piping. 2000;77:953–963.
- [214]Osage DA. Fatigue assessment for in-service components: A new part for API 579–1/ASME FFS-1 fitness-for-service. Procedia Engineering. 2015;133:320–347.
- [215]Cravero S, Ruggieri C. Structural integrity analysis of axially cracked pipelines using conventional and constraint-modified failure assessment diagrams. International Journal of Pressure Vessels and Piping. 2006;83:607–617.
- [216]Pluvinage G, Bouledroua O, Hadj Meliani M, Suleiman R. Corrosion defect analysis using domain failure assessment diagram. International Journal of Pressure Vessels and Piping. 2018;165:126–134.
- [217]Muthanna BGN, Bouledroua O, Meriem-Benziane M, Setvati MR, Djukic MB. Assessment of corroded API 5L X52 pipe elbow using a modified failure assessment diagram. International Journal of Pressure Vessels and Piping. 2021;190:104291.
- [218]Ainsworth RA, Gintalas M, Sahu MK, Chattopadhyay J, Dutta BK. Application of failure assessment diagram methods to cracked straight pipes and elbows. International Journal of Pressure Vessels and Piping. 2016;148:26–35.
- [219]Ghanbari M, Ranjbar Naserabadi MJ, Mirzadeh F. Evaluation of a pressure vessel using failure analysis diagram based on phased array ultrasonic testing data. Journal of Structural Integrity and Maintenance. 2022;7(3):198–205.
- [220]British Standards Institution. BS 7910:2013+A1:2015 guide to methods for assessing the acceptability of flaws in metallic structures. BSI. 2015.
- [221]American Society of Mechanical Engineers. ASME B31G-2009: Manual for determining the remaining strength of corroded pipelines. ASME. 2009.
- [222]Ma B, Shuai J, Wang J, Han K. Analysis on the latest assessment criteria of ASME B31G-2009 for the remaining strength of corroded pipelines. Journal of Failure Analysis and Prevention. 2011;11:666–667.
- [223]Det Norske Veritas. DNV-RP-F101: Corroded pipelines. DNV. 2015.
- [224]Canadian Standards Association. CSA Z662–19: Oil and gas pipeline systems. CSA Group. 2019.
- [225]Cosham A, Hopkins P, Macdonald KA. Best practice for the assessment of defects in pipelines. Engineering Failure Analysis. 2007;14:1245–1265.
- [226]Zhu XK, Leis BN. Evaluation of burst pressure prediction models for line pipes. International Journal of Pressure Vessels and Piping. 2012;89:85–97.
- [227]Zhu XK. A comparative study of burst failure models for assessing remaining strength of corroded pipelines. Journal of Pipeline Science and Engineering. 2021;1(1):36–50.
- [228]Zhou W, Huang GX. Model error assessments of burst capacity models for corroded pipelines. International Journal of Pressure Vessels and Piping. 2012;99–100:1–8.
- [229]Bhardwaj U, Teixeira AP, Guedes Soares C. Uncertainty quantification of burst pressure models of corroded pipelines. International Journal of Pressure Vessels and Piping. 2020;188:104208.
- [230]Chauhan V, Brister J. A review of methods for assessing the remaining strength of corroded pipelines (final report 153A). U.S. Department of Transportation. 2009.
- [231]Choi JB, Goo BK, Kim JC, Kim Y, Kim W. Development of limit load solutions for corroded gas pipelines. International Journal of Pressure Vessels and Piping. 2003;80:121–128.
- [232]Yeom KJ, Lee YK, Oh KH, Kim WS. Integrity assessment of a corroded API X70 pipe with a single defect by burst pressure analysis. Engineering Failure Analysis. 2015;57:553–561.
- [233]Chiodo MSG, Ruggieri C. Failure assessments of corroded pipelines with axial defects using stress-based criteria: Numerical studies and verification analyses. International Journal of Pressure Vessels and Piping. 2009;86:164–176.
- [234]Velázquez JC, González-Arévalo NE, Díaz-Cruz M, Cervantes-Tobón A, Herrera-Hernández H, Hernández-Sánchez E. Failure pressure estimation for an aged and corroded oil and gas pipeline: A finite element study. Journal of Natural Gas Science and Engineering. 2022;101:104532.
- [235]Sun J, Cheng YF. Assessment by finite element modeling of the interaction of multiple corrosion defects and the effect on failure pressure of corroded pipelines. Engineering Structures. 2018;165:278–286.
- [236]Bony M, Alamilla JL, Vai R, Flores E. Failure pressure in corroded pipelines based on equivalent solutions for undamaged pipe. Journal of Pressure Vessel Technology. 2010;132:051001.
- [237]Ma B, Shuai J, Liu D, Xu K. Assessment on failure pressure of high strength pipeline with corrosion defects. Engineering Failure Analysis. 2013;32:209–219.
- [238]Idris NN, Mustaffa Z, Ben Seghier MEA, Trung NT. Burst capacity and development of interaction rules for pipelines considering radial interacting corrosion defects. Engineering Failure Analysis. 2021;121:105124.
- [239]Oh DH, Race J, Oterkus S, Chang E. A new methodology for the prediction of burst pressure for API 5L x grade flawless pipelines. Ocean Engineering. 2020;212:107602.
- [240]Bhardwaj U, Teixeira AP, Guedes Soares C. Burst strength assessment of X100 to X120 ultra-high strength corroded pipes. Ocean Engineering. 2021;241:110004.
- [241]Lyons CJ, Race JM, Chang E, Cosham A, Wetenhall B, Barnett J. Validation of the NG-18 equations for thick-walled pipelines. Engineering Failure Analysis. 2020;112:104494.
- [242]Leis BN. Evolution of metal-loss severity criteria: Gaps and forward. Journal of Pipeline Science and Engineering. 2021;1:51–62.
- [243]Li H, Huang K, Zeng Q, Sun C. Residual strength assessment and residual life prediction of corroded pipelines: A decade review. Energies. 2022;15:726.
- [244]Amaya-Gómez R, Sánchez-Silva M, Bastidas-Arteaga E, Schoefs F, Muñoz F. Reliability assessments of corroded pipelines based on internal pressure: A review. Engineering Failure Analysis. 2019;98:190–214.
- [245]Ben Seghier MEA, Keshtegar B, Elahmoune B. Reliability analysis of low, mid and high-grade strength corroded pipes based on plastic flow theory using adaptive nonlinear conjugate map. Engineering Failure Analysis. 2018;90:245–261.
- [246]Cai J, Jiang X, Yang Y, Lodewijks G, Wang M. Data-driven methods to predict the burst strength of corroded pipelines subjected to internal pressure. Journal of Marine Science and Application. 2022;21:115–132.
- [247]Zhu XK, Johnson WR, Sindelar R, Wiersma B. Artificial neural network models of burst strength for thin-wall pipelines. Journal of Pipeline Science and Engineering. 2022;2:100090.
- [248]Chin KT, Arumugam T, Karuppanan S, Ovinis M. Failure pressure prediction of pipeline with single corrosion defect using artificial neural network. Pipeline Science and Technology. 2020;4:10–17.
- [249]Ossai CI. Corrosion defect modelling of aged pipelines with a feed-forward multi-layer neural network for leak and burst failure estimation. Engineering Failure Analysis. 2020;110:104397.
- [250]Lo M, Karuppanan S, Ovinis M. ANN- and FEA-based assessment equation for a corroded pipeline with a single corrosion defect. Journal of Marine Science and Engineering. 2022;10:476.
- [251]Das AN, Sarmah SP. Preventive replacement models: An overview and their application in process industries. European Journal of Industrial Engineering. 2010;4(3):280–307.
- [252]Thomas LC. A survey of maintenance and replacement models for maintainability and reliability of multi-item systems. Reliability Engineering. 1986;16(4):297–309. https://doi.org/10.1016/0143-8174(86)90099-5
- [253]Cho DI, Parlar M. A survey of maintenance models for multi-unit systems. European Journal of Operational Research. 1991;51(1):1–23.
- [254]Nicolai RP, Dekker R. Optimal maintenance of multi-component systems: A review. In K. A. H. Kobbacy & D. N. P. Murthy (Eds.), Complex System Maintenance Handbook (pp. 263–286). Springer. 2008;263–286. https://doi.org/10.1007/978-1-84800-011-7_11
- [255]Nowakowski T, Werbińska-Wojciechowska S. On problems of multicomponent system maintenance modelling. International Journal of Automation and Computing. 2009;6(4):364–378. https://doi.org/10.1007/s11633-009-0364-4
- [256]Nakagawa T. Maintenance theory of reliability. Springer. 2005.
- [257]Nakagawa T. A summary of discrete replacement policies. European Journal of Operational Research. 1984;17(3):382–392.
- [258]Nakagawa T. Random maintenance policies. Springer. 2014.
- [259]Zhao X, Nakagawa T. Optimization problems of replacement first or last in reliability theory. European Journal of Operational Research. 2012;223(1):141–149.
- [260]Zhao X, Mizutani S, Nakagawa T. Which is better for replacement policies with continuous or discrete scheduled times? European Journal of Operational Research. 2015;242(2):477–486.
- [261]Mizutani S, Zhao X, Nakagawa T. Age and periodic replacement policies with two failure modes in general replacement models. Reliability Engineering & System Safety. 2021;214. https://doi.org/10.1016/j.ress.2021.107754
- [262]Badía FG, Berrade MD, Lee H. An study of cost effective maintenance policies: Age replacement versus replacement after n minimal repairs. Reliability Engineering & System Safety. 2020;201.
- [263]Eryilmaz S. Revisiting discrete time age replacement policy for phase-type lifetime distributions. European Journal of Operational Research. 2021;295(2):699–704.
- [264]Eryilmaz S. Age-based preventive maintenance for coherent systems with applications to consecutive-k-out-of-n and related systems. Reliability Engineering & System Safety. 2020;204.
- [265]Safaei F, Châtelet E, Ahmadi J. Optimal age replacement policy for parallel and series systems with dependent components. Reliability Engineering & System Safety. 2020;197.
- [266]Hamidi M, Szidarovszky F, Szidarovszky M. New one cycle criteria for optimizing preventive replacement policies. Reliability Engineering & System Safety. 2016;154:42–48.
- [267]Sheu SH, Liu TH, Zhang ZG. Extended optimal preventive replacement policies with random working cycle. Reliability Engineering & System Safety. 2019;188:398–415.
- [268]Yang L, Zhao Y, Peng R, Ma X. Hybrid preventive maintenance of competing failures under random environment. Reliability Engineering & System Safety. 2018;174:130–140. https://doi.org/10.1016/j.ress.2018.02.017
- [269]Shafiee M, Finkelstein M. An optimal age-based group maintenance policy for multi-unit degrading systems. Reliability Engineering & System Safety. 2015;134:230–238.
- [270]Christer AH. Developments in delay time analysis for modelling plant maintenance. Journal of the Operational Research Society. 1999;50(11):1120–1137.
- [271]Christer AH, Lee C. Refining the delay-time-based PM inspection model with non-negligible system downtime estimates of the expected number of failures. International Journal of Production Economics. 2000;67(1):77–85.
- [272]Christer AH, Redmond DF. Revising models of maintenance and inspection. International Journal of Production Economics. 1992;24(3):227–234.
- [273]Baker RD, Christer AH. Review of delay-time OR modelling of engineering aspects of maintenance. European Journal of Operational Research. 1994;73(3):407–422.
- [274]Wang W. Delay time modelling. In K. A. H. Kobbacy & D. N. P. Murthy (Eds.), Complex System Maintenance Handbook (pp. 345–370). Springer. 2008;345–370.
- [275]Christer AH, Lee C, Wang W. A data deficiency based parameter estimating problem and case study in delay time PM modeling. International Journal of Production Economics. 2000;67(1):63–76.
- [276]Wang W. Subjective estimation of the delay time distribution in maintenance modelling. European Journal of Operational Research. 1997;99(3):516–529.
- [277]Jones B, Jenkinson I, Wang J. Methodology of using delay-time analysis for a manufacturing industry. Reliability Engineering & System Safety. 2009;94(1):111–124.
- [278]Aven T, Castro IT. A delay-time model with safety constraint. Reliability Engineering & System Safety. 2009;94(2):261–267.
- [279]Wang W. An inspection model for a process with two types of inspections and repairs. Reliability Engineering & System Safety. 2009;94(2):526–533.
- [280]Wang W. An inspection model based on a three-stage failure process. Reliability Engineering & System Safety. 2011;96(7):838–848.
- [281]Wang W, Banjevic D, Pecht M. A multi-component and multi-failure mode inspection model based on the delay time concept. Reliability Engineering & System Safety. 2010;95(8):912–920.
- [282]Wang W, Banjevic D. Ergodicity of forward times of the renewal process in a block-based inspection model using the delay time concept. Reliability Engineering & System Safety. 2012;100:1–7.
- [283]Berrade MD, Scarf PA, Cavalcante CAV. A study of postponed replacement in a delay time model. Reliability Engineering & System Safety. 2017;168:70–79.
- [284]Cavalcante CAV, Scarf PA, de Almeida AT. A study of a two-phase inspection policy for a preparedness system with a defective state and heterogeneous lifetime. Reliability Engineering & System Safety. 2011;96(6):627–635.
- [285]Cerone P. Inspection interval for maximum future reliability using the delay time model. European Journal of Operational Research. 1993;68(2):236–250.
- [286]Redmond DF, Christer AH, Rigden SR, Burley E, Tajelli A, Abu-Tair A. O.R. modelling of the deterioration and maintenance of concrete structures. European Journal of Operational Research. 1997;99(3):619–631.
- [287]Luss H. An inspection policy model for production facilities. Management Science. 1983;29(9):1102–1109.
- [288]Cavalcante CAV, Lopes RS, Scarf PA. Inspection and replacement policy with a fixed periodic schedule. Reliability Engineering & System Safety. 2021;208.
- [289]Apeland S, Scarf PA. A fully subjective approach to modelling inspection maintenance. European Journal of Operational Research. 2003;148(2):410–425.
- [290]Ferreira RJP, de Almeida AT, Cavalcante CAV. A multi-criteria decision model to determine inspection intervals of condition monitoring based on delay time analysis. Reliability Engineering & System Safety. 2009;94(5):905–912.
- [291]Wang W. A joint spare part and maintenance inspection optimisation model using the delay-time concept. Reliability Engineering & System Safety. 2011;96(11):1535–1541.
- [292]Wang W. A stochastic model for joint spare parts inventory and planned maintenance optimisation. European Journal of Operational Research. 2012;216(1):127–139.
- [293]Dekker R, Wildeman RE, van der Duyn Schouten FA. A review of multi-component maintenance models with economic dependence. Mathematical Methods of Operations Research. 1997;45(3):411–435. https://doi.org/10.1007/BF01194788
- [294]Wildeman RE, Dekker R. Dynamic influences in multi-component maintenance. Quality and Reliability Engineering International. 1997;13(4):199–207.
- [295]Van der Duyn Schouten FA, Vanneste SG. Two simple control policies for a multicomponent maintenance system. Operations Research. 1993;41(6):1125–1136.
- [296]Sheu SH, Jhang JP. A generalized group maintenance policy. European Journal of Operational Research. 1996;96(2):232–247.
- [297]Radner R, Jorgenson DW. Opportunistic replacement of a single part in the presence of several monitored parts. Management Science. 1963;10(1):70–84.
- [298]Ab-Samat H, Kamaruddin S. Opportunistic maintenance (OM) as a new advancement in maintenance approaches: A review. Journal of Quality in Maintenance Engineering. 2014;20(2):98–121. https://doi.org/10.1108/JQME-04-2013-0018
- [299]Do P, Barros A, Bérenguer C, Bouvard K, Brissaud F. Dynamic grouping maintenance with time limited opportunities. Reliability Engineering & System Safety. 2013;120:51–59. https://doi.org/10.1016/j.ress.2013.03.016
- [300]Vu HC, Do P, Barros A, Bérenguer C. Maintenance planning and dynamic grouping for multi-component systems with positive and negative economic dependencies. IMA Journal of Management Mathematics. 2015;26(2):145–170. https://doi.org/10.1093/imaman/dpu007
- [301]Vu HC, Do P, Barros A, Bérenguer C. Maintenance grouping strategy for multi-component systems with dynamic contexts. Reliability Engineering & System Safety. 2014;132:233–249.
- [302]Do P, Vu HC, Barros A, Bérenguer C. Maintenance grouping for multi-component systems with availability constraints and limited maintenance teams. Reliability Engineering & System Safety. 2015;142:56–67. https://doi.org/10.1016/j.ress.2015.04.022
- [303]Hong HP, Zhou W, Zhang S, Ye W. Optimal condition-based maintenance decisions for systems with dependent stochastic degradation of components. Reliability Engineering & System Safety. 2014;121:276–288. https://doi.org/10.1016/j.ress.2013.09.004
- [304]Rasmekomen N, Parlikad AK. Condition-based maintenance of multi-component systems with degradation state-rate interactions. Reliability Engineering & System Safety. 2016;148:1–10. https://doi.org/10.1016/j.ress.2015.11.010
- [305]Zhang N, Fouladirad M, Barros A, Zhang J. Condition-based maintenance for a k-out-of-n deteriorating system under periodic inspection with failure dependence. European Journal of Operational Research. 2020;287(1):159–167. https://doi.org/10.1016/j.ejor.2020.04.041
- [306]Nguyen KA, Do P, Grall A. Multi-level predictive maintenance for multi-component systems. Reliability Engineering & System Safety. 2015;144:83–94. https://doi.org/10.1016/j.ress.2015.07.017
- [307]Oakley JL, Wilson KJ, Philipson P. A condition-based maintenance policy for continuously monitored multi-component systems with economic and stochastic dependence. Reliability Engineering & System Safety. 2022;222:108321.
- [308]Dinh DH, Do P, Iung B. Multi-level opportunistic predictive maintenance for multi-component systems with economic dependence and assembly/disassembly impacts. Reliability Engineering & System Safety. 2022;217:108055. https://doi.org/10.1016/j.ress.2021.108055
- [309]Do P, Assaf R, Scarf P, Iung B. Modelling and application of condition-based maintenance for a two-component system with stochastic and economic dependencies. Reliability Engineering & System Safety. 2019;182:86–97. https://doi.org/10.1016/j.ress.2018.10.007
- [310]Xu J, Liang Z, Li YF, Wang K. Generalized condition-based maintenance optimization for multi-component systems considering stochastic dependency and imperfect maintenance. Reliability Engineering & System Safety. 2021;211:107592.
- [311]Shi Y, Zhu W, Xiang Y, Feng Q. Condition-based maintenance optimization for multi-component systems subject to a system reliability requirement. Reliability Engineering & System Safety. 2020;202.
- [312]Zhou X, Huang K, Xi L, Lee J. Preventive maintenance modeling for multi-component systems with considering stochastic failures and disassembly sequence. Reliability Engineering & System Safety. 2015;142:231–237.
- [313]Cavalcante CAV, Lopes RS, Scarf PA. A general inspection and opportunistic replacement policy for one-component systems of variable quality. European Journal of Operational Research. 2018;266(3):911–919. https://doi.org/10.1016/j.ejor.2017.10.032
- [314]Truong Ba H, Cholette ME, Borghesani P, Zhou Y, Ma L. Opportunistic maintenance considering non-homogenous opportunity arrivals and stochastic opportunity durations. Reliability Engineering & System Safety. 2017;160:151–161. https://doi.org/10.1016/j.ress.2016.12.011
- [315]Ait Mokhtar EH, Chateauneuf A, Laggoune R. Condition based opportunistic preventive maintenance policy for utility systems with both economic and structural dependencies - application to a gas supply network. International Journal of Pressure Vessels and Piping. 2018;165:214–223. https://doi.org/10.1016/j.ijpvp.2018.07.001
- [316]Lu B, Zhou X. Opportunistic preventive maintenance scheduling for serial-parallel multistage manufacturing systems with multiple streams of deterioration. Reliability Engineering & System Safety. 2017;168:116–127.
- [317]Liu G, Chen S, Ho T, Ran X, Mao B, Lan Z. Optimum opportunistic maintenance schedule over variable horizons considering multi-stage degradation and dynamic strategy. Reliability Engineering & System Safety. 2022;225:108572.
- [318]Shen J, Zhang Y, Ma Y, Lin C. A novel opportunistic maintenance strategy for systems with dependent main and auxiliary components. IMA Journal of Management Mathematics. 2021;32(1):69–90.
- [319]Zhou X, Ning X. Maintenance gravity window based opportunistic maintenance scheduling for multi-unit serial systems with stochastic production waits. Reliability Engineering & System Safety. 2021;215.
- [320]Liu G, Chen S, Jin H, Liu S. Optimum opportunistic maintenance schedule incorporating delay time theory with imperfect maintenance. Reliability Engineering & System Safety. 2021;213.
- [321]Okoh P. Maintenance grouping optimization for the management of risk in offshore riser system. Process Safety and Environmental Protection. 2015;98:33–39.
- [322]Nguyen HSH, Do P, Vu HC, Iung B. Dynamic maintenance grouping and routing for geographically dispersed production systems. Reliability Engineering & System Safety. 2019;185:392–404.
- [323]Uit Het Broek MAJ, Teunter RH, de Jonge B, Veldman J. Joint condition-based maintenance and load-sharing optimization for two-unit systems with economic dependency. European Journal of Operational Research. 2021;295(3):1119–1131.
- [324]Zhang N, Fouladirad M, Barros A. Maintenance analysis of a two-component load-sharing system. Reliability Engineering & System Safety. 2017;167:67–74.
- [325]Vu HC, Do P, Fouladirad M, Grall A. Dynamic opportunistic maintenance planning for multi-component redundant systems with various types of opportunities. Reliability Engineering & System Safety. 2020;198:106854. https://doi.org/10.1016/j.ress.2020.106854
- [326]Liang Z, Parlikad AK. Predictive group maintenance for multi-system multi-component networks. Reliability Engineering & System Safety. 2020;195.
- [327]Iung B, Do P, Levrat E, Voisin A. Opportunistic maintenance based on multi-dependent components of manufacturing system. CIRP Annals. 2016;65(1):401–404. https://doi.org/10.1016/j.cirp.2016.04.063
- [328]Mena R, Viveros P, Zio E, Campos S. An optimization framework for opportunistic planning of preventive maintenance activities. Reliability Engineering & System Safety. 2021;215.
- [329]Wu S, Chen Y, Wu Q, Wang Z. Linking component importance to optimisation of preventive maintenance policy. Reliability Engineering & System Safety. 2016;146:26–32.
- [330]Zequeira RI, Bérenguer C. On the inspection policy of a two-component parallel system with failure interaction. Reliability Engineering & System Safety. 2005;88(1):99–107.
- [331]Castanier B, Grall A, Bérenguer C. A condition-based maintenance policy with non-periodic inspections for a two-unit series system. Reliability Engineering & System Safety. 2005;87(1):109–120.
- [332]Golmakani HR, Moakedi H. Periodic inspection optimization model for a two-component repairable system with failure interaction. Computers & Industrial Engineering. 2012;63(3):540–545. https://doi.org/10.1016/j.cie.2011.07.020
- [333]Scarf PA, Deara M. Block replacement policies for a two-component system with failure dependence. Naval Research Logistics. 2003;50(1):70–87. https://doi.org/10.1002/nav.10051
- [334]Marseguerra M, Zio E, Podofillini L. Condition-based maintenance optimization by means of genetic algorithms and Monte Carlo simulation. Reliability Engineering & System Safety. 2002;77(2):151–165. https://doi.org/10.1016/S0951-8320(02)00043-1
- [335]Camci F. System maintenance scheduling with prognostics information using genetic algorithm. IEEE Transactions on Reliability. 2009;58(3):539–552. https://doi.org/10.1109/TR.2009.2026818
- [336]Sheikhalishahi M, Azadeh A, Pintelon L. Dynamic maintenance planning approach by considering grouping strategy and human factors. Process Safety and Environmental Protection. 2017;107:289–298.
- [337]Sheikhalishahi M, Pintelon L, Azadeh A. An integrated approach for maintenance planning by considering human factors: Application to a petrochemical plant. Process Safety and Environmental Protection. 2017;109:400–409.
- [338]Van Horenbeek A, Buré J, Cattrysse D, Pintelon L, Vansteenwegen P. Joint maintenance and inventory optimization systems: A review. International Journal of Production Economics. 2013;143(2):499–508. https://doi.org/10.1016/j.ijpe.2012.04.001
- [339]Zhang X, Zeng J. Joint optimization of condition-based opportunistic maintenance and spare parts provisioning policy in multiunit systems. European Journal of Operational Research. 2017;262(2):479–498.
- [340]Okonkwo CS, Ogunwole O, Okeke OT. Framework for strategic procurement optimization in oil and gas operations. Iconic Research and Engineering Journals. 2018;1(7):153–168. https://doi.org/10.64388/IREV1I7-1713119
- [341]Ogunwole O, Okonkwo CS, Agbabiaka J, Mayo W, Okeke OT. Supply chain resilience framework for critical infrastructure and gas processing plants. Shodhshauryam, International Scientific Refereed Research Journal. 2021;4(4):444–461. https://doi.org/10.32628/SHISRRJ214462
- [342]Agbabiaka J, Okonkwo CS, Ogunwole O, Mayo W, Okeke OT. Supply chain risk management model for EPC and gas processing projects. Iconic Research and Engineering Journals. 2019;3(2):968–980. https://doi.org/10.64388/IREV3I2-1713124
- [343]Caroni C. “Failure limited” data and TTT-based trend tests in multiple repairable systems. Reliability Engineering & System Safety. 2010;95(6):704–706. https://doi.org/10.1016/j.ress.2010.02.007
- [344]Louit DM, Pascual R, Jardine AKS. A practical procedure for the selection of time-to-failure models based on the assessment of trends in maintenance data. Reliability Engineering & System Safety. 2009;94(10):1618–1628.
- [345]Taghipour S, Banjevic D. Trend analysis of the power law process using expectation-maximization algorithm for data censored by inspection intervals. Reliability Engineering & System Safety. 2011;96(10):1340–1348. https://doi.org/10.1016/j.ress.2011.03.018
- [346]Asfaw ZG, Lindqvist BH. Unobserved heterogeneity in the power law nonhomogeneous poisson process. Reliability Engineering & System Safety. 2015;134:59–65.
- [347]Slimacek V, Lindqvist BH. Nonhomogeneous poisson process with nonparametric frailty. Reliability Engineering & System Safety. 2016;149:14–23.
- [348]Slimacek V, Lindqvist BH. Nonhomogeneous poisson process with nonparametric frailty and covariates. Reliability Engineering & System Safety. 2017;167:75–83.
- [349]Nafisah I, Shrahili M, Alotaibi N, Scarf P. Virtual series-system models of imperfect repair. Reliability Engineering & System Safety. 2019;188:604–613.
- [350]Doyen L. Asymptotic properties of imperfect repair models and estimation of repair efficiency. Naval Research Logistics. 2010;57(3):296–307.
- [351]Nguyen DT, Dijoux Y, Fouladirad M. Analytical properties of an imperfect repair model and application in preventive maintenance scheduling. European Journal of Operational Research. 2017;256(2):439–453.
- [352]Liu X, Finkelstein M, Vatn J, Dijoux Y. Steady-state imperfect repair models. European Journal of Operational Research. 2020;286(2):538–546.
- [353]Huynh KT. Modeling past-dependent partial repairs for condition-based maintenance of continuously deteriorating systems. European Journal of Operational Research. 2020;280(1):152–163.
- [354]Compare M, Antonello F, Pinciroli L, Zio E. A general model for life-cycle cost analysis of condition-based maintenance enabled by PHM capabilities. Reliability Engineering & System Safety. 2022;224.
- [355]Dui H, Li S, Xing L, Liu H. System performance-based joint importance analysis guided maintenance for repairable systems. Reliability Engineering & System Safety. 2019;186:162–175.
- [356]Chen L, Cheng C, Dui H, Xing L. Maintenance cost-based importance analysis under different maintenance strategies. Reliability Engineering & System Safety. 2022;222.
- [357]Joanni A, Rackwitz R. Cost-benefit optimization for maintained structures by a renewal model. Reliability Engineering & System Safety. 2008;93(3):489–499.
- [358]Ching J, Leu SS. Bayesian updating of reliability of civil infrastructure facilities based on condition-state data and fault-tree model. Reliability Engineering & System Safety. 2009;94(12):1962–1974.
- [359]Gerbec M. A reliability analysis of a natural-gas pressure-regulating installation. Reliability Engineering & System Safety. 2010;95(11):1154–1163. https://doi.org/10.1016/j.ress.2010.06.022
- [360]Li R, Arzaghi E, Abbassi R, Chen D, Li C, Li H, et al. Dynamic maintenance planning of a hydro-turbine in operational life cycle. Reliability Engineering & System Safety. 2020;204.
- [361]Diaz-Bejarano E, Behranvand E, Coletti F, Mozdianfard MR, Macchietto S. Organic and inorganic fouling in heat exchangers - industrial case study: Analysis of fouling state. Applied Energy. 2017;206:1250–1266. https://doi.org/10.1016/j.apenergy.2017.10.018
- [362]Markowski M, Trafczynski M, Urbaniec K. Identification of the influence of fouling on the heat recovery in a network of shell and tube heat exchangers. Applied Energy. 2013;102:755–764.
- [363]Pan M, Bulatov I, Smith R. Improving heat recovery in retrofitting heat exchanger networks with heat transfer intensification, pressure drop constraint and fouling mitigation. Applied Energy. 2016;161:611–626.
- [364]Hang P, Zhao L, Liu G. Optimal design of heat exchanger network considering the fouling throughout the operating cycle. Energy. 2022;241. https://doi.org/10.1016/j.energy.2021.122913
- [365]Li YG, Nilkitsaranont P. Gas turbine performance prognostic for condition-based maintenance. Applied Energy. 2009;86(10):2152–2161.
- [366]Zhou D, Zhang H, Weng S. A novel prognostic model of performance degradation trend for power machinery maintenance. Energy. 2014;78:740–746.
- [367]de Castro-Cros M, Velasco M, Angulo C. Machine-learning-based condition assessment of gas turbines - a review. Energies. 2021;14(24).
- [368]Safiyullah F, Sulaiman SA, Naz MY, Jasmani MS, Ghazali SMA. Prediction on performance degradation and maintenance of centrifugal gas compressors using genetic programming. Energy. 2018;158:485–494.
- [369]Che H, Zeng S, Guo J, Wang Y. Reliability modeling for dependent competing failure processes with mutually dependent degradation process and shock process. Reliability Engineering & System Safety. 2018;180:168–178.
- [370]Carr MJ, Christer AH. Incorporating the potential for human error in maintenance models. Journal of the Operational Research Society. 2003;54(12):1249–1253.
- [371]Noroozi A, Khakzad N, Khan F, MacKinnon S, Abbassi R. The role of human error in risk analysis: Application to pre- and post-maintenance procedures of process facilities. Reliability Engineering & System Safety. 2013;119:251–258. https://doi.org/10.1016/j.ress.2013.06.038
- [372]Asadzadeh SM, Azadeh A. An integrated systemic model for optimization of condition-based maintenance with human error. Reliability Engineering & System Safety. 2014;124:117–131.
- [373]Heo G, Park J. A framework for evaluating the effects of maintenance-related human errors in nuclear power plants. Reliability Engineering & System Safety. 2010;95(7):797–805.
- [374]Ramos MA, López Droguett E, Mosleh A, Das Chagas Moura M. A human reliability analysis methodology for oil refineries and petrochemical plants operation: Phoenix-PRO qualitative framework. Reliability Engineering & System Safety. 2020;193.
- [375]Kariuki SG, Löwe K. Integrating human factors into process hazard analysis. Reliability Engineering & System Safety. 2007;92(12):1764–1773.
- [376]Antonovsky A, Pollock C, Straker L. System reliability as perceived by maintenance personnel on petroleum production facilities. Reliability Engineering & System Safety. 2016;152:58–65.
- [377]Obogo SF, Obriki OD, Arumosoye OM. Conceptual model for incident prevention in industrial maintenance engineering environments. International Journal of Multidisciplinary Research and Growth Evaluation. 2021;2(6):847–858. https://doi.org/10.54660/IJMRGE.2021.2.6.847-858
- [378]Obriki OD, Arumosoye OM. Conceptual modeling of data-driven occupational safety risk control in large-scale energy infrastructure projects. Iconic Research and Engineering Journals. 2018;1(7):169–189. https://doi.org/10.64388/IREV1I7-1714414
- [379]Nwangwu CV, Duvbiama-Owasanoye OA, Onwumere A. A framework for operational integrity in high-risk drilling: Balancing productivity and safety compliance. Iconic Research and Engineering Journals. 2018;2(5):436–453.