Internet of Things
Smart Farming Through IoT Sensors
School of Computer Application, BBD University, Lucknow, Uttar Pradesh, India
Published October 2026
Abstract
Currently, farmers assess their soil and crops by walking through the fields occasionally. This paper describes a more efficient method: small sensor units positioned in the soil which transmit data to the phone or computer all day. We describe the setup of this system including the soil moisture, soil temperature, soil pH, nutrient and weather sensors and the way that they are used to identify when to water and fertilize. We explain the system components, discuss the major sensors and wireless communications, and provide a simple testing plan. Previous field trials show that watering based on sensor data can save 20-50% of water without compromising yield and issues can be detected in minutes and not days. We also discuss difficulties (cost, limited network coverage, sensor degradation over time and security concerns), and how we might see things evolve in the future. Overall, sensor-monitoring is practical and can be used to reduce waste in farming.
Keywords: smart farming; Internet of Things; precision agriculture; soil moisture; wireless sensor networks; LoRaWAN; real-time monitoring
1Introduction
Farmers now need to produce more food, with less water, land and labour. By 2050, food production will need to grow by roughly 70% to feed a population of some 9 billion [1]. Today, about 70% of the fresh water abstracted from rivers, lakes and wells is used for agriculture. Moreover, changing weather, soil degradation and rising costs have made the task more challenging.
Most farms still rely on traditional farming methods. They follow set schedules for watering and fertilizing. Problems such as drought stress or lack of nutrients are usually not noticed until the plants already show signs of harm. This results in lost water, lost money and can decrease yields.
The Internet of Things (IoT) offers a solution to these challenges, often called ‘smart farming’. A network of inexpensive sensors in the ground and around the plants measures environmental conditions on a continuous basis. These data readings are sent wirelessly to the farmer's computer or a cloud-based service, which can show the data to the farmer, alert him or her, or even open a water valve automatically [2, 3]. This means that farmers can act early, avoid damage and help to ensure good outcomes.
This paper has four main objectives:
- 1. To explain a simple layered design for real time monitoring of crops and soil.
- 2. To compare the sensors, wireless communications, and techniques of data analysis that are applied in practice.
- 3. To present a reference set-up and the metrics employed for assessing the reference set-up's effectiveness.
- 4. To sum up the benefits mentioned to date and to emphasize key challenges and open questions.
2Literature review
Precision agriculture is about providing the right inputs, at the right time, at the right place. It is not a new concept, but the addition of relatively inexpensive connected sensors has enabled small and medium farms to afford it. Wolfert et al. explained the changes in data that are affecting agricultural production and discussed the importance of making decisions from data rather than simply collecting data [4].
There are numerous survey papers on the IoT in agriculture. Ayaz et al. discuss the application of sensors, networks and uses in both crops and livestock, as well as greenhouses [2]. Elijah et al. categorize the benefits into saved resources, higher output/less cost and their problems include weak connectivity and unclear data ownership [3]. Tzounis et al. and Villa-Henriksen et al. consider field crops and greenhouses, and report many prototypes that function successfully in the lab, but are not robust enough for real farms [5] [6].
Keswani et al. showed that the combination of soil and weather data with a prediction model provides a better watering of the crop in irrigation systems than on/off control [7]. Gondchawar and Kawitkar created a remote monitoring and pumping control system using a simple, low-cost microcontroller that farmers can adopt easily [8].
For networking, Augustin et al. tested LoRa and found it capable of sending small data readings over several kilometres using low power transmission [9]. Liakos et al. and Kamilaris and Prenafeta-Boldu discussed the use of machine learning for predicting crop yields, plant disease detection, and water management [10, 11], respectively.
There are two gaps that continually appear. Few studies provide a comprehensive view, taking into account factors such as delays, lost messages, energy consumption, and farming outcomes together. Even fewer look at the performance of the sensors in the real field over time. This paper focuses on the first and proposes an approach to consider all these aspects at once.
3System architecture
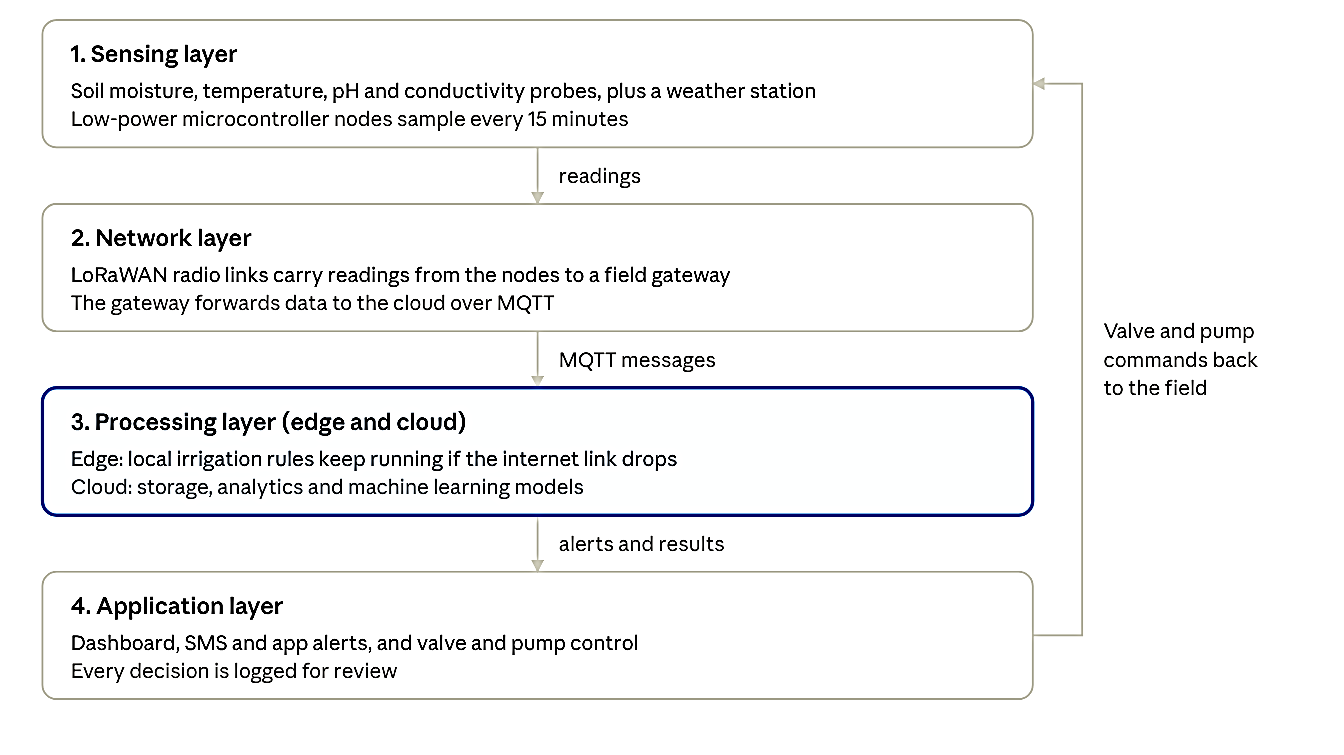
The sensing layer collects data from the sensors and weather measuring instruments. The network layer helps send messages over long distances while using very little power. The processing layer has two parts. The first part is a computer placed in the field. It can make fast decisions right where the action is. The second part is the cloud. It keeps data and does more detailed analysis. The application layer gives real-time data and alerts to the farmer. It also sends commands to valves and pumps, which closes the control loop. Each layer is separate, so any one of them can be replaced. A farm does not have to replace sensors to change its communications technology or analytics service. It might also start with a limited number of devices and grow as funds allow.
The system is structured into four layers, a setup frequently found in IoT farming studies [2, 3]. Figure 1 illustrates how data flows from the field to the farmer and how instructions are sent back.
4Sensors and hardware
Your sensors will determine the quality and the price of your data. Table 1 shows the most frequently used ones for soil and crop monitoring. The numbers are approximate, and may vary according to the model.
| What it measures | Sensor type | Range | How accurate | Cost (USD) |
|---|---|---|---|---|
| Soil moisture | Capacitive probe (does not rust) | 0–100% water in soil | ±3–5% after calibration | 2–15 |
| Soil temperature | Digital probe (e.g. DS18B20) | −55 to 125 °C | ±0.5 °C | 2–8 |
| Soil pH | Electrode probe | pH 3–10 | ±0.1–0.3 pH | 30–150 |
| Soil salt level (conductivity) | Two-pin probe | 0–20 dS/m | ±5% | 20–100 |
| Nutrients (N, P, K) | Optical or chemical probe | Depends on the probe | Rough idea only | 50–300 |
| Air temperature and humidity | Digital sensor (e.g. DHT22, SHT31) | −40 to 80 °C; 0–100% humidity | ±0.3–0.5 °C; ±2–3% | 3–15 |
| Sunlight | Light sensor | 0–100 klux | ±5–10% | 5–100 |
| Rainfall | Tipping-bucket rain gauge | Counts each tip | ±2–5% | 20–60 |
Values are approximate and may vary according to the model.
The advantage of the capacitive moisture probes is that they don't rust, which is not the case with the resistive ones. If NPK probes are used as a guide for fertilizer, be sure to verify with a lab soil test, since cheap NPK probes only provide an approximate value.
Every field node is based on a small, low power microcontroller (such as an ESP32 or an ARM Cortex-M board). It retrieves the data from the sensors, puts a time stamp on it and then returns to sleep again. A Raspberry Pi type gateway is used to gather data from multiple nodes and perform simple rules locally. Typically, nodes are powered by a small solar panel and a lithium battery, which with the use of deep sleep and a reading only every 15 minutes can last for months on a small battery. The casing needs to be rated as IP65 or higher to withstand water, dust and irrigation spray.
5Communication and data processing
Ordinary home networks do not work well because the field sensor sends out small messages periodically, sometimes from a long distance. The key options are contrasted in Table 2. Ranges and speeds are approximate and will vary with terrain and settings.
| Option | Range | Speed | Power use | Best for |
|---|---|---|---|---|
| LoRaWAN | 2–15 km | 0.3–50 kbps | Very low | Open fields, big farms |
| Zigbee | 10–100 m per hop (nodes pass messages along) | 250 kbps | Low | Greenhouses, orchards |
| Wi-Fi | 50–100 m | Very fast (up to hundreds of Mbps) | High | Near farm buildings |
| NB-IoT / LTE-M (mobile networks) | Wherever mobile signal reaches | 20–250 kbps | Low to medium | Areas with mobile signal |
Ranges and speeds are approximate and vary with terrain and settings.
In open fields, LoRaWAN is typically the preferred option since a single gateway can serve many nodes and batteries can operate over a long period of time [9]. If there is no coverage, a private LoRa gateway to satellite or mobile link back to the internet is a common solution.
A lightweight messaging protocol (MQTT) is a commonly used protocol for sending readings from the gateway to the cloud. The data then goes through four steps:
- 1. Cleaning: remove outliers and interpolate missing values.
- 2. Calibration: relate raw readings to physical units with a site-specific curve.
- 3. Thresholds: use thresholds (e.g., irrigate if the volumetric moisture is below the crop's refill point) or machine learning models to predict moisture trends based on weather and historical data [7, 10].
- 4. Action and alerts: open valves, send SMS or app alerts, and record all decisions.
6Methodology
This study proposes a reference system, and compares it with results from published field studies. No new field trial was conducted; the figures in the results section are only ranges reported in earlier studies; they are not our own measurements.
Reference setup. The design is for a 1-ha plot of vegetables/cereals divided into four zones. There is one node at 15 cm and 30 cm depth in each zone with soil moisture and temperature probes, and one additional node with pH and conductivity probes. One weather station is used to record the air temperature, humidity, rain and sunlight. Nodes read every 15 minutes and publish them to a gateway via LoRaWAN; the gateway executes on-site irrigation rules and publishes the data to the cloud via MQTT.
Calibration. Moisture probes are calibrated using oven-dried soil samples from the site. Before installation and once a month after installation, the pH and conductivity probes are tested with standard test solutions.
Comparison plot. The watered zones controlled by the sensor are compared to the watered zone that is watered following a fixed schedule, using the same crop, soil and fertilizer plan for a fair test.
What we measure. There are two methods of judging performance:
- Technical: delay between reading and alert, proportion of messages received, battery life, and agreement of the sensors with reference measurements.
- Farm results: water applied, yield per hectare, water productivity (yield per unit of water), and fertilizer used.
7Results and discussion
Published research reports that sensor-based management conserves resources without reducing yield. Table 3 provides a brief summary of typical results. The ranges are approximate, derived from the surveys and field studies discussed in the literature review [2, 3, 5, 7], and will vary with the crop, climate and soil.
| What we compare | Usual way | With sensors | Typical change reported |
|---|---|---|---|
| Water used for irrigation | Fixed schedule | Water when the soil is dry | 20–50% less |
| Crop yield | Baseline | Same or better | 0–25% more |
| Water productivity | Baseline | Higher | 25–60% more |
| Fertilizer used | Same amount everywhere | Different amount per zone, guided by tests | 10–30% less |
| Time to notice a problem | Days (walking the field) | Minutes to hours (alerts) | Much faster |
| Labor for field checks | Frequent visits | Remote monitoring | Much less |
Water and yield. The greatest and most regular improvement is in water use. Watering only when the soil moisture around the roots falls below a set level avoids over-watering, which helps stop nutrients from washing away and reduces the chance of disease; too little water, on the other hand, stresses the crop. Because yield stays the same or improves while water use falls, water productivity increases more than water use decreases.
Technical performance. The delay is primarily based upon the frequency of readings taken by the sensor, rather than the network, and a compromise is made between response time and battery life; reading every 15 minutes is a compromise.
Cost. A small setup typically consisting of a few nodes and a gateway will run a few hundred – few thousand US dollars. This is usually recovered in 1–3 seasons on the farm where high value crops and water scarcity exist due to water savings, energy saving, and labour saving. For less expensive staple crops, it takes longer.
What this means. The benefit is dependent upon the placement of the sensors and their calibration. A probe in an unrepresentative location may give precise readings that do not represent the field; the number of probes and their depth matter as much as the software.
8Challenges and limitations
While there are clear benefits, there are some factors that hinder adoption, as noted in [3, 6]:
- Cost: sensors are inexpensive, but small farms would have to pay for the installation, and payback would be slower for low-value crops.
- Connectivity: the lack of mobile signal is a problem on many farms, requiring the use of an on-farm gateway.
- Power: sunlight and battery health are also important for the field nodes.
- Sensor drift and damage: soil sensors lose accuracy with temperature, salinity and ageing, and can be damaged by ploughing, animals and water; they must be calibrated regularly.
- Placement: A single probe is not likely to record an entire field and the soil may change significantly in short distances.
- Security and privacy: Devices are vulnerable to tampering through unprotected wireless communications, and the data generated on farms has questions of ownership.
- Mixing brands: Devices and data are difficult to mix due to different formats and platforms.
- Skills and trust: Farmers require training, and easy-to-use apps that are available in their native languages, so that they can take action on the data.
This study is limited in that it synthesizes reported data rather than provides new field data. The studies are conducted in various crops and climates and papers with positive outcomes have a better chance of being published.
9Future scope
- AI Gateway: Small models that are deployed on the gateway can provide soil moisture predictions and alert for anomalous data on the device without the need for the cloud [10, 11].
- Drones and satellites: Photos taken from the air show plant health throughout the field, and readings from the sensors provide interpretation of the photos.
- Digital twins: Virtual copy of the field with current data from the sensors and watering and fertilizing tests are possible before implementation
- Improved coverage: Farm will connect to Mobile IoT and satellite communications.
- Better solar panels and chips: Solar panels and low-power chip will let nodes operate for years with minimal maintenance.
- Shared standards and trust: Open data formats and secure device identity and traceable records like blockchain can enable devices to cooperate and trust each other throughout the supply chain.
- Low-cost calibrated sensors: Open hardware and shared calibration process can lead to the affordable availability of reliable monitoring technologies for small farms.
10Conclusion
With sensor monitoring, farmers can now have a real-time, continuous picture of their soil and crops, and water and fertilize accordingly, rather than by habit. A design using low-power sensors, long-range wireless links and processing in both the field and the cloud is now feasible and reported water savings are of the order of 20-50% with no loss of yield. Success will rely on the placement of sensors, periodic re-calibration, security and compatibility of systems, and training of farmers. Further research is recommended to validate the reference system in a field trial over an entire growing season and to determine the longevity of sensors and their cost to small, medium and large farms.
References
- [1]Food and Agriculture Organization of the United Nations (FAO). How to feed the world in 2050. Rome: FAO; 2009.
- [2]Ayaz M, Ammad-Uddin M, Sharif Z, Mansour A, Aggoune EHM. Internet-of-Things (IoT)-based smart agriculture: Toward making the fields talk. IEEE Access. 2019;7:129551–129583. https://doi.org/10.1109/ACCESS.2019.2932609
- [3]Elijah O, Rahman TA, Orikumhi I, Leow CY, Hindia MN. An overview of Internet of Things (IoT) and data analytics in agriculture: Benefits and challenges. IEEE Internet of Things Journal. 2018;5(5):3758–3773. https://doi.org/10.1109/JIOT.2018.2844296
- [4]Wolfert S, Ge L, Verdouw C, Bogaardt MJ. Big data in smart farming – A review. Agricultural Systems. 2017;153:69–80. https://doi.org/10.1016/j.agsy.2017.01.023
- [5]Tzounis A, Katsoulas N, Bartzanas T, Kittas C. Internet of Things in agriculture, recent advances and future challenges. Biosystems Engineering. 2017;164:31–48. https://doi.org/10.1016/j.biosystemseng.2017.09.007
- [6]Villa-Henriksen A, Edwards GTC, Pesonen LA, Green O, Sørensen CAG. Internet of Things in arable farming: Implementation, applications, challenges and potential. Biosystems Engineering. 2020;191:60–84. https://doi.org/10.1016/j.biosystemseng.2019.12.013
- [7]Keswani B, Mohapatra AG, Mohanty A, Khanna A, Rodrigues JJPC, Gupta D, et al. Adapting weather conditions based IoT enabled smart irrigation technique in precision agriculture mechanisms. Neural Computing and Applications. 2019;31(Suppl 1):277–292. https://doi.org/10.1007/s00521-018-3737-1
- [8]Gondchawar N, Kawitkar RS. IoT based smart agriculture. International Journal of Advanced Research in Computer and Communication Engineering. 2016;5(6):838–842.
- [9]Augustin A, Yi J, Clausen T, Townsley WM. A study of LoRa: Long range & low power networks for the Internet of Things. Sensors. 2016;16(9):1466. https://doi.org/10.3390/s16091466
- [10]Liakos KG, Busato P, Moshou D, Pearson S, Bochtis D. Machine learning in agriculture: A review. Sensors. 2018;18(8):2674. https://doi.org/10.3390/s18082674
- [11]Kamilaris A, Prenafeta-Boldú FX. Deep learning in agriculture: A survey. Computers and Electronics in Agriculture. 2018;147:70–90. https://doi.org/10.1016/j.compag.2018.02.016