Artificial Intelligence
AI-Based MCA Student Performance Prediction and Personalized Learning System
Master of Computer Applications, Zeal Institute of Business Administration, Computer Application and Research, Pune, Maharashtra, India
Published October 2026
Abstract
Early identification of academic difficulty is most useful when it leads to timely, relevant support. This paper proposes an integrated framework for students in the Master of Computer Applications (MCA) programme. The framework is designed to estimate end-of-semester performance from internal assessments, assignments, attendance, prior results and study behaviours; identify students who may need support; locate subject-level learning gaps; and present tailored study suggestions through a dashboard reviewed by instructors. The study has two components. Phase 1 reports descriptive findings from a questionnaire completed by 102 MCA students. Thirty-three respondents reported attendance below 75%, 40 reported studying no more than two hours per day outside college, and 78 of 101 respondents expressed interest in personalised study recommendations, particularly video lectures and practice questions. Exploratory Spearman analyses using previous-semester CGPA (97 usable records) found a weak positive association with internal assessment marks; this association remained below the Bonferroni-adjusted threshold. No clear association was observed for study hours, revision regularity or programming practice. Phase 2 is proposed, not completed: it specifies candidate machine-learning models, an evaluation plan and recommendation rules, but no model has been trained because final SGPA outcomes have not yet been collected.
Keywords: student performance prediction; educational data mining; personalized learning; learning recommendations; at-risk students; explainable artificial intelligence; MCA
1Introduction
Higher-education institutions collect varied information about students, including attendance, internal assessments, assignment and laboratory results, and—increasingly—records of activity in digital learning environments. A review of artificial intelligence (AI) in higher education organised applications into four areas: profiling and prediction, assessment, adaptive or personalised learning, and intelligent tutoring [1]. Student-performance prediction is among the longest-established applications, and reviews now cover more than a decade of research in this area [2, 3].
A forecast alone does not tell a student what to do next. A prediction of possible difficulty becomes actionable only when it points to the topics that need attention and to suitable ways of studying them.
Research on AI-supported personalised learning similarly emphasises adapting learning pathways to individual strengths and needs [4]. Yet prediction and personalisation have often been treated as separate problems.
This study focuses on students enrolled in the Master of Computer Applications (MCA), a population that has received limited separate attention in the literature reviewed here. The programme combines theoretical coursework with substantial laboratory and practical work within a relatively compact timetable. Students also enter with varied academic preparation, which may contribute to differences in their performance across semesters.
The paper makes two contributions. First, it specifies an end-to-end framework for MCA student support, linking data collection and performance prediction to a teacher-reviewed dashboard. Second, it reports results from the study's first data-collection phase: a questionnaire on students' study practices and their views about AI-generated recommendations. Throughout, completed analyses are distinguished from proposed work.
2Background of the study
Educational data mining uses student-related data to identify patterns, while learning analytics applies such evidence to educational decisions. Two relevant strands are early identification of students who may be at risk and prediction of academic performance, expressed either as a grade or as a broader category. A review of studies published between 2009 and 2021 describes the use of institutional databases and online learning platforms to identify students for possible intervention [5].
Two considerations are central to the responsible use of these systems. First, algorithmic fairness matters: research has documented bias affecting demographic groups, although the evidence base covers a limited set of countries [6]. A model developed for one population may not perform equitably for another, and an inaccurate risk label can adversely affect the student it is intended to help. Second, users need explanations. The XAI-ED perspective argues that explanations should be designed for the needs of different stakeholders, including educators and learners [7].
These concerns inform the proposed design. The model comparison retains interpretable approaches, performance categories can be adjusted, and an instructor reviews outputs before they are shared with students.
3Literature review
The literature reviewed is relevant to four elements of the proposed framework: performance prediction, at-risk identification, explainability and personalised recommendations. The following subsections discuss its implications for the present study.
3.1Student performance prediction and its predictors
A widely cited study used school records and questionnaire data from two Portuguese secondary schools to compare decision trees, random forests, neural networks and support vector machines for predicting final grades [8]. Early-period grades were particularly informative: excluding them reduced predictive accuracy. Its school-level population, however, differs from postgraduate computing students.
Reviews describe both growth in the volume of student-performance research and increasing methodological diversity. A review covering studies through 2018 also identified weaknesses in reporting, validation and replication [2]. A later review of 62 studies published from 2010 to 2020, restricted to learning-outcome measures, found that performance was commonly represented by ranks, classes or grades. Regression and supervised classification were prevalent, while frequently used predictors included online-course activity, term assessment results and students' emotional states in academic contexts [3]. A broader review of approximately 260 papers spanning two decades reported frequent use of neural networks and random forests and found that feature selection was performed before modelling in more than 45% of the studies [9]. A higher-education review grouped predictors into prior academic performance, demographic characteristics, e-learning activity and psychological factors, and described the stages of the prediction process [10]. The reviewed syntheses do not examine MCA students as a distinct population or focus on the learning support that should follow a prediction.
3.2At-risk identification
A review of work published between 2009 and 2021 identified institutional databases and e-learning systems as the two main data sources for early risk identification, with machine learning used to identify students who may need support [5]. Although the review discusses intervention planning, the underlying studies were described as focusing mainly on flagging students.
3.3Explainable prediction
A systematic review of explainable student-performance models published from 2015 to 2020 called for joint evaluation of predictive performance and explainability [11]. One study combined ensemble models with SHapley Additive exPlanations (SHAP), generating feature-level explanations for predictions and reporting high accuracy; educators used these explanations to identify students at risk [12]. The reported evidence came from a single dataset, and the approach did not specify what students should study. A later review of explainable AI for student-performance prediction found that studies most often used behavioural and academic-record features, predicted grades or course failure, and applied explanations to feature importance, individual predictions and interventions [13]. This review is particularly relevant to computing education, but it synthesises existing models rather than presenting an integrated prediction-and-recommendation system.
3.4Personalised learning and recommendation
An overview of AI-supported personalised education discusses challenges in modelling learners and sequencing content, alongside unresolved questions about evaluating both learners and systems [4]. A systematic review of educational recommender systems surveys approaches for suggesting learning materials [14]. These works describe important components of personalisation, but neither connects a performance forecast to recommendations tailored to a particular programme.
4Research gap
The following observations describe the literature included in this paper; they should not be interpreted as proof that no other relevant studies exist.
First, the reviewed work on performance prediction [2, 3, 9, 10] and at-risk identification [5] primarily evaluates forecasting methods and predictive performance.
Second, explainability research [7, 11–13] emphasises providing reasons for model outputs. These explanations are generally used to interpret predictions or inform educators' decisions, rather than to select the next learning activity for a student.
Third, prior studies cover varied populations and contexts, including secondary-school students, broad university cohorts, online learners and STEM students. The computing-education review [13] also spans STEM and computer-science populations. Within the literature examined, MCA students—whose programmes combine theory, programming and laboratory work—are not treated as a distinct group.
Fourth, some predictive findings rely on individual datasets [8, 12], while reviews have called for stronger reporting, validation and replication [2].
Taken together, these observations motivate an MCA-focused framework that links academic data to performance forecasts, uses explanations to identify subject-level needs, and translates those needs into personalised recommendations for instructor review. Its design also draws on the preferences reported by MCA students in Phase 1.
5Problem statement
MCA students often receive feedback through periodic internal assessments and end-of-semester grades. By the time a weakness is apparent in the final result, opportunities to address it during the semester may have passed. Instructors managing large classes may also have limited capacity to prepare an individual study plan for every student. This study therefore proposes a data-informed system that uses information available during the semester to estimate performance, identify students who may benefit from support, locate possible subject or topic gaps, and suggest relevant learning actions. Decisions about individual students remain with people, not the model.
6Research objectives
The objectives of the study are:
- 1. To collect academic and study-habit information from MCA students, with informed consent and anonymised identifiers;
- 2. To test and compare machine-learning models that forecast semester-end performance (SGPA) and a performance band derived from it;
- 3. To detect at-risk students early enough for help to matter;
- 4. To work out, from assessment data, which subjects each student is strong or weak in;
- 5. To create personalised recommendations (topics, revision areas, practice material, resources) based on predicted performance and the gaps found;
- 6. To display results on a dashboard that explains every prediction and allows teachers to review it;
- 7. To document what a real Phase 1 survey reveals about MCA students' study habits and recommendation preferences, so that the design can draw on it.
7Research questions
The study addresses the following research questions:
- RQ1. Among the academic and behavioural features known during the semester, which are the most informative for predicting an MCA student's final SGPA? (to be answered after Phase 2)
- RQ2. Which candidate algorithm strikes the best balance between accuracy and interpretability on MCA data? (to be answered after Phase 2)
- RQ3. When predicted performance is combined with subject-wise assessment data, do the resulting learning gaps seem meaningful to teachers? (to be answered in a teacher-validation step)
- RQ4. What kinds of personalised recommendation, delivered how often, do MCA students find useful? (partly covered by the Phase 1 survey, Section 18.1)
- RQ5. How do students and teachers react to the dashboard and the explanations it gives? (planned usability evaluation)
8Proposed methodology
The proposed workflow extends a conventional data-science pipeline by connecting prediction to learning support (Figure 1). The stages are outlined below.
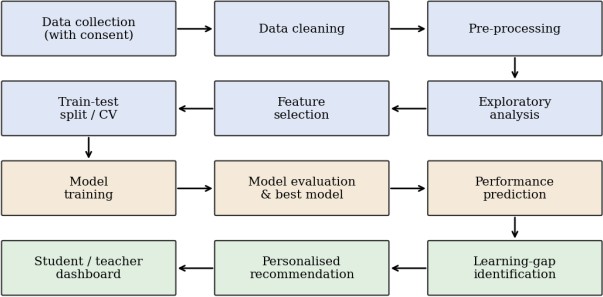
Data collection. With informed consent, academic information and questionnaire responses are collected in two phases. Phase 1 records information available during the semester; Phase 2 is intended to add each participant's final SGPA using a shared anonymised code.
Data cleaning. Records are checked for implausible values, inconsistent formats and missing responses. Cleaning decisions are documented for reproducibility; the issues identified in the Phase 1 dataset are described in Section 9.3.
Pre-processing. Ordinal responses, including attendance bands, retain their order; nominal variables are one-hot encoded, and numerical features are scaled when required by a model. Imputation, encoding and scaling are fitted within each cross-validation training fold to prevent information from the evaluation fold entering model training.
Exploratory analysis. Distributions, associations and group differences are examined before modelling to identify potential data problems and inform subsequent feature decisions.
Feature selection, data partitioning, model training and evaluation are described in Sections 11, 12, 16 and 17. The preferred model will be selected using cross-validated performance while considering interpretability as well as accuracy. Its outputs are intended to include predicted performance and a risk category. A learning-gap component will compare subject-level assessment results with expected levels, after which a rule-based recommender will map identified gaps and relevant model explanations to study actions displayed on the dashboard.
9Dataset and data collection
9.1Planned dataset
The planned dataset contains one record per student per semester. Final semester SGPA is the numerical target, from which a performance band may be derived. Table 1 lists candidate features: Phase 1 features come from the questionnaire already administered; Phase 2 or record-based variables remain to be collected, primarily from institutional records and subject to consent.
| Feature | Representation | Source | Note |
|---|---|---|---|
| Previous-semester CGPA / result category | Numeric; Excellent / Good / Average | Phase 1 | Self-reported; verify against records |
| Average internal assessment marks | Ordinal band | Phase 1 | Replace by exact marks from records |
| Assignment completion rate | Ordinal band | Phase 1 | Replace by exact scores where possible |
| Average attendance | Ordinal band | Phase 1 | Exact percentage from register preferred |
| Daily self-study hours | Ordinal band | Phase 1 | |
| Revision regularity | Ordinal (rarely to regular) | Phase 1 | 14 respondents skipped |
| Programming skill (self-rated), practice frequency | Ordinal | Phase 1 | Languages known recorded as multi-label |
| Preferred learning method | Nominal | Phase 1 | Used for recommendations, tested as a feature |
| Subject-wise internal, assignment and lab marks | Numeric per subject | Phase 2 / records | Required for learning-gap analysis |
| Final SGPA (target) | Numeric | Phase 2 | Collected after results via participant code |
9.2Data sources and collection procedure
In Phase 1, students completed a 22-item Google Form covering basic information, academic indicators, study practices, programming habits and views on AI-based recommendations. The form was designed not to request names, roll numbers, telephone numbers or email addresses. Responses were exported to a spreadsheet and analysed in their submitted form, subject to the cleaning decisions described in Section 9.3.
9.3Phase 1 data actually collected and data-quality notes
The cleaned export contains 102 responses submitted from 3 to 8 October 2026; one entirely blank submission was removed. Given the small, self-selected sample from a single programme, the analyses are descriptive. Four respondents did not report previous-semester CGPA. One entry recorded as “8.5%” could represent either a mistyped CGPA or a percentage and was excluded rather than reinterpreted. The entry “8.62/10” was recorded as 8.62. Two values of 10.0 are possible on a ten-point scale but could not be verified; they were retained and flagged. Semester 1 respondents did not provide previous-semester CGPA. After these decisions, 97 usable CGPA values remained. Most other items had no more than one missing response, except revision regularity, which was unanswered by 14 participants.
9.4Ethical considerations
Student records are sensitive, and decisions based on predictions may affect the people the system is intended to support. Participation is voluntary; the consent statement should explain the study purpose, collected data, retention period and access arrangements. Participant codes should replace direct identifiers, any re-identification key should be stored separately from analysis data, and only necessary features should be retained. The Digital Personal Data Protection Act, 2023, is relevant to personal-data handling in India [25]; institutional review should confirm applicable consent and purpose-limitation requirements before records are reused.
Where group sizes permit, the proposed fairness assessment compares model errors across gender, year of study and entry background, recognising that educational bias research has often covered a narrow range of groups [6]. Predictions are provisional categories, not fixed descriptions of students, and should be recalculated as new information becomes available. Instructors review the rationale before taking action; students receive suggestions for support rather than a ranking.
10Data pre-processing
The planned preprocessing reflects a small dataset composed mainly of ordinal and categorical variables, alongside some free-text responses. Numerical missing values are to be imputed using the median; missing ordinal or nominal responses are to receive a “not reported” category. Missingness may also be retained as a candidate feature. Ordinal bands are mapped to ordered integers, preserving rank without assuming equal distances between categories. Tree-based methods do not require scaling, whereas linear and distance-based models do. Multi-select responses, such as programming languages, are represented by binary indicators. Free-text comments are excluded from model inputs.
The distribution of SGPA will be examined before modelling rather than assumed in advance. If the resulting at-risk class is uncommon, class weighting or oversampling within training folds (for example, SMOTE [23]) may be considered. Any such approach will be evaluated with particular attention to recall for the at-risk class.
11Feature selection
Because the sample is expected to be small, unnecessary predictors may increase overfitting risk. Feature selection is therefore planned in three stages. Domain screening will exclude variables without a plausible relationship to the outcome or whose privacy cost is not justified. Statistical screening will use rank-based associations for ordinal variables and suitable group comparisons for categorical variables, with caution because small-sample screening is uncertain. Model-based selection will then examine regularised linear-model coefficients and feature-importance measures from random forest and XGBoost. Selection must occur within cross-validation; features selected inconsistently across folds will be treated cautiously.
Previous-semester CGPA, internal assessment marks and attendance may be correlated. Correlation is less problematic for tree-based prediction than for interpreting coefficients or feature-importance values. The explanation method and model presented to instructors will therefore be selected with this interpretive limitation in mind.
12Machine learning algorithms
Seven candidate algorithms are proposed, each for a defined comparative purpose; Table 2 summarises the rationale for inclusion.
| Algorithm | Task | Reason for inclusion |
|---|---|---|
| Linear regression | Regression | Simple baseline for numeric SGPA; teachers can easily follow the coefficients |
| Logistic regression | Classification | Baseline for band and at-risk classification; gives calibrated probabilities that can be thresholded |
| Decision tree [16] | Both | Rule-like structure close to how teachers reason; shows how thresholds on attendance or marks lead to a result |
| Random forest [15] | Both | Averaging many trees lowers the variance of a single tree; copes with mixed ordinal and nominal inputs; supplies feature importance |
| XGBoost [17] | Both | Gradient-boosted trees that often do well on tabular data; included to see whether extra complexity pays off on small data |
| Support vector machine [18] | Both | Margin-based method that can work with moderate sample sizes; kernels allow non-linear boundaries |
| k-nearest neighbours [19] | Both | Instance-based comparison that supports a “students like you” explanation; sensitive to scaling and noise, so it also tests data quality |
No algorithm is assumed in advance to be superior. Simpler methods can perform competitively with more complex approaches on small tabular datasets, but this must be tested on the MCA data. Hyperparameter tuning is planned within the training folds of nested cross-validation to reduce optimistic performance estimates.
13Student performance prediction
The study distinguishes regression from classification. Regression estimates a continuous outcome—in this case, semester SGPA. Classification assigns a category such as Excellent, Good, Average or At Risk. Regression retains grade-level differences among students assigned to the same band and avoids relying solely on category cut-offs. Classification, in turn, can provide a more direct basis for prioritising support.
Regression is therefore the primary planned task; performance categories will be derived from predicted SGPA using thresholds agreed in advance with the department. A separate classifier is planned for the at-risk outcome. For that task, recall is prioritised over overall accuracy because failing to identify a student who needs support may be more consequential than generating a precautionary flag. Metrics will match the relevant task, as described in Section 17.
14Personalized learning recommendation system
The proposed recommendation component translates model outputs into possible study actions through four stages: student data → preprocessing → model → performance estimate → learning-gap identification → personalised recommendation → dashboard.
Step 1: identify learning gaps. For each subject s, the proposed gap score is given by Equation (1):
where ms is the student’s normalised assessment result and τ is the department-defined expected level. Subjects are ranked by this score; credit hours may be used as an additional weight. This step requires subject-level results, which were not collected in the Phase 1 questionnaire, so it depends on Phase 2 data or institutional records. The formula remains a design proposal and has not been evaluated.
Step 2: select the reason for support. Explanations accompanying a prediction—for example, low attendance or infrequent revision—may help determine whether a recommendation should focus on time management and attendance or on course content and practice. The relationship between a model explanation and an appropriate learning action requires validation.
Step 3: map gaps to learning materials. Course topics are to be tagged by difficulty and resource type. For subjects with larger gaps, the system may suggest relevant topics, revision tasks, practice questions, additional exercises, programming practice for laboratory-based courses, and other learning resources. Recommendations are drawn from a teacher-curated resource bank rather than generated without review.
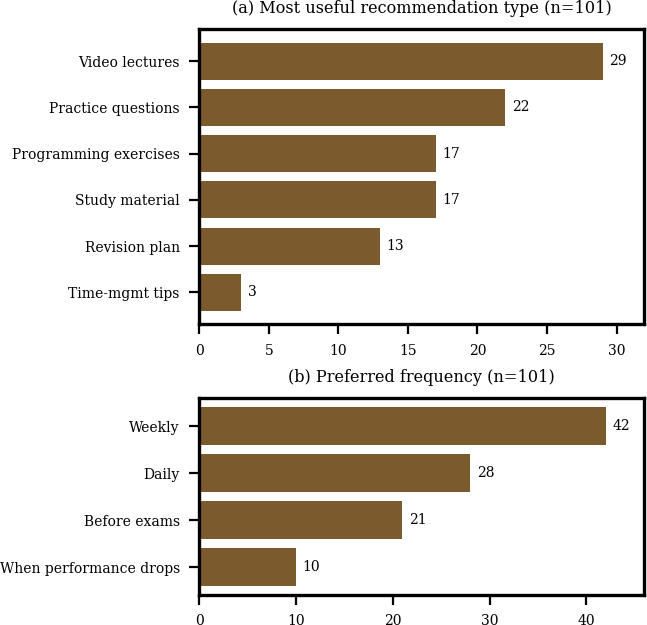
Step 4: deliver recommendations. In the Phase 1 survey, video lectures and practice questions were the most frequently selected recommendation formats, while weekly and daily delivery were commonly preferred (Figure 3). These findings can inform default settings, while allowing students to change the format or frequency.
This study does not demonstrate that recommendations improve academic results. That question requires a separate evaluation, such as a controlled comparison of dashboard users with comparable non-users or longitudinal tracking of subject-level gaps across semesters.
15System architecture
The proposed system has four layers. The data layer stores anonymised survey responses and student records. The analytics layer performs cleaning, feature processing, prediction and explanation. The recommendation layer contains the gap-scoring rules and curated learning resources. The presentation layer is a web dashboard with a student-facing view of predicted categories, strengths, weaknesses and next steps, and an instructor view of cohort summaries, students flagged for review and the reasons for each flag.
A possible implementation could use Python, pandas and NumPy for data handling; scikit-learn [20] for preprocessing and several candidate models; XGBoost [17] if selected; Matplotlib or Seaborn for exploratory analysis; SHAP [24] or tree-based measures for explanations; Streamlit or Flask for the dashboard; and MySQL or SQLite for storage. This is a suggested technology stack only: no software implementation is reported in this paper.
16Experimental design
The planned experiment will link Phase 1 features to final SGPA from Phase 2 for the same participants. The current dataset—102 questionnaire responses, with 97 usable previous-semester CGPA values—is not yet adequate for a dependable model comparison. The sample should first be expanded, for example by including additional cohorts or batches; the target size remains to be determined in light of institutional data availability. Predictive results are therefore not reported.
The proposed evaluation uses repeated stratified k-fold cross-validation [22], because performance estimates from a single split can be unstable in a small sample. Hyperparameter selection is nested within the outer folds. A separate hold-out evaluation may be added if the final sample permits. Each model will be compared with simple baselines: mean SGPA for regression and the majority class for classification. Overall performance and, where subgroup sizes are sufficient, errors by gender and year will be reported. Random seeds, software versions and data-cleaning decisions will be documented. Instructors will also assess whether the identified gaps and suggested topics are plausible as an initial qualitative evaluation, before any study of student outcomes.
17Performance evaluation
The evaluation metrics are selected according to the prediction task. For SGPA regression, mean absolute error (MAE) expresses the average prediction error in grade points. Mean squared error (MSE) and root mean squared error (RMSE) assign greater weight to larger errors, while R² compares explained variation with a mean-prediction baseline. Because R² is scale-independent and has an interpretable baseline [21], all four measures are planned.
For performance-band and at-risk classification, accuracy will be reported but interpreted cautiously because it can be misleading when class frequencies are unequal. Precision, recall and F1-score will be shown by class, with particular attention to recall for the At Risk category. Confusion matrices will show which categories are misclassified; ROC-AUC will summarise ranking performance across thresholds for the binary at-risk task. Explanation quality will be explored through the stability of feature importance across folds and instructor feedback.
18Results
18.1Experimental results: Phase 1 survey
Table 3 and Figure 2 summarise the respondent profile. Of 102 students, 64 (62.7%) identified as male and 38 (37.3%) as female. Fifty-five (53.9%) were aged 21–23, 25 were 18–20, 16 were 24–26 and six were older than 26. Sixty-one respondents were in year two and 40 in year one; one did not answer. Forty-three respondents were in Semester 3. Previous-semester results were reported as Excellent by 24, Good by 47, Average by 22 and Below Average by nine. Among the 97 usable CGPA values, the mean was 7.74 (SD 0.85), the median was 7.75 and the range was 6.10–10.0.
| Item | Responses (count) |
|---|---|
| Average internal assessment marks | Below 40%: 1; 40–59%: 18; 60–74%: 38; 75–89%: 35; 90%+: 10 |
| Assignment completion rate | Below 50%: 4; 50–69%: 17; 70–84%: 39; 85– 100%: 42 |
| Average attendance | <50%: 8; 50–64%: 9; 65–74%: 16; 75–84%: 43; 85%+: 26 |
| Study hours outside college per day | <1 h: 11; 1–2 h: 29; 2–3 h: 37; 3–4 h: 22; >4 h: 3 |
| Revision regularity (n = 88) | Rarely: 8; only before exams: 20; 2–3 times a week: 34; regular: 26 |
| Self-rated programming skill | Beginner: 17; basic: 32; intermediate: 42; advanced: 11 |
| Programming practice frequency | Rarely: 10; once a week: 19; several times a week: 42; daily: 31 |
| Languages known (multi-select) | Java: 74; Python: 59; JavaScript: 50; C/C++: 39; .NET/C#: 10; other: 6 |
| Most helpful learning method | Practical coding: 33; YouTube/video: 25; classroom: 18; online courses: 17; AI tools: 6; books/notes: 3 |
| Main factor affecting performance (one choice) | Programming skills: 24; study hours: 21; assignments: 14; attendance: 13; previous performance: 12; internal marks: 11; time management: 5; other: 2 |
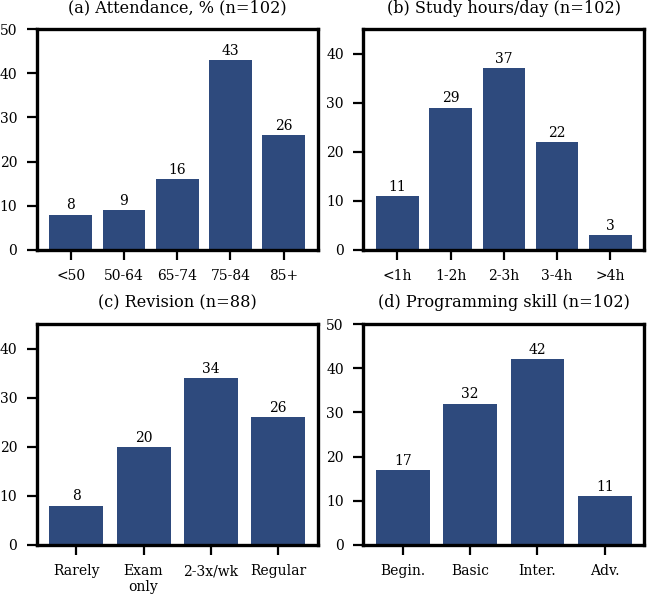
Several descriptive patterns are evident. Thirty-three of 102 respondents (32.4%) reported attendance below 75%; whether that threshold applies to this programme should be confirmed. Forty respondents (39.2%) reported no more than two hours of self-study outside college each day. Of the 88 who answered the revision item, 28 (31.8%) said they revised rarely or mainly before examinations. Forty-nine respondents rated their programming ability as beginner or basic, while 73 reported programming practice at least several times a week. Programming skill (24 responses) and study hours (21) were the factors most often selected as influencing performance.
Responses indicated interest in AI-based support. Of 101 respondents to the relevant item, 73 (72.3%) wanted an AI system to identify weaker subjects, 20 selected “maybe” and eight selected “no.” Seventy- eight of 101 (77.2%) wanted personalised recommendations based on performance; 16 selected “maybe” and seven “no.” Eighty-three of 102 (81.4%) thought AI could help MCA students improve academically, while 12 were unsure and seven disagreed. Weekly recommendations were preferred by 42 of 101 respondents and daily recommendations by 28. Video lectures were selected by 29 respondents as the most useful format and practice questions by 22 (Figure 3). Because participation was voluntary and the survey concerned AI, these responses may not represent MCA students more broadly.
Exploratory associations were assessed using Spearman rank correlations between previous-semester CGPA and self-reported variables (Table 4). Internal assessment marks showed a weak positive association (ρ = 0.28; unadjusted p = 0.006). Study hours, revision regularity, programming-practice frequency, assignment completion, attendance and self-rated programming skill showed no clear association in this sample. Agreement between self-reported result category and CGPA was also weak (ρ = 0.15), supporting verification of self-reported academic information against records where feasible.
| Variable | n | ρ | p (unadjusted) |
|---|---|---|---|
| Study hours per day | 97 | 0.09 | 0.355 |
| Revision regularity | 83 | 0.11 | 0.321 |
| Programming practice frequency | 97 | 0.18 | 0.084 |
| Average attendance | 97 | −0.09 | 0.400 |
| Average internal marks | 97 | 0.28 | 0.006 |
| Assignment completion | 97 | 0.14 | 0.177 |
| Programming skill (self-rated) | 97 | 0.00 | 0.994 |
| Self-reported result category | 97 | 0.15 | 0.135 |
These exploratory results require cautious interpretation. Seven behavioural comparisons were made using approximately 100 cases. Applying a Bonferroni correction gives a threshold of about 0.007; the association for internal assessment marks (p = 0.006) falls just below it. Measures were self-reported categories, and previous-semester CGPA and study behaviours were reported at the same time, so these data cannot establish direction or causality. The two retained CGPA values of 10.0 may also influence rank-based results. The findings are hypothesis-generating and identify candidate features for evaluation in the planned study.
18.2Expected results: predictive models (to be completed)
No predictive model has been trained, so the paper reports no accuracy or error estimates. After Phase 2 data are available, the planned analysis will compare each candidate algorithm with baseline performance, assess feature contributions and determine whether the at-risk classifier achieves useful recall. Internal assessment and study-behaviour features will receive particular attention given the Phase 1 exploratory findings.
19Discussion
The Phase 1 responses suggest that some participants report limited attendance, short daily study time or revision concentrated near examinations, while many express interest in AI-generated guidance. These observations motivate a system that links identification of possible academic difficulty with practical study support. Whether the proposed model can identify those students and whether the recommendations help them remain open empirical questions.
Among the measured variables, internal assessment marks had the clearest association with previous-semester CGPA; the associations for attendance bands, study hours, revision regularity and self-rated programming skill were not clear. This result may inform feature selection, but the sample is insufficient to establish the value of these measures for predicting future performance. The absence of a clear association for coarse attendance bands should not be treated as evidence against results obtained using more precise attendance data.
The proposed design responds to literature concerns by retaining interpretable models, examining group-specific errors and requiring instructor review before intervention. The cited work discusses the relevance of explanations [7, 11] and the risk of algorithmic bias [6]; transparent reporting also matters when predictive results are not yet available [2].
20Limitations
The central limitation is that Phase 2 has not been completed: final SGPA outcomes are unavailable and no predictive model has been trained. Phase 1 includes 102 self-selected respondents from one programme and relies on self-reported, categorised measures with data-quality issues. The survey contains no subject-level marks, so the learning-gap component has not been tested. Neither the proposed gap formula nor the recommendation rules have been empirically validated. The literature review is focused rather than systematic, so the stated research gap applies to the studies examined here. Finally, findings from a single institution may not generalise to other student populations.
21Future scope
Next steps are to complete Phase 2 collection, broaden the sample, replace self-reported bands with exact academic records where consent permits, and obtain subject-level assessment data. The proposed models can then be evaluated, followed by instructor review of the recommendations. Subsequent work could test whether recommendations alter subject-level outcomes, incorporate learning-platform activity, explore topic-level knowledge tracing, extend fairness analyses to additional groups, and examine performance at other institutions.
22Conclusion
This paper proposes a teacher-reviewed framework connecting MCA student-performance prediction, learning-gap identification and personalised study recommendations, and reports descriptive results from the Phase 1 questionnaire. Respondents reported varied study practices and generally expressed interest in AI-based support, although the small, self- selected sample limits generalisation. The predictive system has not yet been tested, and the effect of recommendations on learning remains unknown. Both questions are reserved for the planned Phase 2 and subsequent evaluation.
References
- [1]Zawacki-Richter O, Marín VI, Bond M, Gouverneur F. Systematic review of research on artificial intelligence applications in higher education – where are the educators? International Journal of Educational Technology in Higher Education. 2019;16:39. https://doi.org/10.1186/s41239-019-0171-0
- [2]Albreiki B, Zaki N, Alashwal H. A systematic literature review of students’ performance prediction using machine learning techniques. Education Sciences. 2021;11(9):552. https://doi.org/10.3390/educsci11090552
- [3]Maghsudi S, Lan A, Xu J, van der Schaar M. Personalized education in the artificial intelligence era: What to expect next. IEEE Signal Processing Magazine. 2021;38(3):37–50. https://doi.org/10.1109/MSP.2021.3055032
- [4]Batool S, Rashid J, Nisar MW, Kim J, Kwon HY, Hussain A. Educational data mining to predict students’ academic performance: A survey study. Education and Information Technologies. 2023;28:905–971. https://doi.org/10.1007/s10639-022-11152-y
- [5]Alyahyan AA, Düştegör D. Predicting academic success in higher education: Literature review and best practices. International Journal of Educational Technology in Higher Education. 2020;17:3. https://doi.org/10.1186/s41239-020-0177-7
- [6]Alamri R, Alharbi B. Explainable student performance prediction models: A systematic review. IEEE Access. 2021;9:33132–33143. https://doi.org/10.1109/ACCESS.2021.3061368
- [7]Urdaneta-Ponte A, Méndez-Zorrilla A, Oleagordia-Ruíz I. Recommendation systems for education: Systematic review. Electronics. 2021;10(14):1611. https://doi.org/10.3390/electronics10141611