Electronic Permit-to-Work in Oil and Gas
Electronic Permit-to-Work Systems and Operational Efficiency in the Nigerian Oil and Gas Industry
1Centre for Occupational Health, Safety and Environment, Institute of Petroleum Studies, Faculty of Engineering, University of Port Harcourt, Port Harcourt, Rivers State, Nigeria
2Department of Civil and Environmental Engineering, University of Port Harcourt, Port Harcourt, Rivers State, Nigeria
Published October 2026
Abstract
This study investigated the impact of electronic permit-to-work (e-PTW) systems on operational efficiency in the Nigerian oil and gas industry. A quantitative cross-sectional design was employed, and a questionnaire survey was used as the instrument for data collection. Collaboration, productivity, communication and error reduction were constructs used to capture operational efficiency. The population of the study consisted of 2000 employees involved in operations, safety, maintenance, and project management across selected oil and gas companies in the Niger Delta region from which a total of 345 respondents were sampled using stratified random sampling technique and Taro Yamane sample size determination formula. A structured questionnaire designed based on 5-point Likert scale was used for data collection. Data analysis employed included descriptive statistics and multiple regression analysis using SPSS version 26. The impact of e-PTW revealed that it would boost real-time tracking and record retrieval. Implementation barriers were generally low to moderate (M = 2.29), with poor connectivity (M = 2.63), training deficits (M = 2.52), and system downtime (M = 2.48) representing primary challenges, while resistance to change was minimal (M = 1.85). It was also revealed that benefits perception was the dominant predictor of impact, overshadowing the effects of barriers, implementation duration, and organisational characteristics. The study concluded that the universal positive impact of e-PTW systems demonstrates robust value delivery that transcends organizational differences, supporting broad adoption recommendations across all operator types, and that implementation barriers for electronic Permit-to-Work (e-PTW) systems are generally manageable and do not represent insurmountable obstacles when organizations apply appropriate planning and resource allocation.
Keywords: electronic permit-to-work (e-PTW); operational efficiency; Nigerian oil and gas industry
1Introduction
The oil and gas industry is a complex and high-risk sector that requires stringent safety protocols to ensure the well-being of personnel and the environment. One critical aspect of safety management in this industry is the Permit-to-Work (PTW) system, a formal, documented process used to control work activities that pose potential hazards. Traditional PTW systems, often paper-based, have been widely used but are increasingly seen as inefficient due to their reliance on manual processes, which can lead to delays, errors, and safety risks. The advent of digital technology has paved the way for electronic PTW (e-PTW) systems, which promise to enhance operational efficiency, safety, and compliance in the industry (Khan et al., 2022; Patel & Sharma, 2021).
The shift towards digitalization in the oil and gas industry is driven by the need for improved operational efficiency, reduced costs, and enhanced safety. e-PTW systems are a key component of this digital transformation, offering a range of benefits over traditional paper-based systems. By automating permit management, e-PTW systems can reduce processing time, minimize downtime, and improve productivity. Moreover, digital PTW systems provide real-time data and insights, enabling better decision-making and risk assessment. According to a report by Markets and Markets, the adoption of digital technologies, including e-PTW systems, is expected to save the oil and gas industry billions of dollars in operational costs (AlMutairi et al., 2023 & Wang et al 2022).
The implementation of e-PTW systems also addresses some of the key challenges associated with traditional PTW systems, such as illegible handwriting, lost or misplaced permits, and delays in approval processes. Digital PTW systems ensure that all stakeholders have access to accurate and up-to-date information, reducing the likelihood of mistakes and miscommunication. Furthermore, e-PTW systems facilitate data traceability and auditability, enabling companies to track permit lifecycles and identify areas for improvement. A study by the International Association of Oil & Gas Producers (IOGP) highlights the importance of digital PTW systems in enhancing safety and operational efficiency in the industry (Lee & Kim 2022; Smith, 2023).
The oil and gas industry operates in a high-risk environment where safety is paramount. Permit-to-Work (PTW) systems are essential for managing hazardous activities and ensuring the safety of personnel and the environment. However, while PTW systems are crucial for maintaining safety standards, their impact on operational efficiency remains a subject of concern. The traditional paper-based permit-to-work (PTW) system in the oil and gas industry is plagued by inefficiencies, inaccuracies, and safety risks. Manual processing of permits can lead to delays, lost or misplaced permits, and illegible handwriting, ultimately compromising personnel safety and affecting project timelines (Khan et al., 2022). According to a study, paper-based PTW systems are prone to human error, with a high likelihood of mistakes and inaccuracies that can have severe consequences (Patel & Sharma, 2021). Moreover, the lack of real-time data and insights in paper-based systems hinders effective decision-making and risk assessment (AlMutairi et al., 2023). The shift to digital permit-to-work (e-PTW) systems can address these challenges and improve operational efficiency, safety, and compliance. e-PTW systems provide a centralized, automated, and real-time platform for permit creation, approval, and tracking, reducing the risk of errors and inaccuracies (Wang et al., 2020).
By leveraging digital technology, companies can streamline permit management, enhance collaboration and communication among stakeholders, and improve data traceability and auditability (Lee & Kim, 2022). Studies have shown that e-PTW systems can lead to significant improvements in safety, increase in productivity, and cost savings, making them an essential tool for companies in the oil and gas industry (Smith, 2023). One of the primary benefits of e-PTW systems is the reduction of manual errors and inaccuracies. Digital PTW systems ensure that all stakeholders have access to accurate and up-to-date information, reducing the likelihood of mistakes and miscommunication (AlMutairi et al., 2023). Furthermore, e-PTW systems facilitate data traceability and auditability, enabling companies to track permit lifecycles and identify areas for improvement (Smith, 2023). The adoption of e-PTW systems is crucial for the oil and gas industry, where safety and operational efficiency are paramount. By implementing digital PTW systems, companies can improve compliance with regulatory requirements, reduce downtime, and enhance overall productivity (Patel & Sharma, 2021). As the industry continues to expand, the adoption of e-PTW systems will play a vital role in setting new standards for occupational safety and operational excellence.
The oil and gas industry is also subject to stringent regulatory requirements, and e-PTW systems can play a crucial role in ensuring compliance. Digital PTW systems provide a centralized platform for permit management, enabling companies to track and record all work activities, including maintenance, inspection, testing etc. This feature is particularly useful for audit purposes, as companies can easily retrieve and review permit records. According to a report by the Oil & Gas UK, the adoption of e-PTW systems can help companies demonstrate compliance with regulatory requirements and industry standards (Patel & Sharma, 2021; Lee & Kim 2022). The oil and gas industry in Nigeria, particularly in the Niger Delta region, is a cornerstone of the national economy but also one of the most hazardous sectors due to its complex operations and high-risk environments. Ensuring safety and operational efficiency in such a setting requires robust systems for managing work activities, especially those involving hazardous tasks.
The Permit-to-Work (PTW) system has long served as a critical safety tool, authorizing specific tasks only after all necessary precautions are in place. However, traditional paper-based PTW systems have been criticized for inefficiencies such as delays, illegible documentation, and lack of real-time visibility, which can compromise both safety and productivity. To address these challenges, many oil and gas operators in Nigeria are transitioning to electronic Permit-to-Work (e-PTW) systems, which digitize the entire permit process. These systems offer significant advantages, including automated workflows, centralized data access, and real-time monitoring of permit status. In the Niger Delta, where operational risks are heightened by environmental sensitivity and community tensions, the adoption of e-PTW systems is seen as a strategic move to enhance both safety compliance and operational efficiency. Despite these benefits, barriers such as infrastructure limitations, user resistance, and lack of standardization still hinder widespread implementation. Thus, this current study was focused on investigating the impact of electronic Permit-to-Work (e-PTW) systems, on the operational efficiency of Nigerian oil and gas sector and to identify the barriers to implementing e-PTW systems in the oil and gas industry in Nigeria and explore potential solutions.
2Methodology
2.1Study area
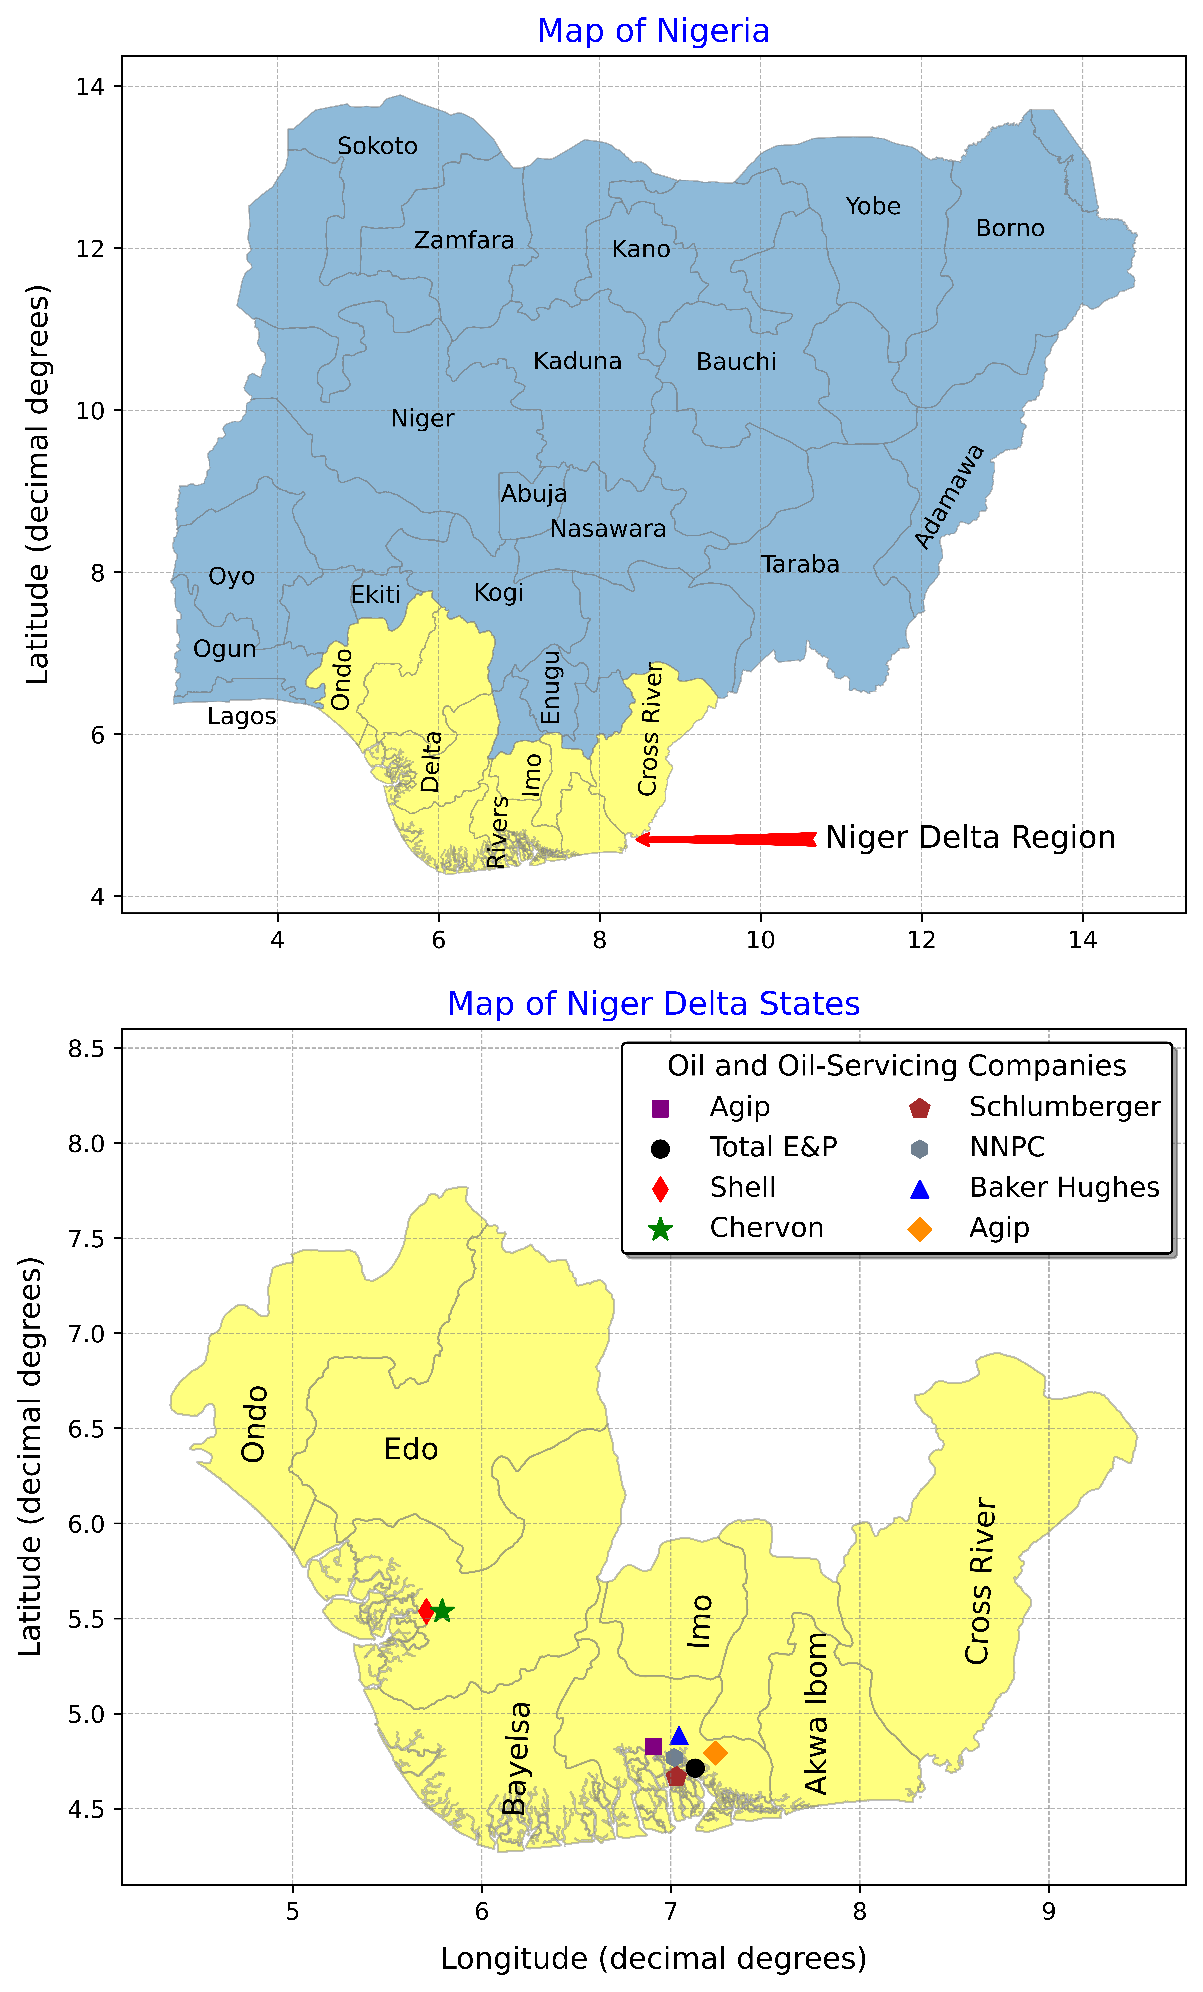
This research focuses on regions in Nigeria with a significant presence of oil and gas companies, specifically the states of Akwa Ibom, Bayelsa, Cross River, Delta, Edo, and Rivers as shown in Figure 1. Collectively, these states cover an estimated area of approximately 112,110 square kilometers and have a population ranging between 26 to 30 million people. This oil-rich region is critical to Nigeria’s petroleum industry and is characterized by cultural diversity, with numerous ethnic groups and languages. The coastal terrain, which includes the Niger Delta, plays a vital role in shaping both the economy and the environment. Key industries in the area include oil production, fishing, agriculture, and tourism. However, the region faces significant environmental challenges such as oil spills, flooding, and land degradation. Politically, it holds strategic importance in discussions around resource control, environmental justice, and sustainable development. The Niger Delta is characterized by complex industrial operations, environmental sensitivity, and safety-critical activities that make the adoption of e-PTW systems highly relevant. It provides an ideal context to evaluate both the operational benefits and challenges associated with digital transformation in safety management.
2.2Population, sampling technique and sample size determination
The population of the study consists of all employees involved in operations, safety, maintenance, and project management across selected oil and gas companies in the Niger Delta region. These include supervisors, engineers, technicians, safety officers, and permit coordinators who are directly engaged with the PTW or e-PTW process. According to data from the Nigerian Upstream Petroleum Regulatory Commission (NUPRC, 2024), an estimated 2,000 employees work directly in permit-related functions across the region’s upstream and midstream oil and gas operations. Hence, the total population (N) for this study is estimated at 2,000 workers. Given the large population, a representative sample was selected using Yamane’s (1967) formula for determining sample size:
where n is the sample size, N is the population size (2000) and e is the level of precision (0.05): n = 2000/[1 + 2000(0.0025)] = 2000/6 = 333. Thus, a sample size of 300 respondents was deemed sufficient to ensure statistical reliability.
The study employs a stratified random sampling technique to ensure proportional representation across different companies and departments. The population was divided into strata based on the following categories: Company ownership (multinational vs. indigenous operators), Department (operations, maintenance, safety, engineering, project management) and Job level (senior staff, supervisors, technicians). From each stratum, participants were randomly selected proportionally to their representation in the population. This approach minimizes sampling bias and ensures diversity of perspectives across the oil and gas workforce (Etikan & Bala, 2017).
2.3Sources of data
Data for this study were obtained from two primary sources. Primary data were collected directly from respondents through structured questionnaires designed to capture quantitative measurements of PTW system performance, e-PTW benefits, operational impacts, and implementation barriers. Secondary data were sourced from published journals, government reports, company whitepapers, industry databases, and prior academic studies on e-PTW systems, operational efficiency, and digital transformation in the oil and gas sector. The combination of primary and secondary sources provided comprehensive empirical evidence while situating the findings within existing theoretical and practical knowledge.
2.4Instruments and method of data collection
The structured questionnaire served as the primary data collection instrument. It was divided into two sections: Section A measured the impact of e-PTW implementation across four constructs: error reduction (three items), productivity (three items), collaboration (three items), and communication (three items) while Section B examined implementation barriers through eight items assessing resistance to change, training adequacy, technical support, infrastructure constraints, system reliability, costs, management commitment, and communication effectiveness. All substantive items employed a five-point Likert scale ranging from 1 (Strongly Disagree/Not a Barrier) to 5 (Strongly Agree/Critical Barrier), providing standardized measurement suitable for statistical analysis. Data collection was carried out over a 6-week period. Copies of the Questionnaire were distributed both physically and electronically via corporate email and Google Forms to maximize response rates. Follow-up reminders were sent weekly.
2.5Validation and reliability of the instrument
Content and construct validity were established through expert review and pilot testing. The draft questionnaire was reviewed by three experts in safety management and research methodology from two Nigerian universities and one oil and gas company. The experts assessed whether the items adequately represented the theoretical constructs and research objectives, evaluated question clarity and appropriateness, and provided recommendations for improvement. Their feedback ensured that the instrument accurately measured the intended variables and was contextually appropriate for the Nigerian oil and gas industry. Subsequently, a pilot study involving 30 respondents in Rivers State was conducted to test the instrument's clarity, comprehensibility, and practical applicability. Minor adjustments were made based on pilot participants' feedback to enhance question clarity and ensure proper alignment with research variables, thereby strengthening the instrument's face validity and usability in the main study.
Internal consistency reliability was assessed using Cronbach's Alpha coefficient. The pilot study results demonstrated excellent reliability across all constructs: Paper-Based PTW Challenges (α = 0.807), e-PTW Benefits Overall (α = 0.816), e-PTW Impact Overall (α = 0.837), and Implementation Barriers (α = 0.930). All coefficients substantially exceeded the recommended threshold of 0.70, indicating that the items within each construct consistently measured the same underlying dimension. The high reliability values confirmed that the instrument would produce stable and consistent measurements in the main study, thereby supporting the validity of subsequent statistical analyses and conclusions drawn from the data.
2.6Method of data analysis
Data were coded and entered in SPSS version 26. Descriptive statistics (mean, standard deviation, frequencies) summarized responses. Inferential statistics such as multiple regression analysis were used to test hypotheses. Hypotheses were tested at a 0.05 significance level to determine statistical relationships between e-PTW implementation and operational efficiency.
3Results and discussion
3.1Impact of e-PTW systems on errors, productivity, collaboration and communication
The impact assessment dimensions are presented in Table 1 while the results of the impact of e-PTW systems on operational performance are presented in Table 2. The result revealed that all respondents (100%) reported positive impact across all dimensions, with mean ratings consistently above 4.0, indicating strong agreement that e-PTW systems improved operational outcomes. Collaboration emerged as the dimension with the highest perceived impact, with respondents reporting that e-PTW systems substantially improved collaboration among teams (M = 4.42, SD = 0.48). This indicates that electronic systems fundamentally enhanced how teams work together in managing permit-to-work processes.
Productivity showed equally strong impact, with respondents reporting that e-PTW systems improved productivity in permit processing and work execution (M = 4.40, SD = 0.42). Communication also demonstrated substantial impact, with respondents agreeing that e-PTW systems enhanced communication effectiveness across operational teams (M = 4.40, SD = 0.41). Error reduction was reported as a major impact area, with respondents indicating that e-PTW systems reduced errors in permit processing and work execution (M = 4.36, SD = 0.44). The overall impact across all four dimensions was highly positive (M = 4.39, SD = 0.35), demonstrating that e-PTW systems delivered comprehensive operational improvements.
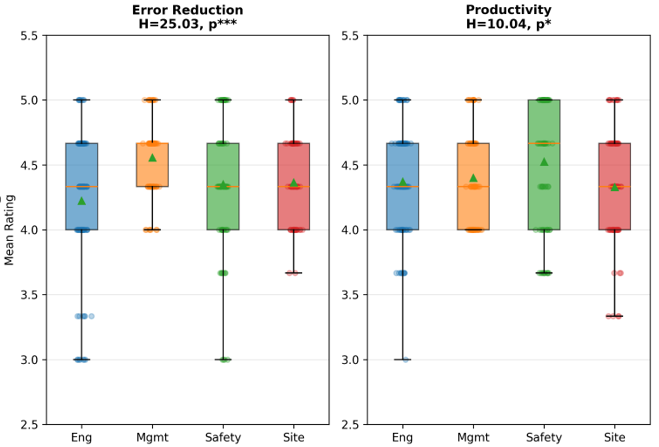
The job role-specific impact analysis presented in Figure 2 and Figure 3 revealed interesting patterns in how different professional groups experienced e-PTW impact. For error reduction, as shown in the left panel of Figure 2, Management/Supervisor reported the highest perceived impact (M = 4.56), while Engineers reported the lowest (M = 4.22). Safety Officers (M = 4.35) and Site Supervisors (M = 4.37) reported intermediate levels. The Kruskal–Wallis test presented in Table 2 confirmed significant differences across job roles (H = 25.03, p < .001). Management/Supervisor experienced significantly greater error reduction impact compared to Engineers, Safety Officers, and Site Supervisors. This pattern suggests that supervisory roles, who bear ultimate responsibility for work quality and safety outcomes, most readily observe the error reduction benefits of systematic electronic permit processes.
For productivity impact, shown in the right panel of Figure 2, Safety Officers reported the highest perceived impact (M = 4.52), while Site Supervisors reported the lowest (M = 4.33). Engineers (M = 4.37) and Management/Supervisor (M = 4.40) reported intermediate levels. The Kruskal–Wallis test revealed significant differences (H = 10.04, p = .018). Safety Officers experienced significantly higher productivity impact compared to other job roles. The boxplot shows that Safety Officers demonstrated the narrowest interquartile range and highest median, indicating consistent recognition of productivity gains within this group. This may reflect how e-PTW systems streamline safety verification processes, allowing Safety Officers to complete their responsibilities more efficiently.
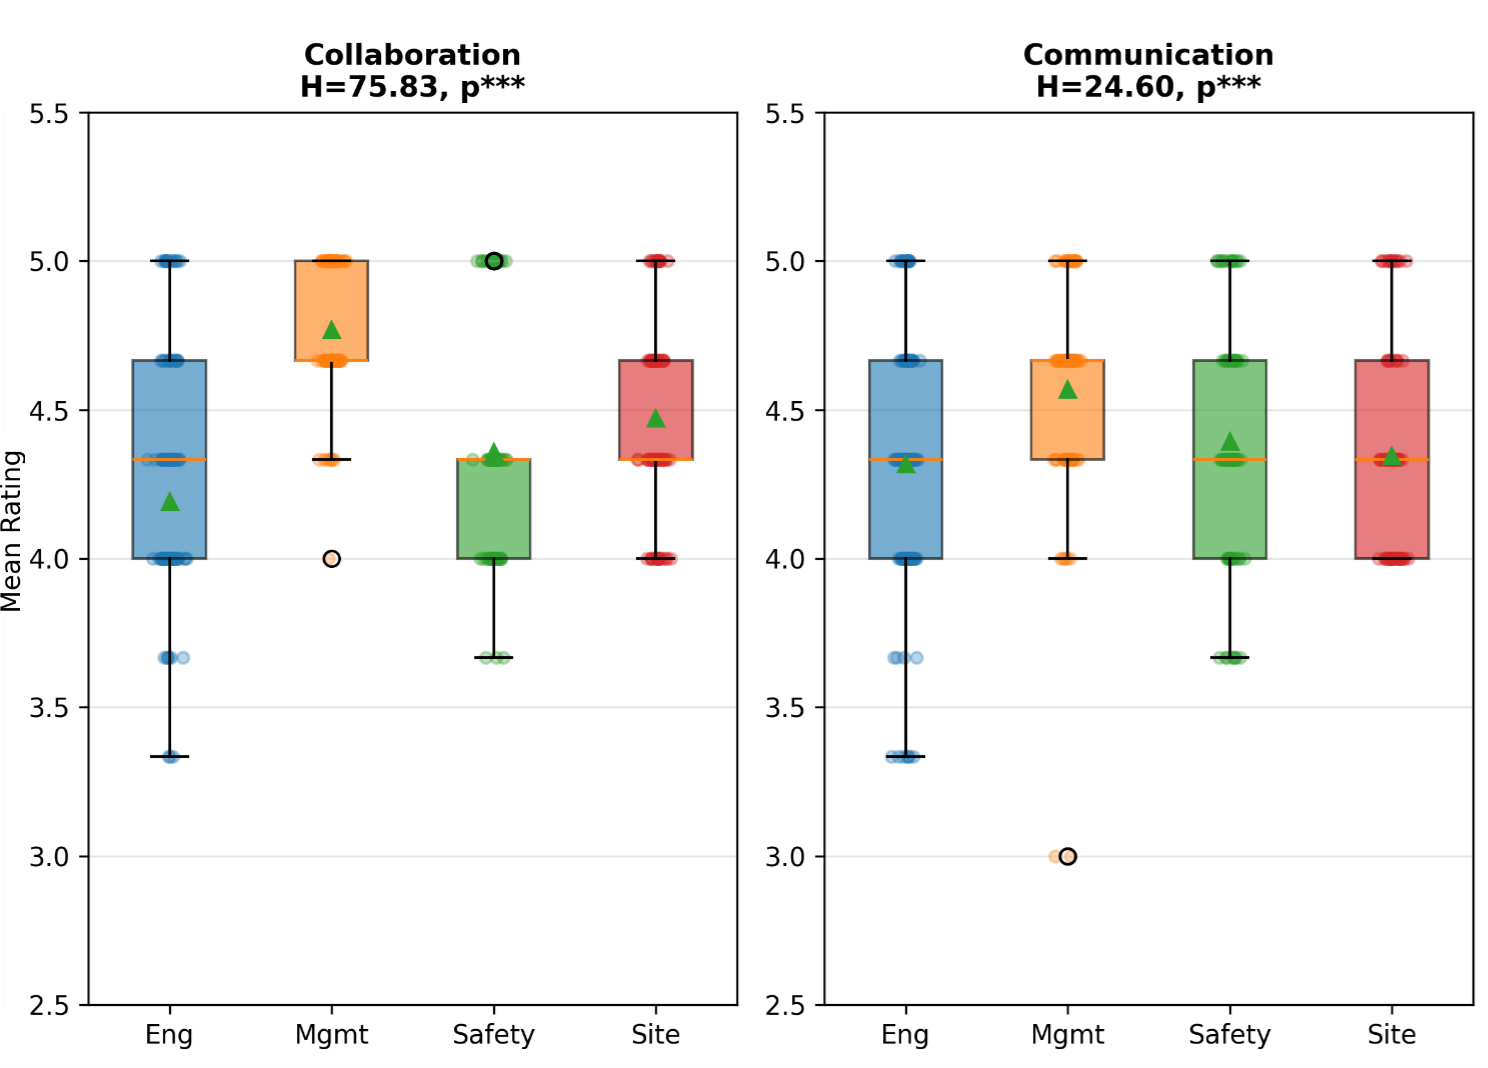
Collaboration impact, presented in the left panel of Figure 3, showed the strongest variation across job roles. Management/Supervisor reported the highest perceived impact (M = 4.77), substantially higher than all other roles. Site Supervisors reported moderate impact (M = 4.47), while Safety Officers (M = 4.36) and Engineers (M = 4.19) reported lower impact. The Kruskal–Wallis test demonstrated highly significant differences (H = 75.83, p < .001). Management/Supervisor experienced significantly greater collaboration impact compared to all other job roles, while Engineers experienced the lowest collaboration impact. The boxplot clearly illustrates this pattern, with Management/Supervisor showing a distinctly higher distribution. This substantial difference reflects how e-PTW systems particularly benefit roles that coordinate multiple stakeholders and manage cross-functional permit workflows.
Communication impact, shown in the right panel of Figure 3, revealed a similar but less pronounced pattern. Management/Supervisor again reported the highest perceived impact (M = 4.57), followed by Safety Officers (M = 4.39), Site Supervisors (M = 4.35), and Engineers (M = 4.32). The Kruskal–Wallis test showed significant differences (H = 24.60, p < .001). Management/Supervisor experienced significantly greater communication impact compared to Engineers, Safety Officers, and Site Supervisors. The convergence among Engineers, Safety Officers, and Site Supervisors suggests that communication improvements are broadly recognized across operational roles, though supervisory positions benefit most substantially.
The regression analysis presented in Table 3 quantified these relationships. Operational Efficiency showed a significant positive effect (B = 0.237, β = 0.308, p < .001) with collaboration impact (model 3). Also, Compliance and Documentation (B = 0.152, β = 0.232, p < .001) and Safety Improvement (B = 0.106, β = 0.165, p = .002) showed significant positive relationship with collaborative impact. For the relationship between the benefit factors and communication impact, Compliance and Documentation demonstrated the strongest effect (B = 0.207, β = 0.361, p < .001), followed by Operational Efficiency (B = 0.120, β = 0.177, p = .001) and Safety Improvement (B = 0.082, β = 0.147, p = .006). For error reduction, Safety Improvement showed the strongest effect (B = 0.272, β = 0.346, p < .001), followed by Operational Efficiency (B = 0.193, β = 0.253, p = .001) and Compliance and Documentation (B = 0.064, β = 0.100, p = .140). For productivity, Compliance and Documentation demonstrated the strongest effect (B = 0.329, β = 0.270, p < .001), followed by Operational Efficiency (B = 0.153, β = 0.161, p = .004) and Safety Improvement (B = 0.145, β = 0.210, p < .001).
| Impact Dimension | Mean | SD | % Improved |
|---|---|---|---|
| Collaboration | 4.42 | 0.48 | 100.0 |
| Productivity | 4.40 | 0.42 | 100.0 |
| Communication | 4.40 | 0.41 | 100.0 |
| Error Reduction | 4.36 | 0.44 | 100.0 |
| OVERALL | 4.39 | 0.35 | 100.0 |
Note. % Improved represents respondents scoring above 3.0 (neutral).
| Construct | Engineer | Mgmt./Supervisor | Safety Officer | Site Supervisor | H | p |
|---|---|---|---|---|---|---|
| Error Reduction | 4.22b | 4.56a | 4.35b | 4.37b | 25.03 | <.001*** |
| Productivity | 4.37b | 4.40b | 4.52a | 4.33b | 10.04 | 0.018* |
| Collaboration | 4.19c | 4.77a | 4.36b | 4.47b | 75.83 | <.001*** |
| Communication | 4.32b | 4.57a | 4.39b | 4.35b | 24.60 | <.001*** |
Note. N = 345. Means with different superscript letters differ significantly at p < .05 based on Dunn's post-hoc pairwise comparisons. ***p < .001, **p < .01, *p < .05.
| Dependent Variable | Independent Variable | B | SE | β | CR | p-value |
|---|---|---|---|---|---|---|
| Error Reduction (Model 1) | Operational Efficiency | 0.075 | 0.055 | 0.077 | 1.363 | .173 |
| Compliance & Documentation | 0.281 | 0.067 | 0.222 | 4.186 | <.001*** | |
| Safety Improvement | 0.246 | 0.040 | 0.342 | 6.226 | <.001*** | |
| Communication (Model 2) | Operational Efficiency | 0.184 | 0.049 | 0.199 | 3.748 | <.001*** |
| Compliance & Documentation | 0.389 | 0.059 | 0.328 | 6.553 | <.001*** | |
| Safety Improvement | 0.147 | 0.035 | 0.217 | 4.189 | <.001*** | |
| Collaboration (Model 3) | Operational Efficiency | 0.356 | 0.053 | 0.331 | 6.738 | <.001*** |
| Compliance & Documentation | 0.193 | 0.064 | 0.140 | 3.015 | .003** | |
| Safety Improvement | 0.272 | 0.038 | 0.346 | 7.192 | <.001*** | |
| Productivity (Model 4) | Operational Efficiency | 0.153 | 0.054 | 0.161 | 2.847 | .004** |
| Compliance & Documentation | 0.329 | 0.065 | 0.270 | 5.054 | <.001*** | |
| Safety Improvement | 0.145 | 0.038 | 0.210 | 3.776 | <.001*** |
Note. N = 345. B = unstandardized regression weight; SE = standard error; β = standardized regression weight; CR = critical ratio. ***p < .001, **p < .01.
3.2Barriers to implementing e-PTW systems
The results of the barriers to e-PTW implementation are presented in Table 4. The result revealed that poor internet connectivity or network infrastructure was identified as the most severe barrier to e-PTW implementation. About 29% of respondents rated poor connectivity as a severe or critical barrier (M = 2.63, SD = 1.36), making it the highest-rated implementation challenge. This indicates that network infrastructure limitations represent a fundamental constraint to electronic permit system deployment in the Nigerian oil and gas industry. Lack of adequate training emerged as the second most significant barrier, with 20% of respondents rating it as severe or critical (M = 2.52, SD = 1.21). System downtime and technical reliability issues ranked third, with 26% rating this as a severe barrier (M = 2.48, SD = 1.26). Inadequate communication about the implementation process was reported by 23% as a severe barrier (M = 2.33, SD = 1.33). Lack of management commitment and support received 18% severe ratings (M = 2.24, SD = 1.20). High implementation and maintenance costs were rated as severe by 14% of respondents (M = 2.16, SD = 1.11). Insufficient technical support for e-PTW implementation received similar severity ratings, with 15% rating it as severe (M = 2.16, SD = 1.08). Staff resistance to change from paper to electronic systems showed the lowest severity, with only 14% rating it as a severe barrier (M = 1.85, SD = 1.13).
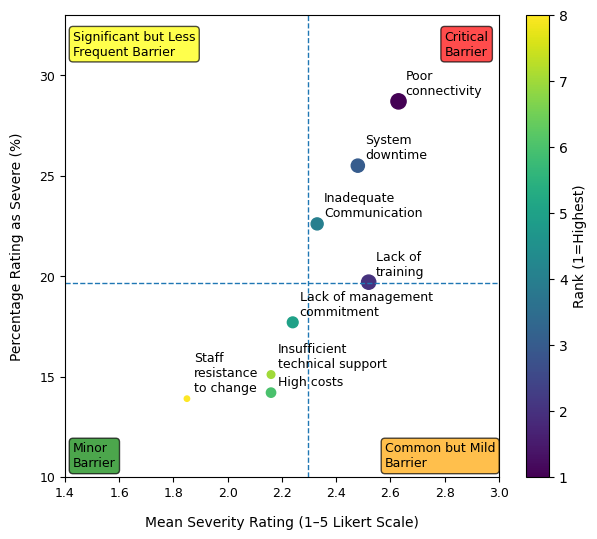
The barrier classification presented in Figure 4 provides a strategic framework for understanding implementation challenges based on their severity and frequency. The figure plots each barrier according to its mean severity rating (x-axis) and the percentage of respondents rating it as severe (y-axis), with barriers color-coded by rank from highest (rank 1, darkest) to lowest (rank 8, lightest). The plot is divided into four quadrants by dashed reference lines at mean severity = 2.2 and severe percentage = 20%. Poor connectivity positioned in the upper right quadrant, classified as a "Critical Barrier" due to its combination of high mean severity (2.63) and high frequency of severe ratings (28.7%). This positioning indicates that network infrastructure represents both a common and intense implementation challenge. The barrier's dark purple colour (rank 1) and position furthest to the right confirm it as the most critical impediment to e-PTW adoption. This classification suggests that organizations must prioritize network infrastructure development as a prerequisite for successful e-PTW implementation. System downtime positioned in the "Common but Mild Barrier" quadrant (lower right), with moderate mean severity (2.48) but relatively high frequency of severe ratings (25.5%). This classification indicates that while system reliability concerns affect many organizations, the intensity of this barrier varies considerably. The moderate positioning suggests that technical reliability can be managed through appropriate system selection and maintenance protocols, though it remains a consideration for a substantial proportion of implementers.
Inadequate communication positioned just below the 20% threshold in the "Common but Mild Barrier" quadrant, with mean severity of 2.33 and 22.6% severe ratings. This placement indicates that communication gaps during implementation affect a notable proportion of organizations but generally with manageable intensity. The barrier's mid-range rank (4) suggests it represents a moderate priority for implementation planning. Lack of training positioned in the transition area between quadrants, with mean severity of 2.52 and severe ratings just below 20% (19.7%). This near-threshold positioning indicates that training deficits represent a significant concern for a substantial minority of organizations. The barrier's high rank (2, indicated by dark purple colour) confirms it as a priority area requiring attention during implementation planning, even though it does not affect the majority of organizations severely. Lack of management commitment positioned in the "Significant but Less Frequent Barrier" quadrant (upper left), with moderate mean severity (2.24) but below-threshold severe ratings (17.7%). This classification indicates that while management support gaps can be intense when they occur, they affect a smaller proportion of implementations. The positioning suggests that management buy-in, while important, may be more readily secured than technical infrastructure improvements.
High costs positioned in the lower left "Minor Barrier" quadrant, with relatively low mean severity (2.16) and low severe ratings (14.2%). This classification indicates that financial constraints, while present, do not represent a primary impediment to e-PTW adoption. The low severity suggests that the operational and safety benefits of e-PTW systems justify their costs in most organizational contexts, or that implementation costs have become more manageable as technology has matured. Insufficient technical support also positioned in the "Minor Barrier" quadrant, with mean severity of 2.16 and 15.1% severe ratings. This classification indicates that technical support availability, while occasionally challenging, does not constitute a major implementation obstacle. The positioning suggests that adequate technical expertise is generally accessible through vendors, consultants, or internal IT resources. Staff resistance to change positioned furthest to the left in the "Minor Barrier" quadrant, with the lowest mean severity (1.85) and lowest severe ratings (13.9%). This classification indicates that user acceptance is not a significant impediment to e-PTW implementation. The minimal resistance suggests that when e-PTW systems address genuine operational needs and deliver tangible benefits, personnel readily embrace the technology. This finding contradicts common assumptions about technology resistance and indicates that the value proposition of e-PTW systems is sufficiently compelling to overcome change management challenges.
The overall pattern of low to moderate barrier severity (overall M = 2.29) indicates that e-PTW implementation, while not without challenges, faces no insurmountable obstacles in the Nigerian oil and gas context. The primary constraint is infrastructure-related (connectivity) rather than organizational or human factors. The minimal staff resistance and manageable cost concerns suggest strong organizational readiness for e-PTW adoption, with the primary implementation focus needing to address technical infrastructure prerequisites rather than change management or financial hurdles.
| Rank | Barrier | Mean | SD | Severe % |
|---|---|---|---|---|
| 1 | Poor connectivity | 2.63 | 1.36 | 28.7 |
| 2 | Lack of training | 2.52 | 1.21 | 19.7 |
| 3 | System downtime | 2.48 | 1.26 | 25.5 |
| 4 | Inadequate communication | 2.33 | 1.33 | 22.6 |
| 5 | Lack of management commitment | 2.24 | 1.20 | 17.7 |
| 6 | High costs | 2.16 | 1.11 | 14.2 |
| 7 | Insufficient technical support | 2.16 | 1.08 | 15.1 |
| 8 | Staff resistance to change | 1.85 | 1.13 | 13.9 |
Note. Severe % represents respondents who rated barriers as severe (scores 4-5).
4Conclusions
The impact of electronic permit-to-work (e-PTW) systems on the operational efficiency of Nigerian oil and gas sector has been investigated. Based on the research findings, it was concluded, first, that the universal positive impact of e-PTW systems demonstrates robust value delivery that transcends organizational differences, supporting broad adoption recommendations across all operator types and, second, that implementation barriers for electronic Permit-to-Work (e-PTW) systems are generally manageable and do not represent insurmountable obstacles when organizations apply appropriate planning and resource allocation.
References
- [1]AlMutairi A, Khan F, Ahmed S (2023). Impact of digital PTW systems on safety in oil refineries. Safety Science, 152, 105–115.
- [2]Etikan B, Bala D (2017). Development of evidence-based factors to enhance safety behaviour and performance among Nigeria oil and gas employees in the Niger Delta region (Doctoral thesis). Manchester Metropolitan University Repository.
- [3]Khan S, Rahman M, Okechukwu C (2022). Enhancing operational efficiency with e-PTW systems in oil and gas industry. Journal of Petroleum Technology, 10(3), 45–56.
- [4]Lee S, Kim J (2022). Enhancing collaboration and communication with e-PTW systems in oil and gas industry. Journal of Management in Engineering, 38(2), 04022003
- [5]Patel R, Sharma S (2021). Improving safety compliance with e-PTW systems in oil and gas facilities. Journal of Loss Prevention in the Process Industries, 72, 104–112.
- [6]Smith J (2023). Digital transformation in oil and gas: A case study of e-PTW systems. Energy Today, 20(1), 12–20.
- [7]Wang Y, Li X, Zhou M (2020). Real-time monitoring in oil and gas industry using e-PTW systems. International Journal of Industrial Ergonomics, 76, 102–110.