Soil and Crop Contamination Near Power Plants
Spatial and Seasonal Variation in Soil Chemistry and Contaminant Profiles of Soils and Food Crops around Gas-Fired Power Plants in Rivers State, Nigeria
1Department of Occupational Health and Safety Management, Africa Center of Excellence – Center for Oilfield Chemicals Research (ACE-CEFOR), University of Port Harcourt, Port Harcourt, Nigeria
2Department of Biochemistry, University of Port Harcourt, Port Harcourt, Nigeria
Published October 2026
Abstract
Spatial gradients around power plants can vary among environmental matrices and between seasons, making proximity alone an incomplete predictor of contamination. This study examined soil chemistry, seven reported metals, and 16 priority polycyclic aromatic hydrocarbons (PAHs) at nominal distances of 0, 300, and 600 m around the Trans-Amadi and Omoku gas-fired power plants, Rivers State, Nigeria. Etche served as a separate control site. Soil and plant sampling covered three dates per season between December 2024 and July 2025; soil was sampled at 0–10 and 10–20 cm layers, and waterleaf and cassava roots and leaves were analysed. Descriptive comparisons combined seasonally tabulated soil properties, heavy metals and soil PAH diagnostic ratios. Wet-season soil pH increased by 1.223–1.856 units at Trans-Amadi and 0.844–1.190 units at Omoku. Heavy metals generally reflected concentrations with distance, except manganese; selected crop plots also showed non-monotonic zinc profiles. PAH concentrations did not follow a distance-decay pattern. Trans-Amadi soil and Omoku waterleaf showed prominent intermediate-distance maxima, while Omoku cassava profiles were comparatively uniform across the three points. At Trans-Amadi, dry-season surface-soil LMW/HMW ratios decreased from 1.11025 at 0 m to 0.31331 at 300 m and 0.01034 at 600 m; at Omoku they were 4.23204, 0.84781, and 2.78897, respectively. Seasonal changes in these profiles further demonstrated that compositional gradients differed by site. The observations identify spatial and seasonal heterogeneity.
Keywords: spatial variation; seasonal variation; distance gradient; gas-fired power plants; heavy metals; polycyclic aromatic hydrocarbons; Rivers State
1Introduction
Environmental conditions surrounding electricity-generation facilities reflect interactions between emissions, surrounding activities, soil characteristics, and seasonal transport processes (Gune et al., 2020). A measurement made during a single sampling period may therefore provide an incomplete account of contaminant distribution. In tropical settings, seasonal rainfall can influence contaminant mobilisation and redistribution across environmental media (Akinkpelumi et al., 2025). Dry conditions may favour the accumulation of deposited particles on vegetation, whereas rainfall can wash some of this material from leaf surfaces and transfer it to the ground; the extent of removal depends on rainfall characteristics and plant species (Xu et al., 2017). These processes can operate simultaneously, so seasonal patterns should be evaluated separately for soils and crop tissues rather than assumed to follow the same direction (Akinkpelumi et al., 2025; Xu et al., 2017). Concurrent air and soil sampling in Kutahya demonstrated spatial and seasonal variation together with air-soil exchange (Dumanoglu et al., 2017).
This study examines seasonal variation in soil chemistry and contaminant profiles around the Trans-Amadi and Omoku gas-fired power plants, using Etche as a control site within Rivers State. Its objectives are to quantify available soil property contrasts, examine metal and PAH distributions at the three nominal distances, describe how spatial patterns differ between seasons and tissues, and evaluate the spatial consistency of PAH diagnostic-ratio evidence. The central questions are whether contaminant burdens decline from 0 to 600 m, whether that spatial ordering changes between seasons, and whether soils and plant tissues display comparable gradients. The analysis distinguishes between-site differences, within-site distance patterns, and seasonal changes so that one form of variation is not substituted for another.
2Methodology
Environmental sampling was conducted around the Omoku I and Trans-Amadi gas-fired power plants and at a control site in Etche, Rivers State, Nigeria. Trans-Amadi (TPP) and Omoku (OPP) each had three designated sampling points, L1, L2, and L3, representing nominal distances of 0, 300, and 600 m. The first points were described as within the facility enclosures; the methods record also describes distances relative to the perimeter fence. Accordingly, these distances are treated as nominal sampling designations rather than verified distances from individual stacks.
Etche sampling points were approximately 20 m apart. The closely spaced Etche points provide a local comparison rather than independent controls matched to each industrial distance. Table 1 summarises the study framework. Each season (wet and dry) included three sampling dates, and the two seasons were sampled sequentially across one annual transition.
Soils were sampled at 0–10 and 10–20 cm depths. Five subsamples, collected approximately 20 cm apart within a sampling point, were combined, pooled, and homogenised to form an approximately 500 g composite. Roots and leaves of cassava (Manihot esculenta) and waterleaf (Talinum fruticosum) were collected at the corresponding soil sampling. Soil depth was retained as a soil factor; the plant sampling only took distance into account. 324 soil and plant samples were collected in total, comprising 108 soil and 216 plant units. Seasonal means were calculated from the averages of readings for each sample and sampling point.
The following parameters were analyzed at the laboratory from each sample: physicochemical properties of soil: pH, cation exchange capacity (CEC), soil texture (sand, silt and clay composition), total organic matter (TOM), soil nutrients (nitrogen, phosphorus and potassium); seven heavy metals: Manganese (Mn), Copper (Cu), Zinc (Zn), Lead (Pb), Arsenic (As), Chromium (Cr) and Cadmium (Cd). 16 priority PAHs: naphthalene (Nap), Acenaphthylene (Acy), Acenaphthene (Ace), Fluorene (Flu), Phenanthrene (Phe), Anthracene (Ant), Fluoranthene (Flt), Pyrene (Pyr), Benz[a]anthracene (BaA), Chrysene (Chr), Benzo[b]fluoranthene (BbF), Benzo[k]fluoranthene (BkF), Benzo[a]pyrene (BaP), Dibenz[a,h]anthracene (DBA), indeno[1,2,3-cd]pyrene (InP) and Benzo[ghi]perylene (BgP).
Data was analysed using Microsoft Excel and SPSS Statistics. Descriptive statistics comprised minimum, maximum, mean, standard deviation, and coefficient of variation.
3Results and discussion
3.1Physicochemical properties of soil
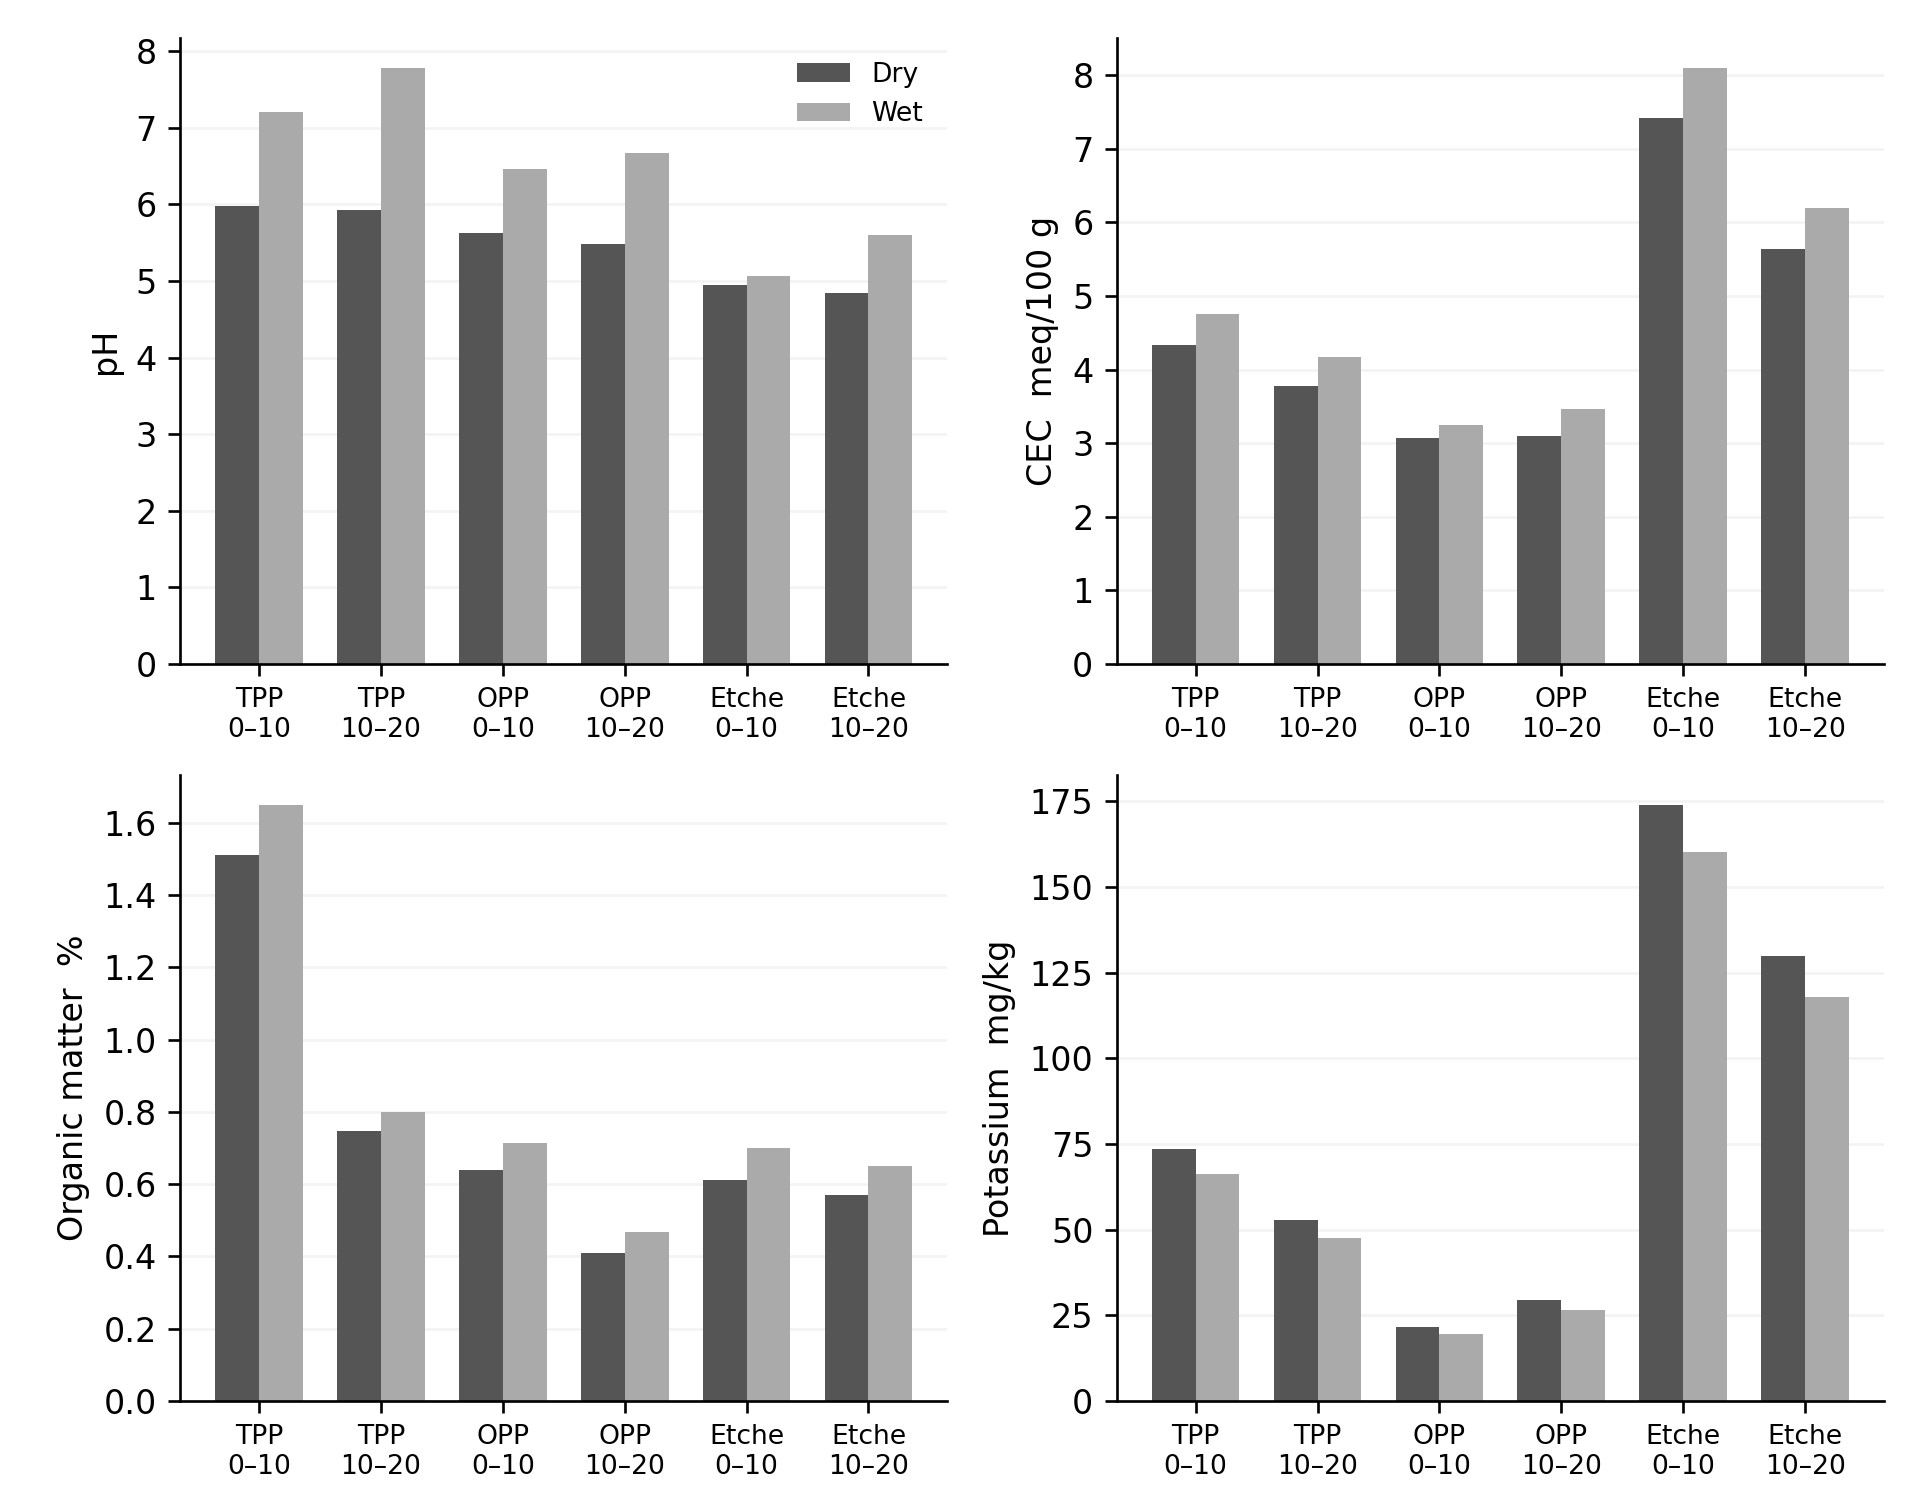
Wet-season mean pH was higher than dry-season mean pH at every site and depth (Table 1; Figure 1). Trans-Amadi surface (0–10 cm) pH increased from 5.980 to 7.203, while subsurface (10–20 cm) pH increased from 5.927 to 7.783. Omoku surface pH increased from 5.623 to 6.467 and subsurface pH from 5.483 to 6.673. The Etche comparison soil remained acidic, increasing from 4.943 to 5.070 at 0–10 cm and from 4.840 to 5.600 at 10–20 cm. These observations show a shift towards less acidic conditions during the sampled wet period. Subsurface pH exceeded surface pH in the wet season at all three sites, whereas the dry-season depth pattern differed. The measurements do not isolate rainfall as the cause of either pattern.
CEC increased in both layers at all three sites. The increases were approximately 9.6% and 10.4% at Trans-Amadi, 5.8% and 12.2% at Omoku, and 9.3% and 10.0% at Etche, for surface and subsurface soils, respectively. Etche had the highest absolute CEC values in both seasons, despite having lower pooled concentrations of most measured contaminants. The higher wet-season CEC values indicate a seasonal association with exchange properties, but do not isolate moisture availability as the cause.
The concurrent increases in pH and CEC are compatible with the importance of variable-charge surfaces. The soil-property explanations indicate modest spatial variation in pH and generally lower CEC at L1 than at L2 or L3 around the industrial sites. At Trans-Amadi, the greatest pH values were described at L2 or L3 depending on season; Omoku’s wet-season maximum was described at L3. These observations support site-specific spatial structure but do not establish a common linear relationship between pH and distance. Measurements on highly weathered tropical soils and minerals demonstrate that surface-charge behaviour depends on pH and the method used to characterise it (Appel et al., 2003). This provides a mechanistic context, but the present seasonal association does not demonstrate that rainfall directly increased exchange capacity.
TOM also increased at every site–depth combination. Surface TOM increased from 1.510% to 1.650% at Trans-Amadi, 0.640% to 0.713% at Omoku, and 0.610% to 0.700% at Etche. Subsurface changes were 0.747% to 0.800%, 0.410% to 0.467%, and 0.570% to 0.650%, respectively.
| Property | Site | Dry 0–10 | Wet 0–10 | Δ 0–10 | Dry 10–20 | Wet 10–20 | Δ 10–20 |
|---|---|---|---|---|---|---|---|
| pH | TPP | 5.980 | 7.203 | 1.223 | 5.927 | 7.783 | 1.856 |
| pH | OPP | 5.623 | 6.467 | 0.844 | 5.483 | 6.673 | 1.190 |
| pH | Etche | 4.943 | 5.070 | 0.127 | 4.840 | 5.600 | 0.760 |
| CEC | TPP | 4.333 | 4.750 | 0.417 | 3.773 | 4.167 | 0.394 |
| CEC | OPP | 3.073 | 3.250 | 0.177 | 3.090 | 3.467 | 0.377 |
| CEC | Etche | 7.413 | 8.100 | 0.687 | 5.637 | 6.200 | 0.563 |
| TOM % | TPP | 1.510 | 1.650 | 0.140 | 0.747 | 0.800 | 0.053 |
| TOM % | OPP | 0.640 | 0.713 | 0.073 | 0.410 | 0.467 | 0.057 |
| TOM % | Etche | 0.610 | 0.700 | 0.090 | 0.570 | 0.650 | 0.080 |
| K mg/kg | TPP | 73.500 | 66.133 | -7.367 | 52.933 | 47.667 | -5.266 |
| K mg/kg | OPP | 21.667 | 19.500 | -2.167 | 29.300 | 26.400 | -2.900 |
| K mg/kg | Etche | 174.000 | 160.333 | -13.667 | 130.000 | 118.000 | -12.000 |
| N mg/kg | TPP | 70.300 | 72.000 | 1.700 | 50.967 | 53.333 | 2.366 |
| N mg/kg | OPP | 19.400 | 22.767 | 3.367 | 25.700 | 26.667 | 0.967 |
| N mg/kg | Etche | 156.667 | 165.333 | 8.666 | 122.000 | 135.000 | 13.000 |
| P mg/kg | TPP | 41.067 | 34.000 | -7.067 | 27.900 | 24.000 | -3.900 |
| P mg/kg | OPP | 13.633 | 10.000 | -3.633 | 18.750 | 14.500 | -4.250 |
| P mg/kg | Etche | 134.000 | 110.000 | -24.000 | 108.000 | 90.000 | -18.000 |
TPP = Trans-Amadi; OPP = Omoku; Etche = comparison site. Dry and wet values are reported means. Δ = wet minus dry. Soil depths are in cm. CEC is expressed in meq/100 g.
3.2Soil nutrients and texture
Potassium decreased during the wet season at every site and depth, by approximately 7.9–10.0%. Phosphorus also decreased throughout, with changes ranging from −14.0% to −26.6%. Nitrogen increased at all site–depth combinations, although the increases differed in magnitude. At Omoku surface soil, nitrogen increased from 19.400 to 22.767 mg/kg; Trans-Amadi surface soil changed from 70.300 to 72.000 mg/kg. The nutrient results therefore reveal different seasonal responses within the same soil layer.
The different nutrient responses are plausible because rewetting does not affect all nutrient pools identically. Birch (1958) demonstrated a decomposition response when dry soils were moistened; later experiments showed that carbon and phosphorus pulses can respond differently to repeated drying and rewetting (Butterly et al., 2009). Turner and Haygarth (2001) observed an increase in water-soluble phosphorus following rewetting, which contrasts with the lower reported wet-season phosphorus concentrations here. Their experimental endpoint and short-term rewetting treatment differ from seasonal field measurements, so the studies support process complexity rather than an expected universal direction of change.
Sand remained the dominant measured particle fraction, but the seasonal texture changes were small or inconsistent across sites. At Trans-Amadi, mean surface clay decreased from 3.397% to 3.063%, and subsurface clay decreased from 5.247% to 4.787%. At Omoku, subsurface clay increased from 2.830% to 5.123%, while surface clay changed little. At Etche, clay increased in both layers.
3.3Metals in soils and plant tissues
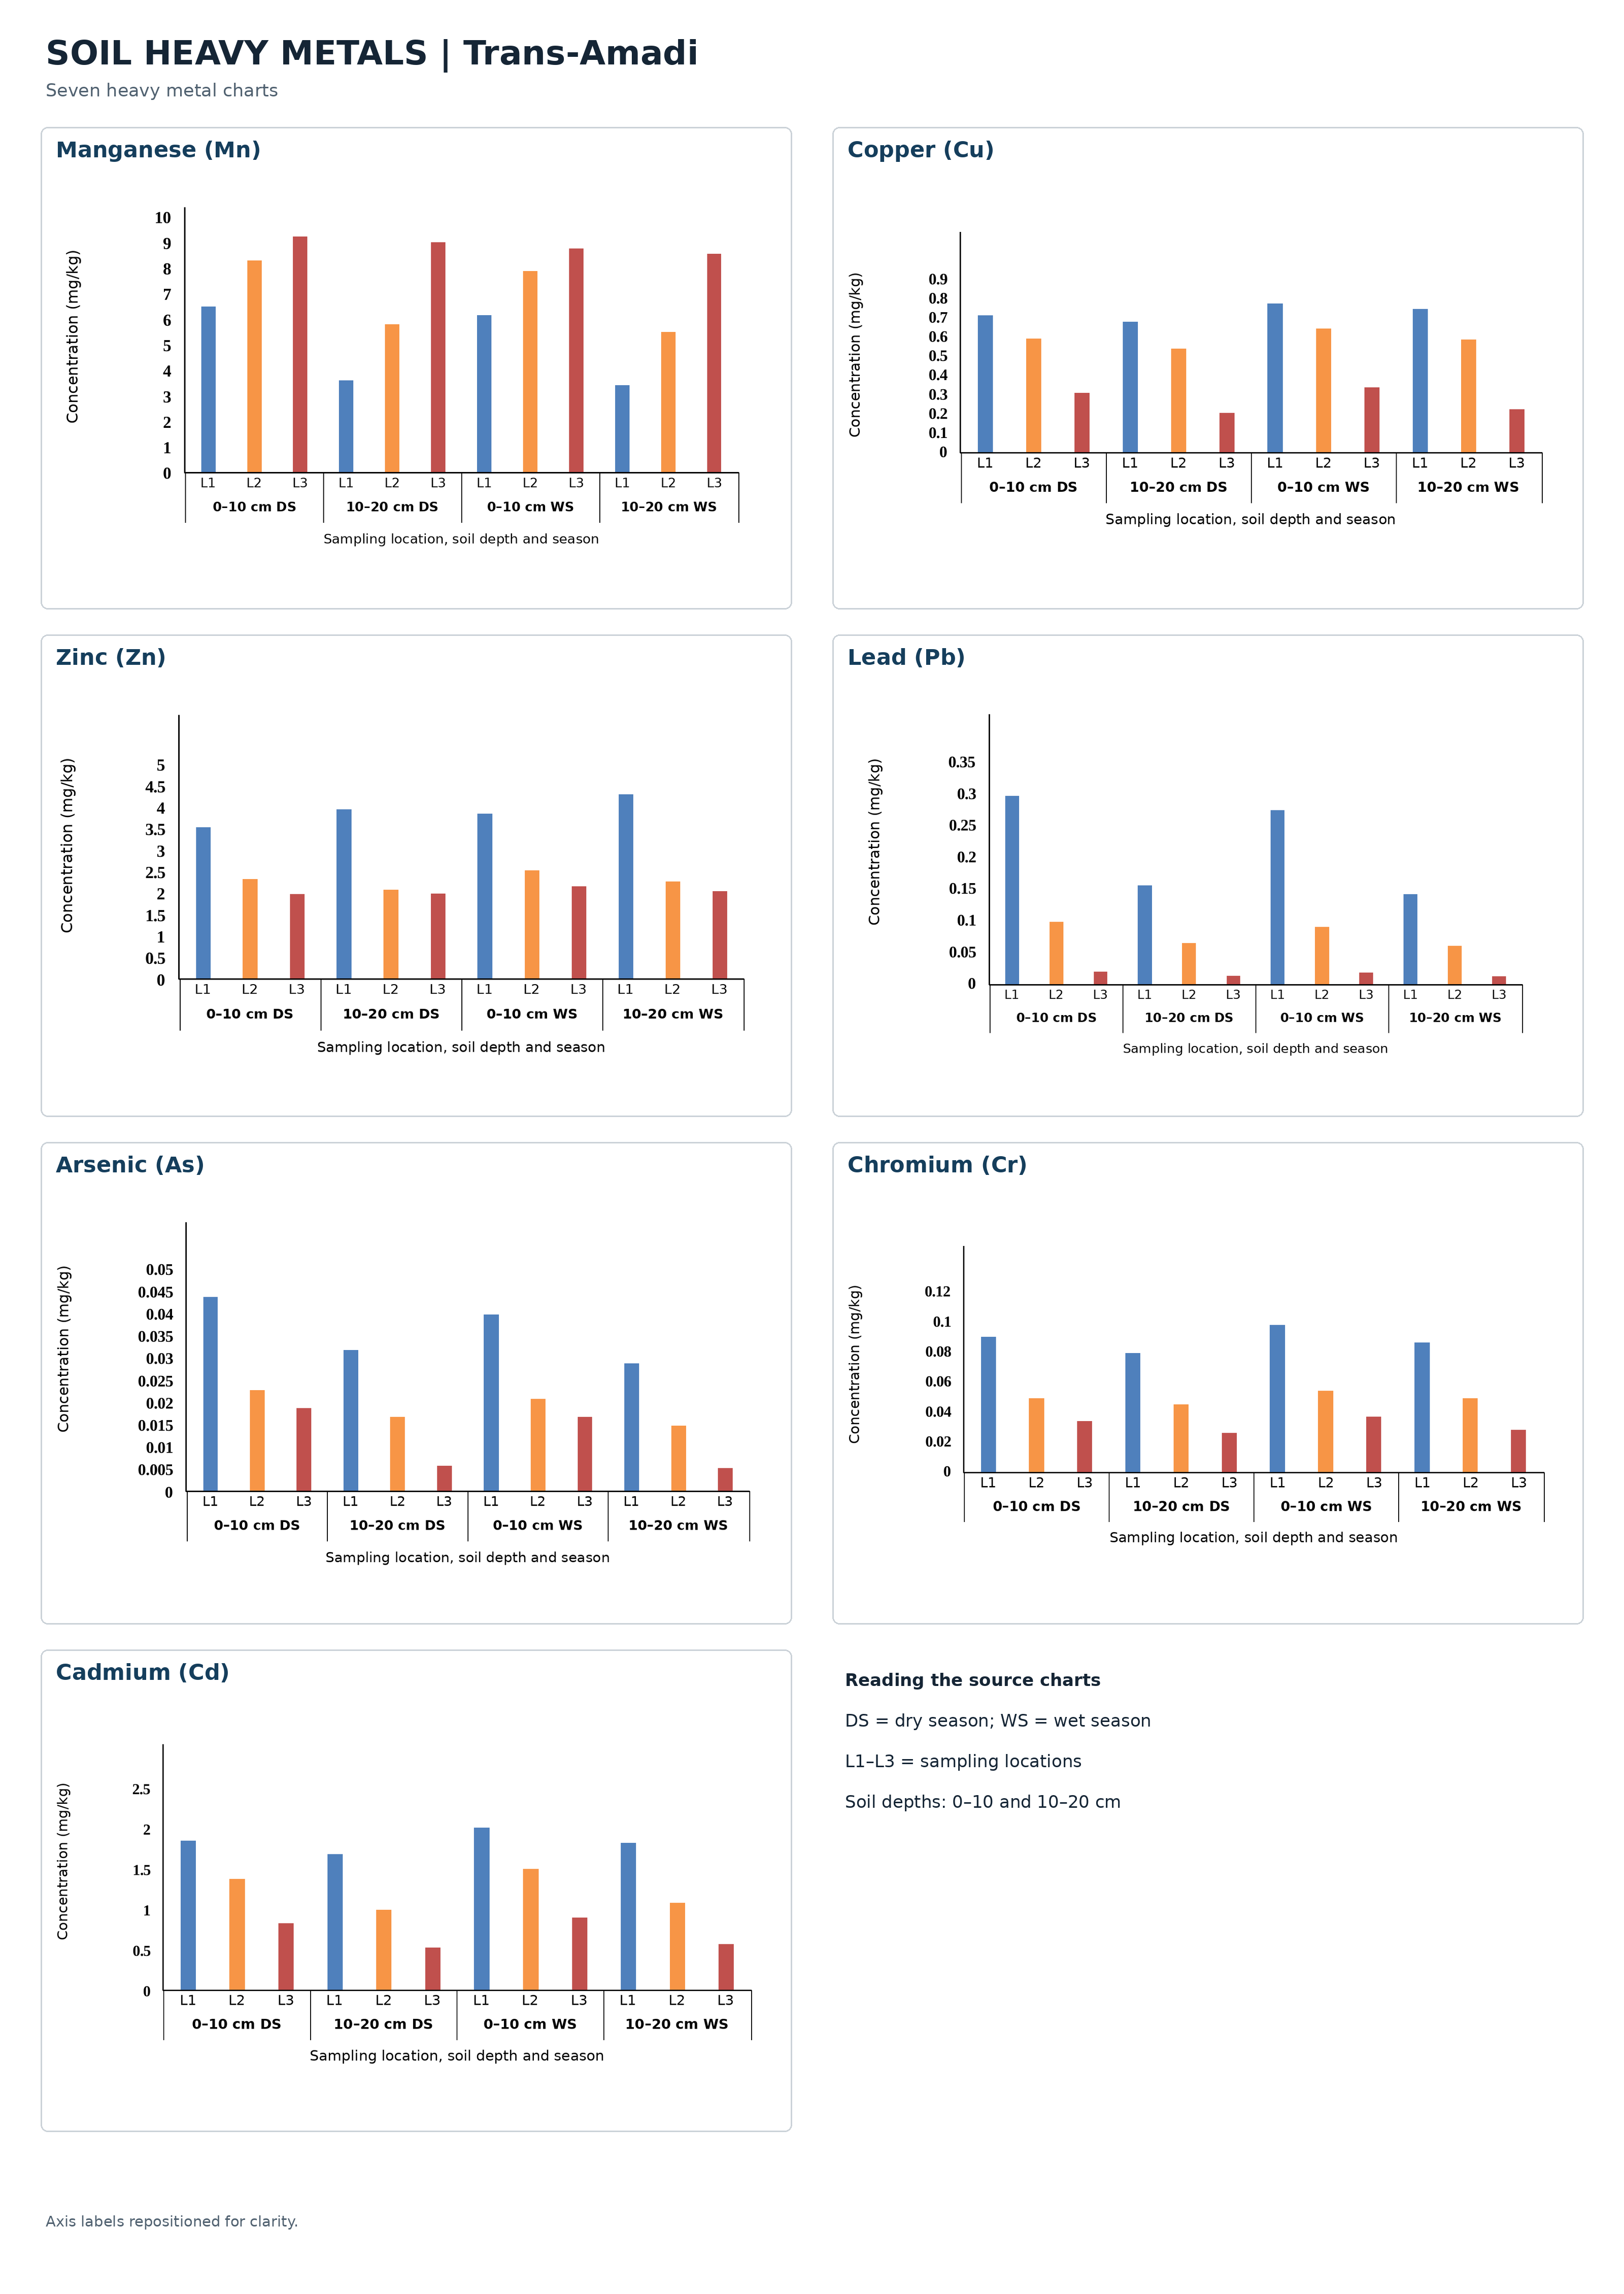
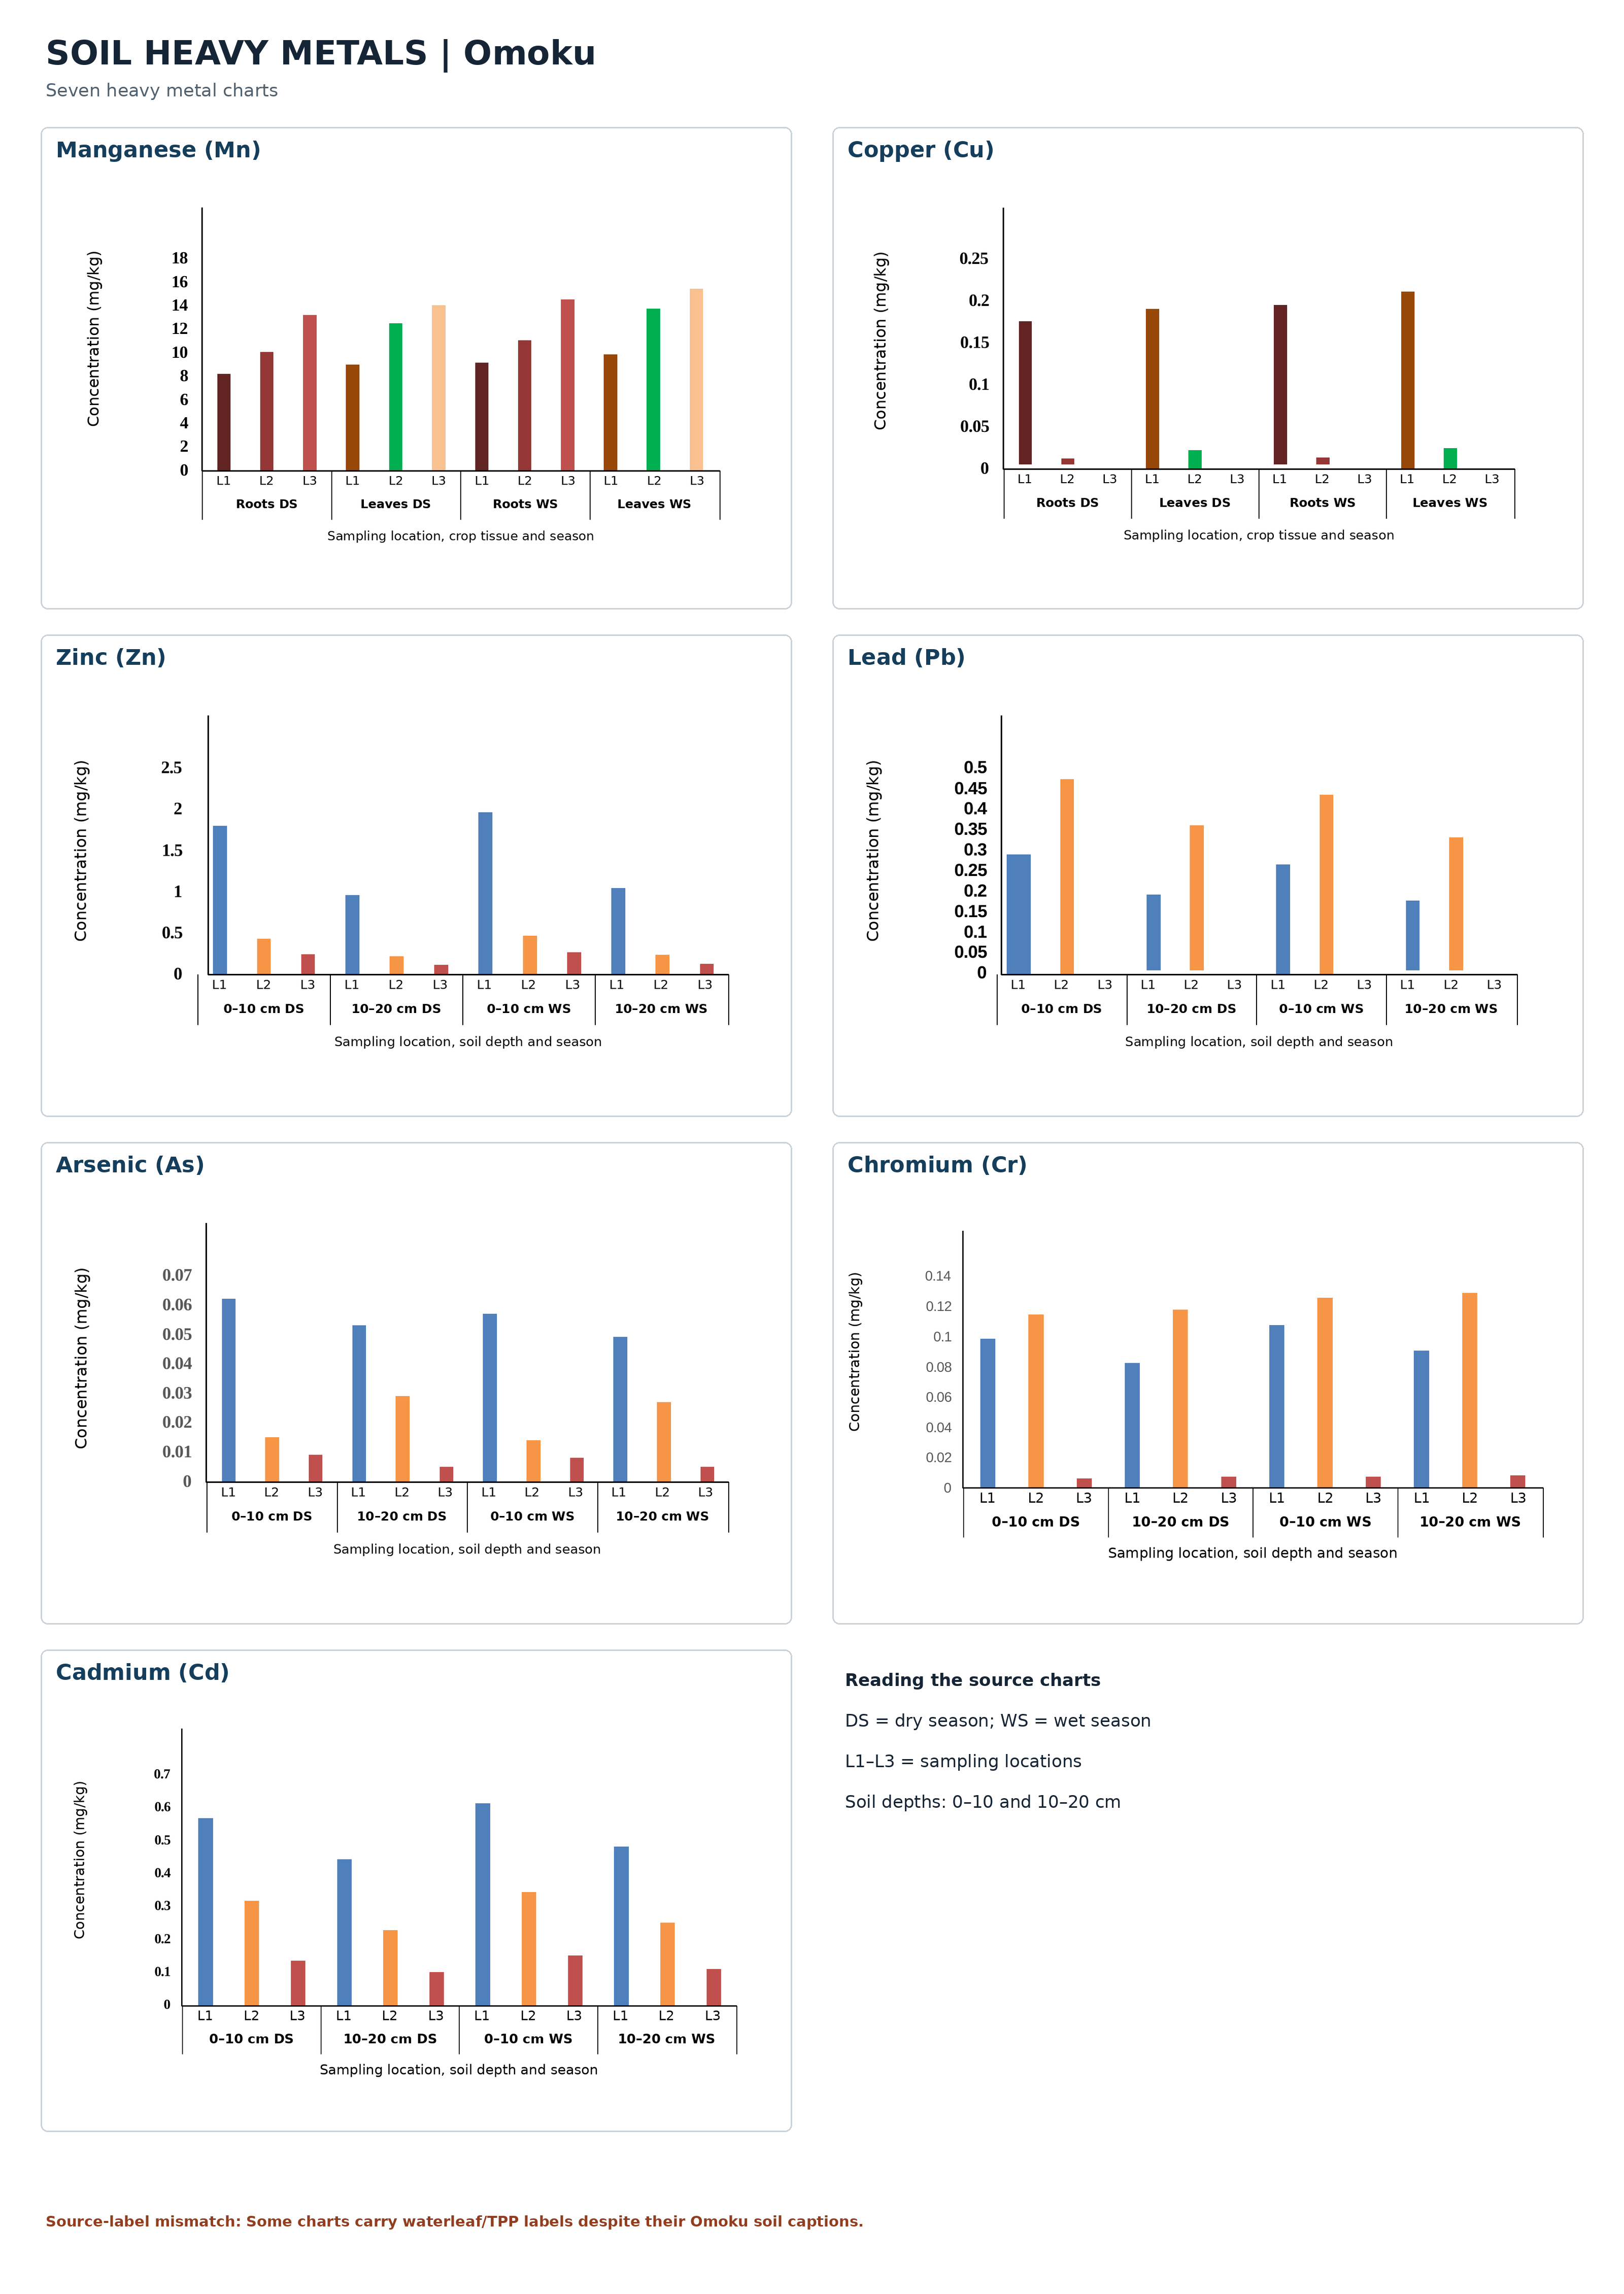
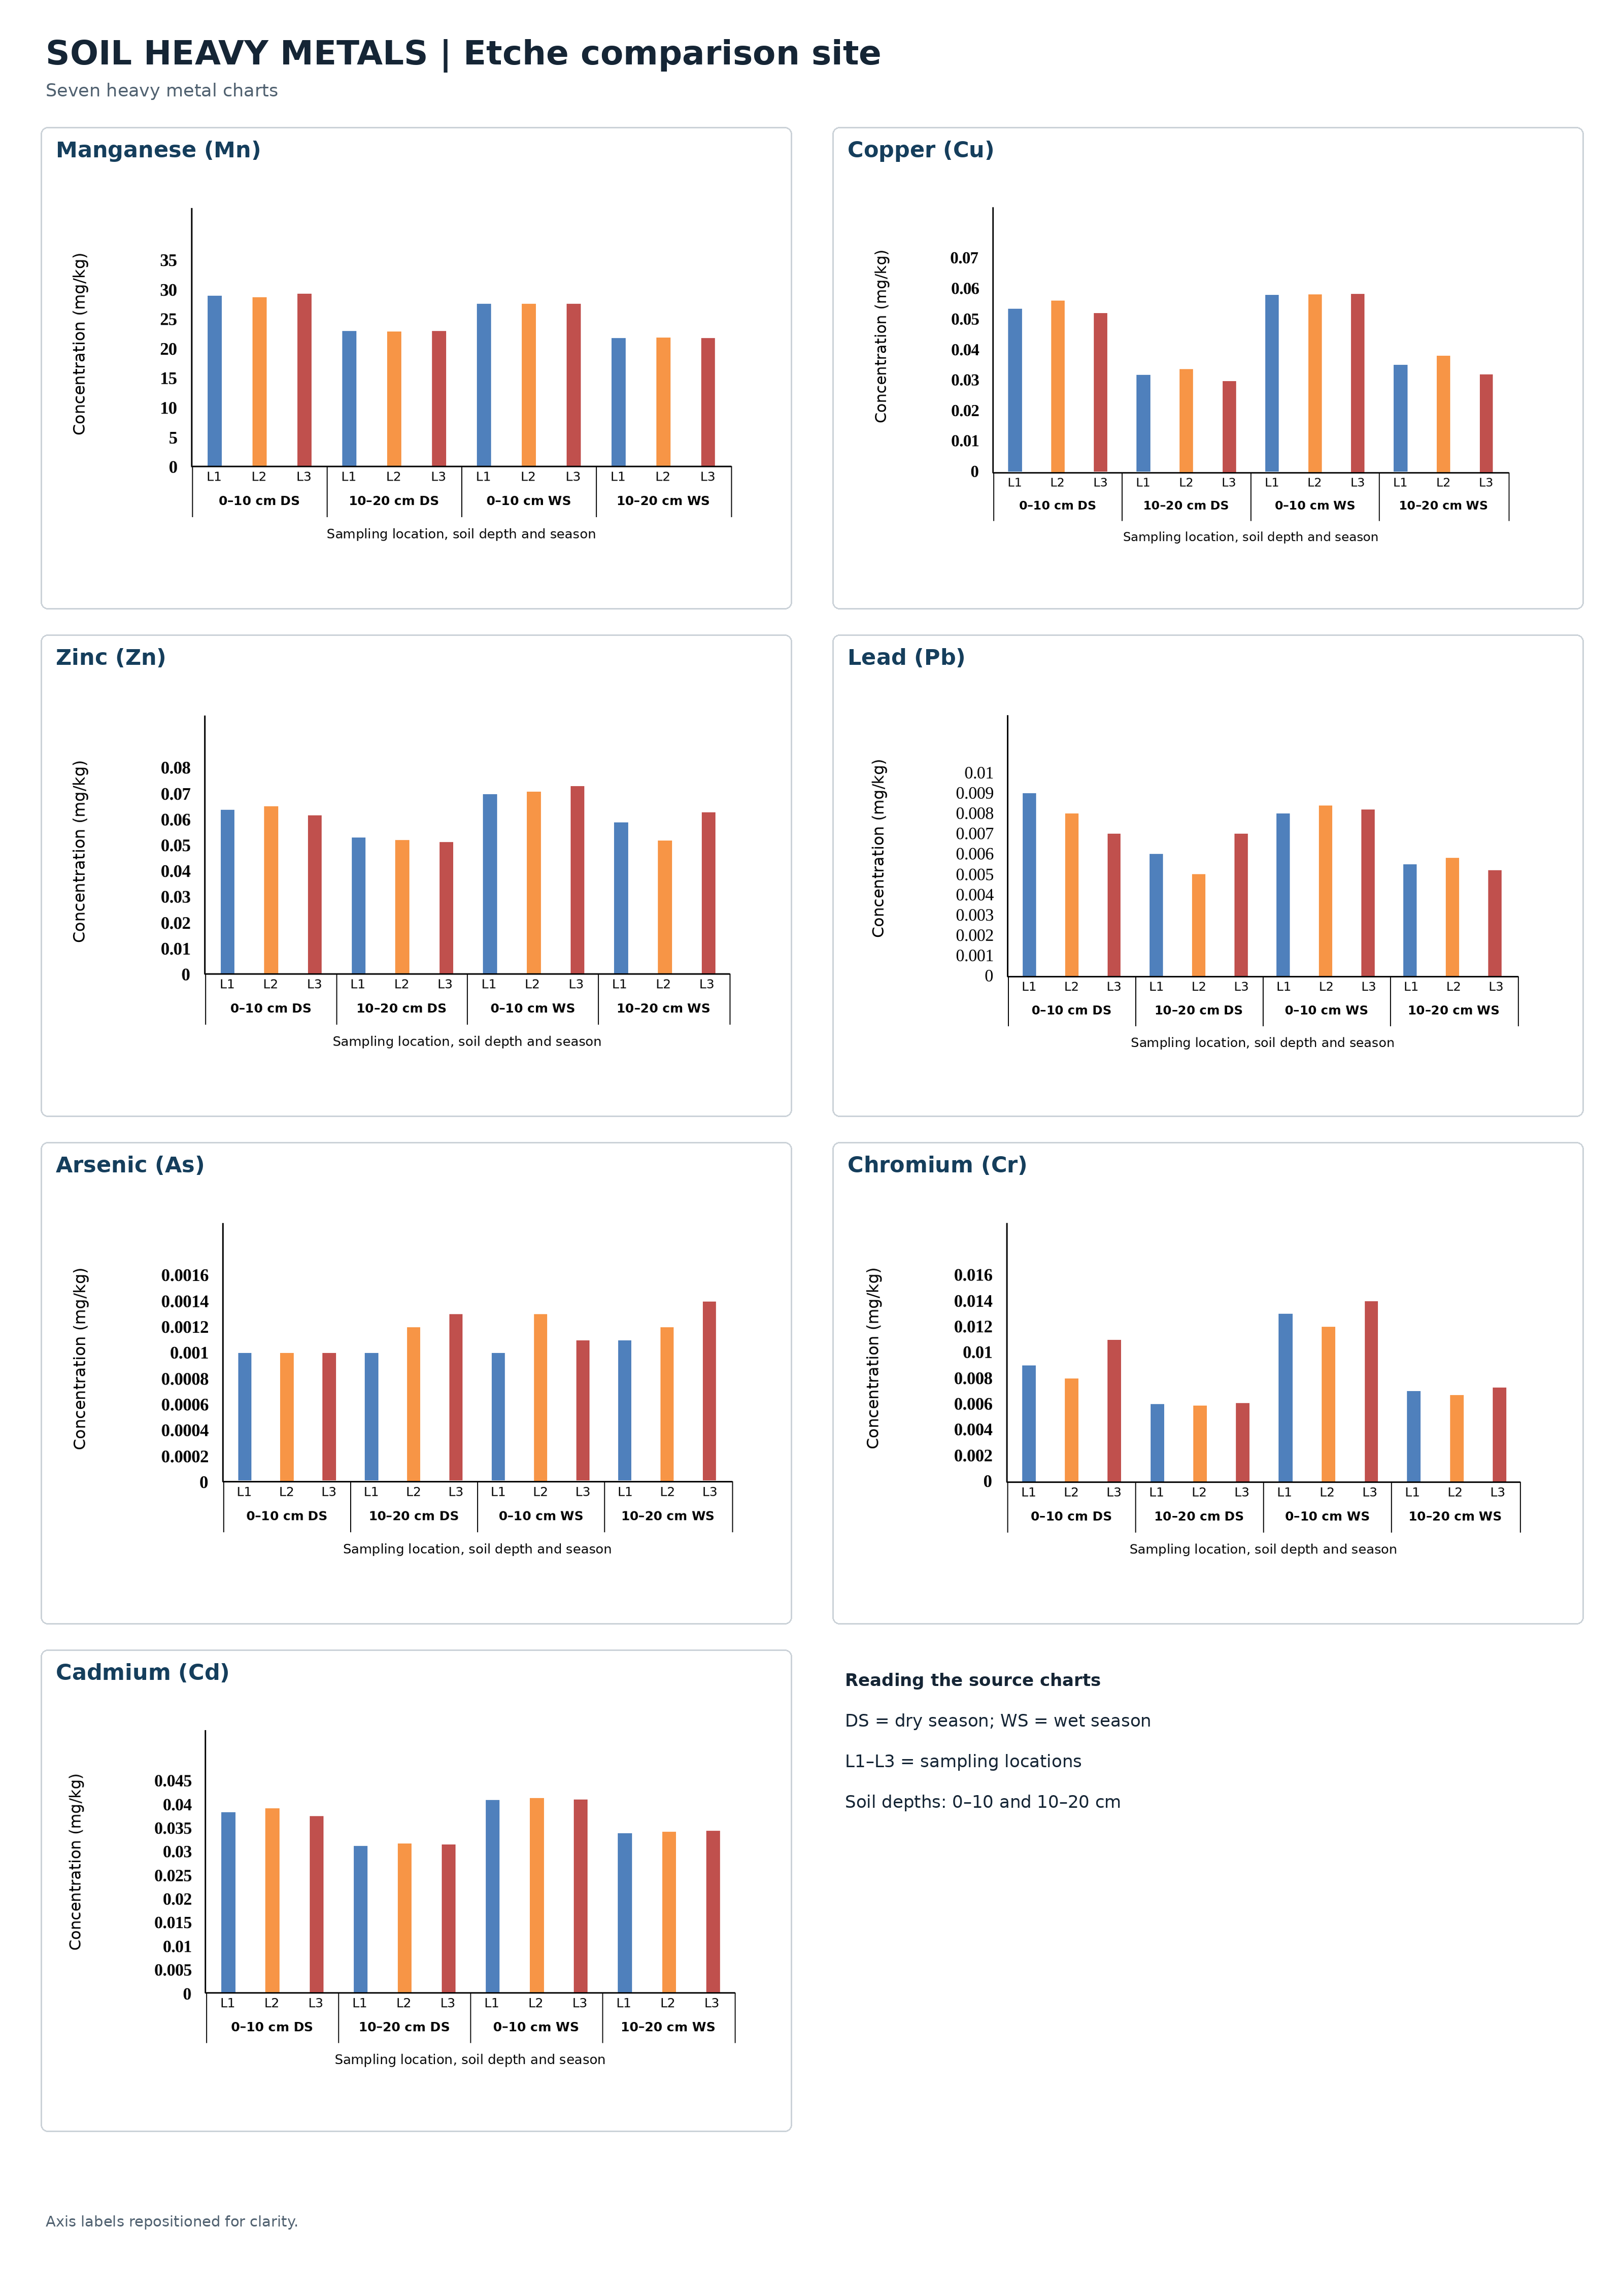
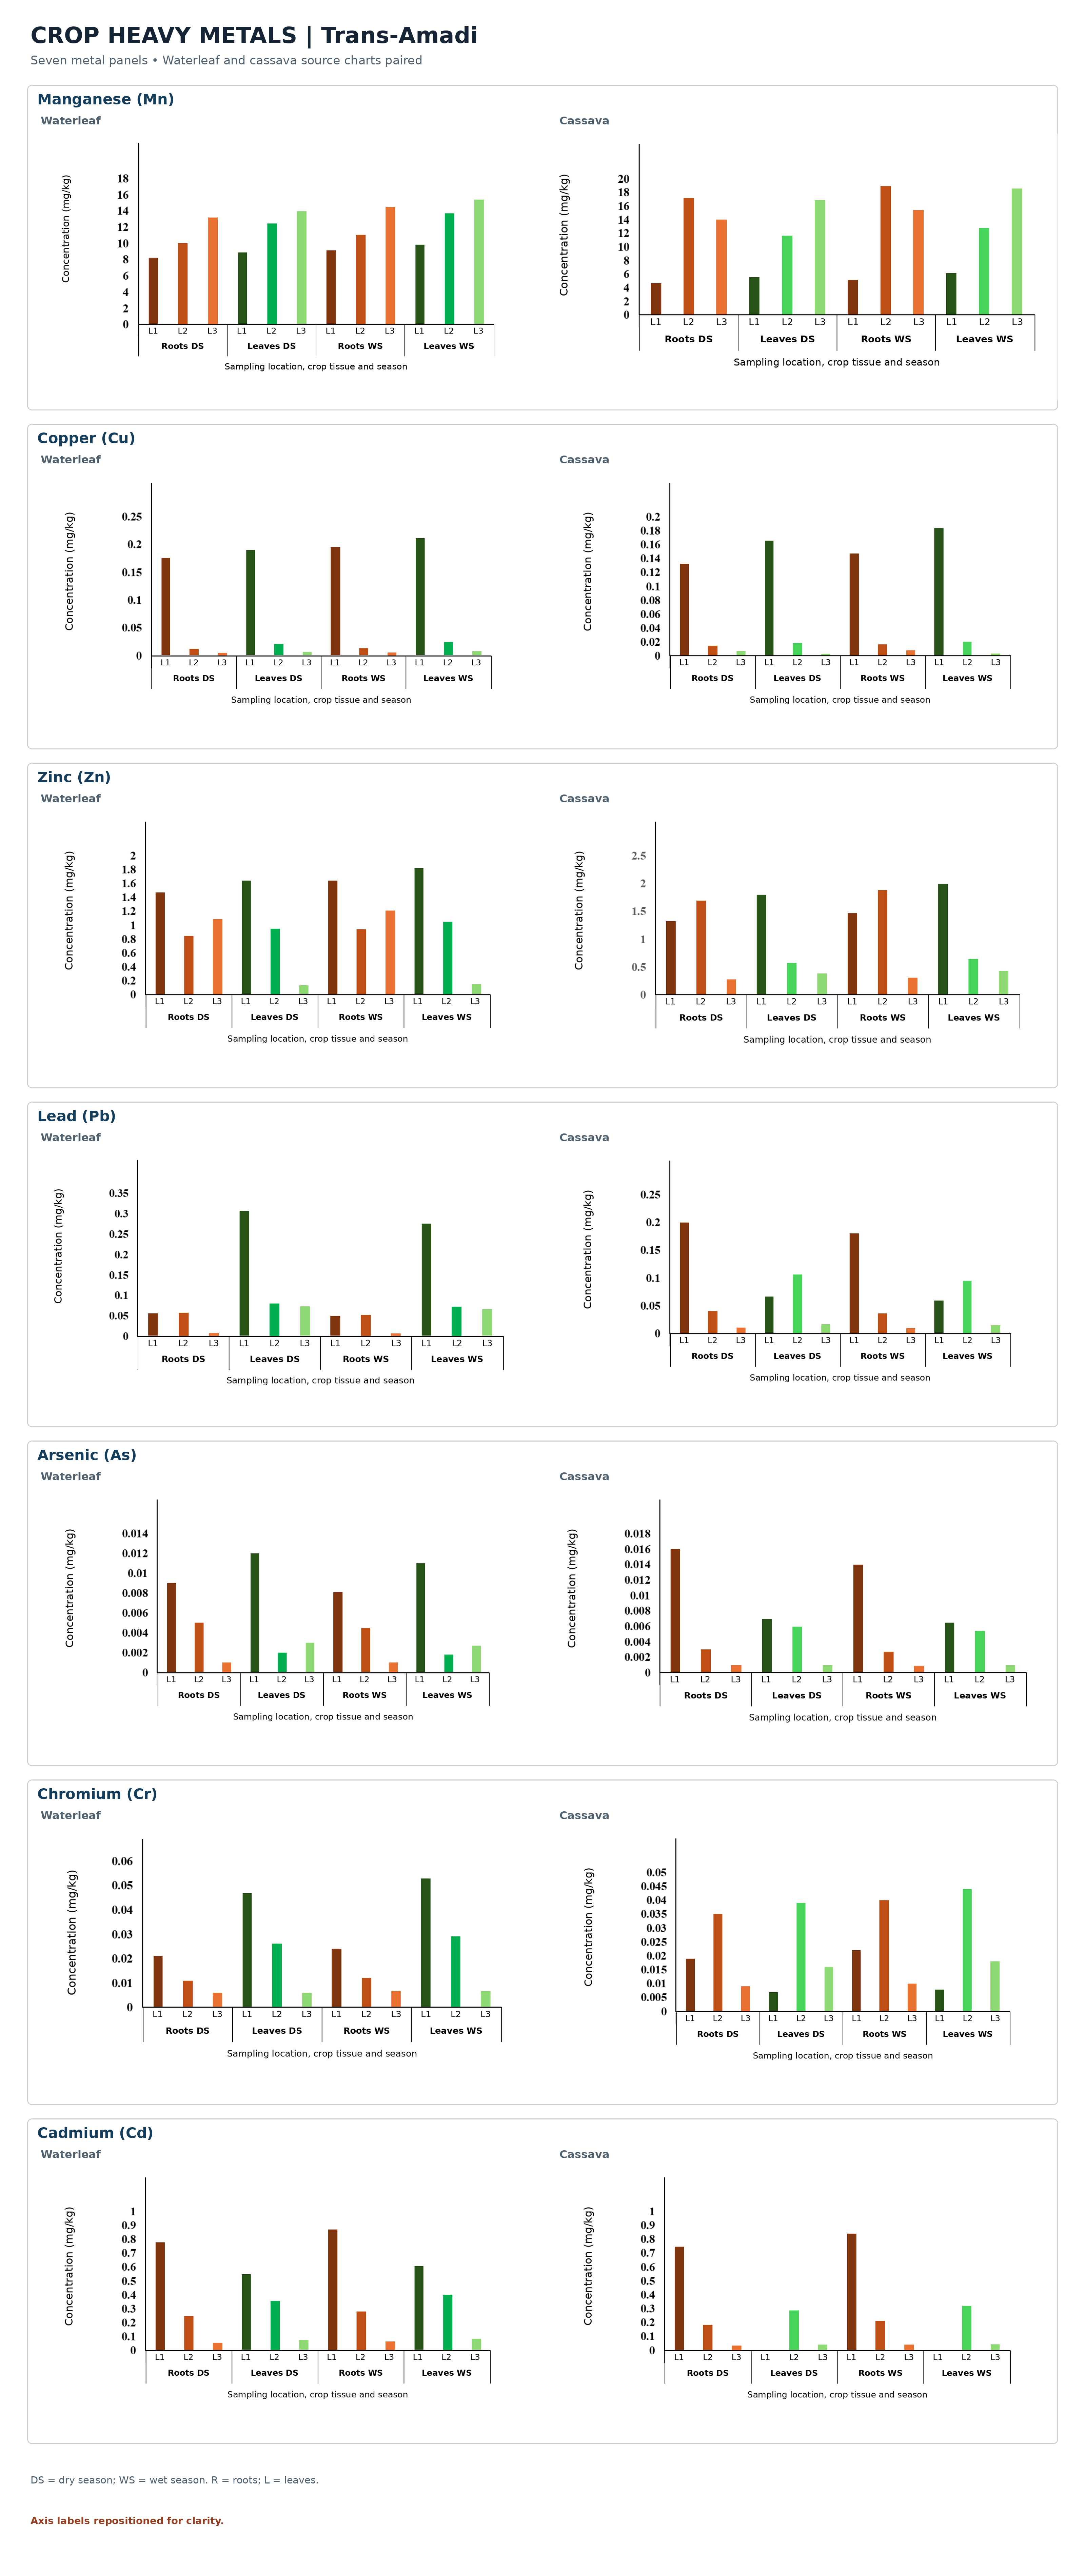
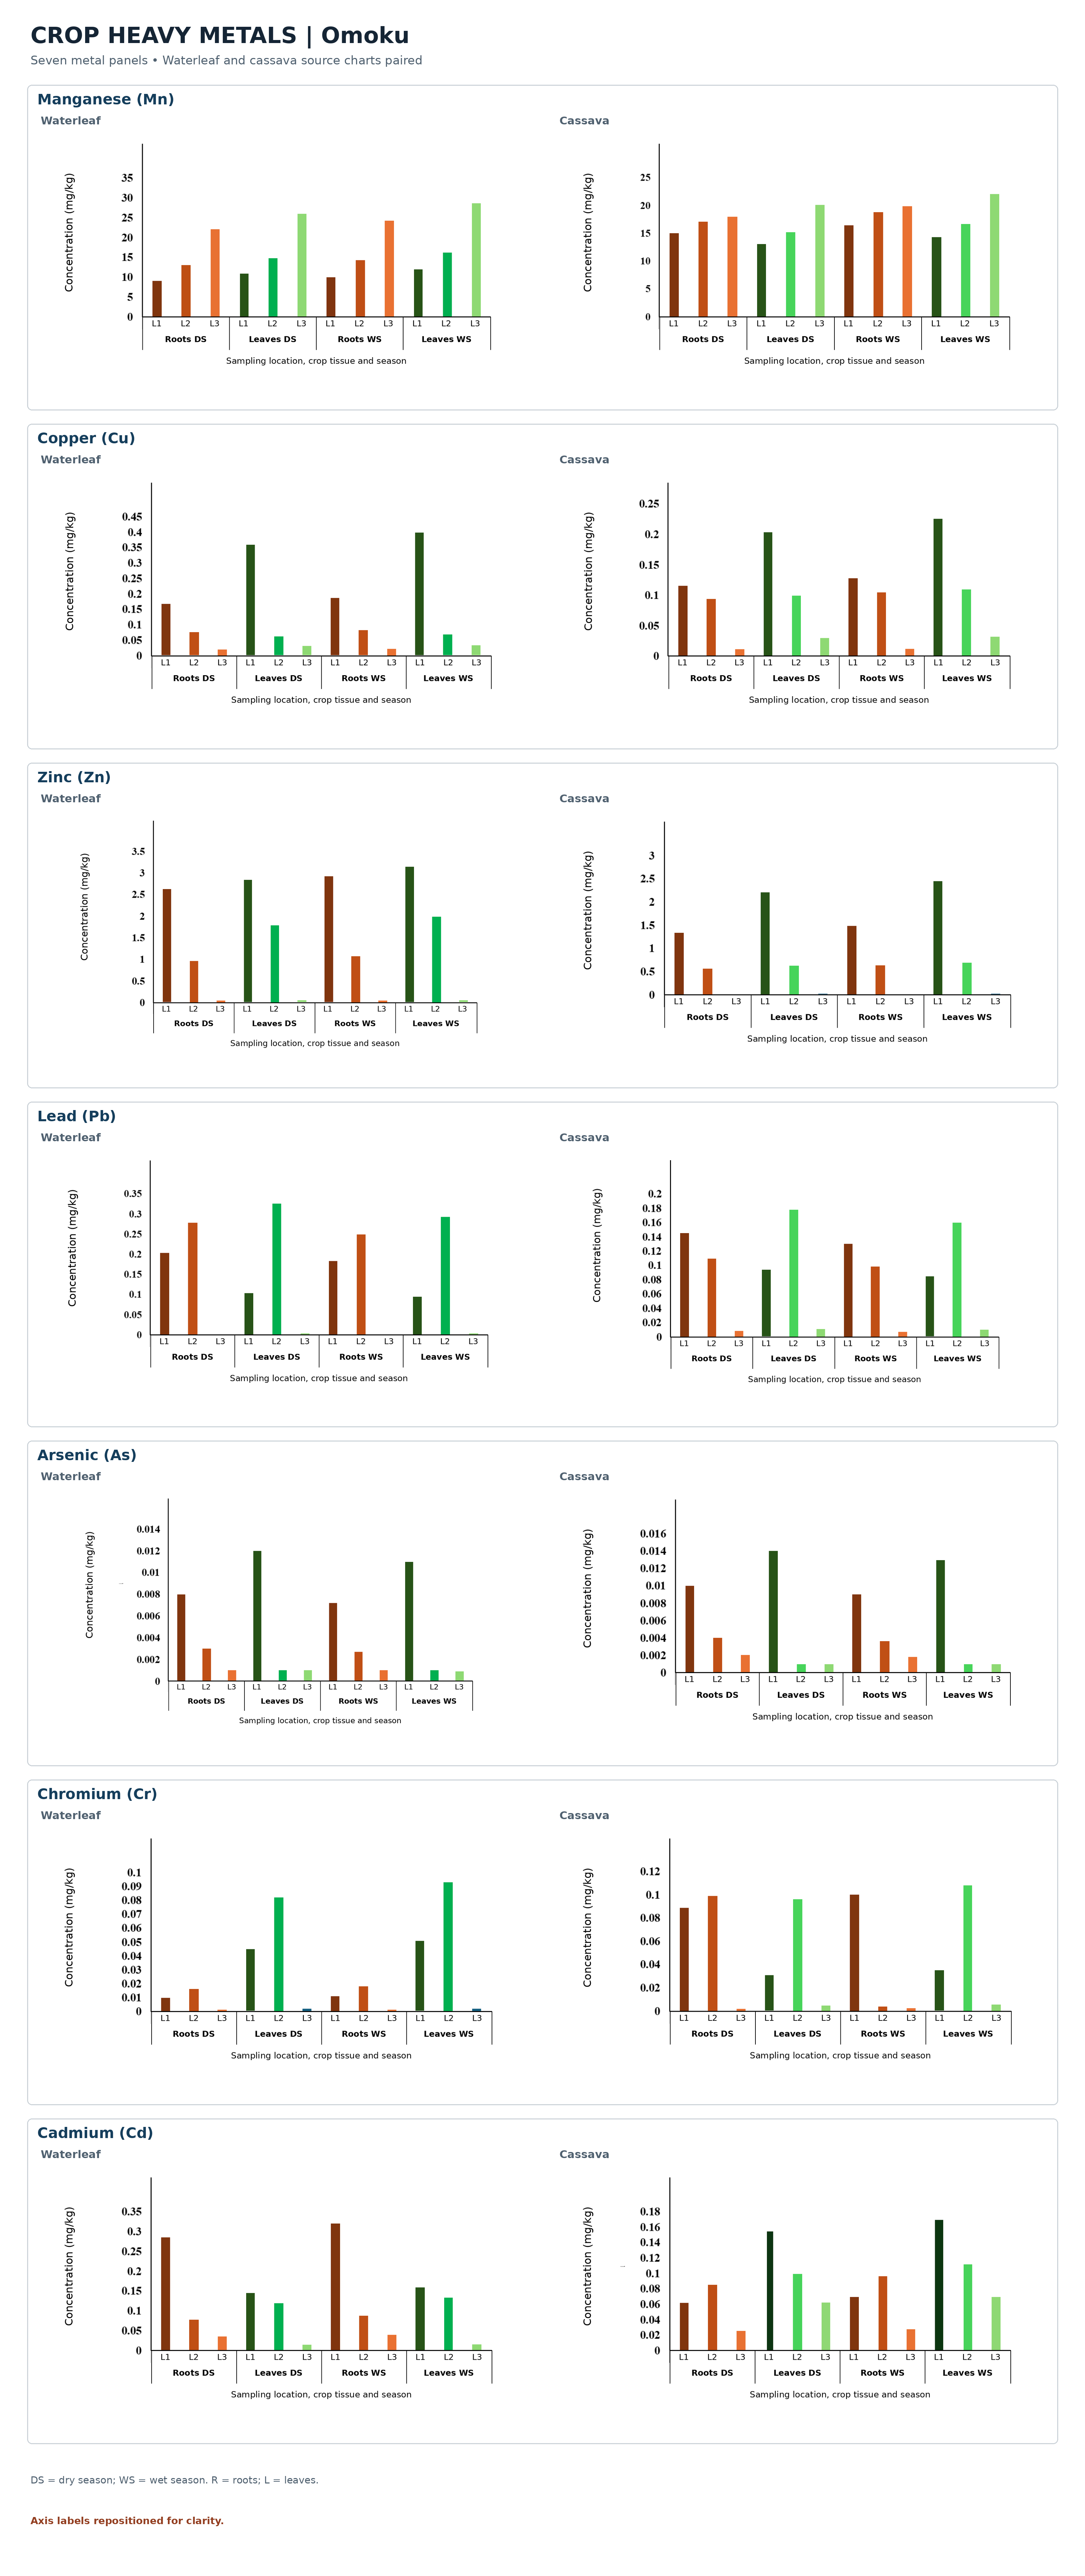
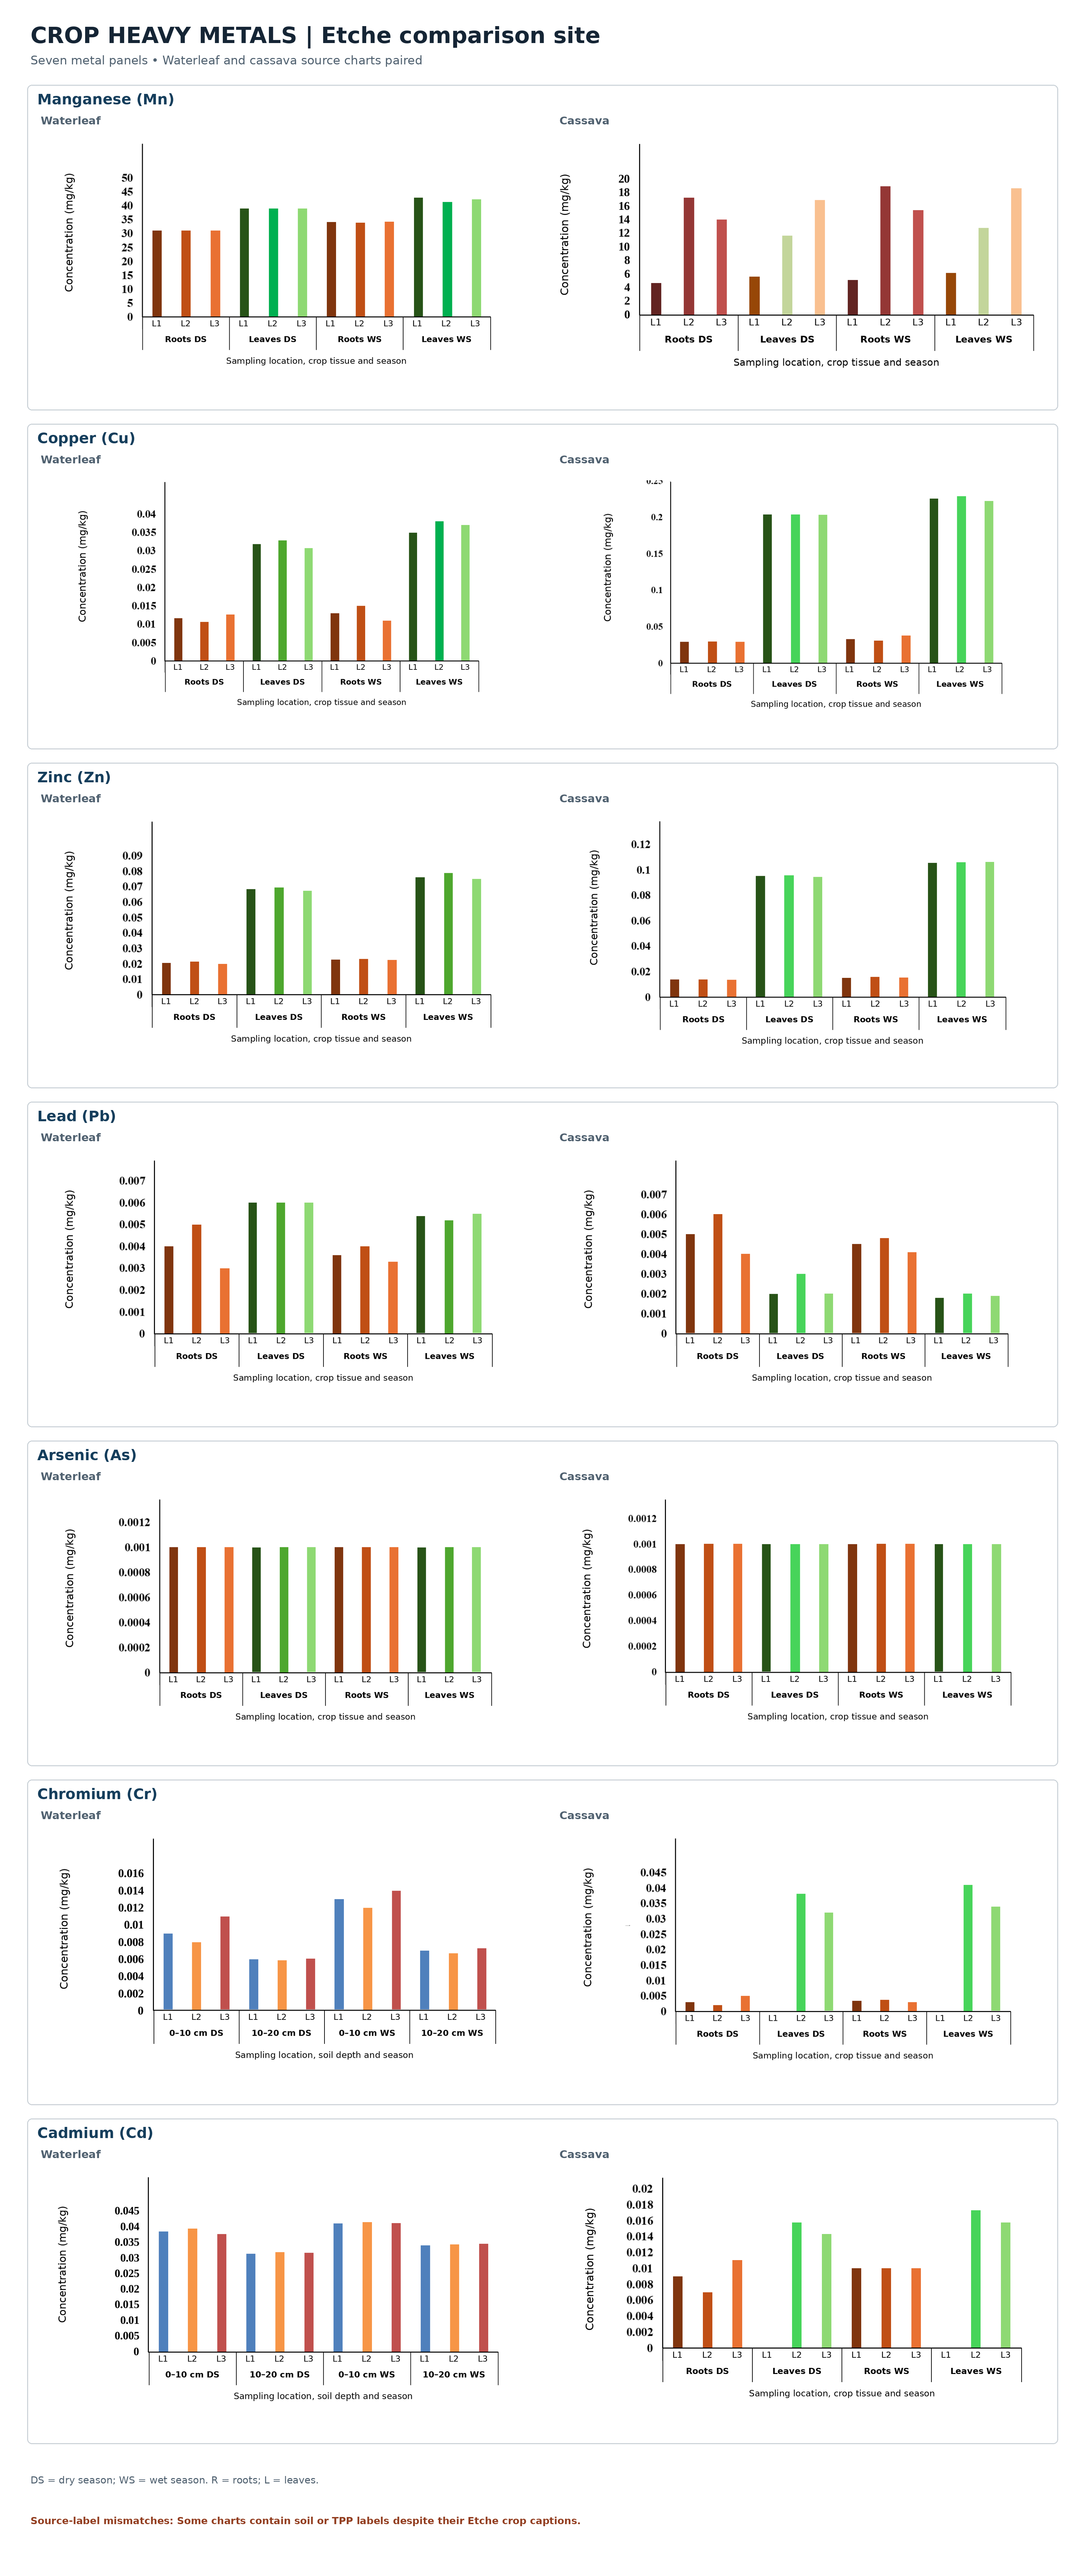
Pooled soil concentrations differed strongly among sites (Figure 6, Figure 7 and Figure 8). Trans-Amadi had the highest means for Cu, Zn, and Cd, whereas Omoku had the highest means for Pb, As, and Cr. Etche had the highest Mn mean, 25.458 mg/kg, compared with 15.152 mg/kg at Omoku and 6.941 mg/kg at Trans-Amadi.
The waterleaf and cassava results similarly describe greater wet-season metal burdens and tissue-specific variation, with concentrations decreasing with distance, except manganese.
Studies of tropical vegetables demonstrate that crop type and soil conditions affect metal uptake, making a single generic vegetable transfer factor unreliable (Nabulo et al., 2010; Nabulo et al., 2011). Research on garden-grown vegetables also found that particulate contamination and soil characteristics complicate relationships between soil and crop metal concentrations (McBride et al., 2014).
Generally higher soil metal concentrations were observed in the wet season, higher surface than subsurface concentrations, and declining concentrations with distance for most metals at the power-plant sites except Mn concentration which increased with distance. Crop examples provide a more qualified view of this tendency (Figure 9, Figure 10 and Figure 11). Cu in Trans-Amadi waterleaf roots and leaves declined across the three points in both plotted seasons. At Omoku, Cu in cassava roots and leaves also declined across the three points. However, Trans-Amadi waterleaf-root Zn fell from L1 to L2 and then increased at L3, whereas its leaf Zn decreased across the three points. A statement that all metals decrease monotonically with distance would not apply to plants. Table 4 summarises these spatial observations alongside the PAH patterns.
3.4Soil PAH burdens and seasonal profiles
The pooled mean soil Σ16PAHs was 17.480 mg/kg at Trans-Amadi, 18.546 mg/kg at Omoku, and 8.242 mg/kg at Etche (Table 2). Relative to Etche, the industrial-site means were approximately 2.12 and 2.25 times higher. The pooled mean Σ7CPAHs was 8.413 mg/kg at Trans-Amadi, 6.187 mg/kg at Omoku, and 3.346 mg/kg at Etche.
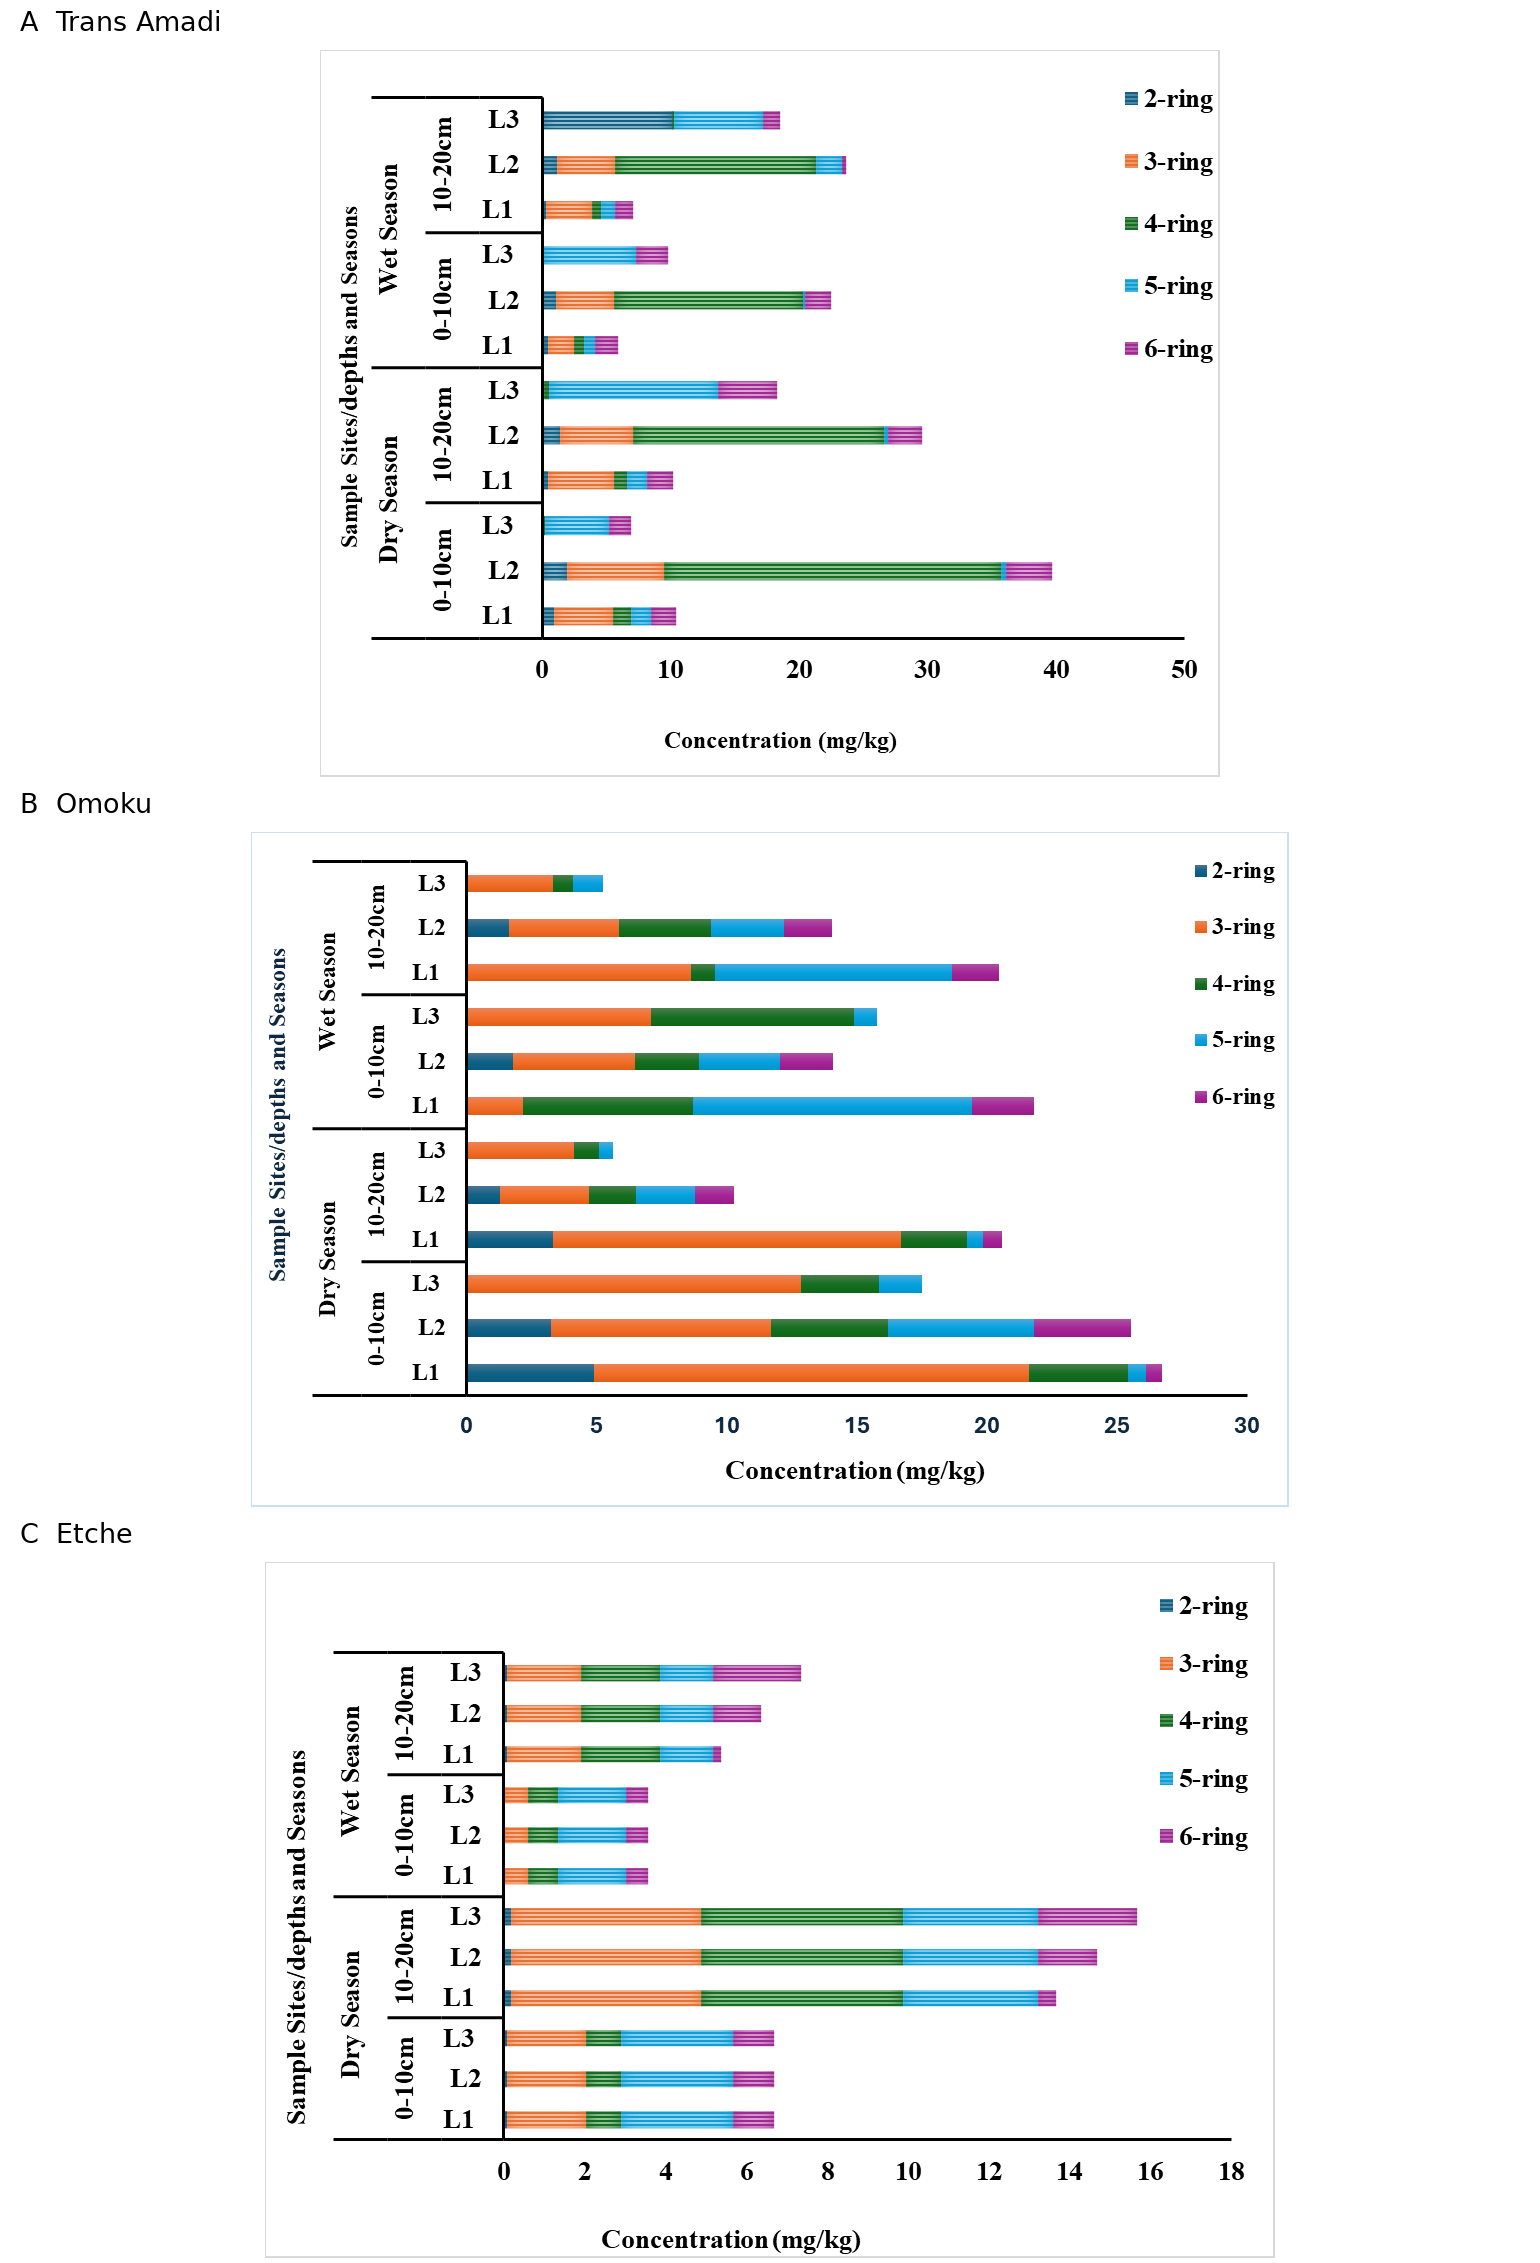
The original soil PAH plots show that the seasonal direction varies across locations and depths (Figure 2). At Trans-Amadi, the prominent surface-soil maximum at L2 is greater in the dry season than the wet season. Dry-season L1 total PAH values are also visually greater than their wet-season counterparts, while some L3 contrasts move in the opposite direction. At Omoku, the dry-season concentration total at L1 and L2 exceed the corresponding wet-season. At Etche, the dry-season total concentrations are greater than wet-season in both layers.
The ring profiles also vary within sites. At Trans-Amadi L2, a prominent four-ring contribution is visible, whereas five-ring material is more important in some L3 profiles. Omoku shows changes in the relative contribution of three-, four-, and five-ring groups between seasons. Their strongest seasonal implication is heterogeneity across the sampled locations.
PAH retention and vertical distribution also depend on the receiving soil. Similar studies showed background-soil measurements in Western Europe linked PAH distributions to atmospheric deposition and organic matter, while forest-soil profiles revealed differing depth distributions of PAHs (Krauss et al., 2000; Nam et al., 2008).
| Site | Σ16PAHs Mean ± SD | Σ16PAHs Range | Σ7CPAHs Mean ± SD |
|---|---|---|---|
| Trans-Amadi | 17.480 ± 22.109 | 0.919–67.033 | 8.413 ± 11.072 |
| Omoku | 18.546 ± 20.741 | 2.513–68.545 | 6.187 ± 7.602 |
| Etche | 8.242 ± 6.638 | 2.181–18.548 | 3.346 ± 2.327 |
Σ7CPAHs comprises BaA, Chr, BbF, BkF, BaP, DBA, and InP.
3.5PAHs in waterleaf and cassava
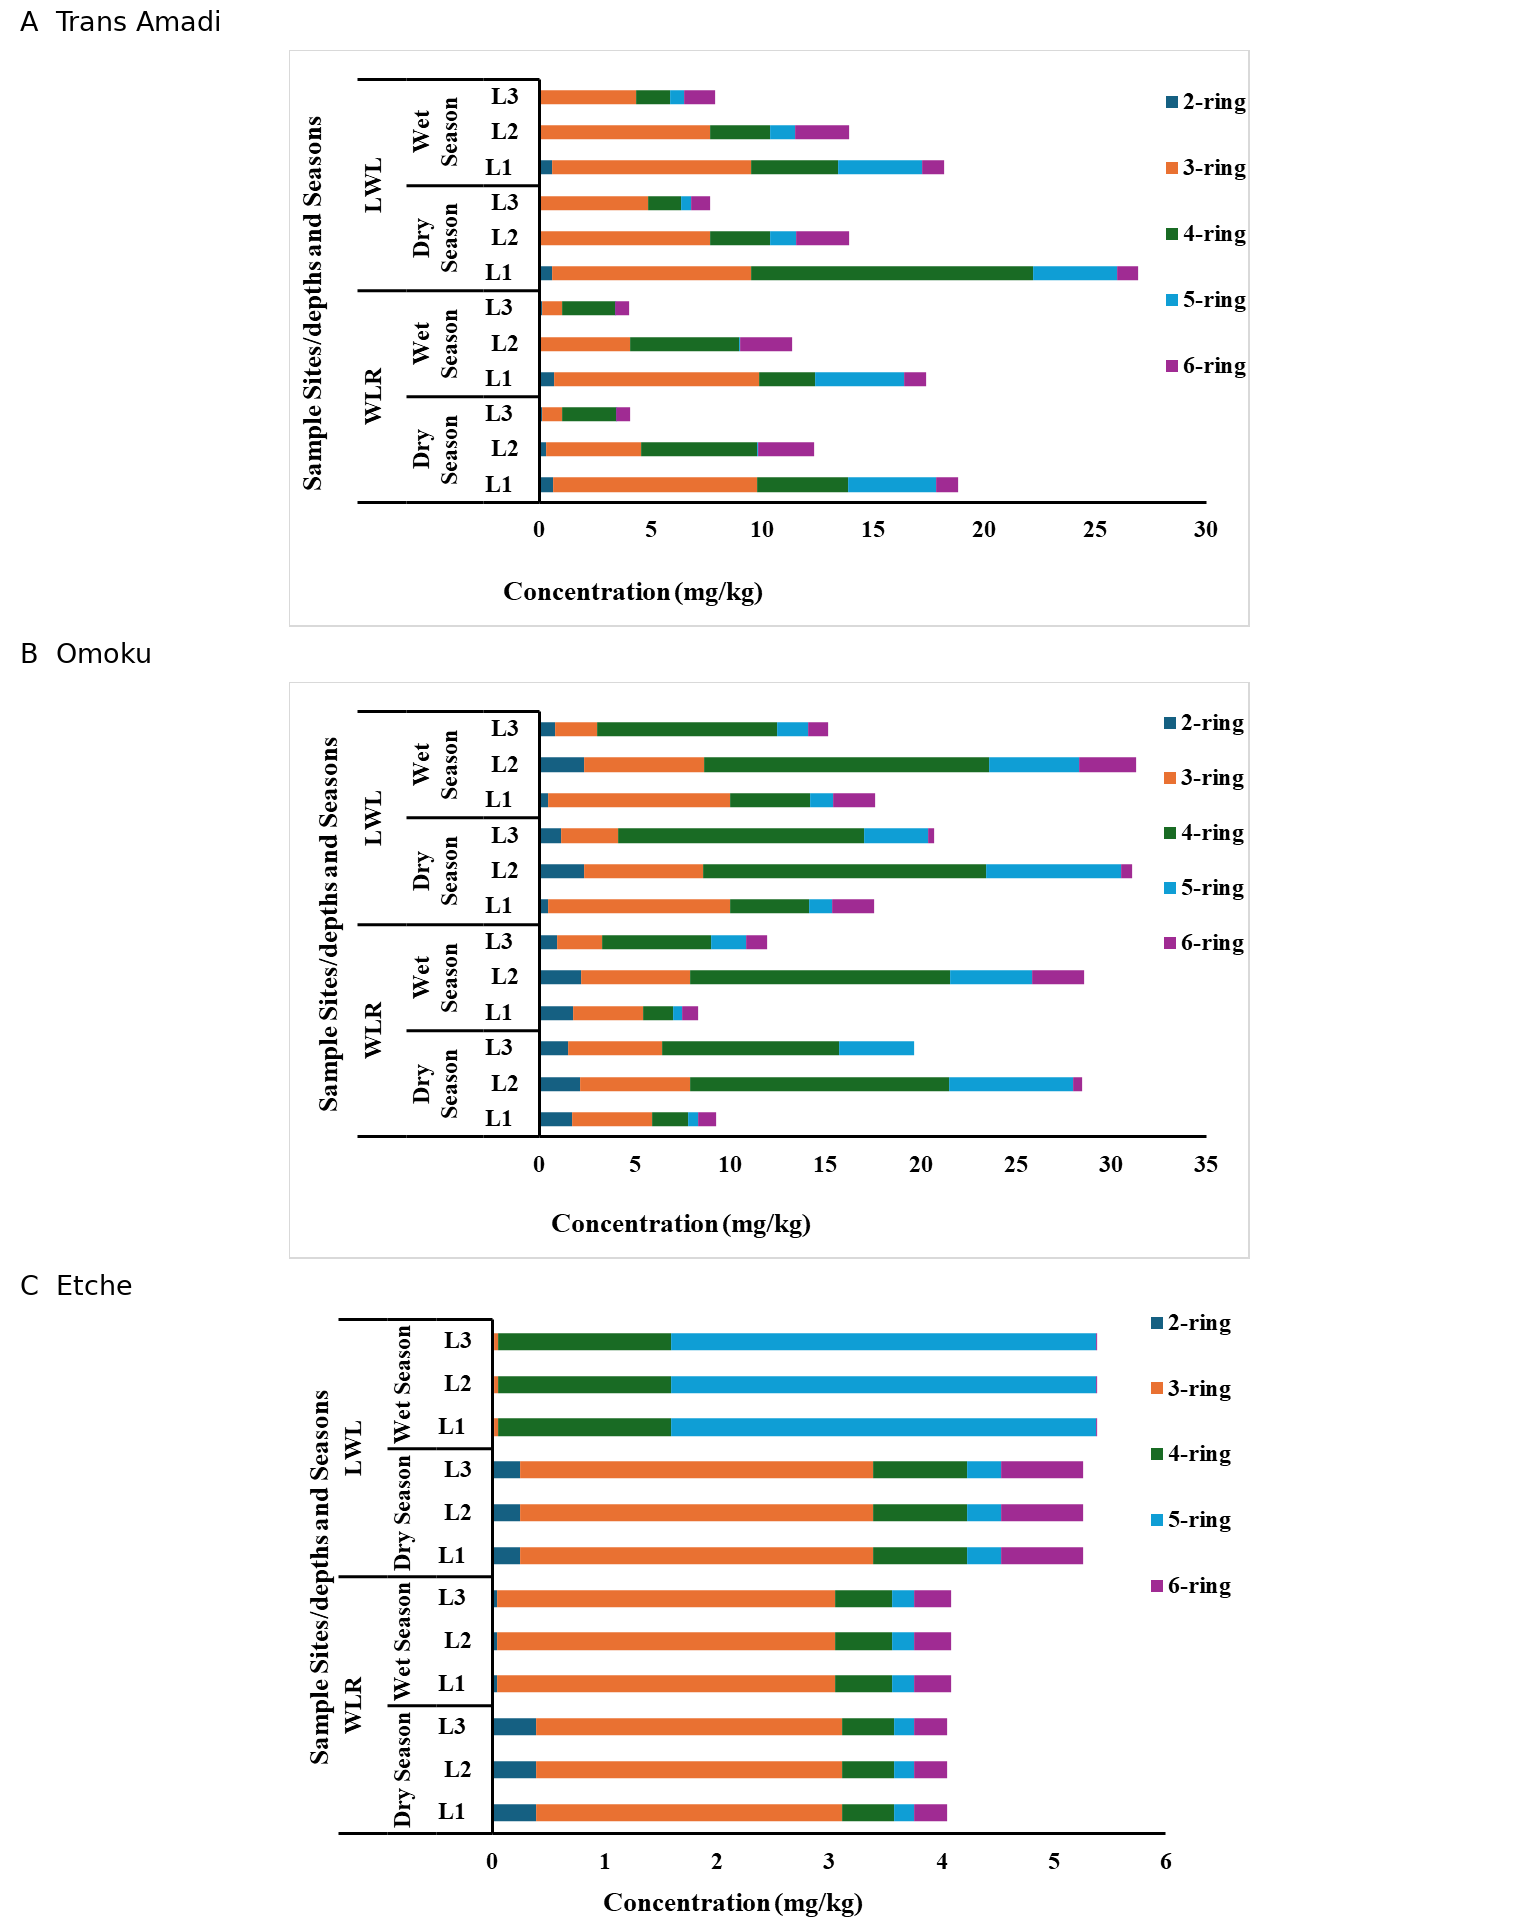
Seasonal plant PAH responses depended on tissue and location (Figures 3 and 4). Trans-Amadi waterleaf generally showed greater dry-season totals at some points, especially L1, while other points were similar. Omoku waterleaf had substantial location effects, with prominent L2 values in both seasons. Like soil, its wet–dry contrast was not uniformly in one direction. Etche waterleaf leaves showed a different seasonal composition, with a strong five-ring contribution during the wet season so it’s impossible to assume that the The comparison site has a constant seasonal profile.
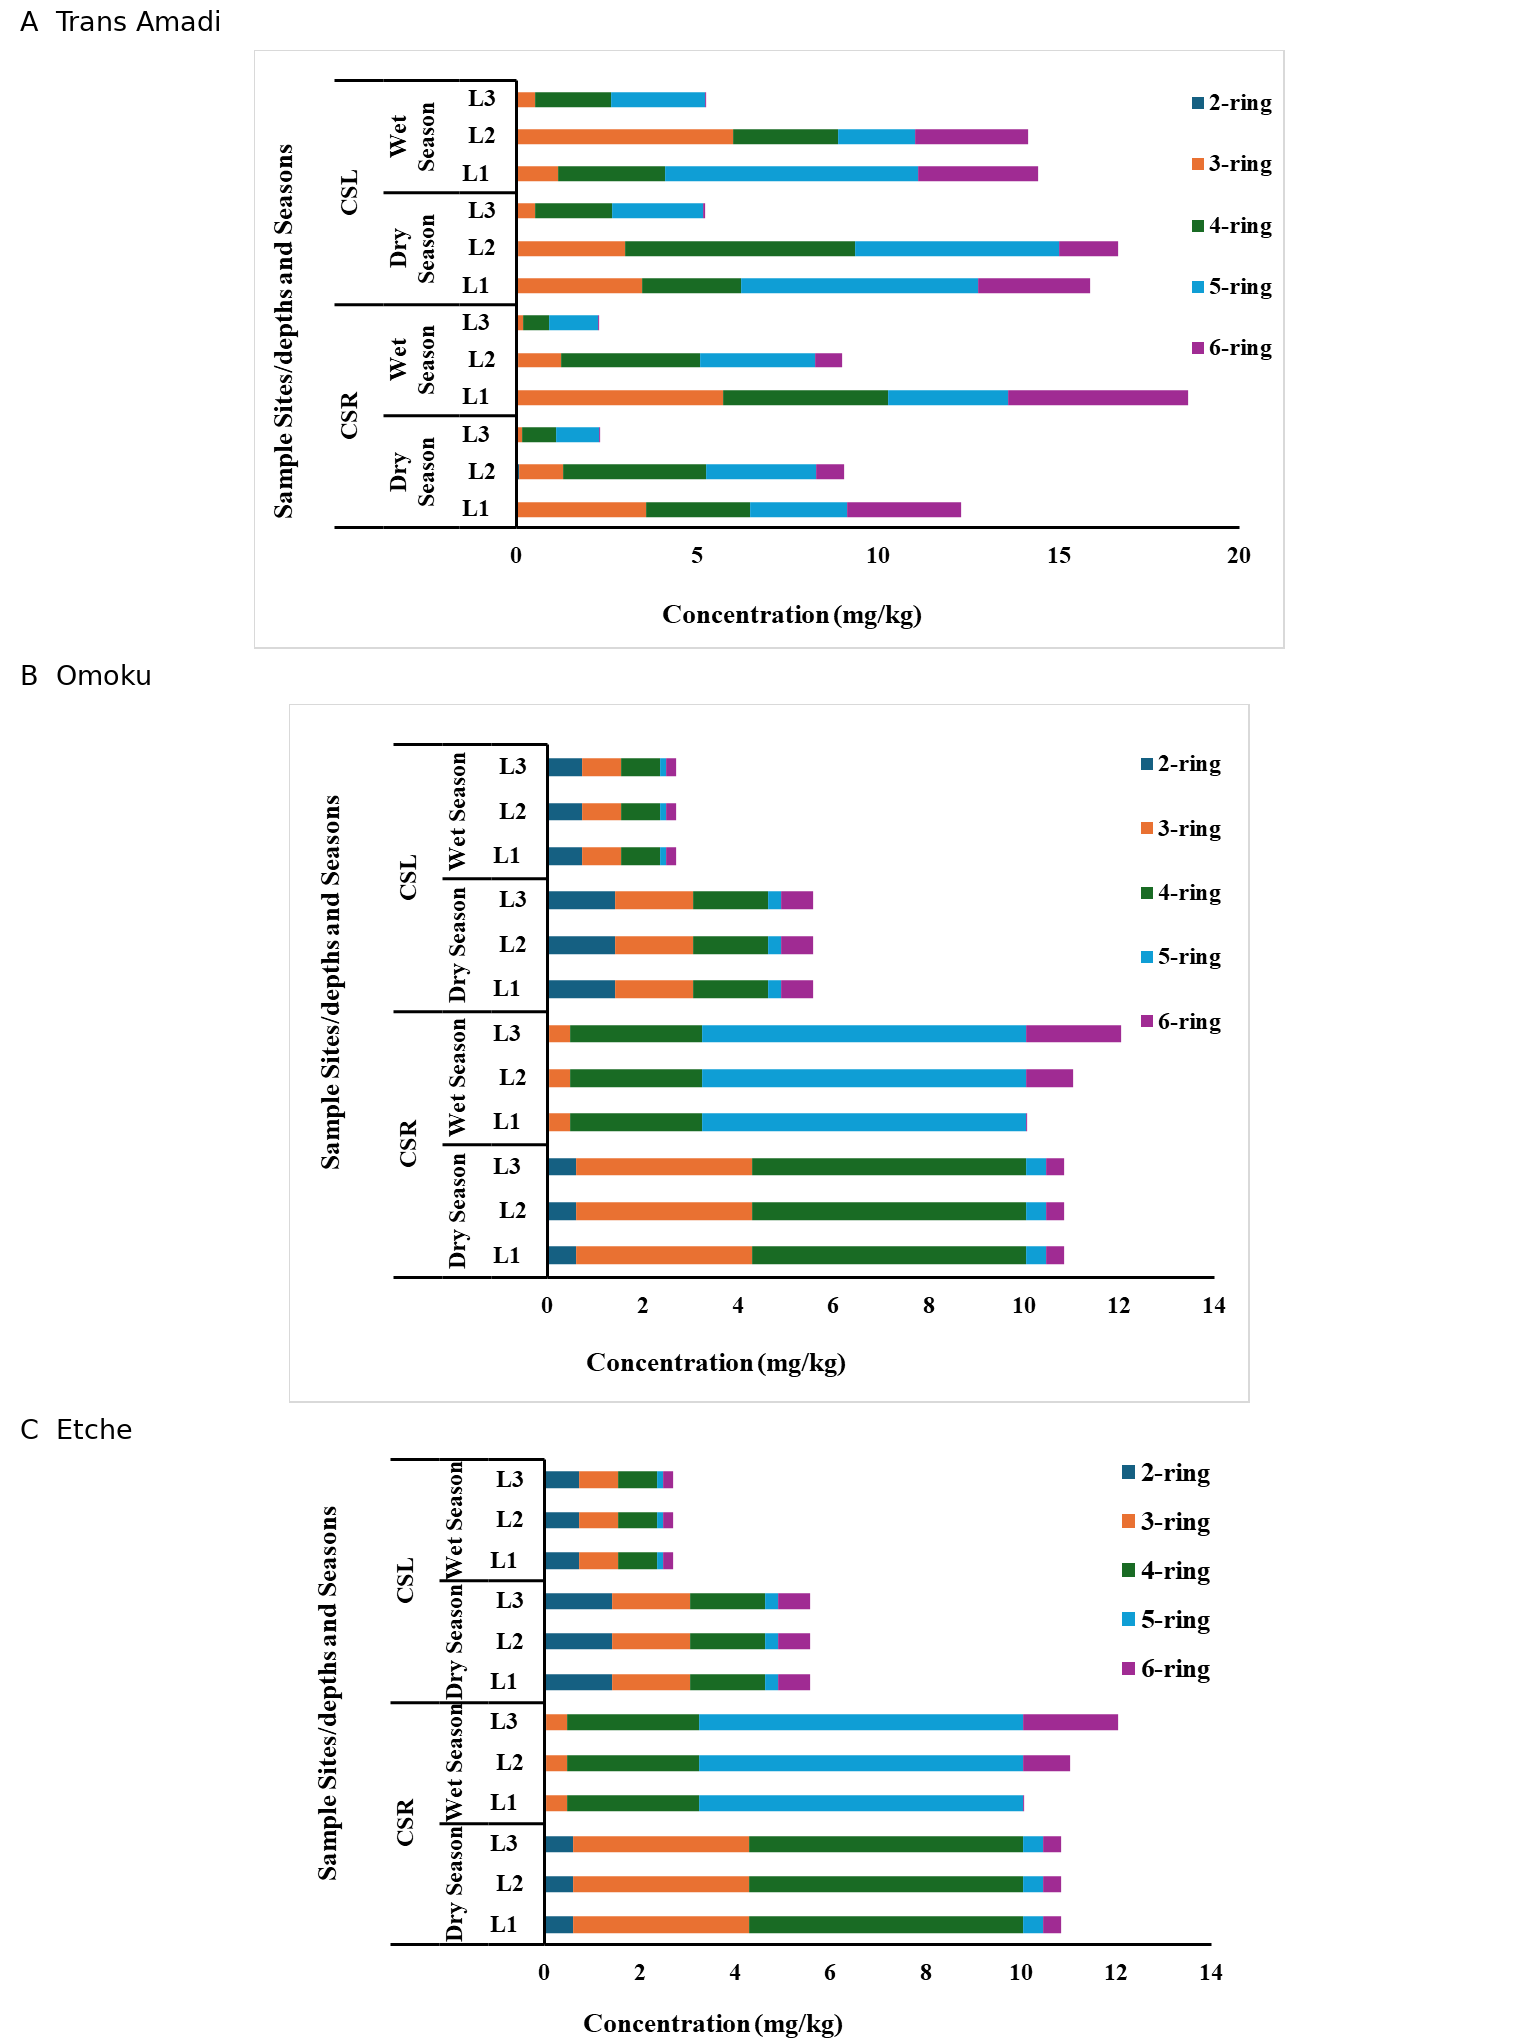
Cassava roots and leaves also responded differently. At Omoku, the leaf concentrations were greater in the dry season at all three points while roots showed mixed responses: the wet-season L1 value was smaller than its dry-season counterpart, L2 was similar, and L3 was greater. At Trans-Amadi, the roots showed higher concentration in the wet-season at L1 exceeded the dry-season value, despite dry-season enrichment in some leaf comparisons. Etche cassava roots showed wet-season increases at some points while leaves were greater in the dry season. While most leaf comparisons showed higher concentrations in the dry season, and root comparisons showed higher concentration in the wet season, this conclusion is not absolute.
The distributions support a tissue-dependent seasonal interpretation. Table 3 shows the patterns supported by the available evidence.
| Domain | Observed seasonal pattern |
|---|---|
| Soil chemistry | Wet pH, CEC, TOM, N higher; K and P lower |
| Soil texture | Mixed and generally modest changes |
| Soil metals | Wet-season enrichment described |
| Plant metals | Wet-season enrichment described |
| Soil PAHs | Dry totals greater at many points; exceptions occur |
| Waterleaf PAHs | Site and tissue differences; mixed responses |
| Cassava PAHs | Omoku leaves greater in dry; roots mixed |
| PAH ratios | Seasonal shifts vary among locations |
3.6Seasonal changes in PAH diagnostic ratios
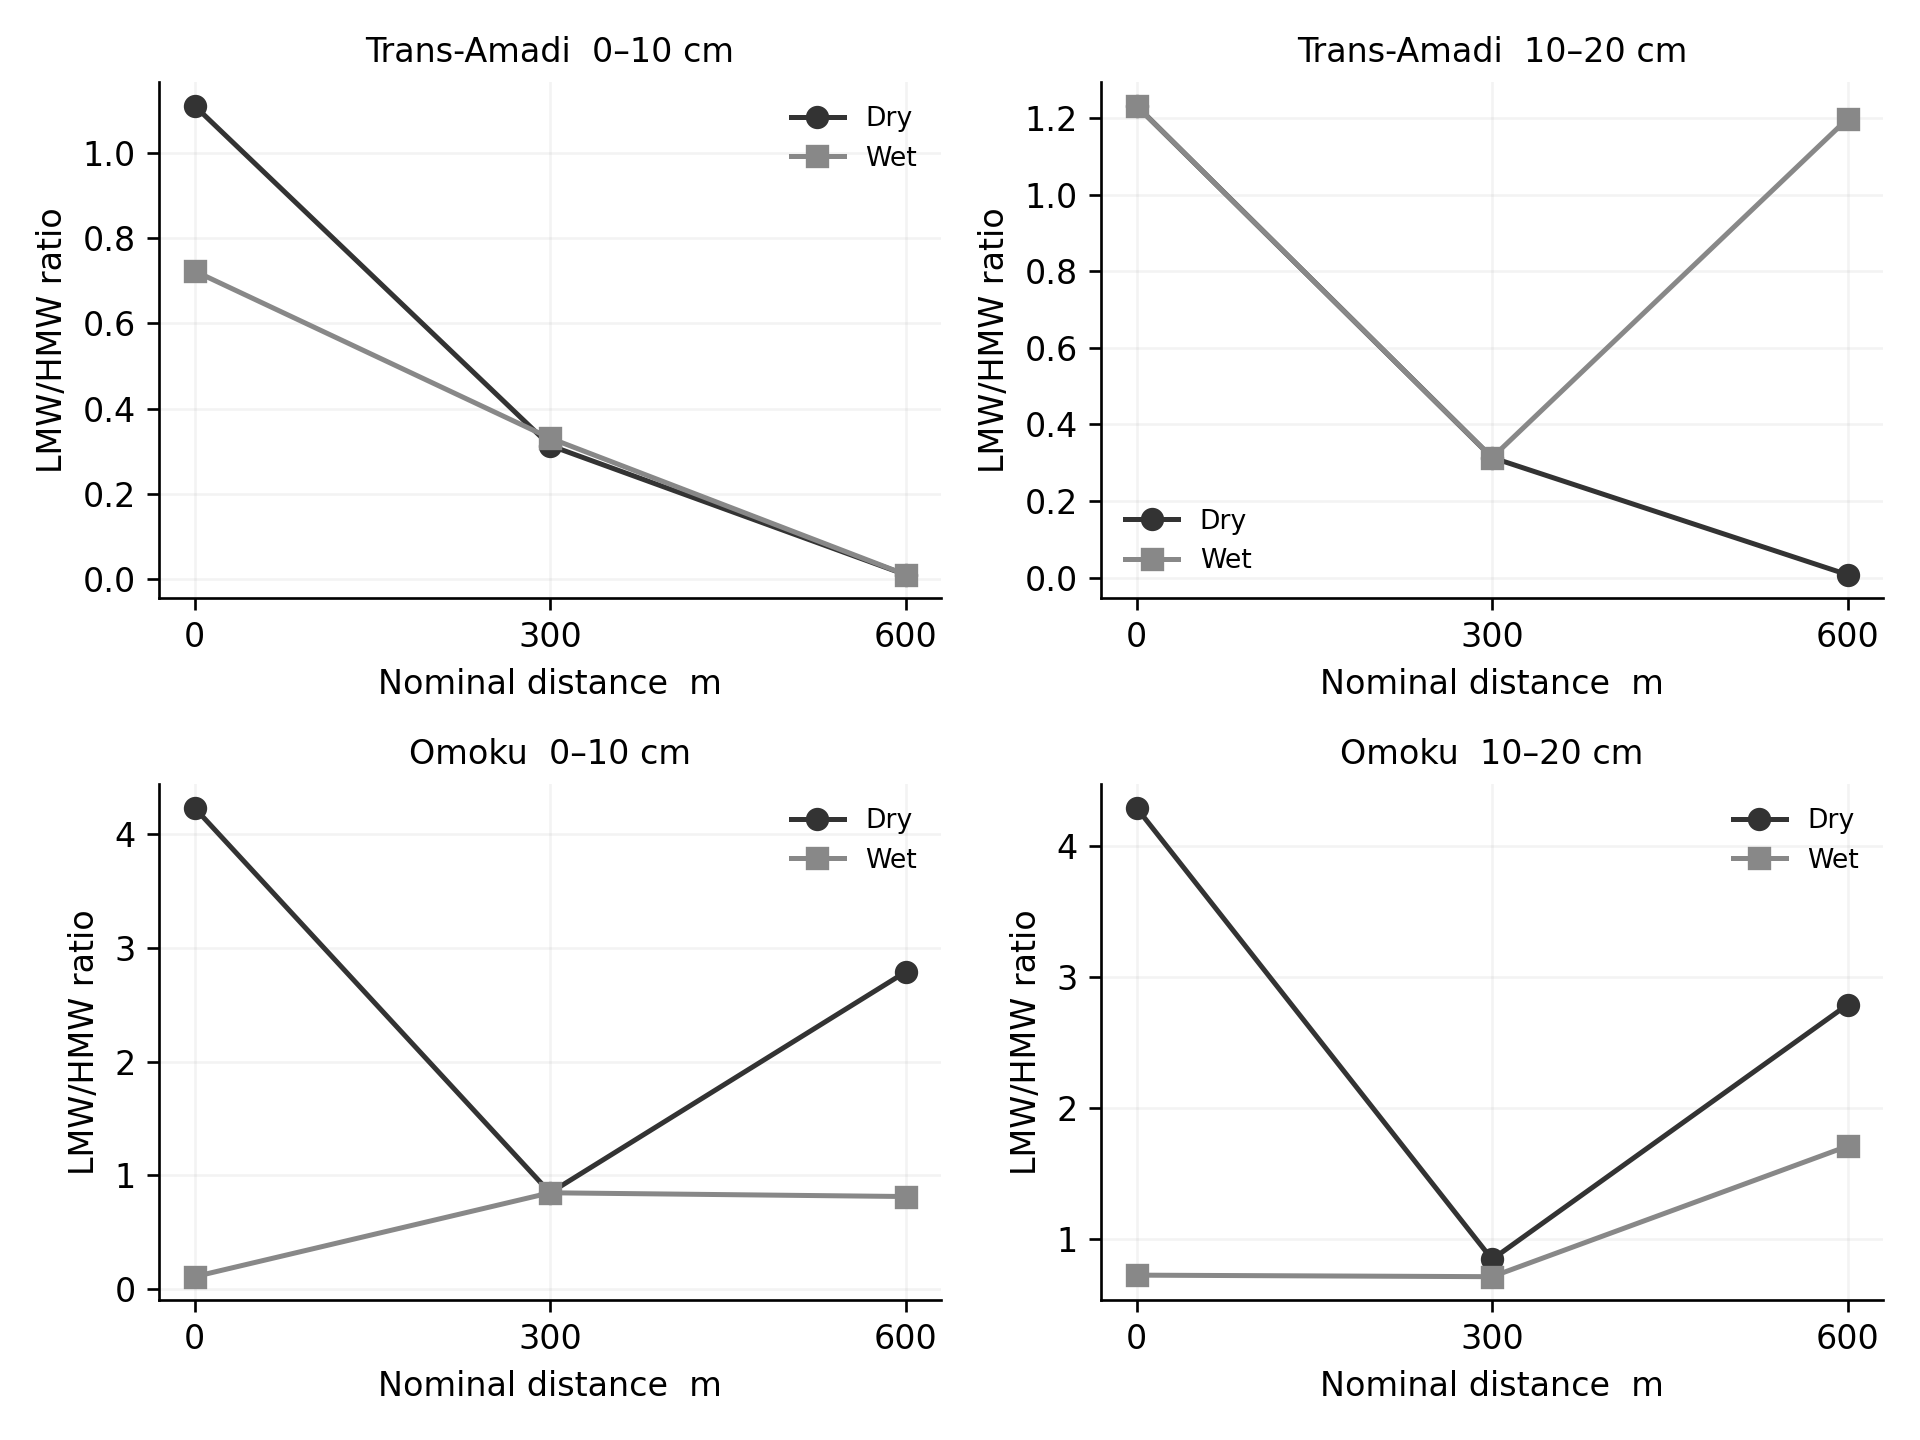
Selected soil ratios show marked compositional changes (Table 5). At Omoku L1 surface soil, LMW/HMW decreased from 4.23204 in the dry season to 0.11005 in the wet season, while Ant/(Ant + Phe) increased from 0.04020 to 0.11093. The corresponding subsurface LMW/HMW ratio decreased from 4.29016 to 0.72755. At Trans-Amadi L1 surface soil, LMW/HMW decreased from 1.11025 to 0.72263, but Ant/(Ant + Phe) remained at 0.50273.
Other locations showed weaker or different changes. Trans-Amadi L3 subsurface LMW/HMW increased from 0.00744 to 1.19871, despite very low corresponding surface ratios in both seasons. At Etche L1 surface soil, LMW/HMW decreased from 0.43723 to 0.20669, while Ant/(Ant + Phe) changed from 0.94762 to 0.10087. Seasonal compositional change therefore occurred at the comparison site as well as around the plants.
The crop tables contain heterogeneous ratios across waterleaf and cassava tissues. For example, Omoku waterleaf-root L1 LMW/HMW values include 1.0837 and 1.3071 in successive blocks, while cassava-leaf L3 includes 0.1121 in both blocks. Their variability reinforces the need to distinguish crop tissue composition from soil composition.
The interpretation of these ratios follows a wider literature comparing PAH profiles across environmental media. Estuarine sediment work combined PAH composition with source evaluation (Budzinski et al., 1997), whereas multimedia modelling showed that environmental processing can alter source-to-receptor species ratios (Zhang et al., 2005). Consequently, the present ring-group ratios describe composition and possible source mixtures rather than wholly attributing them to the power plants.
| Domain | Trans-Amadi 0 to 600 m | Omoku 0 to 600 m |
|---|---|---|
| Soil chemistry | pH maxima at L2 or L3; CEC described as lowest at L1 | Wet pH maximum at L3; CEC described as lower at L1 |
| Soil metals | Most metals described as decreasing; Mn opposite | Most metals described as decreasing; Mn opposite |
| Waterleaf Cu | Roots and leaves decline in both plotted seasons | Roots and leaves decline in both plotted seasons |
| Waterleaf Zn | Roots non-monotonic; leaves declining | Roots and leaves declining in selected plots |
| Soil PAHs | Intermediate maximum at L2 in both layers and seasons | Dry layers and wet subsoil declining; wet surface non-monotonic |
| Waterleaf PAHs | Generally L1 greatest and L3 smallest | L2 maximum in roots and leaves |
| Cassava PAHs | Roots generally decrease; leaves high at L1 or L2 | Several profiles nearly uniform; wet roots increase modestly |
| LMW/HMW soil ratio | Dry layers decline; wet subsoil non-monotonic | Spatial ordering changes with season and layer |
L1 = nominal 0 m; L2 = 300 m; L3 = 600 m.
3.7Distance patterns in soil and crop pAHs
At Trans-Amadi, the soil PAH plots show an intermediate-distance maximum at L2 in both layers and seasons, rather than the greatest burden at the nearest point (Figure 2). L3 and L1 have smaller totals, although their ordering changes in some depth–season combinations. At Omoku, dry-season totals decline from L1 through L2 to L3 in both soil layers. The wet-season subsurface profile also declines, but wet surface totals have L1 greatest and L2 slightly below L3. A monotonic decrease is therefore supported for particular Omoku strata, but not for all strata or both plants.
Waterleaf PAHs show contrasting spatial responses between plants (Figure 3). At Trans-Amadi, roots and leaves generally have their greatest totals at L1 and lower totals at L2 and L3. At Omoku, L2 is the prominent maximum in both tissues in the plotted seasons. The strongest waterleaf PAH burden is thus not consistently associated with the smallest nominal distance. Differences in the ring composition accompany these differences in total plotted length.
Trans-Amadi cassava roots are generally greatest at L1 and least at L3, with L2 intermediate. Its leaves show relatively high L1 and L2 total PAH concentration and a smaller L3 concentration; the larger of L1 and L2 depends on season (Figure 4). Omoku cassava profiles are visually similar across distances within several tissue–season groups, particularly the leaves, while the wet-season show a modest increase towards L3. These profiles provide an important exception to the assumption that all crop contaminants decline with increasing distance from pollution source.
Etche provides context for local variability rather than a distance-to-plant response. Its soil PAH plots show some L1–L3 differences despite the short spacing, while several crop profiles are very similar across points. Although Etche profiles show a lower pooled soil burden makes, it is not a zero-contamination reference.
3.8Spatial gradients in PAH composition across seasons
The complete pointwise soil LMW/HMW profiles reveal spatial structure that is not visible in pooled PAH means (Table 5; Figure 5). At Trans-Amadi, dry-season surface ratios decrease in the sequence 1.11025, 0.31331, and 0.01034 from 0 to 600 m. The dry subsurface ratios also decrease, from 1.23247 through 0.31333 to 0.00744. In the wet season, the surface pattern remains decreasing, but subsurface ratios become 1.23247, 0.31333, and 1.19871, producing a minimum at 300 m rather than a progressive decline.
Omoku has a different profile. Dry-season surface ratios are 4.23204, 0.84781, and 2.78897, with a similar ordering in the deeper layer. Wet-season surface ratios are 0.11005, 0.84781, and 0.81479, so the nearest point becomes the minimum rather than the maximum. Wet subsurface ratios are 0.72755, 0.71572, and 1.71063, with the greatest value at 600 m. These observed reversals illustrate season-dependent spatial composition; they do not establish a formal statistical interaction.
Ant/(Ant + Phe) provides a further check on any single-ratio interpretation. Omoku surface values at 300 m are 0.95254 in both seasons, compared with 0.04020 and 0.11093 at 0 m. Trans-Amadi surface values at 0 m remain 0.50273 in both seasons even though LMW/HMW decreases between those seasons. A gradient in one ratio is therefore not equivalent to a gradient in every component of PAH composition. The LMW/HMW decline at Trans-Amadi also does not contradict a larger total PAH burden at 300 m: a ratio measures relative composition, whereas total concentration measures the summed burden.
| Site | Season | Depth cm | 0 m | 300 m | 600 m |
|---|---|---|---|---|---|
| TPP | Dry | 0–10 | 1.11025 | 0.31331 | 0.01034 |
| TPP | Dry | 10–20 | 1.23247 | 0.31333 | 0.00744 |
| TPP | Wet | 0–10 | 0.72263 | 0.3307 | 0.01059 |
| TPP | Wet | 10–20 | 1.23247 | 0.31333 | 1.19871 |
| OPP | Dry | 0–10 | 4.23204 | 0.84781 | 2.78897 |
| OPP | Dry | 10–20 | 4.29016 | 0.84767 | 2.78928 |
| OPP | Wet | 0–10 | 0.11005 | 0.84781 | 0.81479 |
| OPP | Wet | 10–20 | 0.72755 | 0.71572 | 1.71063 |
LMW = two- and three-ring PAHs; HMW = four- to six-ring PAHs. These ratios do not measure total PAH concentration. Nominal distances follow the sampling design.
3.9Seasonal variation is specific to the matrix and location
The principal result is that season did not produce a uniform response across all measured environmental properties. Soil pH, CEC, TOM, and nitrogen increased between the reported dry and wet periods, whereas potassium and phosphorus decreased. The PAH plots showed a more complicated pattern, including greater dry-season soil totals at many points and opposing root–leaf responses. The contrast in mean soil Σ16PAHs identifies a spatial difference across all sampled conditions. A single statement that rainfall either increases or decreases contamination would obscure these differences.
PAHs provide a useful illustration of this complexity. Their environmental behaviour varies with molecular structure, volatility, and partitioning, while their occurrence can reflect combustion and petroleum-related inputs (Abdel-Shafy & Mansour, 2016; Ravindra et al., 2008). Vegetation also responds to the form in which pollutants arrive. Field measurements show that PAHs partition between vegetation and air, while studies of particles on foliage distinguish material on leaf surfaces from material retained within waxes (Dzierżanowski et al., 2011; Simonich & Hites, 1994). Differences in particulate accumulation among plant species further show that a common atmospheric exposure need not yield a common tissue concentration (Sæbø et al., 2012). Higher concentrations near a power plant establish a spatial association, but the same surroundings may contain traffic, generators, petroleum handling, biomass burning, or historic contamination. PAH diagnostic ratios can help examine competing source hypotheses (Tobiszewski & Namieśnik, 2012; Yunker et al., 2002). Odali et al. (2024) identified mixed combustion-related PAH signatures in soils around gas-flaring communities in the Niger Delta, including potential contributions from flaring, vehicles, and biomass burning. Roadside research in Kampala also documented trace metals in soils, surface films, and vegetation, illustrating an additional exposure setting relevant to interpreting agricultural contamination (Nabulo et al., 2006). Spatial and seasonal sampling in the thermal-power province of Kutahya identified both coal combustion and vehicle exhaust as major PAH contributors (Dumanoglu et al., 2017).
Unlike PAHs, metals follow a more stable pattern with higher wet-season values. Models of contaminated soils relate metal partitioning to pH, organic matter, and metal loading, while experiments in tropical soils demonstrate element-specific sorption responses to pH and surface charge (Appel & Ma, 2002; McBride et al., 1997; Sauvé et al., 2000). Soil investigations around coal facilities in Serbia and India likewise evaluated metal distributions in relation to spatial patterns and soil properties (Ćujić et al., 2016; Mandal et al., 2022). Agricultural soils near a Brazilian coal-power complex received multiple potential inputs, with farming practices also influencing elemental accumulation (Rodriguez-Iruretagoiena et al., 2015). An Indian fly-ash study explicitly assessed spatiotemporal distribution and elemental leaching potential (Luo et al., 2024).
3.10Soil properties and contaminant retention
The higher wet-season pH at the industrial sites may influence contaminant interactions. A shift towards neutral or alkaline conditions can alter metal partitioning within the soil differently for different elements and chemical species. Total metal concentration alone does not quantify the dissolved or bioavailable fraction. Plant metal behaviour likewise depends on physiological uptake and internal transport processes (Ali et al., 2013). Investigations of upland soils and models developed from diverse soils relate dissolved or potentially bioavailable metal to soil characteristics, particularly pH and organic matter (Impellitteri et al., 2003; Tipping et al., 2003). Desorption experiments additionally show that organic matter distribution and the extraction soil-to-solution ratio influence measured metal release (Yin et al., 2002).
Moisture-related redox changes are another possible influence. Controlled rice experiments demonstrated that redox potential and pH affected soluble Cd and Pb and their uptake (Reddy & Patrick, 1977). The Brazilian agricultural-soil study similarly found that farming practices complicated interpretation of hazardous-element distributions around a coal-power complex (Rodriguez-Iruretagoiena et al., 2015). However, the nutrient results suggest that soil responses cannot be reduced to a single retention mechanism. Increased CEC and TOM coincided with decreased potassium and phosphorus, while nitrogen increased. Redistribution, plant demand, local management, and differences between sampling dates may also be potential contributors.
3.11Tissue differences and the agricultural exposure pathway
The crop PAH plots are consistent with several simultaneous pathways, including contact with contaminated soil, material retained on roots, and atmospheric material deposited on leaves. Research on organic contaminant transfer identifies root-surface retention, root uptake and translocation, and foliar uptake as distinct processes (Wild & Jones, 1992). This explains why root and leaf concentrations differ.
Experimental and field investigations provide more specific support for these alternative pathways. Fismes et al. (2002) examined soil-to-root transfer and translocation in vegetables grown on industrially contaminated soils, and Gao and Zhu (2004) found that phenanthrene and pyrene accumulation depended on soil concentrations and plant composition. Measurements in industrial Thessaloniki and agricultural Tianjin also distinguished PAH contamination in vegetables from that in the surrounding soil and atmosphere (Kipopoulou et al., 1999; Tao et al., 2004). The mixed seasonal behaviour of cassava roots is particularly relevant. Omoku leaves show a clear dry-season elevation in the plotted data, but root changes depend on location. Treating these tissues as a single crop concentration would obscure the contrast. Similarly, the strong wet-season five-ring component in Etche waterleaf leaves indicates that while it has no power plant, the control area contains its own changing environmental inputs.
For metals, evidence from controlled air-versus-soil exposure and industrial fallout studies also demonstrates a foliar pathway. Harrison and Chirgawi (1989) separated atmospheric and soil contributions using a filtered-air growth cabinet, while Uzu et al. (2010) investigated lead uptake by lettuce exposed to fallout. Schreck et al. (2012) further documented foliar uptake of several metals and metalloids in vegetables exposed to industrial particles. These experiments justify considering leaf-surface interactions alongside root uptake. The agricultural pathway has also been investigated directly around thermal power plants: Khillare et al. (2012) measured priority PAHs and metals in six vegetable types grown near three facilities and a background site. That study establishes a relevant comparison for crop monitoring, but its coal-related signatures and dietary-risk estimates cannot substitute for exposure calculations using the present crop concentrations, preparation practices, and consumption data.
3.12Interpreting PAH sources across seasons
The markedly higher PAH concentrations observed at Omoku and Trans-Amadi compared with Etche underscore the influence of gas thermal power plant operations known to emit substantial quantities of PAHs through gas flaring, fossil fuel combustion, and incomplete burning of hydrocarbons (Nisbet & LaGoy, 1992; Anyanwu et al., 2020). The dominance of HMW PAHs (5- and 6-ring) at the industrial sites further implicates combustion sources. HMW PAHs are typically associated with pyrogenic origin, particularly from high-temperature industrial processes (Zhang et al., 2005). Combustion and petroleum-related activities can generate overlapping profiles, and atmospheric processing alters the material reaching receptors (Ravindra et al., 2008). The comparison area should likewise be understood as a site without the studied facilities, rather than as a contaminant-free baseline. PAHs have been measured in global background soils and in Norwegian forest soils influenced by long-range atmospheric transport (Aamot et al., 1996; Nam et al., 2009).
The seasonal change in Ant/(Ant + Phe) merits particular caution. Analysis of two decades of UK source-inventory and air-monitoring data found that this ratio was strongly seasonal at some locations and vulnerable to atmospheric processing (Katsoyiannis et al., 2011). A change in the present ratio can therefore reflect environmental transformation as well as a change in source mixture.
Diagnostic ratios are useful for screening but require multiple lines of evidence. Yunker et al. (2002) demonstrated the value of evaluating ratios alongside broader PAH composition, while Tobiszewski and Namieśnik (2012) examined limitations in their application.
Model-based evaluation further showed that differences in PAH transport behaviour can alter molecular diagnostic ratios with distance from a source (Katsoyiannis & Breivik, 2014). Together with multimedia source-to-receptor modelling (Zhang et al., 2005), this evidence supports using ratios alongside meteorology, emission profiles, and multivariate source analysis rather than as independent proof of plant-specific contamination.
4Conclusion
This study demonstrates spatial and seasonal variation in soil properties as well as heavy metal and PAH concentrations around the Trans-Amadi and Omoku gas-fired power plants in Rivers State. Understanding these differences provides a basis for targeted pollution prevention and risk mitigation. The findings can inform the selection and implementation of improved engineering controls, guide environmental monitoring across seasons and distances, and support the development and enforcement of laws and policies that protect surrounding communities.
References
- [1]Aamot E, Steinnes E, Schmid R (1996). Polycyclic aromatic hydrocarbons in Norwegian forest soils: Impact of long range atmospheric transport. Environmental Pollution, 92(3), 275–280. https://doi.org/10.1016/0269-7491(95)00114-x
- [2]Abdel-Shafy HI, Mansour MSM (2016). A review on polycyclic aromatic hydrocarbons: Source, environmental impact, effect on human health and remediation. Egyptian Journal of Petroleum, 25(1), 107–123. https://doi.org/10.1016/j.ejpe.2015.03.011
- [3]Akinkpelumi VK, Onyena AP, Abdulai PM, Ossai CM, Frazzoli C, Orisakwe OE (2025). Seasonality and ecological risks of polycyclic aromatic hydrocarbons PAHs in environmental media and food crops of Ibaa, Niger Delta, Nigeria. Environmental Sciences Europe, 37, Article 215. https://doi.org/10.1186/s12302-025-01266-8
- [4]Anyanwu ED, Egbuna C, Nwankwo C (2020). PAH emissions from gas-fired power plants in Nigeria. Journal of Environmental Science and Health, 55(9), 1138–1148.
- [5]Ali H, Khan E, Sajad MA (2013). Phytoremediation of heavy metals—Concepts and applications. Chemosphere, 91(7), 869–881. https://doi.org/10.1016/j.chemosphere.2013.01.075
- [6]Appel C, Ma L (2002). Concentration, pH, and surface charge effects on cadmium and lead sorption in three tropical soils. Journal of Environmental Quality, 31(2), 581–589. https://doi.org/10.2134/jeq2002.5810
- [7]Appel C, Ma LQ, Rhue RD, Kennelley E (2003). Point of zero charge determination in soils and minerals via traditional methods and detection of electroacoustic mobility. Geoderma, 113(1–2), 77–93. https://doi.org/10.1016/s0016-7061(02)00316-6
- [8]Birch HF (1958). The effect of soil drying on humus decomposition and nitrogen availability. Plant and Soil, 10(1), 9–31. https://doi.org/10.1007/bf01343734
- [9]Budzinski H, Jones I, Bellocq J, Piérard C, Garrigues P (1997). Evaluation of sediment contamination by polycyclic aromatic hydrocarbons in the Gironde estuary. Marine Chemistry, 58(1–2), 85–97. https://doi.org/10.1016/s0304-4203(97)00028-5
- [10]Butterly CR, Bünemann EK, McNeill AM, Baldock JA, Marschner P (2009). Carbon pulses but not phosphorus pulses are related to decreases in microbial biomass during repeated drying and rewetting of soils. Soil Biology and Biochemistry, 41(7), 1406–1416. https://doi.org/10.1016/j.soilbio.2009.03.018
- [11]Ćujić M, Dragović S, Đorđević M, Dragović R, Gajić B (2016). Environmental assessment of heavy metals around the largest coal fired power plant in Serbia. CATENA, 139, 44–52. https://doi.org/10.1016/j.catena.2015.12.001
- [12]Dumanoglu Y, Gaga EO, Gungormus E, Sofuoglu SC, Odabasi M (2017). Spatial and seasonal variations, sources, air-soil exchange, and carcinogenic risk assessment for PAHs and PCBs in air and soil of Kutahya, Turkey, the province of thermal power plants. Science of the Total Environment, 580, 920–935. https://doi.org/10.1016/j.scitotenv.2016.12.040
- [13]Dzierżanowski K, Popek R, Gawrońska H, Sæbø A, Gawroński SW (2011). Deposition of particulate matter of different size fractions on leaf surfaces and in waxes of urban forest species. International Journal of Phytoremediation, 13(10), 1037–1046. https://doi.org/10.1080/15226514.2011.552929
- [14]Fismes J, Perrin‐Ganier C, Empereur‐Bissonnet P, Morel JL (2002). Soil-to-root transfer and translocation of polycyclic aromatic hydrocarbons by vegetables grown on industrial contaminated soils. Journal of Environmental Quality, 31(5), 1649–1656. https://doi.org/10.2134/jeq2002.1649
- [15]Gao Y, Zhu L (2004). Plant uptake, accumulation and translocation of phenanthrene and pyrene in soils. Chemosphere, 55(9), 1169–1178. https://doi.org/10.1016/j.chemosphere.2004.01.037
- [16]Gune MM, Harshavardhana BG, Ma WL, Balakrishna K, Udayashankar HN, Zhang Z, Li YF (2020). Seasonal variations of heavy metals in the soil around a coal-fired thermal power plant, south-west coast of India. Bulletin of Environmental Contamination and Toxicology, 104(5), 602–608. https://doi.org/10.1007/s00128-020-02831-y
- [17]Harrison RM, Chirgawi MB (1989). The assessment of air and soil as contributors of some trace metals to vegetable plants. I. Use of a filtered air growth cabinet. Science of the Total Environment, 83(1–2), 13–34. https://doi.org/10.1016/0048-9697(89)90003-x
- [18]Impellitteri CA, Saxe JK, Cochran M, Janssen GMCM, Allen HE (2003). Predicting the bioavailability of copper and zinc in soils: Modeling the partitioning of potentially bioavailable copper and zinc from soil solid to soil solution. Environmental Toxicology and Chemistry, 22(6), 1380–1386. https://doi.org/10.1002/etc.5620220626
- [19]Katsoyiannis A, Breivik K (2014). Model-based evaluation of the use of polycyclic aromatic hydrocarbons molecular diagnostic ratios as a source identification tool. Environmental Pollution, 184, 488–494. https://doi.org/10.1016/j.envpol.2013.09.028
- [20]Katsoyiannis A, Sweetman AJ, Jones KC (2011). PAH molecular diagnostic ratios applied to atmospheric sources: A critical evaluation using two decades of source inventory and air concentration data from the UK. Environmental Science & Technology, 45(20), 8897–8906. https://doi.org/10.1021/es202277u
- [21]Khillare PS, Jyethi DS, Sarkar S (2012). Health risk assessment of polycyclic aromatic hydrocarbons and heavy metals via dietary intake of vegetables grown in the vicinity of thermal power plants. Food and Chemical Toxicology, 50(5), 1642–1652. https://doi.org/10.1016/j.fct.2012.01.032
- [22]Kipopoulou AM, Manoli E, Samara C (1999). Bioconcentration of polycyclic aromatic hydrocarbons in vegetables grown in an industrial area. Environmental Pollution, 106(3), 369–380. https://doi.org/10.1016/s0269-7491(99)00107-4
- [23]Krauss M, Wilcke W, Zech W (2000). Polycyclic aromatic hydrocarbons and polychlorinated biphenyls in forest soils: depth distribution as indicator of different fate. Environmental Pollution, 110(1), 79–88. https://doi.org/10.1016/s0269-7491(99)00280-8
- [24]Luo C, Pajala G, Shakeri Yekta S, Sarkar S, Klump JV, Pujari P, Routh J (2024). Soil contamination caused by fly ash from coal-fired thermal power plants in India: Spatiotemporal distribution and elemental leaching potential. Applied Geochemistry, 170, Article 106080. https://doi.org/10.1016/j.apgeochem.2024.106080
- [25]Mandal S, Bhattacharya S, Paul S (2022). Assessing the level of contamination of metals in surface soils at thermal power area: Evidence from developing country (India). Environmental Chemistry and Ecotoxicology, 4, 37–49. https://doi.org/10.1016/j.enceco.2021.11.003
- [26]McBride M, Sauvé S, Hendershot W (1997). Solubility control of Cu, Zn, Cd and Pb in contaminated soils. European Journal of Soil Science, 48(2), 337–346. https://doi.org/10.1111/j.1365-2389.1997.tb00554.x
- [27]McBride MB, Shayler HA, Spliethoff HM, Mitchell RG, Marquez-Bravo LG, Ferenz GS, Russell-Anelli JM, Casey L, Bachman S (2014). Concentrations of lead, cadmium and barium in urban garden-grown vegetables: The impact of soil variables. Environmental Pollution, 194, 254–261. https://doi.org/10.1016/j.envpol.2014.07.036
- [28]Nabulo G, Black CR, Young SD (2011). Trace metal uptake by tropical vegetables grown on soil amended with urban sewage sludge. Environmental Pollution, 159(2), 368–376. https://doi.org/10.1016/j.envpol.2010.11.007
- [29]Nabulo G, Oryem-Origa H, Diamond M (2006). Assessment of lead, cadmium, and zinc contamination of roadside soils, surface films, and vegetables in Kampala City, Uganda. Environmental Research, 101(1), 42–52. https://doi.org/10.1016/j.envres.2005.12.016
- [30]Nabulo G, Young SD, Black CR (2010). Assessing risk to human health from tropical leafy vegetables grown on contaminated urban soils. Science of the Total Environment, 408(22), 5338–5351. https://doi.org/10.1016/j.scitotenv.2010.06.034
- [31]Nam JJ, Sweetman AJ, Jones KC (2009). Polynuclear aromatic hydrocarbons (PAHs) in global background soils. Journal of Environmental Monitoring, 11(1), 45–48. https://doi.org/10.1039/b813841a
- [32]Nam JJ, Thomas GO, Jaward FM, Steinnes E, Gustafsson O, Jones KC (2008). PAHs in background soils from Western Europe: Influence of atmospheric deposition and soil organic matter. Chemosphere, 70(9), 1596–1602. https://doi.org/10.1016/j.chemosphere.2007.08.010
- [33]Nisbet IC, LaGoy PK (1992). Toxic equivalency factors (TEFs) for polycyclic aromatic hydrocarbons (PAHs). Regul Toxicol Pharmacol, 16(3):290–300. https://doi.org/10.1016/0273-2300(92)90009-x
- [34]Odali EW, Iwegbue CMA, Egobueze FE, Nwajei GE, Martincigh BS (2024). Distribution, sources, and risk of polycyclic aromatic hydrocarbons in soils from rural communities around gas flaring points in the Niger Delta of Nigeria. Environmental Science: Processes & Impacts, 26(4), 721–733. https://doi.org/10.1039/d3em00067b
- [35]Ravindra K, Sokhi R, Van Grieken R (2008). Atmospheric polycyclic aromatic hydrocarbons: Source attribution, emission factors and regulation. Atmospheric Environment, 42(13), 2895–2921. https://doi.org/10.1016/j.atmosenv.2007.12.010
- [36]Reddy CN, Patrick WH Jr (1977). Effect of redox potential and pH on the uptake of cadmium and lead by rice plants. Journal of Environmental Quality, 6(3), 259–262. https://doi.org/10.2134/jeq1977.00472425000600030005x
- [37]Rodriguez-Iruretagoiena A, Fdez-Ortiz de Vallejuelo S, Gredilla A, Ramos CG, Oliveira MLS, Arana G, de Diego A, Madariaga JM, Silva LFO (2015). Fate of hazardous elements in agricultural soils surrounding a coal power plant complex from Santa Catarina (Brazil). Science of the Total Environment, 508, 374–382. https://doi.org/10.1016/j.scitotenv.2014.12.015
- [38]Sauvé S, Hendershot W, Allen HE (2000). Solid-solution partitioning of metals in contaminated soils: Dependence on pH, total metal burden, and organic matter. Environmental Science & Technology, 34(7), 1125–1131. https://doi.org/10.1021/es9907764
- [39]Sæbø A, Popek R, Nawrot B, Hanslin HM, Gawronska H, Gawronski SW (2012). Plant species differences in particulate matter accumulation on leaf surfaces. Science of the Total Environment, 427–428, 347–354. https://doi.org/10.1016/j.scitotenv.2012.03.084
- [40]Schreck E, Foucault Y, Sarret G, Sobanska S, Cécillon L, Castrec-Rouelle M, Uzu G, Dumat C (2012). Metal and metalloid foliar uptake by various plant species exposed to atmospheric industrial fallout: Mechanisms involved for lead. Science of the Total Environment, 427–428, 253–262. https://doi.org/10.1016/j.scitotenv.2012.03.051
- [41]Simonich SL, Hites RA (1994). Vegetation-atmosphere partitioning of polycyclic aromatic hydrocarbons. Environmental Science & Technology, 28(5), 939–943. https://doi.org/10.1021/es00054a028
- [42]Tao S, Cui YH, Xu FL, Li BG, Cao J, Liu WX, Schmitt G, Wang XJ, Shen WR, Qing BP, Sun R (2004). Polycyclic aromatic hydrocarbons (PAHs) in agricultural soil and vegetables from Tianjin. Science of the Total Environment, 320(1), 11–24. https://doi.org/10.1016/s0048-9697(03)00453-4 Tipping, E., Rieuwerts, J., Pan, G., Ashmore, M. R., Lofts, S., Hill, M. T. R., Farago, M. E., & Thornton, I. (2003). The solid–solution partitioning of heavy metals (Cu, Zn, Cd, Pb) in upland soils of England and Wales. Environmental Pollution, 125(2), 213–225. https://doi.org/10.1016/s0269-7491(03)00058-7
- [43]Tobiszewski M, Namieśnik J (2012). PAH diagnostic ratios for the identification of pollution emission sources. Environmental Pollution, 162, 110–119. https://doi.org/10.1016/j.envpol.2011.10.025
- [44]Turner BL, Haygarth PM (2001). Phosphorus solubilization in rewetted soils. Nature, 411(6835), 258. https://doi.org/10.1038/35077146
- [45]U.S. Environmental Protection Agency (1996). Method 3050B: Acid digestion of sediments, sludges, and soils (Revision 2). https://www.epa.gov/sites/default/files/2015-06/documents/epa-3050b.pdf
- [46]U.S. Environmental Protection Agency (2014). Method 8270D: Semivolatile organic compounds by gas chromatography/mass spectrometry (GC/MS) (Revision 5). https://archive.epa.gov/epa/hw-sw846/sw-846-test-method-8270d-semivolatile-organic-compounds-gas-chromatographymass-spectrometry.html
- [47]Uzu G, Sobanska S, Sarret G, Muñoz M, Dumat C (2010). Foliar lead uptake by lettuce exposed to atmospheric fallouts. Environmental Science & Technology, 44(3), 1036–1042. https://doi.org/10.1021/es902190u
- [48]Wild SR, Jones KC (1992). Organic chemicals entering agricultural soils in sewage sludges: Screening for their potential to transfer to crop plants and livestock. Science of the Total Environment, 119, 85–119. https://doi.org/10.1016/0048-9697(92)90258-T
- [49]Xu X, Zhang Z, Bao L, Mo L, Yu X, Fan D, Lun X (2017). Influence of rainfall duration and intensity on particulate matter removal from plant leaves. Science of the Total Environment, 609, 11–16. https://doi.org/10.1016/j.scitotenv.2017.07.141
- [50]Yin Y, Impellitteri CA, You SJ, Allen HE (2002). The importance of organic matter distribution and extract soil:solution ratio on the desorption of heavy metals from soils. Science of the Total Environment, 287(1–2), 107–119. https://doi.org/10.1016/s0048-9697(01)01000-2
- [51]Yunker MB, Macdonald RW, Vingarzan R, Mitchell RH, Goyette D, Sylvestre S (2002). PAHs in the Fraser River basin: A critical appraisal of PAH ratios as indicators of PAH source and composition. Organic Geochemistry, 33(4), 489–515. https://doi.org/10.1016/S0146-6380(02)00002-5
- [52]Zhang XL, Tao S, Liu WX, Yang Y, Zuo Q, Liu SZ (2005). Source diagnostics of polycyclic aromatic hydrocarbons based on species ratios: A multimedia approach. Environmental Science & Technology, 39(23), 9109–9114. https://doi.org/10.1021/es0513741