Livelihoods in Informal Urban Settlements
Challenges and Opportunities Faced by Residents of Informal Settlements in Sustaining Their Livelihoods: Evidence from Karu Urban Area, Nasarawa State, Nigeria
Department of Urban and Regional Planning, Nasarawa State University, Keffi, Nigeria
Published October 2026
Abstract
Informal settlements dominate urban landscapes in developing countries, yet evidence on the specific challenges and opportunities residents face in sustaining livelihoods remains limited, particularly in Nigeria's peri-urban interface. This study identifies these challenges and opportunities in Karu Urban Area, Nasarawa State. A cross-sectional descriptive survey design was adopted, collecting data from 380 valid respondents out of 384 sampled through stratified and simple random sampling across four settlement strata (Karu Site, New Karu, Mararaba and New Nyanya, and Ado and Masaka) from an estimated population of 333,800. Structured, interviewer-administered questionnaires captured data on tenure insecurity, water and sanitation access, road access, crime and insecurity, market proximity, economic opportunities, community group membership, and access to microcredit. Descriptive statistics (frequencies, percentages, and mean Likert scores) were employed in Microsoft Excel. Findings reveal that tenure insecurity (66% agree/strongly agree it deters investment), poor water and sanitation (72%), poor road access (60%), and crime/insecurity (74%) are the dominant challenges, while proximity to urban markets (73%) constitutes the principal economic opportunity. Although 57% of respondents perceive economic opportunities within the settlement, 43% report none, revealing uneven access. Better market access (48%) and improved infrastructure (28%) are seen as the most effective improvement pathways, while access to credit (4%) is least emphasized, reflecting limited financial inclusion. Critically, 53.9% belong to community groups, but only 23.42% have access to microcredit, loans, or savings schemes, revealing a substantial gap between social organisation and institutional financial support. The study concludes that the binding constraint is less the absence of social organisation than the absence of formal financial and infrastructural enablement of that organisation. It recommends strengthening market linkages, expanding inclusive microfinance tailored to informal settlements, improving water, sanitation, and road infrastructure, and converting existing social capital into functioning cooperative structures through institutional support and multi-stakeholder partnerships.
Keywords: informal settlements; community livelihoods; challenges; opportunities; tenure insecurity; market access; microcredit; Karu Urban Area
1Introduction
Informal settlements are synonymous with squatter, slum, and squalor characteristics, and are home to the poorest of urban populations globally, including the African continent (UN-Habitat, 2015). The informal settlement is characterised by neighbourhoods where residents have no security of tenure over the land and dwellings they occupy, lack essential infrastructure and services, and do not comply with planning and building codes and regulations, and are mostly found within geographically and environmentally sensitive environments (UN-Habitat, 2015). The social and economic pathology of residents presents overcrowding, deterioration, and unsanitary conditions that do not demonstrate environmental sustainability, and particularly unplanned conditions that prevent the provision of basic urban infrastructure and services to the settlements that make life meaningful (Brown & Eyenghe, 2022).
Informal settlement has become an inseparable part of urbanisation practices in developing countries. It is estimated that the percentage of the urban population in developing countries residing in informal settlements ranges from 30 to 50% (Hoeltl et al., 2020). In Nigeria, informal settlements are marked by many difficulties, such as poverty, unequal income distribution, limited means to basic infrastructure services, and tenure insecurity. The growth of informal settlements continues despite government efforts to address the problem by implementing preventive and remedial measures. These settlements are expanding largely in the peri-urban areas of cities, taking over open spaces and agricultural land (Abebe et al., 2017).
Karu, located on the fringes of the Federal Capital Territory (FCT), has witnessed a significant influx of people due to rural-urban migration and the high cost of living in Abuja. As a result, numerous informal settlements have emerged to accommodate this growing population. These areas, while providing affordable shelter, often lack basic amenities such as potable water, sanitation, healthcare, electricity, and quality education. Furthermore, residents frequently engage in informal economic activities that are unstable, poorly remunerated, and vulnerable to regulatory crackdowns. Although these informal settlements provide crucial housing solutions and economic opportunities for low-income residents, their unregulated nature can also exacerbate urban poverty, social exclusion, and environmental degradation. However, there is a lack of empirical data and localised studies on how these settlements affect the daily lives and livelihoods of the people who reside in them, particularly in Karu, Nasarawa State (UN-Habitat, 2015; Talukdar, 2018).
This study therefore aims to identify the challenges and opportunities faced by residents of informal settlements in sustaining their livelihoods. Understanding these dynamics is vital for policymakers, urban planners, and development practitioners aiming to improve urban living conditions and design inclusive, sustainable cities.
2Literature review
2.1Conceptualising challenges and opportunities in informal settlement livelihoods
The Sustainable Livelihoods Framework (SLF), first defined by Chambers and Conway (1992) and popularised by DFID in the mid-1990s, conceptualises a livelihood as the combination of capabilities, assets (human, social, physical, financial, natural), and activities needed for living. An enduring livelihood is one that withstands shocks, maintains or enhances assets, and benefits both present and future generations. The SLF offers a multidimensional lens to assess how residents in informal settlements mobilise various forms of capital to sustain and improve their livelihoods, highlighting how structural vulnerabilities (e.g., poverty, tenure insecurity) interact with adaptive strategies and external support to shape socio-economic well-being (Chambers & Conway, 1992; DFID, 1999).
Within this framework, challenges can be understood as constraints on the asset base particularly physical capital (housing, infrastructure), financial capital (income, credit), and natural capital (safe water, sanitation) while opportunities represent the enabling factors and accessible assets that residents can mobilise, including social capital (community networks) and locational advantages (market proximity). The SLF thus provides the conceptual basis for identifying both the deficits and resilience factors among vulnerable urban populations in Karu (Chambers & Conway, 1992; UN-Habitat, 2015).
2.2Tenure insecurity as a livelihood challenge
Tenure insecurity is widely recognised as a fundamental constraint on livelihood sustainability in informal settlements. Talukdar (2018) demonstrates that the extra-legal conditions of these settlements expose residents to the constant risk of eviction, leading to property loss and homelessness, while residents often pay a risk-related price premium as landlords attempt to recover potential losses from evictions. Glaeser and Gyourko (2020) argue that restrictive formal housing markets push households into long-term informal arrangements, while insecure tenure discourages housing investment and compels households to allocate income toward rent and risk premiums rather than productive livelihood assets. This finding strongly aligns with the empirical arguments of Talukdar (2018), who demonstrates that insecure tenure discourages housing investment.
2.3Infrastructure deficits: Water, sanitation, and roads
UN-Habitat (2015) defines informal settlements as areas where residents lack legal tenure over the land or structures they occupy, with housing that does not comply with established planning or building codes. Such settlements are often situated in environmentally sensitive or marginal areas and are deprived of essential infrastructure and services needed to ensure safe, healthy, and sustainable living. Consequently, residents face precarious living conditions characterised by inadequate housing, insufficient living space, and limited access to safe water and sanitation. Corburn and Sverdlik (2019) argue that dependence on wells and vendors exposes households to water contamination risks and higher costs, disproportionately affecting low-income populations. Within the SLF, inadequate access to safe water reflects deficits in natural and physical capital that directly affect health, productivity, and household expenditure (Chambers & Conway, 1992).
Poor road access further compounds livelihood challenges. Bertaud (2018) emphasises the role of accessibility and infrastructure in reducing transaction and transport costs for low-income households, arguing that infrastructure quality significantly shapes urban living conditions and access to opportunities. Mukumba (2019) notes that informal settlements often experience incremental but insufficient infrastructure development, with poor drainage and road conditions increasing transportation costs, restricting mobility, and heightening flood risks.
2.4Crime and insecurity
The social characteristics of informal settlements include exclusion from socio-spatial privileges and discrimination that disadvantage residents, while the physical aspects reflect a lack of social amenities and limited access to essential services (UN-Habitat, 2015). More broadly, the legal dimension relates to insecure tenure and non-compliance with urban planning regulations, which reinforce residents' vulnerability. These forms of exclusion often push some dwellers into crime, drug abuse, and prostitution-related behaviours (Mukumba, 2019). However, perceptions of insecurity can be mixed, with some residents developing coping mechanisms or localised social controls that mitigate its impact on livelihoods.
2.5Market proximity as an economic opportunity
In recent years, scholars have shifted the narrative by recognising the agency of informal dwellers and their contributions to economic and urban development. Oteng-Ababio et al. (2019) highlight "informal exceptionalism" and creative entrepreneurship, portraying informal settlers as innovative entrepreneurs who support formal sector wholesalers and retailers, thereby contributing to tax revenues and profitability (Crush et al., 2019). Many residents successfully establish small and medium-sized enterprises that employ fellow settlers, demonstrating that entrepreneurialism and informality are not mutually exclusive (Chien, 2018). Kellett et al. (2016) emphasize the informal economy's role in job creation, while Zhang (2018) underscores the legitimacy of informal settlements in providing affordable housing, generating economic opportunities, and even shaping political participation.
Proximity to urban markets constitutes a principal locational advantage. Bertaud (2018) highlights the trade-off between centrality and transportation costs: centrally located urban areas generally are expensive due to the reduced transportation cost associated with the location, while peripheral urban areas conversely are inexpensive due to the increased transportation costs associated with the location. For informal settlement residents, proximity to urban markets may create opportunities for informal trade but also expose residents to overcrowding, poor housing, and inadequate infrastructure (Park & Burgess, 1925).
2.6Social capital and community organisation
Social Capital Theory (Hanifan, 1916; formalised by Bourdieu, 1986; Coleman, 1988; Putnam, 1993–1995) helps examine how community cohesion, reciprocal networks, and trust among residents of informal settlements impact access to resources, job opportunities, and resilience. In Karu, where formal systems may fail to reach, social capital often underpins informal economies, mutual aid, and neighbourhood solidarity critical for livelihood sustainability and socio-economic well-being. Putnam (1995) introduced a collective perspective, viewing social capital as networks, norms, and trust that enable cooperation for mutual benefit, while Bourdieu (1986) views social networks as critical livelihood resources in contexts where formal institutions are weak.
2.7Access to microcredit and financial inclusion
Limited access to formal financial systems represents a critical constraint on livelihood sustainability. Goytia et al. (2023) and Mottelson (2021) argue that regulatory exclusion and tenure insecurity prevent informal residents from accessing formal financial systems. This supports SLF assertions that limited financial capital constrains households' ability to invest in income-generating activities and cope with shocks (Chambers & Conway, 1992). Visagie and Turok (2020) argue that without secure tenure, formal financial systems remain inaccessible to informal dwellers, reinforcing the need for inclusive financial mechanisms tailored to informal settlements.
2.8Empirical review
Empirical findings align with mainstream economic theory on housing supply restrictions, which suggests that antagonistic approaches to informal urban development in cities where large segments of the population are financially excluded from formal housing markets produce consequences similar to those of restrictive land use policies in the formal sector (Glaeser & Gyourko, 2020). The evidence indicates that residents of informal settlements in Karu Urban Area pay a price premium for insecure tenure, while restrictions on informal urban development intensify pressure on the informal housing market and reduce affordability. Insecure tenure contributes to restricted housing supply, which raises accommodation costs for low-income groups. This dynamic generates spillover effects whereby low-income households are compelled to allocate a disproportionate share of their income toward securing basic shelter, leaving fewer resources for investment in infrastructure, education, health, and other necessities (Talukdar, 2018; Goytia et al., 2023).
3Materials and methods
3.1Study area
Karu Local Government was created in October 1996. Karu was under the jurisdiction of Keffi Local Government. The area's indigenous population consisted of a handful of tribes, and historically, the local people were mainly engaged in agriculture. After the relocation of the seat of the Government of Nigeria from Lagos to Abuja in 1991, the population of the new capital city proliferated. In 1991, the population of the Federal Capital Territory was only 371,674. By 2006, it was 1.4 million, representing an average annual growth rate of 9.3 percent for those 15 years. In 1991, Karu's population was approximately 10,000, growing at an astounding rate of 22.7 percent annually to 216,230 by 2006.
Karu Urban Area in Nasarawa State is a rapidly developing urban area located eastward of Nigeria's capital city, Abuja. Geographically, it lies approximately between 8°58'N and 9°05'N Latitude and 7°55'E and 8°05'E Longitude, sharing boundaries with Abuja Municipal Area Council to the West and North, Nasarawa to the south, Keffi and Kokona LGA to the east. The landscape of Karu is characterised by flat to gently undulating plains, part of the Nigerian Central Highland Plateau, with elevations ranging from about 200 to 300 meters above sea level. Its physical environment supports both agricultural activities and urban development due to its favourable topography.
Karu Urban Area is one of the country's fast-growing and expanding urban centres. Its expansion is out-warding to the peripheral land at the expense of arable and agricultural lands due to building up practice, proximity to the national market, and accessibility for various infrastructures (UN-Habitat, 2012). As a result of this process, many hectares are being changed into urban land uses, which has multiple impacts on the environment and the livelihood of peri-urban farmers. Strategically positioned along major transportation routes, especially the Abuja-Keffi Road, Karu boasts improved accessibility and infrastructure development, including roads, markets, and housing estates. Its proximity to Abuja has spurred rapid urbanisation, leading to the growth of both formal and informal settlements, commercial enterprises, and real estate development. However, this growth presents environmental challenges such as flooding, deforestation, waste management issues, and land degradation.
Karu's socio-economic profile is characterised by a diverse population engaged in various activities, including trading, farming, and employment in urban centres. The area serves as a key peri-urban interface where rural livelihoods intersect with urban opportunities, making it a critical zone for studying urbanisation, livelihood dynamics, and environmental management within Nasarawa State.
3.2Delineation of the study area into sampling strata
Because Karu Urban Area is not internally homogeneous, the study area was delineated, prior to sampling, into four strata that correspond to the recognisable settlement zones along the Abuja-Keffi corridor. This delineation directly supports Objective 2, which requires the identification of challenges and opportunities: characteristics such as settlement age, tenure history, building density, and commercial intensity vary systematically across these zones, and a sampling design that ignores this variation would understate the very relationship the study seeks to examine. The four strata are described in Table 1.
| S/N | Stratum | Defining Characteristics |
|---|---|---|
| 1 | Karu Site | The older, initial settlement located closest to the FCT border, originally established to house federal civil servants relocated with the move of the capital to Abuja; characterised by an ageing building stock and longer-established, more security-of-tenure-conscious households. |
| 2 | New Karu | The official administrative headquarters of Karu Local Government Area in Nasarawa State; a mixed residential and institutional zone with a relatively higher concentration of civil servants and salaried households. |
| 3 | Mararaba and New Nyanya | Highly commercialised, densely built and bustling corridors that serve as the primary residential and transit hubs of the urban area, with the highest population density and the most intensive informal commercial activity. |
| 4 | Ado and Masaka | Rapidly expanding suburban districts further along the Keffi Expressway, absorbing significant new housing demand and characterised by ongoing informal construction and a comparatively younger settlement history. |
Source: Field Survey, 2026
3.3Research design
The study is anchored primarily in the Sustainable Livelihoods Framework (SLF), which conceptualises livelihood outcomes as a function of households' access to human, social, physical, financial and natural capital, mediated by the vulnerability context within which they operate (Chambers & Conway, 1992). The SLF directly informs the grouping of variables: settlement and housing characteristics map onto physical capital, household composition and education onto human capital, community-group membership onto social capital, and income and credit access onto financial capital. The study is further informed by Social Capital Theory (Putnam, 1995), which underlies the variables on community-group membership and cooperative participation addressed under Objectives 2 and 4, and by Urban Ecology Theory (Park & Burgess, 1925), which provides the conceptual basis for treating Karu Urban Area as a spatially differentiated zone rather than a uniform settlement, and therefore underpins the stratification described in Section 3.2.
The study adopts a quantitative, cross-sectional descriptive and correlational survey design (Creswell & Creswell, 2018). The descriptive component addresses Objectives 2 and 4, which ask the study to identify challenges and opportunities and to explore potential strategies; these are appropriately answered through frequency distributions, percentages, and mean Likert scores. The correlational/explanatory component addresses Objectives 1 and 3, which ask the study to examine the relationship between settlement characteristics and livelihood outcomes and to assess the impact of those characteristics on socio-economic well-being; these objectives require inferential statistical testing in addition to description (see Sections 4.1.8 and 4.4.6).
3.4Population of the study
Following the distinction between general, target and accessible population (Asiamah et al., 2017), the general population of the study is the entire population of Karu Urban Area; the target population is restricted to residents of the four informal-settlement-bearing strata identified in the delineation of the study area (Karu Site, New Karu, Mararaba and New Nyanya, and Ado and Masaka); and the accessible population, from which the sample was actually drawn, comprises household heads (or another available adult resident where the household head was absent) within these strata who were present and willing to respond at the time of the survey. Based on Grid3 Nigeria (2025) gridded population and settlement data for Nasarawa State, cross-checked against National Population Commission projections for Karu Local Government Area, the population of Karu Urban Area is estimated at 333,800 persons.
3.5Sample size determination
The sample size of 384 respondents used in this study was not adopted as a round figure but was derived through a transparent, two-stage computation: first by locating the population of 333,800 within the published Krejcie and Morgan (1970) table (Table 2), and second by reproducing that table's underlying formula directly with N = 333,800. The two are then cross-checked against an independent formula (Yamane, 1967, as discussed in Taherdoost, 2017) to confirm the robustness of the figure.
| Population Size (N) | Sample Size (S) |
|---|---|
| 10 | 10 |
| 50 | 44 |
| 100 | 80 |
| 500 | 217 |
| 1,000 | 278 |
| 5,000 | 357 |
| 10,000 | 370 |
| 50,000 | 381 |
| 75,000 | 382 |
| 1,000,000 | 384 |
Karu Urban Area's population of 333,800 falls between the 75,000 and 1,000,000 rows of the published table, an interval for which Krejcie and Morgan (1970) did not tabulate an intermediate value. Rather than interpolate arbitrarily between 382 and 384, the underlying formula was applied directly (Table 3).
| Step | Computation and Value |
|---|---|
| 1. State parameters | X² = 3.841; N = 333,800; P = 0.5; d = 0.05 |
| 2. Compute numerator | X²NP(1-P) = 3.841 × 333,800 × 0.5 × 0.5 = 320,531.45 |
| 3. Compute denominator, first term | d²(N-1) = 0.05² × 333,799 = 0.0025 × 333,799 = 834.4975 |
| 4. Compute denominator, second term | X²P(1-P) = 3.841 × 0.5 × 0.5 = 0.96025 |
| 5. Sum denominator | 834.4975 + 0.96025 = 835.45775 |
| 6. Divide | S = 320,531.45 ÷ 835.45775 = 383.66 |
| 7. Round up to a whole respondent | S = 384 |
This computed value of 383.66, rounded up to 384, is consistent with the asymptotic behaviour of the Krejcie and Morgan formula itself: as N becomes very large, the (N-1) term in the denominator dominates and the formula converges to S → X²P(1-P)/d² = (3.841 × 0.25)/0.0025 = 384.1, which is exactly the ceiling value of 384 shown for N = 1,000,000.
As an additional robustness check, the sample size was independently estimated using Yamane's (1967) simplified formula, n = N ÷ [1 + N(e²)], where e is the margin of error (0.05). Substituting N = 333,800 gives n = 333,800 ÷ [1 + 333,800(0.0025)] = 333,800 ÷ 835.5 = 399.5, rounded to 400. The two formulae diverge slightly at very large N because Yamane's formula has a limiting value of 1/e² = 400 as N → ∞, while the Krejcie and Morgan formula has a limiting value of X²P(1-P)/d² = 384.1; the latter incorporates the chi-square adjustment for a binomial proportion and is the more widely adopted standard in social and educational research (Taherdoost, 2017). The study therefore retains 384 as the working sample size.
A sample of 384 represents approximately 0.115 per cent of the estimated population of 333,800 (384 ÷ 333,800 × 100). This very small proportion is an expected and statistically defensible feature of sampling from large finite populations, not an error: because the margin-of-error gain from adding further respondents becomes negligible once a population exceeds roughly 75,000–100,000 (Israel, 1992), the required sample size effectively plateaus. A total of 384 structured questionnaires were therefore administered, proportionately distributed across the four strata. Allowing for a small number of incomplete or unreturned questionnaires, the realised, fully usable sample reported in the Results ranges from 378 to 380 respondents across individual tables, a response rate of approximately 98.4 to 99.0 per cent.
3.6Sampling technique and procedure
The study adopts a two-stage stratified random sampling design: stratification of the urban area into the four zones identified in the delineation of the study area, followed by simple random selection of respondents within each stratum. This two-stage design was selected because a purely simple random sample, applied without first stratifying, risks over- or under-representing any one of the four structurally distinct zones, whereas stratified random sampling guarantees proportionate representation of each zone while still preserving the equal-probability property of random selection within each (Etikan & Bala, 2017).
3.6.1Stage one: Proportionate stratification
In the absence of a single, disaggregated ward-level census for the four zones, the population of each stratum was apportioned from the total population of 333,800 using a dasymetric, built-up-density-weighted approach consistent with the methodology underlying gridded population products such as Grid3 (Grid3 Nigeria, 2025) and WorldPop (Tatem, 2017), in which population is distributed across a study area in proportion to the relative extent and density of built-up settlement rather than spread evenly across administrative boundaries. On this basis, Mararaba and New Nyanya, the most densely built and commercially intensive corridor, were apportioned the largest share of the population, followed by New Karu, the administrative headquarters, Ado and Masaka, the expanding suburbs, and Karu Site, the smaller, older core. The resulting allocation is given in Table 4.
| S/N | Stratum | Estimated Population (Ni) | Proportion of Total (%) | Proportionate Sample (ni) |
|---|---|---|---|---|
| 1 | Karu Site | 50,070 | 15.0 | 58 |
| 2 | New Karu | 73,436 | 22.0 | 84 |
| 3 | Mararaba & New Nyanya | 133,520 | 40.0 | 154 |
| 4 | Ado & Masaka | 76,774 | 23.0 | 88 |
| Total | 333,800 | 100.0 | 384 |
3.6.2Stage two: Simple random selection within strata
Within each stratum, the sampling element is the individual household, represented by its household head or another available adult resident, since these are the persons who directly experience the socio-economic, environmental, and infrastructural realities of informal settlement and are therefore best placed to report on settlement characteristics, livelihood challenges, well-being, and coping strategies. A household listing was compiled for each stratum through reconnaissance survey, and the stratum's allotted number of respondents was then selected from this listing using simple random sampling, implemented through balloting or a random-number-table interval applied to the household list, so that every household within a given stratum had an equal probability of selection. Information was obtained from selected households through structured questionnaires administered by trained research assistants, in order to minimise the literacy-related response burden.
3.7Sources of data collection
Multiple types of data were acquired and used in performing the analysis needed to achieve the objectives of this study, drawn from both primary and secondary sources.
3.7.1Primary source of data
The primary source of data comprised information gathered directly from the study area through reconnaissance survey, administration of the structured questionnaire, and personal observation of housing and infrastructural conditions, the last of which supplemented and cross-validated respondents' self-reported assessments of building and service conditions.
3.7.2Secondary source of data
Secondary data were drawn from existing literature, encompassing both published and unpublished materials. Published sources comprised relevant journals, institutional reports, and internet-based materials; unpublished sources included postgraduate dissertations, term papers, and other academic works related to the research aim and objectives.
3.8Research instrument design
Data were collected using a structured questionnaire, organised into five sections so that each of the four objectives is served by its own clearly delimited set of items, with a preliminary section capturing respondent and household profile variables. Items addressing perceptions and opinions (for example, on the effect of tenure insecurity, service deprivation, or security on livelihood activities) were measured on a five-point Likert scale (Strongly Disagree, Disagree, Neutral, Agree, Strongly Agree). Given that 12 per cent of respondents in the realised sample report no formal education, the questionnaire was administered through interviewer-assisted, structured interviews rather than self-completion, in order to maintain consistent interpretation of items across literacy levels.
| Cronbach's Alpha (α) | Interpretation |
|---|---|
| α ≥ 0.90 | Excellent internal consistency |
| 0.80 ≤ α < 0.90 | Good internal consistency |
| 0.70 ≤ α < 0.80 | Acceptable internal consistency (minimum threshold adopted in this study) |
| 0.60 ≤ α < 0.70 | Questionable; items reviewed and, where necessary, revised |
| α < 0.60 | Poor; items removed or substantially rewritten |
3.9Method of data analysis
The method of data analysis matches a specific analytical technique to the verb used in each objective. For Objective 2 ("to identify the challenges and opportunities..."), Section C data were analysed descriptively, using frequency counts, simple percentages, and mean Likert scores to rank the relative severity of challenges and the relative importance of opportunities. Descriptive analysis was performed in Microsoft Excel, with a 95 per cent confidence interval and a significance threshold of p < 0.05 applied throughout. Non-statistical tools, principally photographs taken during reconnaissance survey, were also used to enhance data presentation and provide visual context.
3.10Method of data presentation
Data presentation involves transforming raw data into meaningful information through methods that make it accessible, understandable, and useful for decision-making; effective data presentation enhances the clarity of research findings and enables stakeholders to draw accurate and reliable conclusions (Evergreen, 2017). In this study, descriptive results are presented using tables, bar charts, and pie charts to illustrate patterns, relationships, and key insights.
4Results and discussion
4.1Challenges and opportunities faced by residents of informal settlements in sustaining their livelihoods
This section presents the findings on Objective 2, which seeks to identify the challenges and opportunities faced by residents of informal settlements in sustaining their livelihoods. The analysis draws on Section C of the research instrument, covering economic opportunities and challenges available in the settlement, the availability of economic opportunities, community group membership, and access to microcredit, loans, or saving groups.
4.1.1Economic opportunities and challenges available in the settlement
Table 6 presents the economic opportunities available in the study area. The data on access to secured land tenure shows that 42% strongly agreed that lack of access to secured land tenure prevents them from investing to own a house, 24% agreed, while 21%, 10%, and 3% of the respondents' responses show neutral, disagreed, and strongly disagreed respectively. This finding strongly aligns with the empirical arguments of Talukdar (2018) and Glaeser and Gyourko (2020), who demonstrate that insecure tenure discourages housing investment and compels households to allocate income toward rent and risk premiums rather than productive livelihood assets. This result also supports the Sustainable Livelihoods Framework, which emphasises secure physical assets, particularly housing, as foundational to livelihood stability (Chambers & Conway, 1992). Contrary to formal housing market assumptions that informal housing is cheap and flexible, this study agrees with Goytia et al. (2023) that informality introduces hidden economic costs that undermine long-term household resilience. The implication is that without tenure security, livelihood sustainability remains fragile, reinforcing cycles of poverty and discouraging incremental housing improvement.
The data on access to water and corresponding impact on sanitation suggest that 51% and 21% strongly agreed and agreed respectively that poor access to water affects the level of sanitation and consequently the health and productivity of their household. On the other hand, 19%, 4%, and 6% present neutral, disagreed, and strongly disagreed respectively. This suggests that these groups of respondents have adequate access to water. This finding agrees with Corburn and Sverdlik (2019), who argue that dependence on wells and vendors exposes households to water contamination risks and higher costs, disproportionately affecting low-income populations. Within the Sustainable Livelihoods Framework, inadequate access to safe water reflects deficits in natural and physical capital that directly affect health, productivity, and household expenditure (Chambers & Conway, 1992).
The result on road access shows 28%, 43%, and 17% of respondents represent neutral, agreed, and strongly agreed that poor road access reduces their ability to trade and access markets. This suggests that these groups of respondents are located in unplanned sections of the study area and distant away from the market area. While 7% and 5% of the responses show that the respondents strongly disagreed and disagreed respectively. This finding aligns with Bertaud (2018), who emphasises the role of accessibility and infrastructure in reducing transaction and transport costs for low-income households, and with Mukumba (2019), who notes that informal settlements often experience incremental but insufficient infrastructure development.
The response on how crime/insecurity in the area affects livelihood activities shows that 4%, 8% and 15% of the respondents strongly disagreed, disagreed and were neutral, respectively. This implies that the neighbourhoods of these respondents are relatively safe for them to carry out their daily activities. On the other hand, 41% and 33% of the responses show agreed and strongly agreed. This suggests that the majority of the neighbourhoods in the study area suffer some sort of security challenge that hinders them from carrying on with their daily activities safely.
The data shows that 26% and 47% of the respondents agreed and strongly agreed that proximity to urban markets provides opportunities for their households. This implies that the educational level of these groups does not afford them skilled job opportunities. While 3%, 9%, and 16% of respondents strongly disagreed, disagreed, and neutral respectively. This finding is consistent with Oteng-Ababio et al. (2019) and Crush et al. (2019), who highlight the economic legitimacy of informal settlements as spaces of production, trade, and employment, and with Zhang (2018), who recognises informal settlements as legitimate urban economic space.
| S/N | Items | SD | D | N | A | SA | Total |
|---|---|---|---|---|---|---|---|
| 1 | Lack of secure land tenure prevents me from investing in my home. | 11 (3%) | 38 (10%) | 81 (21%) | 91 (24%) | 159 (42%) | 380 (100%) |
| 2 | Poor access to water/sanitation affects my household's health and productivity. | 21 (6%) | 15 (4%) | 72 (19%) | 79 (21%) | 193 (51%) | 380 (100%) |
| 3 | Poor road access reduces my ability to trade and access markets. | 28 (7%) | 19 (5%) | 106 (28%) | 163 (43%) | 64 (17%) | 380 (100%) |
| 4 | Crime/insecurity in the area affects my livelihood activities. | 14 (4%) | 30 (8%) | 56 (15%) | 155 (41%) | 125 (33%) | 380 (100%) |
| 5 | Proximity to urban markets provides business opportunities for my household. | 11 (3%) | 34 (9%) | 60 (16%) | 98 (26%) | 177 (47%) | 380 (100%) |
Source: Field Survey, 2026
4.1.2Availability of economic opportunities
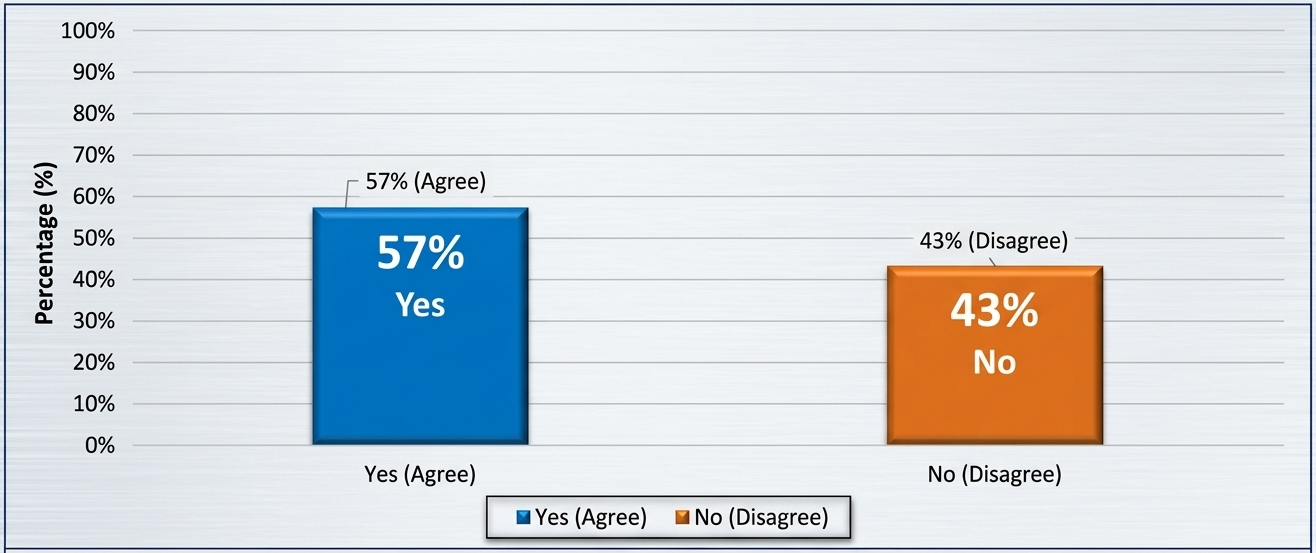
Figure 1 implies that 57% of the respondents agree that there are economic opportunities within the settlement while 43% disagree. This distribution shows that a larger percentage of respondents confirm that there are economic opportunities available in the settlement. This finding agrees with Kellett et al. (2016), who argue that informal settlements function as livelihood hubs despite infrastructural deficits. However, the substantial proportion (43%) reporting no opportunities underscores uneven access to economic capital, reinforcing SLF insights that opportunities alone are insufficient without enabling structures and assets (Chambers & Conway, 1992). The implication is that policy focus should move beyond recognising opportunities to removing structural barriers that prevent households from benefiting from them.
4.1.3Type of opportunities to improve livelihood
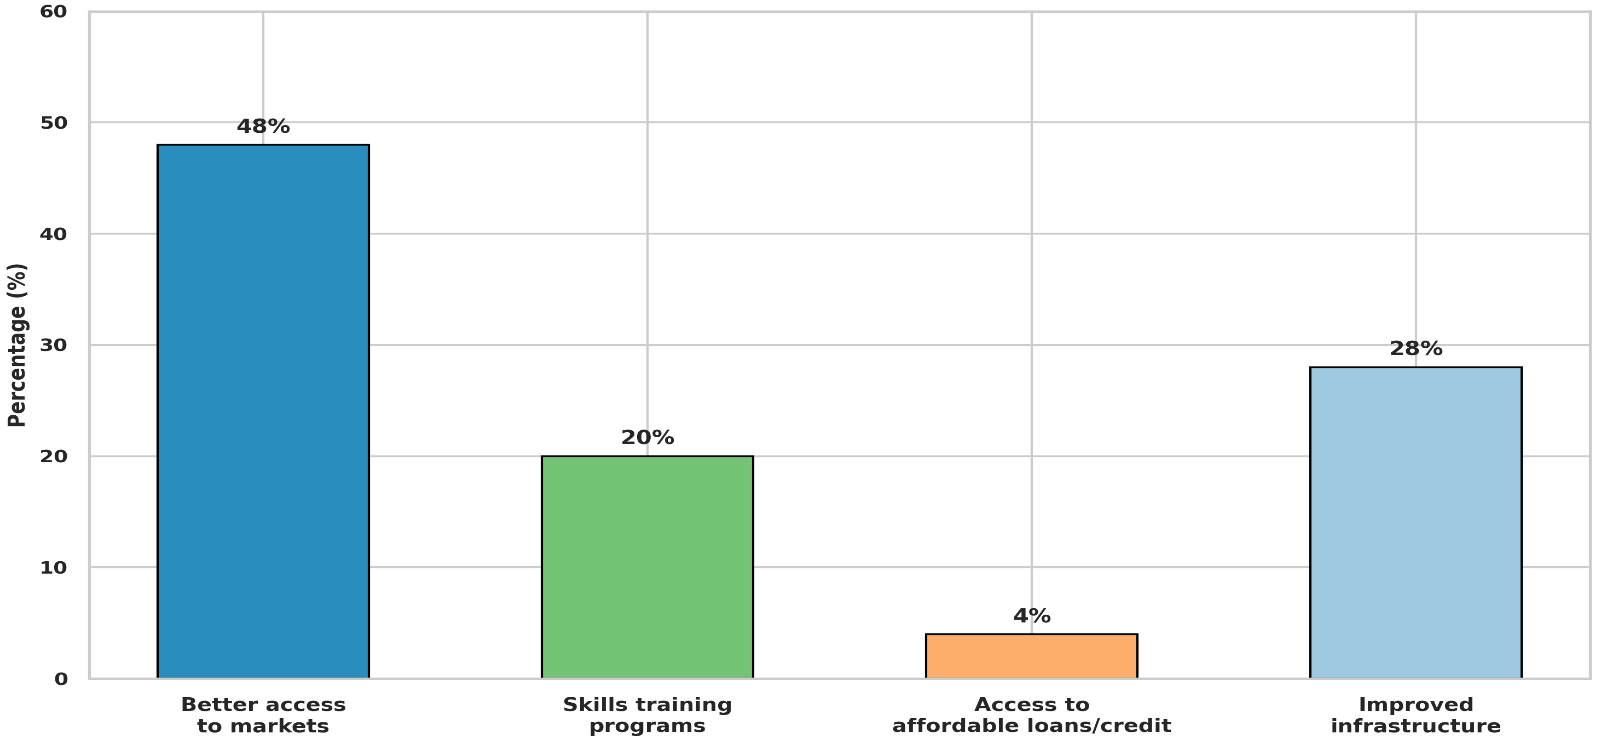
The findings in Figure 2 show that better access to markets (48%) and improved infrastructure (28%) are perceived as the most effective pathways for livelihood improvement. This aligns with Bertaud (2018), who emphasises the role of accessibility and infrastructure in reducing transaction and transport costs for low-income households. The relatively lower emphasis on access to credit (4%) reflects limited financial inclusion, consistent with Visagie and Turok (2020), who argue that without secure tenure, formal financial systems remain inaccessible to informal dwellers. The implication is that livelihood enhancement strategies should prioritise infrastructure and market access before financial interventions.
4.1.4Community group membership
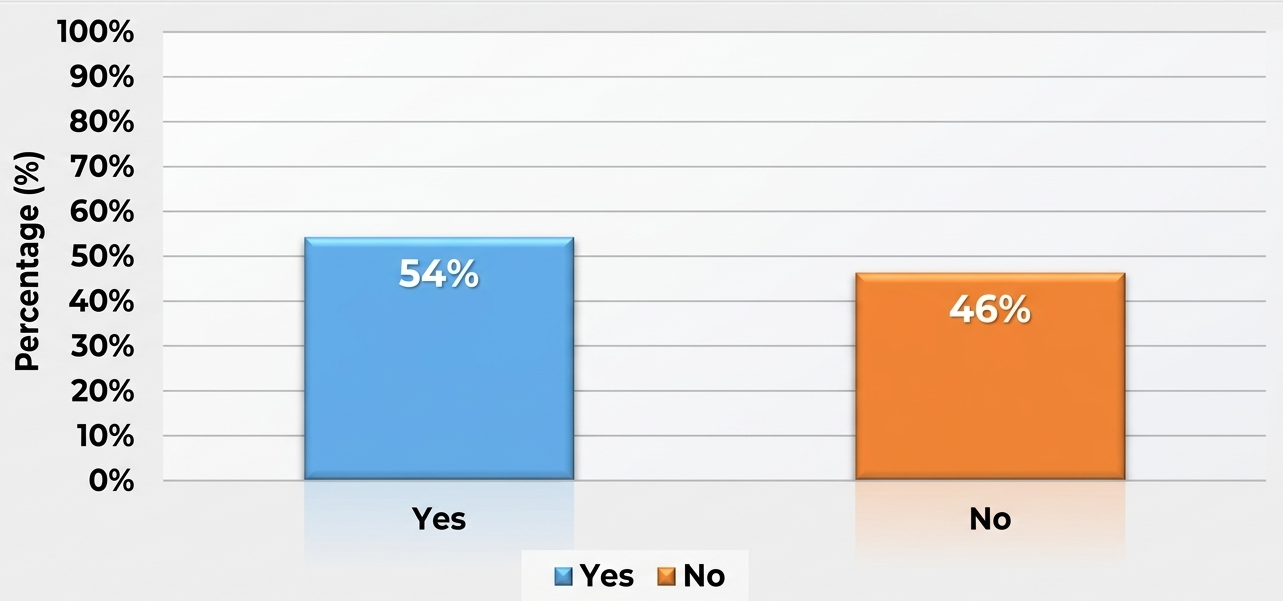
Figure 3 shows that 53.9% of the respondents are members of a community group while 46.1% are not members of any community group, supporting Social Capital Theory's assertion that networks and trust enable cooperation for mutual benefit (Putnam, 1995). This aligns with Bourdieu (1986), who views social networks as critical livelihood resources in contexts where formal institutions are weak. However, the near-equal proportion of non-members suggests social fragmentation in parts of the settlement, potentially limiting collective resilience. The implication is that strengthening community organisations can enhance livelihood resilience and improve engagement with external development actors.
4.1.5Access to microcredit, loans, or saving groups
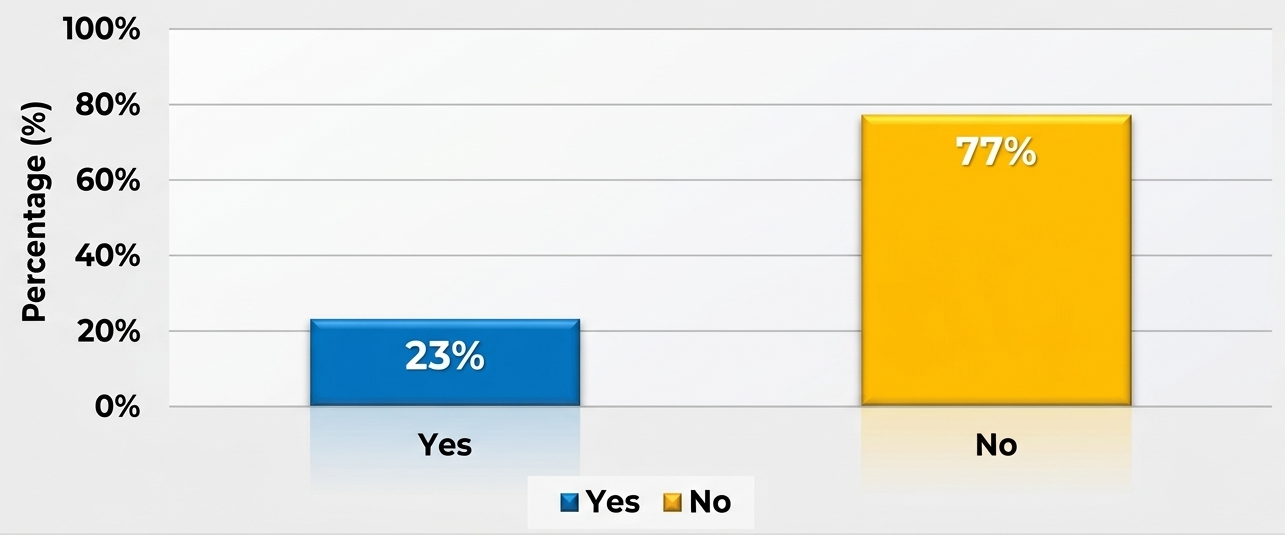
Figure 4 reveals that 23.42% of the respondents have access to microcredit, loans, or saving groups while 76.58% do not have access. This shows a higher percentage do not have access to loans, microcredit, or saving groups. This finding aligns with Goytia et al. (2023) and Mottelson (2021), who argue that regulatory exclusion and tenure insecurity prevent informal residents from accessing formal financial systems. This supports Sustainable Livelihoods Framework assertions that limited financial capital constrains households' ability to invest in income-generating activities and cope with shocks (Chambers & Conway, 1992). The implication is that expanding inclusive financial mechanisms tailored to informal settlements is critical for livelihood sustainability.
4.2Discussion of findings
The findings on Objective 2 reveal a complex picture of livelihood challenges and opportunities in Karu's informal settlements. Tenure insecurity emerges as the most severe challenge, with 66% of respondents agreeing or strongly agreeing that lack of secure land tenure prevents them from investing in their homes. This finding strongly aligns with the empirical arguments of Talukdar (2018) and Glaeser and Gyourko (2020), who demonstrate that insecure tenure discourages housing investment and compels households to allocate income toward rent and risk premiums rather than productive livelihood assets. This result also supports the Sustainable Livelihoods Framework, which emphasises secure physical assets, particularly housing, as foundational to livelihood stability (Chambers & Conway, 1992). Contrary to formal housing market assumptions that informal housing is cheap and flexible, this study agrees with Goytia et al. (2023) that informality introduces hidden economic costs that undermine long-term household resilience. The implication is that without tenure security, livelihood sustainability remains fragile, reinforcing cycles of poverty and discouraging incremental housing improvement.
Poor access to water and sanitation is the second most severe challenge, with 72% of respondents agreeing or strongly agreeing that it affects their household's health and productivity. This finding agrees with Corburn and Sverdlik (2019), who argue that dependence on wells and vendors exposes households to water contamination risks and higher costs, disproportionately affecting low-income populations. Within the Sustainable Livelihoods Framework, inadequate access to safe water reflects deficits in natural and physical capital that directly affect health, productivity, and household expenditure (Chambers & Conway, 1992). The implication is that limited access to improved water sources exacerbates health vulnerabilities and reduces disposable income, negatively impacting overall socio-economic well-being.
Poor road access is the third most severe challenge, with 60% of respondents agreeing or strongly agreeing that it reduces their ability to trade and access markets. This finding aligns with Bertaud (2018), who emphasises the role of accessibility and infrastructure in reducing transaction and transport costs for low-income households, and with Mukumba (2019), who notes that informal settlements often experience incremental but insufficient infrastructure development. Poor drainage and road conditions increase transportation costs, restrict mobility, and heighten flood risks, reinforcing Bertaud's (2018) argument that infrastructure quality significantly shapes urban living conditions and access to opportunities. The implication is that upgrading roads and drainage systems can improve accessibility, reduce environmental risks, and enhance overall well-being.
Crime and insecurity are the fourth most severe challenge, with 74% of respondents agreeing or strongly agreeing that it affects their livelihood activities. This finding partially diverges from studies that associate informal settlements with heightened insecurity (Mukumba, 2019), suggesting that while insecurity exists, residents may have developed coping mechanisms or localised social controls that mitigate its impact on livelihoods. The implication is that security interventions should build on existing community-based protection mechanisms rather than imposing external solutions.
Proximity to urban markets emerges as the principal economic opportunity, with 73% of respondents agreeing or strongly agreeing that it provides business opportunities for their households. This finding is consistent with Oteng-Ababio et al. (2019) and Crush et al. (2019), who highlight the economic legitimacy of informal settlements as spaces of production, trade, and employment, and with Zhang (2018), who recognises informal settlements as legitimate urban economic space. The implication is that policy should leverage this locational advantage by improving market infrastructure and reducing barriers to market participation.
The finding that 57% of respondents perceive economic opportunities to exist within the settlement, while 43% report none, underscores uneven access to economic capital, reinforcing SLF insights that opportunities alone are insufficient without enabling structures and assets (Chambers & Conway, 1992). The implication is that policy focus should move beyond recognising opportunities to removing structural barriers that prevent households from benefiting from them.
The finding that better access to markets (48%) and improved infrastructure (28%) are perceived as the most effective improvement pathways aligns with Bertaud (2018), who emphasises the role of accessibility and infrastructure in reducing transaction and transport costs for low-income households. The relatively lower emphasis on access to credit (4%) reflects limited financial inclusion, consistent with Visagie and Turok (2020), who argue that without secure tenure, formal financial systems remain inaccessible to informal dwellers. The implication is that livelihood enhancement strategies should prioritise infrastructure and market access before financial interventions.
The finding that 53.9% of respondents are members of a community group, while only 23.42% have access to microcredit, loans, or savings schemes, reveals a substantial gap between social organisation and institutional financial support. This finding aligns with Goytia et al. (2023) and Mottelson (2021), who argue that regulatory exclusion and tenure insecurity prevent informal residents from accessing formal financial systems. This supports SLF assertions that limited financial capital constrains households' ability to invest in income-generating activities and cope with shocks (Chambers & Conway, 1992). The implication is clear: the binding constraint is less the absence of social organisation than the absence of formal financial and infrastructural enablement of that organisation. Expanding inclusive financial mechanisms tailored to informal settlements is critical for livelihood sustainability.
5Conclusion and recommendations
5.1Conclusion
This study set out to identify the challenges and opportunities faced by residents of informal settlements in sustaining their livelihoods in Karu Urban Area, Nasarawa State. Drawing on a cross-sectional survey of 380 valid respondents across four settlement strata, and anchored in the Sustainable Livelihoods Framework, Social Capital Theory, and Urban Ecology Theory, the study concludes that residents face mutually reinforcing challenges of tenure insecurity (66% agree/strongly agree it deters investment), poor water and sanitation (72%), poor road access (60%), and crime/insecurity (74%), set against a genuine but unevenly distributed set of opportunities centred on market proximity (73%) and the existence of (but limited access to) credit and cooperative mechanisms.
The study further concludes that the coexistence of relatively high community-group membership (53.9%) with low microcredit access (23.42%) indicates that the binding constraint is less the absence of social organisation than the absence of formal financial and infrastructural enablement of that organisation. The finding that 57% of respondents perceive economic opportunities to exist within the settlement, while 43% report none, underscores the unevenness of access to economic capital. Better market access (48%) and improved infrastructure (28%) are seen as the most effective improvement pathways, while access to credit (4%) is least emphasised, reflecting limited financial inclusion. These findings collectively demonstrate that while informal settlements in Karu possess genuine economic vitality and social capital, the potential of these assets is constrained by infrastructural deficits, institutional exclusion, and insecure tenure.
5.2Recommendations
Based on the findings of this study on the challenges and opportunities faced by residents of informal settlements in sustaining their livelihoods, the following recommendations are proposed:
5.2.1Strengthen market linkages and infrastructure
Given that proximity to urban markets is the principal economic opportunity (73% agree/strongly agree) and that better access to markets (48%) and improved infrastructure (28%) are perceived as the most effective improvement pathways, the Nasarawa State Government and Karu Local Government should prioritise the construction and rehabilitation of feeder roads connecting informal settlements to major markets, the establishment of satellite market infrastructure within or adjacent to settlements, and the provision of market stalls and storage facilities for informal traders. These interventions should be designed in consultation with residents and market associations to ensure they address actual trading patterns and needs.
5.2.2Expand inclusive microfinance tailored to informal settlements
Given that only 23.42% of respondents have access to microcredit, loans, or savings groups, while 53.9% are members of community groups, there is a clear opportunity to convert existing social capital into financial inclusion. The Central Bank of Nigeria, through its financial inclusion strategy, should partner with microfinance banks, cooperative societies, and non-governmental organisations to design and deliver financial products tailored to informal settlement residents including group-based lending, savings schemes linked to community groups, and flexible repayment schedules aligned with informal income flows. Tenure status should not be used as a prerequisite for access to these products, and digital financial services should be leveraged to reduce transaction costs and expand reach.
5.2.3Improve water, sanitation, and road infrastructure
Given that poor access to water and sanitation (72% agree/strongly agree) and poor road access (60% agree/strongly agree) are among the most severe challenges, the Nasarawa State Government should prioritise incremental infrastructure upgrading in informal settlements. This should include the provision of boreholes and protected wells, the construction of communal sanitation facilities, the rehabilitation of drainage systems, and the grading and laterite surfacing of access roads. These interventions should be implemented in phases, with community participation in planning and maintenance, and should be linked to broader upgrading programmes rather than stand-alone projects.
5.2.4Strengthen community organisations and convert social capital into institutional capacity
Given that 53.9% of respondents already belong to community groups, but only 23.42% have access to formal financial mechanisms, there is substantial latent social capital that current institutional structures have not yet captured. The Nasarawa State Government, in partnership with NGOs and development agencies, should establish a Community Organisation Strengthening Programme that provides training in cooperative management, financial literacy, and project planning to existing community groups; supports the formal registration of cooperatives; and facilitates linkages between community groups and formal financial institutions, government agencies, and development partners. This programme should prioritise groups in the most disadvantaged strata (Karu Site and Ado/Masaka) where access to external support is most limited.
5.2.5Enhance security through community-based approaches
Given that 74% of respondents agree or strongly agree that crime and insecurity affect their livelihood activities, the Nigeria Police Force and Karu Local Government should partner with community groups to establish community policing structures, support neighbourhood watch schemes with training and resources, and improve street lighting in high-crime areas. These interventions should build on existing community-based protection mechanisms rather than imposing external solutions, and should be designed in consultation with residents to address their specific security concerns.
5.2.6Leverage locational advantage through planning
Given that proximity to urban markets is the principal economic opportunity (73% agree/strongly agree), urban planners and policymakers should recognise and formalise this advantage by designating trading zones within or adjacent to informal settlements, providing secure tenure for market stalls and trading spaces, and integrating informal settlements into the broader urban economy through transport and market infrastructure. The Abuja-Keffi corridor's strategic position should be leveraged to connect Karu's informal settlements to Abuja's markets and employment centres through improved public transport and road infrastructure.
5.2.7Promote multi-stakeholder partnerships for comprehensive upgrading
Successful transformation requires collaboration between government agencies, NGOs, private sector actors, and academia. Public-private partnerships can mobilise needed resources and technical expertise. Academic institutions should be leveraged for data collection, impact assessments, and innovation in upgrading technologies. Coordination platforms that align objectives and activities across sectors will maximise positive outcomes (Cirolia & Scheba, 2019; Nwalo et al., 2025). The Nasarawa State Government should establish a Karu Urban Upgrading Partnership that brings together the state government, Karu Local Government, the Federal Capital Territory Administration, development partners, NGOs, community representatives, and the private sector to coordinate interventions and mobilise resources.
5.2.8Leverage digital tools for data management and transparency
Integrate geographic information systems (GIS), mobile applications, and other digital tools to map settlements, monitor infrastructure progress, and improve service delivery transparency. These tools facilitate evidence-based decision-making and help build trust among residents, planners, and funders (Ismail, 2024). A GIS-based monitoring system for Karu's informal settlements should be established to track progress on infrastructure provision, tenure regularisation, and livelihood indicators, and to provide a basis for evidence-based planning and resource allocation.
Implementing these recommendations in a holistic manner will significantly improve the socio-economic conditions, tenure security, and resilience of residents in Karu and similar informal settlements, fostering inclusive urban growth aligned with Nigeria's sustainable development goals.
References
- [1]Abebe MS, Derebew KT, Gemeda DO (2017). Explaining the growth of informal settlements in Ethiopia. Environment and Urbanization, 29(2), 455–472.
- [2]Asiamah N, Mensah HK, Oteng-Abayie EF (2017). General, target, and accessible population: Demystifying the concepts for effective sampling. The Qualitative Report, 22(6), 1607–1621. https://doi.org/10.46743/2160-3715/2017.2674
- [3]Bertaud A (2018). Order without design: How markets shape cities. MIT Press.
- [4]Bourdieu P (1986). The forms of capital. In J. Richardson (Ed.), Handbook of theory and research for the sociology of education (pp. 241–258). Greenwood.
- [5]Brown I, Eyenghe T (2022). A qualitative narrative of lived experiences of informal settlements dwellers within Port Harcourt municipality during the Covid-19 pandemic. Asian Journal of Environment & Ecology, 19(4), 47–57. https://doi.org/10.9734/AJEE/2022/v19i4418
- [6]Chambers R, Conway G (1992). Sustainable rural livelihoods: Practical concepts for the 21st century (IDS Discussion Paper 296). Institute of Development Studies.
- [7]Chien KH (2018). Entrepreneurialising urban informality: Transforming governance of informal settlements in Taipei. Urban Studies, 55(13), 2886–2902.
- [8]Cirolia LR, Scheba A (2019). Strategies for upgrading informal settlements: Lessons from South Africa. Habitat International, 88, Article 101989. https://doi.org/10.1016/j.habitatint.2019.101989
- [9]Coleman JS (1988). Social capital in the creation of human capital. American Journal of Sociology, 94(Supplement), S95–S120.
- [10]Connelly LM (2008). Pilot studies. Medsurg Nursing, 17(6), 411–412.
- [11]Corburn J, Sverdlik A (2019). Slum upgrading and health equity. International Journal of Environmental Research and Public Health, 14(4), Article 342.
- [12]Creswell JW, Creswell JD (2018). Research design: Qualitative, quantitative, and mixed methods approaches (5th ed.). SAGE Publications.
- [13]Cronbach LJ (1951). Coefficient alpha and the internal structure of tests. Psychometrika, 16(3), 297–334. https://doi.org/10.1007/BF02310555
- [14]Crush J, Chikanda A, Skinner C (2019). Informal economies and urban livelihoods in the Global South. Routledge.
- [15]Department for International Development (1999). Sustainable livelihoods guidance sheets. DFID.
- [16]Etikan I, Bala K (2017). Sampling and sampling methods. Biometrics & Biostatistics International Journal, 5(6), 215–217. https://doi.org/10.15406/bbij.2017.05.00149
- [17]Evergreen SDH (2017). Effective data visualization: The right chart for the right data. SAGE Publications.
- [18]Glaeser EL, Gyourko J (2020). Housing markets and informal settlement growth. Journal of Urban Economics, 117, 103–118.
- [19]Goytia C, Heikkila EJ, Pasquini RA (2023). Do land use regulations help give rise to informal settlements? Evidence from Buenos Aires. Land Use Policy, 125, Article 106484.
- [20]Grid3 Nigeria (2025). Population and settlement layers for Nasarawa State. Geo-Referenced Infrastructure and Demographic Data for Development Programme.
- [21]Hanifan LJ (1916). The rural school community center. Annals of the American Academy of Political and Social Science, 67(1), 130–138.
- [22]Hoeltl A, Brandtweiner R, Bates R, Berger T (2020). The interactions of sustainable development goals: The case of urban informal settlements in Ethiopia. International Journal of Sustainable Development and Planning, 15, 287–294.
- [23]Ismail NA (2024). Institutional approaches to urban informal settlements dynamics: A case study of Abuja, Nigeria. Urban Studies Journal, 61(2), 364–379. https://doi.org/10.1016/j.urbstud.2023.11.004
- [24]Israel GD (1992). Determining sample size (PEOD-6). University of Florida, Institute of Food and Agricultural Sciences Extension.
- [25]Kellett P, Mahabir R et al. (2016). Informal settlements as livelihood hubs: A comparative perspective.
- [26]Krejcie RV, Morgan DW (1970). Determining sample size for research activities. Educational and Psychological Measurement, 30(3), 607–610.
- [27]Mottelson J (2021). Affordability and overcrowding in informal housing markets.
- [28]Mukumba J (2019). Informal settlement, security and infrastructure development.
- [29]Nwalo I et al. (2025). Multi-stakeholder partnerships for informal settlement upgrading in Nigeria.
- [30]Oteng-Ababio M, Tanle A, Amoah ST, Kusi L, Kosoe EA, Bagson E (2019). "Informal exceptionalism?" Labour migrants' creative entrepreneurship for sustainable livelihoods in Accra, Ghana. Journal of Asian and African Studies, 54(1), 88–103.
- [31]Park RE, Burgess EW (1925). The city: Suggestions for investigation of human behavior in the urban environment. University of Chicago Press.
- [32]Putnam RD (1993). Making democracy work: Civic traditions in modern Italy. Princeton University Press.
- [33]Putnam RD (1995). Bowling alone: America's declining social capital. Journal of Democracy, 6(1), 65–78.
- [34]Resnik DB (2020). What is ethics in research and why is it important? National Institute of Environmental Health Sciences.
- [35]Taherdoost H (2016). Validity and reliability of the research instrument: How to test the validation of a questionnaire/survey in research. International Journal of Academic Research in Management, 5(3), 28–36.
- [36]Taherdoost H (2017). Determining sample size: How to calculate survey sample size. International Journal of Economics and Management Systems, 2, 237–239.
- [37]Talukdar D (2018). Informal housing and the tenure-investment nexus.
- [38]Tatem AJ (2017). WorldPop, open data for spatial demography. Scientific Data, 4, Article 170004. https://doi.org/10.1038/sdata.2017.4
- [39]UN-Habitat (2012). State of the world's cities 2012/2013: Prosperity of cities. United Nations Human Settlements Programme.
- [40]UN-Habitat (2015). Habitat III issue paper 22: Informal settlements. United Nations Human Settlements Programme.
- [41]Visagie J, Turok I (2020). Getting urban density to work in informal settlements in Africa. Environment and Urbanization, 32(2), 351–370.
- [42]Yamane T (1967). Statistics: An introductory analysis (2nd ed.). Harper & Row.
- [43]Zhang Y (2018). The credibility of slums: Informal housing and urban governance in India. Land Use Policy, 79, 876–890