Sustainability Reporting
Environmental Cost Disclosure and Pricing of Consumer Goods: A Conceptual and Empirical Review
1Department of Accounting, Faculty of Management Sciences, Ajayi Crowther University, Oyo, Oyo State, Nigeria
2Department of Accounting and Finance, Faculty of Management Sciences, Ajayi Crowther University, Oyo, Oyo State, Nigeria
Published October 2026
Abstract
Firms in Nigeria’s consumer goods sector now carry environmental costs that barely featured in their cost structures two decades ago, yet little is known about whether these costs end up in the prices households pay. This paper brings together the concepts, theories and empirical evidence on that question. Environmental accounting is treated as having four strands: environmental cost disclosure, pollution control expenditure, waste management costs and sustainability reporting. Stakeholder theory serves as the main lens, supported by legitimacy, institutional, contingency and resource-based perspectives. Twenty-two published empirical studies, mostly Nigerian and dated 2019 to 2025, are reviewed. They link environmental costs and disclosures mainly to profitability, earnings and firm value, and their results point in different directions depending on the sector, the cost category and the performance measure used. None measures product prices directly. Survey evidence from 213 staff of consumer goods manufacturers in Lagos State is then presented to fill part of this gap. Regression estimates show that pollution control expenditure (β = 0.312), waste management costs (β = 0.276), environmental cost disclosure (β = 0.198) and sustainability reporting (β = 0.164) all relate positively and significantly to pricing, and together account for 67.2% of its variation. The paper concludes that, in the view of those who set them, consumer goods prices in Lagos absorb a substantial part of firms’ environmental costs. It calls for uniform disclosure rules, tax relief for cleaner technology, and price-based studies across other states and sectors.
Keywords: environmental accounting; environmental cost disclosure; pollution control expenditure; waste management costs; consumer goods pricing
1Introduction
Explanations for high consumer prices in Nigeria usually begin with the familiar list: inflation, a weak and volatile naira, dependence on imported inputs, poor roads and insecurity. The National Bureau of Statistics (2025) put headline inflation at 34.80% in December 2024, with food inflation at 39.84%. Behind these headline pressures sits a quieter one that has received far less attention. Manufacturers are now expected to pay for emission controls, effluent treatment, waste disposal, environmental audits and sustainability reports. Each of these outlays must be paid for either out of margins or by charging customers more.
The regulatory push behind these costs has grown steadily. The National Environmental Standards and Regulations Enforcement Agency (NESREA) sets and enforces national standards on emissions, effluents and waste, and in Lagos the Lagos State Environmental Protection Agency (LASEPA) oversees the state’s dense industrial clusters. On the reporting side, the Nigerian Stock Exchange (2018) issued Sustainability Disclosure Guidelines requiring listed companies to publish sustainability reports, although the guidelines carry no formal sanctions and rely on market pressure for compliance.
Environmental accounting is the discipline that captures and communicates these costs. Its spread in Nigeria has been uneven, and evidence suggests that it depends far more on the choices of individual firms than on outside pressure (Iredele et al., 2020). Research on the subject has grown quickly, but it has asked mostly whether environmental spending and disclosure raise profits, earnings per share or market value. The question of whether these costs are passed on through product prices, which is the point at which consumers feel them, has gone largely unasked.
This review takes up that question. It sets out to (1) clarify the core concepts; (2) explain, through relevant theory, why firms disclose environmental costs and how those costs might enter pricing; (3) review recent empirical work and identify what it leaves unanswered; and (4) report survey evidence from consumer goods manufacturers in Lagos State. Section 2 deals with concepts, Section 3 with theory, Section 4 with the empirical literature, Section 5 with the survey evidence and Section 6 with discussion, conclusions and recommendations.
2Conceptual review
2.1Environmental accounting
Conventional accounting was not built to see the natural environment. Air, water and land enter the books as free inputs, and spending on environmental matters is usually lost inside general overheads, out of sight of the managers who might act on it. Environmental accounting tries to correct this by identifying environmental costs, measuring them and reporting them in a form that is useful for decisions.
The discipline works on two fronts. Inside the firm, environmental management accounting (EMA) supplies information for cost control, investment appraisal and strategy. Appannan et al. (2023), surveying 145 managers of ISO 14001-certified Malaysian firms, found that EMA carries the benefits of pollution prevention and clean technology strategies through to improved environmental performance. Outside the firm, environmental accounting underpins the disclosures made to investors, regulators, host communities and customers. In Nigeria, Iredele et al. (2020) found that EMA practice lags behind that of South African firms and is shaped mainly by organisational factors, whereas in South Africa regulatory (coercive) pressure is the main driver.
2.2Environmental cost disclosure
Environmental cost disclosure refers to the reporting, in annual reports or stand-alone documents, of amounts spent on pollution control, waste handling, remediation, employee health and safety and related activities. It lets outsiders judge how seriously a firm takes its environmental obligations and compare it with peers. International frameworks, notably the Global Reporting Initiative, provide indicators for such reporting, and the Nigerian guidelines encourage their use (Nigerian Stock Exchange, 2018).
Disclosure is not always what it seems. Legitimacy research warns that firms may disclose to manage impressions rather than to account for real performance (Deegan, 2002). Its link with pricing is therefore not straightforward. Credible disclosure could earn the consumer trust that supports a higher price; equally, it could simply draw attention to costs that customers would rather not fund.
2.3Pollution control expenditure
Pollution control expenditure covers spending on abatement equipment, emission and effluent monitoring, environmental audits and staff training aimed at keeping discharges within legal limits. Some of it is capital spending on end-of-pipe treatment; the rest is recurring operating cost. For a manufacturer it behaves much like any other production cost. It must be recovered through price or it erodes margins, and how much can be recovered depends on how sensitive demand is to price and how hard competitors push back.
Evidence from outside Nigeria shows that cost recovery through prices can be substantial. Ganapati et al. (2020) estimated that roughly 70% of energy-driven cost increases in United States manufacturing were passed on to buyers in higher output prices, with the rate varying considerably between industries. A weakness specific to Nigeria is uneven enforcement. Where some firms comply and others do not, compliant firms risk being undercut on price by competitors who avoid the cost.
2.4Waste management costs
Waste management costs include collection, treatment, disposal, recycling and investment in waste-reducing processes. For consumer goods makers, packaging is a large part of the waste stream, since most packaging becomes refuse as soon as the product is used. These costs are usually charged to overhead accounts, which makes them hard to trace to individual products and therefore hard to price accurately. EMA techniques can bring them into view, and circular-economy practices such as reuse and recycling can reduce them.
2.5Sustainability reporting
Sustainability reporting is broader than cost disclosure. It covers a firm’s use of energy and materials, its emissions, its treatment of workers and communities and its governance. Reports may sit inside the annual report or stand alone. Firms that report well may gain in reputation, access to finance and customer loyalty. Among Nigerian consumer goods firms, however, reporting quality varies widely, and Adegbayibi et al. (2024) found that environmental sustainability reporting had no significant bearing on financial reporting quality in the sector.
2.6Pricing of consumer goods
Prices are set where marketing judgement meets cost accounting. They reflect production costs, competitors’ prices, buyers’ incomes and preferences, the availability of substitutes and the general state of the economy. Fast-moving consumer goods are bought often and in small quantities, so buyers notice small price changes and firms tend to price close to their rivals.
The central idea linking environmental costs to price is cost pass-through: the share of a cost increase that reaches the buyer as a higher price. Pass-through is greater where firms have market power or differentiated brands and smaller where close substitutes exist (Ganapati et al., 2020). Environmental credentials can themselves act as a source of differentiation, but only if consumers believe them.
2.7Firm-specific characteristics
Firm size and production cost structure are likely to shape how environmental costs affect price. Large firms can spread compliance costs over a bigger output and may absorb them, while smaller firms have less room to do so. Firms already carrying high production costs have little margin left and are more likely to raise prices. The relationship also runs both ways. Environmental accounting adds cost, but it can also expose savings in materials, energy and waste. For these reasons, size and production cost are treated as moderators in the framework adopted here.
3Theoretical framework
3.1Stakeholder theory
Freeman (1984) argued that managers answer not only to shareholders but to everyone with a stake in the firm’s activities, including employees, customers, suppliers, government and the communities around its plants; later work extended this to the natural environment (Freeman et al., 2010). From this standpoint, environmental accounting is a response to stakeholders’ demand for information about how the firm affects them. For pricing, the theory allows two outcomes. A firm with a long horizon may absorb environmental costs to protect relationships. A firm whose environmental record is valued by customers may instead charge more. Stakeholder theory is adopted as the main lens because it captures this full range of competing expectations.
3.2Legitimacy theory
Legitimacy theory holds that firms depend on society’s acceptance and adjust their behaviour, and their reporting, to keep it (Deegan, 2002). Environmental disclosure is one of the main tools used to build or repair legitimacy, particularly after pollution incidents. A firm that retains legitimacy may be able to sustain higher prices, while one that loses it may face boycotts and falling demand. The theory also cautions that disclosure can be symbolic.
3.3Institutional theory
Institutional theory explains why organisations in the same field come to resemble one another. They respond to coercive pressure from regulators, normative pressure from professions and mimetic pressure to copy successful peers (DiMaggio & Powell, 1983; Meyer & Rowan, 1977). The theory helps explain why Nigerian EMA practice, where coercive pressure is weak, depends so much on the individual firm (Iredele et al., 2020). It also implies that pass-through will depend on how much pressure falls on a firm’s rivals as well as on the firm itself.
3.4Contingency theory
Contingency theory holds that there is no single best way to organise; the right arrangement depends on a firm’s circumstances (Burns & Stalker, 1961; Woodward, 1958). Applied to accounting, it suggests that the form and effects of environmental accounting will vary with size, technology, production complexity and regulatory exposure. Iredele et al. (2020) found support for both institutional and contingency explanations of EMA practice. The theory supports the treatment of size and production cost as moderators.
3.5Resource-based view
The resource-based view traces lasting competitive advantage to resources and capabilities that rivals find hard to copy (Wernerfelt, 1984). A well-developed environmental accounting capability may be one of them if it helps a firm cut costs, develop greener products and present a credible environmental profile. Agustia et al. (2019) found that EMA links green innovation to firm value among Indonesian listed companies, which is consistent with this view.
3.6Conceptual framework
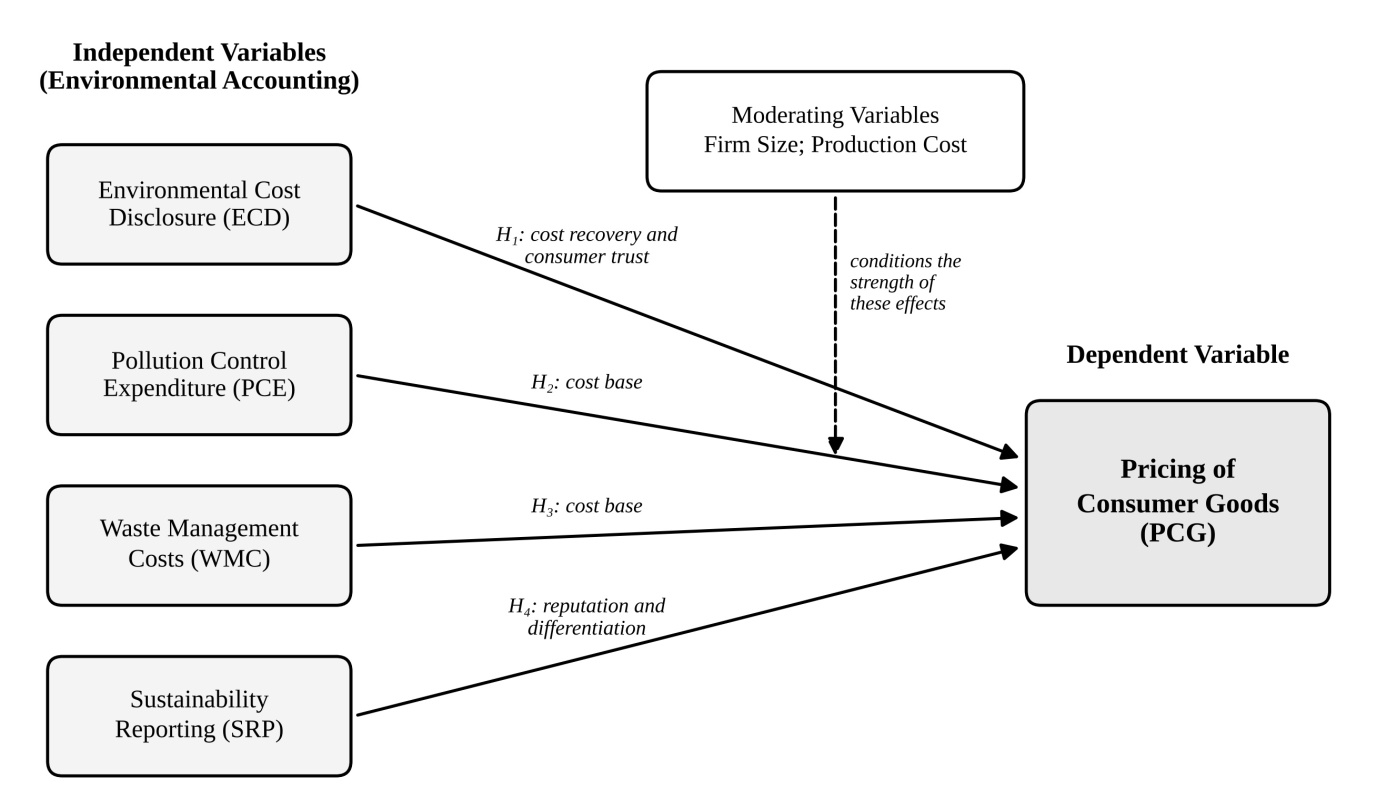
The review adopts a model in which environmental cost disclosure, pollution control expenditure, waste management costs and sustainability reporting are the explanatory variables and the pricing of consumer goods is the outcome. Disclosure is expected to work both through cost recovery and through consumer trust. Pollution control and waste costs work mainly through the cost base. Sustainability reporting works through reputation and differentiation. Firm size and production cost are expected to condition these effects. The framework is shown in Figure 1.
4Empirical review
The review covers twenty-two journal articles. Eighteen deal with Nigeria, one with the Philippines, one with Indonesia, one with large multinationals and one with United States manufacturing. Every source was checked against its publisher or repository record. The studies are discussed by theme below and summarised in Table 1.
4.1Environmental costs and performance of consumer goods firms
Evidence on Nigerian consumer goods companies is mixed. Ezenwafor and Ifi (2023), using panel least squares on sixteen firms over 2013–2022, found that environmental cost had a weak positive effect on return on equity but a negative effect on return on assets. Okoli and Okoye (2025) studied sixteen listed consumer goods firms over 2012–2023 and found that disclosures on employee health and safety, pollution control and environmental remediation each had a significant negative effect on return on capital employed. Umar and Saleh (2025), using data on seventeen firms for 2013–2023, reported that community development spending was positively related to net profit margin. Jonathan and Adegbie (2024) found that environmental conservation costs significantly affected earnings per share and net profit margin among ten consumer firms over 2012–2021.
4.2Environmental disclosure and performance
Studies of disclosure lean towards positive results, though with exceptions. Chude et al. (2023) found that green accounting practices raised return on assets among 21 consumer goods manufacturers between 2011 and 2017, with no significant effect on return on equity. Emuebie et al. (2021) found that social and environmental disclosure significantly influenced return on assets in sixteen consumer goods firms but not earnings per share. Odum and Obiano (2023) showed that environmental protection disclosure raised earnings per share among sixteen consumer goods firms over 2012–2021, while disclosures on donations, training and welfare had no significant effect. Dagunduro et al. (2024), using feasible generalised least squares on all 21 listed consumer goods firms over 2013–2022, found positive effects for environmental and social disclosure but a negative effect for governance disclosure. Ezekwere and Ikilidi (2024) also found environmental protection disclosure significant for eighteen consumer goods firms.
Across wider manufacturing samples, Ibrahim et al. (2023) found that environmental information disclosure raised return on assets among eleven industrial and consumer goods firms, while disclosures on employee health and safety and product safety lowered it. Sanni and Usman (2024), using a balanced panel of 52 manufacturers over 2016–2022, found that environmental policy, cost and performance disclosures all significantly influenced performance. Olaniyan et al. (2025) found that energy conservation, emission reduction and pollution control disclosure improved financial performance, whereas waste management disclosure was negatively associated with it. In the industrial goods sector, Ezeji and Okoye (2025) found that environmental sustainability reporting reduced economic value added, even as social and economic reporting increased it.
4.3Environmental cost components and firm value
When costs are separated by type, their effects differ. Mohammed et al. (2025) found that pollution cost raised firm value (Tobin’s Q) among nine industrial goods companies over 2013–2022, while health and safety and waste management costs lowered it. Ali-Momoh et al. (2024), studying 28 manufacturers over 2013–2023, found that sustainable practices increased environmental costs while regulatory compliance alone did not, which suggests that firms’ voluntary choices matter more than rules in shaping these costs.
4.4Reporting quality and management practice
Adegbayibi et al. (2024) found that environmental sustainability reporting had a positive but insignificant effect on financial reporting quality among 21 consumer goods firms, while economic sustainability reporting significantly reduced it. Mbonu and Amahalu (2023) showed that benchmarking, total quality management, activity-based costing and outsourcing each significantly increased disclosure of waste management costs among eleven consumer goods firms. The role of activity-based costing is notable because it is the costing tool most capable of tracing environmental overheads to products.
4.5Evidence from other settings
International results caution against assuming a uniformly positive picture. Carandang and Ferrer (2020) found that environmental disclosure on its own had no significant effect on profitability or firm value among 24 Philippine mining and oil companies, although environmental cost reporting did matter once firm characteristics were taken into account. Riyadh et al. (2020) found that green accounting costs were negatively related to return on capital employed among the world’s 100 largest multinationals. Agustia et al. (2019) showed that environmental management accounting links green innovation to firm value in 277 Indonesian firms. Ganapati et al. (2020) found that about 70% of energy cost increases were passed on to buyers in United States manufacturing. Closer to the consumer goods sector, Ajike et al. (2025) found that green logistics practices supported the financial sustainability of Nigerian fast-moving consumer goods firms.
| Author(s) and year | Setting | Sample and period | Outcome measure | Main finding |
|---|---|---|---|---|
| Ezenwafor & Ifi (2023) | Consumer goods, Nigeria | 16 firms, 2013–2022 | ROE, ROA | Weak positive effect on ROE; negative effect on ROA |
| Okoli & Okoye (2025) | Consumer goods, Nigeria | 16 firms, 2012–2023 | ROCE | Health and safety, pollution control and remediation disclosures negative and significant |
| Umar & Saleh (2025) | Consumer goods, Nigeria | 17 firms, 2013–2023 | Net profit margin | Community development spending positive |
| Jonathan & Adegbie (2024) | Consumer goods, Nigeria | 10 firms, 2012–2021 | EPS, NPM | Environmental conservation costs significant |
| Chude et al. (2023) | Consumer goods, Nigeria | 21 firms, 2011–2017 | ROA, ROE | Positive and significant on ROA; insignificant on ROE |
| Emuebie et al. (2021) | Consumer goods, Nigeria | 16 of 20 firms | ROA, EPS | Significant on ROA; insignificant on EPS |
| Odum & Obiano (2023) | Consumer goods, Nigeria | 16 firms, 2012–2021 | EPS | Environmental protection disclosure positive and significant |
| Dagunduro et al. (2024) | Consumer goods, Nigeria | 21 firms, 2013–2022 | Firm performance | Environmental and social disclosure positive; governance disclosure negative |
| Ezekwere & Ikilidi (2024) | Consumer goods, Nigeria | 18 firms | Financial performance | Environmental protection disclosure significant |
| Adegbayibi et al. (2024) | Consumer goods, Nigeria | 21 firms, 2012–2022 | Reporting quality | Environmental reporting positive but insignificant |
| Mbonu & Amahalu (2023) | Consumer goods, Nigeria | 11 firms and 36 staff, 2011–2022 | Waste cost disclosure | Strategic management practices positive and significant |
| Ibrahim et al. (2023) | Industrial and consumer goods, Nigeria | 11 firms, 2012–2021 | ROA | Environmental information positive; health, safety and product safety negative |
| Sanni & Usman (2024) | Manufacturing, Nigeria | 52 firms, 2016–2022 | Performance | Policy, cost and performance disclosures significant |
| Olaniyan et al. (2025) | Manufacturing, Nigeria | 15 firms | Financial performance | Pollution control and emission reduction positive; waste management negative |
| Ali-Momoh et al. (2024) | Manufacturing, Nigeria | 28 firms, 2013–2023 | Environmental cost | Sustainable practices raise costs; compliance alone does not |
| Mohammed et al. (2025) | Industrial goods, Nigeria | 9 firms, 2013–2022 | Tobin’s Q | Pollution cost positive; waste and health costs negative |
| Ezeji & Okoye (2025) | Industrial goods, Nigeria | 9 firms, 2012–2024 | Economic value added | Environmental reporting negative; social and economic reporting positive |
| Ajike et al. (2025) | FMCG, Nigeria | 502 respondents | Financial sustainability | Green logistics positive and significant |
| Carandang & Ferrer (2020) | Mining and oil, Philippines | 24 firms, 2012–2016 | NPM, ROE, Tobin’s Q | Disclosure alone not significant |
| Riyadh et al. (2020) | Multinationals | 100 firms, 2018 | ROCE | Green accounting costs negative |
| Agustia et al. (2019) | Listed firms, Indonesia | 277 firms, 2012–2015 | Firm value | EMA mediates green innovation |
| Ganapati et al. (2020) | Manufacturing, United States | Industry data | Output prices | About 70% of energy cost increases passed through |
Source: Compiled by the authors from the studies cited.
4.6Gaps in the literature
Four gaps stand out. First, the Nigerian studies measure profitability, earnings or value; not one measures the effect of environmental costs on the prices of the goods sold, even though Ezenwafor and Ifi (2023) and others discuss pricing in passing. Second, almost all rely on figures taken from annual reports, so the judgement of the accountants and managers who actually set prices is missing. Third, results differ sharply by cost type and outcome measure: pollution costs appear helpful in some studies and harmful in others, and waste costs likewise. Fourth, direct evidence on how consumers respond to environmental cost pass-through in Nigeria is very thin.
5Supporting survey evidence
5.1Design and data
To address the first two gaps, a descriptive survey was carried out among consumer goods manufacturers in Lagos State. Twenty companies in food and beverages, home and personal care, pharmaceuticals and household durables were selected purposively from members of the Manufacturers Association of Nigeria, Lagos Chapter. Within these companies, respondents were drawn by stratified random sampling from four units: accounting and finance, environment and sustainability, production and operations, and marketing and sales. A G*Power calculation (f² = 0.15, α = 0.05, power = 0.95) indicated a minimum of 117 respondents. Of 238 questionnaires sent through Google Forms, 213 usable responses were returned, a rate of 89.5%.
Most respondents were between 31 and 50 years old (70.5%), held at least a first degree (78.9%) and had over five years of work experience (78.4%). The largest groups worked in accounting and finance (38.5%) and sustainability (27.2%). Each construct was measured with five statements on a five-point Likert scale. Five subject experts reviewed the instrument for content validity, and exploratory factor analysis was used to check construct validity. Cronbach’s alpha ranged between 0.841 and 0.889 across constructs and reached 0.912 for the instrument as a whole.
The model estimated was:
where PCG denotes pricing of consumer goods, ECD environmental cost disclosure, PCE pollution control expenditure, WMC waste management costs and SRP sustainability reporting practices. Each coefficient was expected to be positive.
5.2Descriptive and correlation results
Mean scores showed agreement on every construct: 3.87 for environmental cost disclosure, 3.92 for pollution control expenditure, 3.96 for waste management costs, 3.79 for sustainability reporting and 3.88 for pricing. The statements with the strongest agreement concerned spending on waste disposal and treatment (4.15), reporting environmental costs in annual statements (4.12) and investing in pollution control equipment (4.08). Respondents also agreed that environmental costs are built into pricing decisions (4.02) and that waste costs are recovered from consumers (3.75). The weakest item was disclosure to stakeholders on request (3.64), which suggests that firms disclose mainly because reporting rules require it.
Each explanatory variable was positively correlated with pricing at the 1% level: pollution control expenditure (r = 0.618), waste management costs (r = 0.596), environmental cost disclosure (r = 0.542) and sustainability reporting (r = 0.487). Correlations among the explanatory variables lay between 0.412 and 0.578, and variance inflation factors between 1.42 and 1.89, so multicollinearity was not a problem.
5.3Regression results
The four variables together explained 67.2% of the variation in pricing (Table 2; R = 0.820; adjusted R² = 0.665; F(4, 208) = 89.47, p < 0.001; Durbin-Watson = 1.87). Each null hypothesis was rejected at the 5% level.
| Variable | B | Std. error | Beta | t | p | Decision |
|---|---|---|---|---|---|---|
| Constant | 0.847 | 0.312 | — | 2.715 | 0.007 | — |
| Pollution control expenditure | 0.312 | 0.062 | 0.348 | 5.032 | < 0.001 | H₀₂ rejected |
| Waste management costs | 0.276 | 0.059 | 0.301 | 4.678 | < 0.001 | H₀₃ rejected |
| Environmental cost disclosure | 0.198 | 0.058 | 0.213 | 3.414 | 0.001 | H₀₁ rejected |
| Sustainability reporting practices | 0.164 | 0.056 | 0.178 | 2.929 | 0.004 | H₀₄ rejected |
Source: Field survey, 2026.
Pollution control expenditure had the largest standardised effect, followed by waste management costs, environmental cost disclosure and sustainability reporting.
6Discussion, conclusion and recommendations
6.1Discussion
Environmental cost disclosure. Disclosure was positively related to pricing (β = 0.198). This fits the stakeholder and legitimacy view that reporting signals commitment and builds the trust on which a price premium can rest. It sits well with Odum and Obiano (2023) and Ibrahim et al. (2023), who found environmental disclosure associated with better earnings and returns, and it adds a pricing channel to that evidence. It differs from Carandang and Ferrer (2020), whose Philippine extractive firms gained nothing from disclosure alone. One likely reason is that consumer goods firms sell branded products directly to households and so have more room to pass costs on than commodity producers. The low score for disclosure on request, however, suggests that Nigerian firms report to satisfy rules rather than to engage stakeholders, which gives some weight to the concern that disclosure may be partly symbolic (Deegan, 2002).
Pollution control expenditure. Pollution control had the strongest association with pricing (β = 0.312). This is what the pass-through argument predicts, and its size is broadly in line with the substantial pass-through rates reported for United States manufacturing by Ganapati et al. (2020). It also helps reconcile the conflicting Nigerian evidence. Mohammed et al. (2025) found pollution costs raised firm value, while Okoli and Okoye (2025) found pollution control disclosure lowered return on capital employed. If firms recover pollution costs gradually through prices, short-run returns may fall even as long-run value is protected.
Waste management costs. Waste costs also had a strong positive association with pricing (β = 0.276). Olaniyan et al. (2025) and Mohammed et al. (2025) both found waste costs harmful to financial outcomes. Taken together with the present result, this suggests that firms may treat waste costs as a burden to be recovered from customers rather than as a source of efficiency. As Lagos tightens its rules on plastics and packaging, this pressure on prices is likely to grow unless firms reduce waste at source.
Sustainability reporting. Sustainability reporting had the smallest effect, though it was still significant (β = 0.164). Its modest size is consistent with Adegbayibi et al. (2024), who found environmental reporting had little bearing on reporting quality, and with Ezeji and Okoye (2025), who found it lowered economic value added. Reports that are voluntary in practice and inconsistent in format may do little to persuade consumers, which limits any premium they can support.
Overall, the findings support the resource-based view that firms able to manage and communicate environmental performance can set themselves apart. They also support the contingency view that the extent of pass-through depends on sector and market conditions.
6.2Conclusion
Existing research has treated environmental accounting mainly as a matter of profitability and firm value, and its findings vary with sector, cost category and measure. Its consequences for prices have been neglected. The survey evidence reported here suggests that, in the eyes of the staff who manage them, consumer goods firms in Lagos State recover a large part of their environmental costs through prices. Pollution control expenditure is the most important channel, followed by waste costs, disclosure and sustainability reporting. Environmental regulation in this sector therefore appears to be funded in large part by consumers.
6.3Recommendations
- 1. Manufacturers should trace environmental costs to products through environmental management accounting and activity-based costing, so that any price increase reflects real cost and can be explained to customers.
- 2. Firms should shift from end-of-pipe controls towards cleaner production and waste reduction at source, which lowers long-run compliance costs and eases pressure on prices.
- 3. Regulators, including NESREA, LASEPA, the Financial Reporting Council and the Nigerian Exchange, should standardise environmental cost disclosure and attach consequences to non-compliance, so that reports are comparable and credible.
- 4. Government should consider tax credits or accelerated capital allowances for pollution control and recycling investment, with particular support for smaller producers, so that the cost of compliance does not fall entirely on households.
6.4Limitations and further research
The survey captures the perceptions of staff in Lagos firms rather than observed prices, and the moderating effects of firm size and production cost were proposed but not tested. Future work should combine survey responses with actual price and cost data, estimate those moderating effects, extend coverage to other states and sectors, and measure Nigerian consumers’ willingness to pay for environmentally responsible products.
References
- [1]Adegbayibi AT, Adu BO, Oyedokun OI (2024). Sustainability reporting and financial reporting quality of listed consumer goods firms in Nigeria. Journal of Global Accounting, 10(2), 78–101. https://journals.unizik.edu.ng/joga/article/view/4157
- [2]Agustia D, Sawarjuwono T, Dianawati W (2019). The mediating effect of environmental management accounting on green innovation–firm value relationship. International Journal of Energy Economics and Policy, 9(2), 299–306.
- [3]Ajike EO, Nwaulune JC, Olubiyi TO, Bamidele AG (2025). Financial sustainability of fast-moving consumer goods companies in Nigeria: The role of green logistics practices. Asian Interdisciplinary and Sustainability Review, 14(1), Article 4. https://doi.org/10.14456/aisr.2025.4
- [4]Ali-Momoh BO, Ogundele JO, Adegun TJ, Braimoh OA, Ilo OA, Bejide MK, Fabiyi AD (2024). Environmental cost and firm sustainability in Nigeria. Acta Universitatis Danubius. Œconomica, 20(3), 120–140.
- [5]Appannan JS, Mohd Said R, Ong TS, Senik R (2023). Promoting sustainable development through strategies, environmental management accounting and environmental performance. Business Strategy and the Environment, 32(4). https://doi.org/10.1002/bse.3227
- [6]Burns T, Stalker GM (1961). The management of innovation. Tavistock.
- [7]Carandang JC, Ferrer RC (2020). Effect of environmental accounting on financial performance and firm value of listed mining and oil companies in the Philippines. Asia-Pacific Social Science Review, 20(1), Article 11. https://doi.org/10.59588/2350-8329.1287
- [8]Chude DI, Chude NP, Egbunike FC (2023). Green accounting practices and corporate performance: Evidence from quoted consumer goods manufacturing companies in Nigeria. Journal of Global Accounting, 8(3), 53–65. https://journals.unizik.edu.ng/joga/article/view/1419
- [9]Dagunduro ME, Falana GA, Ajayi JO, Boluwaji OD (2024). Non-financial disclosure and firm performance: Insights from listed consumer goods manufacturing companies in Nigeria. Economy, Business and Development: An International Journal, 5(1), 14–27. https://doi.org/10.47063/ebd.00015
- [10]Deegan C (2002). The legitimising effect of social and environmental disclosures: A theoretical foundation. Accounting, Auditing & Accountability Journal, 15(3), 282–311.
- [11]DiMaggio PJ, Powell WW (1983). The iron cage revisited: Institutional isomorphism and collective rationality in organizational fields. American Sociological Review, 48(2), 147–160.
- [12]Emuebie E, Olaoye SA, Ogundajo GO (2021). Effect of social and environmental disclosure on the performance of listed consumer goods producing companies in Nigeria. International Journal of Applied Economics, Finance and Accounting, 11(1), 35–47.
- [13]Ezeji JN, Okoye PVC (2025). Sustainability reporting and financial performance of listed industrial goods firms in Nigeria. Journal of Global Accounting, 11(5), 157–194. https://journals.unizik.edu.ng/joga/article/view/7108
- [14]Ezekwere U, Ikilidi J (2024). Effect of green accounting disclosure and financial performance: A study of consumer goods firms in Nigeria. Journal of the Management Sciences, 61(7), 1–19. https://journals.unizik.edu.ng/jfms/article/view/4620
- [15]Ezenwafor JI, Ifi CC (2023). The impact of environmental cost accounting on profitability of consumer goods companies in Nigeria. NAU Journal of Technology and Vocational Education, 8(1). https://journals.unizik.edu.ng/naujtved/article/view/4810
- [16]Freeman RE (1984). Strategic management: A stakeholder approach. Pitman.
- [17]Freeman RE, Harrison JS, Wicks AC, Parmar BL, de Colle S (2010). Stakeholder theory: The state of the art. Cambridge University Press.
- [18]Ganapati S, Shapiro JS, Walker R (2020). Energy cost pass-through in US manufacturing: Estimates and implications for carbon taxes. American Economic Journal: Applied Economics, 12(2), 303–342. https://doi.org/10.1257/app.20180474
- [19]Ibrahim R, Ibrahim YK, Hussain MS (2023). Environmental reporting and financial performance of listed industrial and consumer goods firms in Nigeria. FUDMA Journal of Accounting and Finance Research, 1(2), 123–140. https://doi.org/10.33003/fujafr-2023.v1i2.41.123-140
- [20]Iredele OO, Tankiso M, Adelowotan MO (2020). The influence of institutional isomorphism and organisational factors on environmental management accounting practices of listed Nigerian and South African firms. South African Journal of Accounting Research, 34(3), 183–204. https://doi.org/10.1080/10291954.2019.1675254
- [21]Jonathan MN, Adegbie FF (2024). Environmental conservation costs and performance of manufacturing companies listed in Nigeria. International Journal of Latest Technology in Engineering, Management & Applied Science, 13(4), 11–21.
- [22]Mbonu CM, Amahalu NN (2023). Strategic management and environmental disclosure of listed consumer goods companies in Nigeria. International Journal of Research Publication and Reviews, 4(6), 2658–2668.
- [23]Meyer JW, Rowan B (1977). Institutionalized organizations: Formal structure as myth and ceremony. American Journal of Sociology, 83(2), 340–363.
- [24]Mohammed B, Murtala S, Shuaibu K (2025). Effects of environmental costs on the value of listed industrial goods companies in Nigeria. Kashere Journal of Management Sciences, 8(2). https://www.journals.fukashere.edu.ng/index.php/kjms/article/view/875
- [25]National Bureau of Statistics (2025). Consumer price index: December 2024. National Bureau of Statistics.
- [26]Nigerian Stock Exchange (2018). Sustainability disclosure guidelines. The Nigerian Stock Exchange.
- [27]Odum AN, Obiano MO (2023). Voluntary disclosure and financial performance of listed consumer goods firms in Nigeria. Journal of Global Accounting, 9(2), 138–179. https://journals.unizik.edu.ng/joga/article/view/2193
- [28]Okoli EO, Okoye EI (2025). Managing the eco-environmental cost and firms performance in Nigeria: The public consumer goods firms in perspective. Journal of Contemporary Issues in Accounting, 6(2), 109–127. https://journals.unizik.edu.ng/jocia/article/view/8013
- [29]Olaniyan NO, Adekanmi AD, Ekundayo AT, Abiloro RB (2025). Environmental disclosure practices and financial performance of selected manufacturing companies in Nigeria. Acta Scientiarum Polonorum. Oeconomia, 24(3), 15–29. https://doi.org/10.22630/ASPE.2025.24.3.10
- [30]Riyadh HA, Al-Shmam MA, Huang HH, Gunawan B, Alfaiza SA (2020). The analysis of green accounting cost impact on corporations financial performance. International Journal of Energy Economics and Policy, 10(6), 421–426.
- [31]Sanni M, Usman MK (2024). Corporate environmental reporting practices and performance of listed manufacturing companies in Nigeria. African Accounting and Finance Journal, 6(1), 18–41. https://doi.org/10.26686/aafj.v6i1.9683
- [32]Umar N, Saleh A (2025). Impact of community development on financial performance of some listed consumer goods firms in Nigeria. ADSU International Journal of Applied Economics, Finance and Management, 10(3). https://ajaefm.adsu.edu.ng/index.php/journals/article/view/232
- [33]Wernerfelt B (1984). A resource-based view of the firm. Strategic Management Journal, 5(2), 171–180.
- [34]Woodward J (1958). Management and technology. Her Majesty’s Stationery Office.