Machine Learning
Explainable AI for Hospital Mortality Prediction Using the eICU Collaborative Research Database
B.Tech Information Technology, Bharati Vidyapeeth (Deemed to be University), College of Engineering, Pune, India
Published October 2026
Abstract
An exploratory and leakage-aware machine-learning workflow for prediction of mortality of patients hospitalized in an ICU using the eICU Collaborative Research Database Demo version 2.0.1 is described in this study. From 2,520 ICU stays, features are extracted as combinations of demographic and admission parameters along with laboratory and vital signs data recorded during the first 24 hours. Repeated measurements are aggregated on the ICU stay level, highly incomplete features are removed and missing values are processed as part of the machine learning pipeline. As a result of preprocessing there are 2,092 stays and 170 hospital deaths in the final cohort. Logistic regression and random forest models are trained and tested using cross-validation with health-system stay-aware five folds and an unseen test set split to groups. Cross-validation ROC-AUC values for the models are 0.7644 ± 0.0215 for logistic regression and 0.7791 ± 0.0178 for random forest. For the test set, the values are 0.7554 and 0.7615 respectively, and the PR-AUC values are 0.3136 and 0.2097. Features with the largest SHAP attribution values in case of the random forest include respiration, age, heart rate, blood urea nitrogen and creatinine. In addition, issues with class imbalance, threshold selection, missingness and individual-level explanations are considered. Results are provided as an illustrative workflow rather than as a deployable prediction system.
Keywords: clinical prediction; electronic health records; explainable artificial intelligence; hospital mortality; intensive care; SHAP
1Introduction
Electronic health records contain extensive information on the patient's condition that can be used for predictive modeling. In intensive care, repeated measurements such as heart rate, respiratory rate, oxygen saturation, blood chemistry measurements and blood counts can be performed and might characterize a rapidly changing patient status. One of the possible tasks in intensive care is the prediction of mortality that might aggregate this information into an estimate of risk; however, the proper evaluation of such a model requires careful cohort creation, validation, missing values processing and analysis.
In the context of explainable artificial intelligence, various approaches to explaining the input-output relation of the machine learning models have been developed. Methods based on Shapley values (SHAP) allow estimation of the contribution of the input variables in predictions in an additive manner [3].
This study describes in detail the whole exploratory workflow created with the help of the eICU Demo dataset: dataset exploration, definition of the outcome, feature construction for the first 24 hours, missingness analysis, preprocessing, class imbalance management, leakage-free splitting, logistic regression and random forest training, grouped cross-validation, threshold selection, ROC and PR evaluation, and SHAP explanation.
2Dataset and cohort
2.1eICU Collaborative Research Database
The eICU Collaborative Research Database Demo version 2.0.1 is a real deidentified critical care dataset available through PhysioNet [1]. The demo dataset consists of more than 2,500 ICU stays from more than 20 large hospitals in the USA and is intended for database exploration, development and testing of analysis code and reproducing results [1]. The full eICU database contains more than 200,000 ICU stays [2].
This analysis utilized the patient, lab, and vitalPeriodic tables. The patient table provided demographic, admission, and discharge data; the lab table provided laboratory measurements and time offsets; and the vitalPeriodic provided physiologic measurements. Patient-unit stay IDs were used to link measurements between tables.
2.2Outcome definition
The discharge state at the end of hospitalization was chosen as the outcome. Patient-unit stays marked "Expired" were encoded as mortality = 1 and those marked "Alive" as mortality = 0. Out of the 2,520 patient-unit stays initially available, 2,280 were alive, 212 were expired, and 28 did not have a hospital discharge state. The 28 stays without outcome were excluded.
2.3Encounter structure
Following the cleaning for outcomes, 2,492 ICU stays were available with unique patient-unit stay ID. 2,149 unique health-system stays were available. However, there were only 1,892 unique health-system stays in the modeling cohort since we retained only those patient-unit stays with complete vital and laboratory feature tables within the first 24 hours of stay.
3First-24-hour feature engineering
3.1Temporal filtering
For predicting an early outcome, the observations with offsets between 0 and 1,440 minutes following ICU admission were kept. The number of observations for the laboratory table is 434,660 across 147 different laboratory tests where 98,870 are in the first 24 hours. The number of observations for the vitalPeriodic table is 1,634,960 where 553,846 are in the first 24 hours.
3.2Vital-sign features
The seven variables of vital signs included temperature, oxygen saturation, heart rate, respiration, systemic systolic pressure, systemic diastolic pressure, and systemic mean pressure. Mean values of 24 hours were calculated for each ICU stay. Later, temperature and the three summary measures of systemic blood pressure were dropped due to high missingness.
3.3Laboratory features
Glucose, potassium, sodium, creatinine, blood urea nitrogen, hemoglobin, white blood cell count, platelet count, and bicarbonate were chosen among nine laboratory variables. The mean value of the observation in the first 24 hours was taken for each ICU stay.
3.4Demographic and admission features
Age, sex, ethnicity, admission height, and admission weight were extracted from the patient table. The resulting feature tables were joined by patient-unit stay identifier. The inner join resulted in 2,092 ICU stays with 23 columns where vital sign variables with missingness were removed. Seventeen predictor variables remained after removing them. The workflow is shown in Figure 2.

4Data quality and preprocessing
4.1Missingness analysis
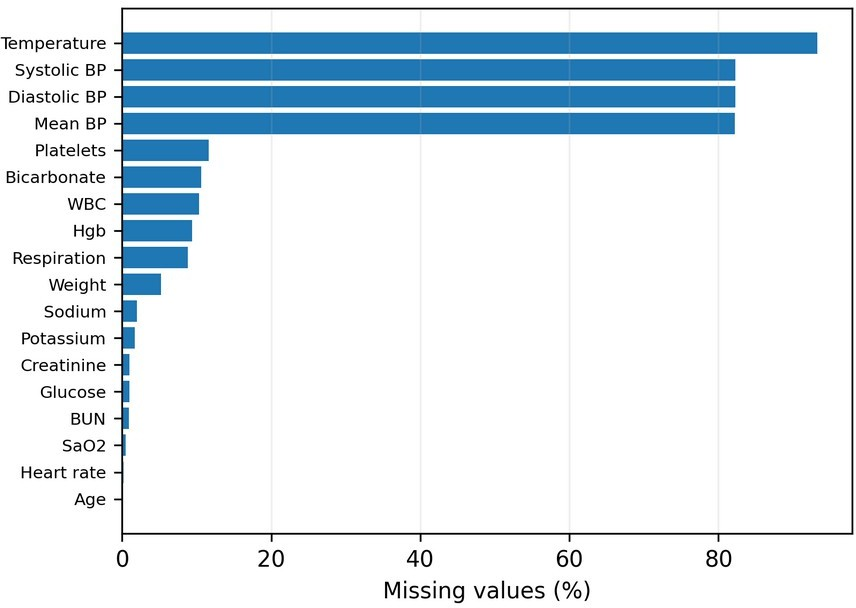
Missingness was explicitly checked after merging of features. Temperature was about 93.3% missing, whereas systolic, diastolic, and mean pressure were above 82% missing. Platelets, bicarbonate, white blood cells count, and hemoglobin had missingness of about 9–12%. Hence, the four highly missing vital sign features were dropped in the final model. The percentages of missingness are shown in Figure 3.
4.2Preprocessing pipeline
Numerical variables were imputed using median and scaled for logistic regression. Categorical variables were imputed using most frequent category and one-hot encoded. Transformations were done with scikit-learn pipelines [5] such that imputation and scaling were learnt only on training data. Ages recorded as “> 89” were converted to the numeric value 89.
4.3Class imbalance
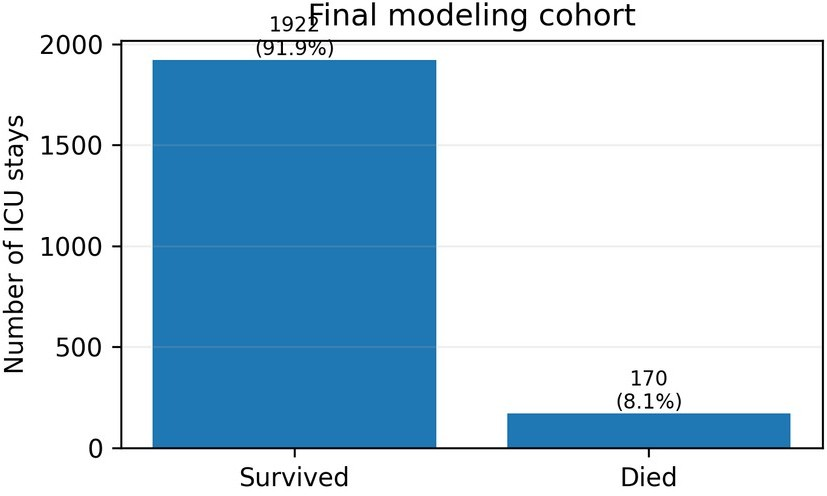
The final modelling cohort included 1,922 survivors and 170 death cases, resulting in an 8.13% mortality rate (Figure 1). Class imbalance was addressed in both models by use of class_weight='balanced'. Accuracy was not considered a sufficient metric for judging performance, so precision, recall, F1-score, ROC-AUC, and PR-AUC were reported as well.
5Leakage-aware modeling
5.1Group-based train–test split
There were 1,892 unique health-system stays in the final cohort. Most of them had only one ICU stay, but there were cases with 2, 3, and 4 ICU stays. This means that an ICU-level random split might assign related events to the training and testing samples. Instead, unique identifiers of the health system stays were split first and assigned to ICU observations.
As a result, the training dataset included 1,677 ICU events and 1,513 unique health system stays, including 142 deaths. There were 415 ICU events and 379 unique health system stays in the test dataset, including 28 deaths. Mortality prevalence in the training data was 8.47%, and in the test data 6.75%.
5.2Group-aware five-fold cross-validation
StratifiedGroupKFold validation was used as the main method of validation with 5 folds and patient-health system stays as groups. This approach does not allow using the same health system stay in several folds but attempts to preserve class balances. Observation-level validation was exploratory and was not used for reporting final results.
6Machine-learning models
6.1Logistic regression
Logistic regression was chosen as a baseline algorithm with a clear linear interpretation. It utilized preprocessing pipeline, balanced class weights, max number of 2,000 iterations, and random state 42.
6.2Random forest
Random Forest was selected as a non-linear baseline that can capture interactions and non-linear relationships. Classifier used 300 trees, balanced class weights, random state 42, and parallel execution. Scaling was kept even though it is not needed for tree-based classifiers.
7Model evaluation
7.1Group-aware cross-validation
Logistic regression resulted in a mean ROC-AUC of 0.7644 ± 0.0215 and a mean PR-AUC of 0.2941 ± 0.0548. Random forest resulted in a mean ROC-AUC of 0.7791 ± 0.0178 and a mean PR-AUC of 0.2772 ± 0.0370. In this way, random forest provided a slightly better ROC-AUC, while logistic regression provided a better PR-AUC. The results are summarized in Table 1.
| Model | ROC-AUC | PR-AUC |
|---|---|---|
| Logistic regression | 0.7644 ± 0.0215 | 0.2941 ± 0.0548 |
| Random forest | 0.7791 ± 0.0178 | 0.2772 ± 0.0370 |
7.2Held-out test results
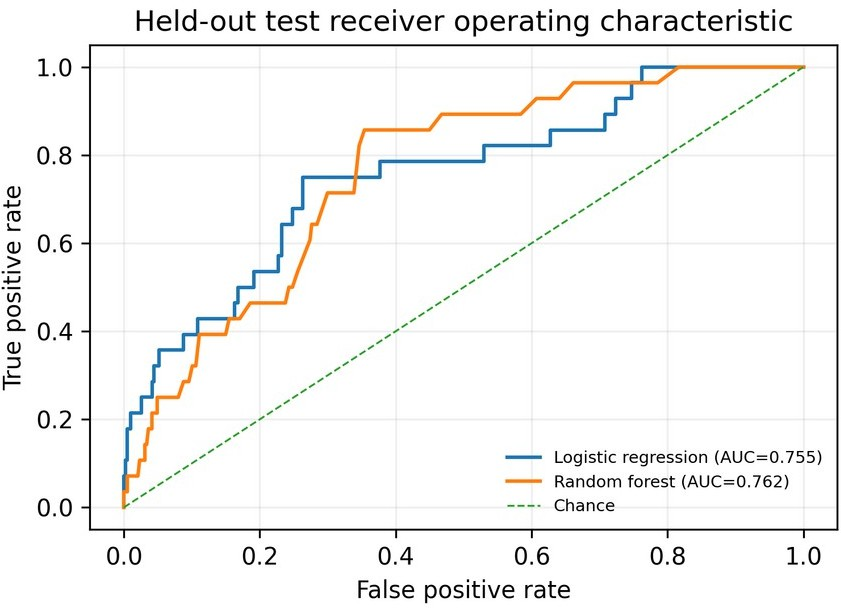
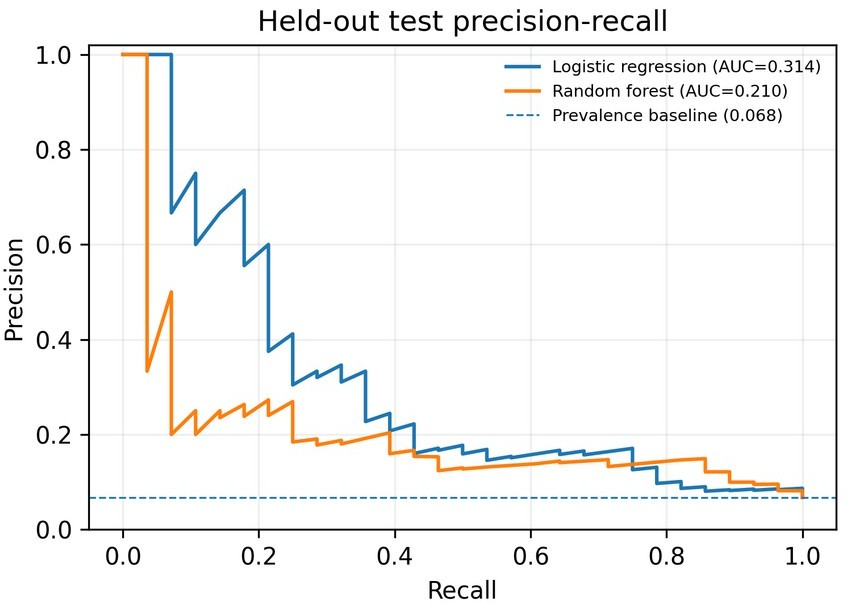
In the untouched test set, logistic regression obtained ROC-AUC 0.7554 and PR-AUC 0.3136. At the usual 0.50 threshold, it had accuracy 0.7470, precision 0.1652, recall 0.6786, and F1 score 0.2657. The random forest model yielded ROC-AUC 0.7615 and PR-AUC 0.2097. The ROC and precision–recall curves are shown in Figure 4 and Figure 5.
7.3Confusion matrices
When setting the threshold at 0.50, the confusion matrix of the leakage-aware test for logistic regression was 291 true negatives, 96 false positives, 9 false negatives, and 19 true positives. For the random forest model, it was 387 true negatives, 0 false positives, 28 false negatives, and 0 true positives. Hence, the high accuracy of the random forest was a result of the prevalence of survival class rather than its ability to detect death cases.
8Threshold-selection exercise
8.1Training-only threshold selection
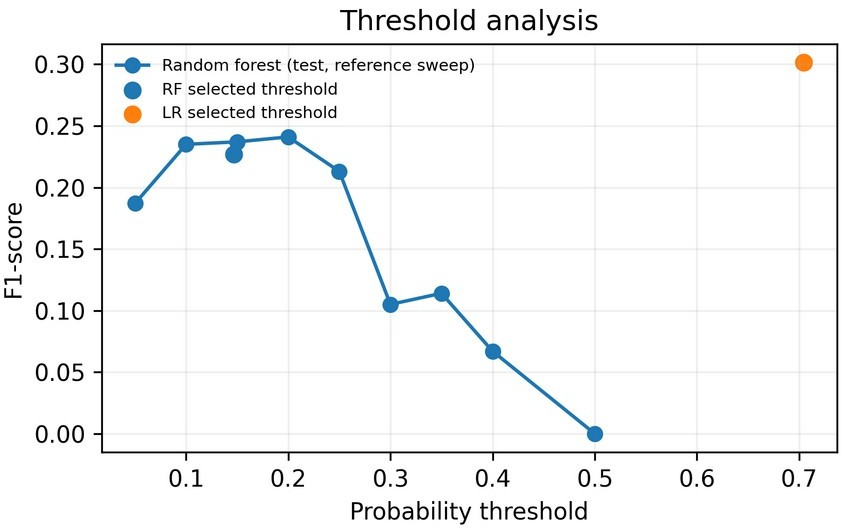
Since a probability model and a classifier are not the same thing, threshold selection was evaluated independently of discrimination. Five-fold StratifiedGroupKFold out-of-fold probability prediction based on training data was done. The threshold giving the maximum F1-score was selected and used for testing an untouched test set.
8.2Final selected thresholds
Five-fold StratifiedGroupKFold out-of-fold method gave 0.7043 for the logistic regression model and 0.1467 for the random forest model. When testing on the training out-of-fold, the logistic regression model had precision 0.3069, recall 0.4366, and F1-score 0.3685. The random forest model had precision 0.2419, recall 0.4225, and F1-score 0.3077. The threshold analysis is shown in Figure 6.
8.3Test performance at selected thresholds
When applying the thresholds obtained to the untouched test set, logistic regression gives precision 0.2444, recall 0.3929, F1-score 0.3014, and specificity 0.9121. The random forest model gives precision 0.1594, recall 0.3929, F1-score 0.2268, and specificity 0.8501. The results are given in Table 2. These thresholds are operating points, not the decision thresholds.
| Model | Threshold | Precision | Recall | F1 |
|---|---|---|---|---|
| Logistic regression | 0.7043 | 0.2444 | 0.3929 | 0.3014 |
| Random forest | 0.1467 | 0.1594 | 0.3929 | 0.2268 |
9SHAP-based explainability
9.1Global feature importance
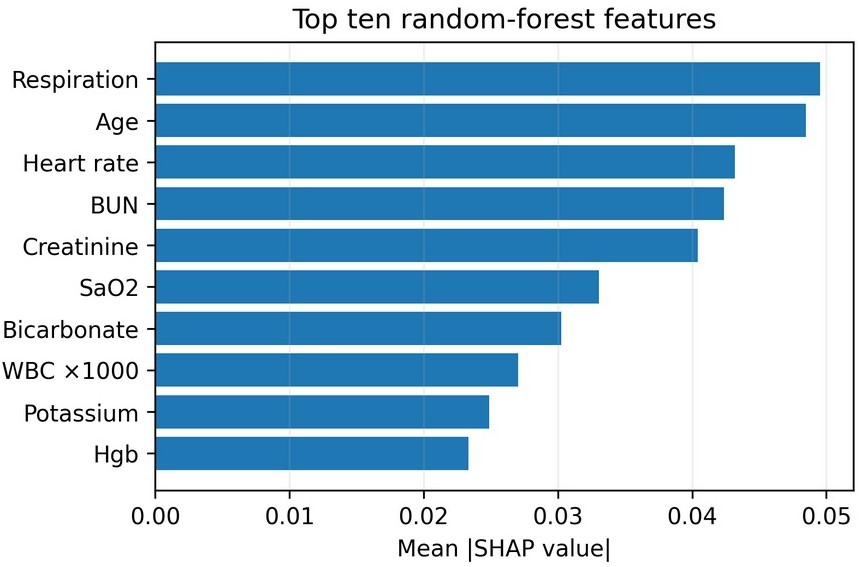
The SHAP TreeExplainer was applied to the random forest model. Mean absolute SHAP values on the held-out test set were used to calculate global feature importance ranking. The ten most important features were respiration, age, heart rate, blood urea nitrogen, creatinine, oxygen saturation, bicarbonate, white blood cell count, potassium, and hemoglobin. These are shown in Figure 7.
9.2Individual patient explanation
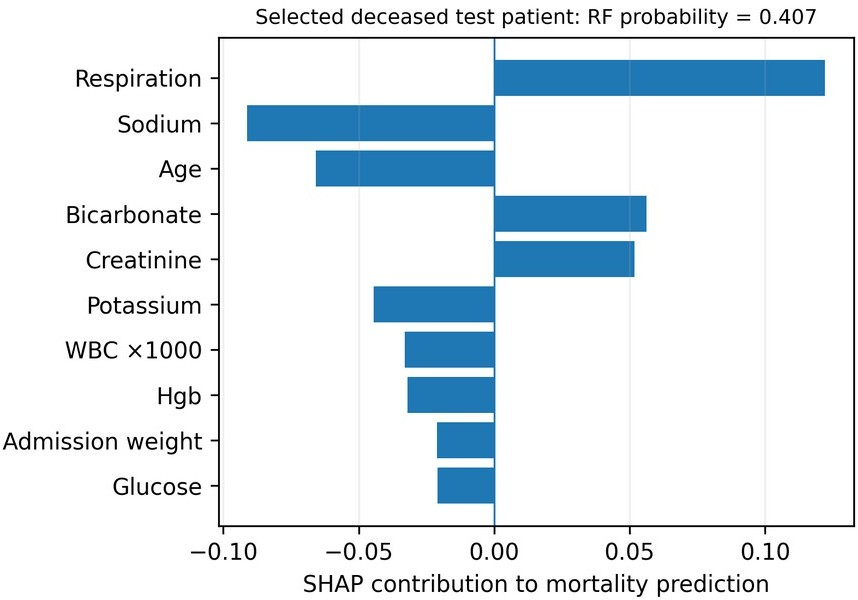
A patient-specific explanation was created for a deceased test patient with the maximum random-forest mortality probability among deceased test patients. Mortality probability was 0.4067. The contribution from respiration was +0.1221 towards the mortality prediction, while the contribution from sodium was −0.0911. Other significant contributions were age −0.0658, bicarbonate +0.0563, creatinine +0.0519, and potassium −0.0445. The individual contributions are shown in Figure 8.
The chosen patient had an observed value of 30.06 for respiration, 132.5 for sodium, 54 for age, 11.0 for bicarbonate, 1.875 for creatinine, 4.0 for potassium, 19.0 for white blood cell count, 12.3 for hemoglobin, and 61.2 for admission weight. A negative SHAP value implies that the feature pulled the specific model prediction down; it does not mean that the feature is clinically protective or causal.
10Discussion
From the experiments, it is evident that choices on how to evaluate a model will influence its interpretation. In both grouped cross-validation and the holdout test set, random forest provided the best ROC-AUC while logistic regression delivered better PR-AUC. This is significant since the mortality rate was low, being 8.13% in the final modeling cohort and 6.75% in the test set.
The default threshold experiment highlights the limitations of accuracy due to class imbalance. With 93.25% accuracy, random forest did not detect any of the 28 deaths. Logistic regression detected deaths but gave out false positives. Thus, mortality prediction should not be assessed only using accuracy.
Threshold determination was a step separate from evaluation in this experiment. Threshold values were determined based on training-out-of-fold grouped predictions and then kept constant while testing the test set. Logistic regression obtained better final F1-score due to threshold choice. Nevertheless, the threshold function used is specific for this exploratory study and it is not a clinically validated utility function.
SHAP analysis provides interpretability by determining which variables have the highest impact on the random forest. Respiration rate, age, heart rate, blood urea nitrogen, and creatinine were some of the strongest global variables. The individual example demonstrates the interaction of many different variables to move one prediction. SHAP is a method of explaining the model and is not able to prove causation.
Finally, it is essential to validate models using group-aware validation because the repeated visits to ICU belong to the same health-system stay. Splitting on health-system stay mitigates leakage due to this particular cause, but cannot entirely prevent bias nor substitute external validation.
11Limitations and responsible use
The demo is much smaller than the entire eICU dataset and only 170 deaths made it into the model training cohort. It is possible that predictions and feature ranking have an uncertainty due to sample size effects. Feature space is also deliberately limited, not encompassing all diagnoses, medications, procedures, therapies, and severity scores contained in the database.
First-24-hour mean aggregation excludes trends, variations, and outliers. Imputation of missing values will also affect distribution, and missingness pattern itself might contain information regarding the clinical process. The conversion of “> 89” to 89 is a preprocessing choice made in this experiment and should be revisited in a larger scale study.
eICU Demo is deidentified and meant for research, replication, and methodological experimentation purposes rather than for application in a clinical setting [1]. Models should not be used for any decisions regarding patient care. A deployment-related study would require external validation, calibration assessment, prospective testing, bias assessment, robustness checking, privacy guarantees, distribution shift monitoring, and clinical involvement.
12Conclusion
This paper provides documentation of the entire pipeline of exploratory explainable artificial intelligence development based on eICU Collaborative Research Database Demo. The work proceeds from initial data exploration and outcome definition to first-24-hour feature engineering, missingness analysis, leakage awareness splitting, model training on balanced classes, cross-validation by group, testing on holdout, threshold selection, and SHAP explanation.
The final cohort comprised 2,092 ICU admissions and 170 deaths. Random Forest outperformed Logistic Regression regarding ROC-AUC, whereas Logistic Regression outperformed Random Forest concerning PR-AUC and F1 metric at the chosen exploratory threshold. SHAP revealed that respiration, age, heart rate, blood urea nitrogen, and creatinine were the most significant random-forest features. Finally, when creating machine-learning solutions in the field of medicine, one should take into account the model's prediction, class imbalance, threshold, leakage, and interpretability.
Acknowledgements
The authors gratefully acknowledge the guidance and supervision of Prof. Prakash R. Devale, faculty member at Bharati Vidyapeeth (Deemed to be University), College of Engineering, Pune, under whose guidance this research work was conducted.
References
- [1]Johnson A, Pollard T, Badawi O, Raffa J. eICU Collaborative Research Database demo (version 2.0.1). PhysioNet; 2021. https://doi.org/10.13026/4mxk-na84
- [2]Pollard TJ, Johnson AEW, Raffa JD, Celi LA, Mark RG, Badawi O. The eICU Collaborative Research Database, a freely available multi-center database for critical care research. Sci Data. 2018;5:180178. https://doi.org/10.1038/sdata.2018.178
- [3]Lundberg SM, Lee SI. A unified approach to interpreting model predictions. In: Advances in Neural Information Processing Systems 30 (NIPS 2017). Long Beach (CA); 2017. p. 4765–74.
- [4]Collins GS, Reitsma JB, Altman DG, Moons KGM. Transparent reporting of a multivariable prediction model for individual prognosis or diagnosis (TRIPOD): the TRIPOD statement. BMJ. 2015;350:g7594. https://doi.org/10.1136/bmj.g7594
- [5]Pedregosa F, Varoquaux G, Gramfort A, Michel V, Thirion B, Grisel O, et al. Scikit-learn: machine learning in Python. J Mach Learn Res. 2011;12:2825–30.