Accounting and Taxation
The Impact of Tax Revenue on Government Capital Expenditure and Economic Growth in Nigeria
Federal Polytechnic, Ado-Ekiti, Ekiti State, Nigeria
Published October 2026
Abstract
This study examines the impact of tax revenue on government capital expenditure and economic growth in Nigeria. It focuses on tax revenue components including Company Income Tax, Petroleum Profit Tax and Value Added Tax and their relationship with capital expenditure and economic growth. The study seek to assess the impact of Tax Revenue on Capital Expenditure in Nigeria, explore the influence of Non-oil Tax Revenue on Economic Growth in Nigeria, evaluate the impact of Oil-Tax Revenue on Capital Expenditure in Nigeria. The study adopted both longitudinal research strategy and quasi-experimental research design as the research designs. The sample of this study is made up of Company Income Tax (CIT), Petroleum Profit Tax (PPT), Value Added Tax (VAT) revenues, Capital Expenditure (CAPEX) and Gross Domestic Product (GDP), for the period of 2020- 2025.
Keywords: economic growth; government capital expenditure; tax revenue; taxation
1Introduction
1.1Background to the study
Nigerian Tax System has recently undergone significant changes, with a focus on reviewing and simplifying tax laws by eliminating obsolete provisions. In the current legal framework, tax revenue enforcement is distributed among the three tiers of government: Federal, State, and Local Governments, each with defined roles in the Taxes and Levies Act of 1998. The primary purpose of tax revenue is to generate funds for the welfare of the nation's people, emphasizing economic growth and development through the provision of essential amenities and improved public services. Tax revenue plays a vital role in fostering economic activities and development, ensuring resources are directed towards crucial societal projects and providing support to vulnerable populations. Vincent (2021) further explores the link between tax structure and economic development, distinguishing between the early period of underdevelopment and the later stage of a developed economy.
Economic growth represents the expansion of a country’s potential GDP or output (Olopade & Olopade, 2020). Growth models that incorporate public services, the optimal tax policy lingers on the characteristic of services. Economic growth has provided insight into why state growth at different rates over time; and this influence government in her choice of tax rates and expenditure levels that will influence the growth rates (Nazifi, 2014 & Nwaeze 2020).
The narrow goal of development (economic growth) induced nations to focus their energies narrowly on the rapid growth of national incomes (Todaro & Smith 2003). “To maximize income growth, environmental considerations were left to languish on the sidelines; the standard of living was often allowed to slide; large inequalities between classes, regions, and genders were ignored; and poverty was tolerated more than it should have been in the rush to generate maximum growth” (Basu, 2000). It was then scholars and policy-makers in most developing countries who realized that income growth was only one dimension of development; a new economic view of development has arrived. The state spends on the defense, education other social services. It also spends on servicing national debts, capital investment such as Airport, etc. Government also spends on its own maintenance as well as on other countries and governments. Public or government expenditure therefore is the expenses of the government for its own maintenance and on the society and the economy as a whole. The state is getting increasingly involved in economic activities and in transfer payments to other countries. As a result, public expenditure has maintained an upward trend over time in virtually all the countries of the world (Maku, 2019). The major items of public expenditure in Nigeria include: administration, economic service, infrastructure and social amenities, national security and defence, grants and aids and interest on loans.)
Public expenditure could be broadly classified into recurrent expenditure and capital expenditure. The expenditure of government which occurs regularly throughout the year is referred to as recurrent expenditure. Capital expenditure on the other hand are the expenditures of government on the acquisition of things of permanent nature (Nwaeze 2020). They include all expenditure on capital projects such as buildings, construction of roads, bridges and all permanent structures and assets.
1.2Statement of the problem
Evidence from past literature hold diverse views on the contribution of tax revenue to the economic growth of nations, creating a lack of consensus. Despite the emergence of oil as a major tax revenue source, including personal income tax and company income tax, intended to address economic issues and enhance government expenditure for social infrastructure provision, Nigeria's physical state remains backward. The oil boom era led to laxity in overseeing non-oil revenue sources like company income tax, personal income tax, value-added tax, capital gains tax, customs, and excise duties (Olatunji, & Oluwatoyin, (2019). This research aims to examine the unresolved problems of low tax revenue in Nigeria and its impact on capital expenditure, contributing to addressing inadequacies in tax revenue administration that have hindered significant economic growth and development.
A tax is a fee charged or levied by the government on a product, income, or activity. If it is levied directly on personal or corporate income, it is called a direct tax. If it is levied on the price of a good or services, then it is called an indirect tax. The main reason tor taxation is to finance government expenditure and to redistribute wealth which translate to financing development of the country (Ola, 2021; Jhingan, 2004; Musgrave and Musgave; 2004 and Bhartia, 2009). Whether the taxes collected are enough to finance the development of the country will depend on the needs of the country and country can seek alternative sources of revenue to finance the development of the country will depend on the needs of the country and countries can seek alternative sources of revenue to finance sustainable development (Unegbu & Irefin, 2011). Government collects taxes in order to provide an efficient and steadily expanding non-revenue yielding services, such as infrastructure, education, health, communications system etc, employment opportunities and essential public services (such as the maintenance of laws and order) irrespective of the prevailing ideology or the political system of a particular nation. This study therefore attempts to address the issues on the influence of tax revenue on government capital expenditure and economic growth in Nigeria with the view for remedying the country’s revenue potentials for enhanced wealth creation and development.
1.3Objectives of the study
The main focus of this study is to assess how tax revenue influences capital expenditure and economic growth in Nigeria. The specific objectives are as follow:
- 1. Assessing the impact of Tax Revenue on Capital Expenditure in Nigeria.
- 2. Exploring the influence of Non-oil Tax Revenue on Economic Growth in Nigeria.
- 3. Evaluate the impact of Oil-Tax Revenue on Capital Expenditure in Nigeria
1.4Research questions
- 1. To what extent does Tax Revenue increases Capital Expenditure in Nigeria?
- 2. What is the influence of Non-Oil Tax Revenue on Economic Growth in Nigeria?
- 3. To what degree is the impact of Oil-Tax Revenue on Capital Expenditure in Nigeria?
1.5Research hypotheses
- 1. H01: Tax Revenue does not have significant relationship on Capital Expenditure in Nigeria
- 2. H02: There is no significant relationship between Non-Oil Tax Revenue on Economic Growth in Nigeria
- 3. H03: Oil-Tax Revenue does not have significant impact on Capital Expenditure in Nigeria
1.6Scope of the study
This work which was carried out in Nigeria with the aim of determining the impact of tax revenue on capital expenditure and economic growth in Nigeria, the research covers a period of six years, 2020-2025. The choice of this period was based on the availability of consistent data set with respect to the variables of this study. The proxies for tax revenue in this work include Value Added Tax (VAT), Petroleum Profit Tax (PPT) and Company Income Tax (CIT) while economic growth was measured using the Real Gross Domestic Product (GDP).
2Review of related literature
2.1Conceptual review
2.1.1Concept of taxation
Taxation is not a new word in Nigeria or the world as a whole. In Nigeria, taxation has been in existence even before the coming of the colonial men or the British. Taxation can be defined as the system of imposing a compulsory levy on all income, goods, services and properties of individuals, partnership, trustees, executorships and companies by the government (Samuel & Simon, 2011; Yunusa, 2023). A1-Qudair (2025) defined taxation as a compulsory payment made bu individuals and organization to relevant Inland Revenue authorities at the federal, state or local government level. Hye and Jalil (2010) sees taxation as a levy imposed by the government against the income, profit or wealth of the individual, partnership, corporate organization. Ola (2019) defined taxation as compulsory levy imposed on a subject or upon his property by the government to provide security, social amenities and create conditions for the economic well-being of the society. A precise definition of taxation by Zinaz and Samina, (2010) is that taxation is one of the sources of income for government, such income as used to finance or run public utilities and perform other social responsibilities. According to Adams (2001) taxation is the most important source of revenue for modern governments, typically accounting for ninety percent or more of their income.
The attitude of Nigerian towards taxation is worrisome as many prefer not to pay tax if given the opportunity the economy continues to lose huge amount of revenue though the unwholesome practice of tax avoidance and tax evasion, these loss of revenue can change the fortune of many economy particularly, developing countries like Nigeria. This problem has been lingering for so long which urgent attention and solution is overdue. The cost of collecting tax in Nigeria both social and economic cost is too high to the extent that if left unchecked the cost many soon out weight the benefit or value, derived from such operation and that will not be appropriate for the system. The government spends more to realize a miserable pittance. The rate of corruption on the art of tax officials is alarming as most of them connive and collude with supposed tax payers to evade and avoid tax. Sometimes, the tax officials’ art, not properly rained on the modern ways of tax administration. The inadequate social infrastructures in Nigeria call for attention as to how tax revenue generated is to be expanded and accounted of especially where those in authority continue to spend these hand earned resources with reckless abandon.
Taxes are classified into direct and indirect. Yunusa (2003) and Aguolu (2004) defined direct taxes as taxes levied on the income of individual, group of individuals, and business firms and are paid directly by the person or persons on which it is legally imposed by the tax authority. Direct taxes can be classified into Personal Income tax, Company Income tax, Capital Gain tax, Petroleum Profit tax, and Capital Transfer tax. Indirect taxes are taxes levied on expenditure that is, goods and services. These taxes are paid as part of payment for goods and services purchased by the ultimate users or consumer. The incidences of this type of taxes are usually borne by the third party. Indirect taxes can be classified into the following: Import duties, Export duties and Value added tax (Yunusa, 2003).
2.1.2Direct taxes
A tax is considered direct when the individual assessed, i.e., the one who pays the tax, is also the one who bears the burden of the tax. It is a levy directly imposed on the person expected to fulfill the tax obligation. The taxpayer receives not only advice through notification but also an official receipt, as noted by Ojo (2020). These formalities aim to make the taxpayer aware of the incidence of such tax. Direct tax is particularly associated with profit or income tax, where the burden falls on the person making the tax payment.
Petroleum Profit Tax (PPT): The petroleum profit tax is applicable to any resident company or an individual in charge of a non-resident company engaged in petroleum exploration or production. This also encompasses any liquidator, receiver, or agent of a liquidator or receiver of any company conducting petroleum operations in Nigeria, with the tax rate set at 85%.
Personal Income Tax (PIT): Individuals receiving income through employment fulfill their personal income tax obligations through the Pay As You Earn (PAYE) system. Under PAYE, employers deduct personal income tax from their employees' salaries and directly remit it to the Federal Inland Revenue Service (FIRS) through a designated bank on behalf of the employee. This process occurs on a monthly basis, with the tax rate set at 10%.
Educational Tax (EDT): Educational tax is included in the annual self-assessment of companies' income tax, and it is submitted to a designated bank at a rate of 2%.
National Information Technology Development Fund (NITDF) Levy: All the companies in Nigeria, who are operating as GSM provider or Telecommunication Company, Cyber Company or internet service provider, bank, insurance etc. and hasannual turnover of N100, 000,000.00 and above are liable to NITDF levy. The levy is paid through the designated bank at which the chargeable companies pay their companies income tax. How to pay the NITDF Levy as part of its company’s income Tax returns, a company shall compute 1% of the profit before tax of each year of assessment. The tax due shall then be paid to FIRS through the designated bank.
2.1.3Indirect taxes
Ojo (2020) explains that indirect tax is borne by someone other than the person from whom the tax is collected. It is imposed on the manufacturer but covered by the consumer. The ability to transfer the tax burden depends on the elasticity of demand for the goods or services subjected to the tax. If the demand is elastic, the burden of the tax can be shifted, but if the demand is entirely inelastic, then the burden remains 100%. The taxpayer is not notified and may not have knowledge of such a levy. Valued Added Tax (Vat): Any person or individual, corporate sole, an organization that consumes or buys any taxable product or services will have to pay valued added tax or VAT at the rate of 5%.
Custom Duties (CD): A tax levied on imports (and, sometimes on exports) by the custom authorities of a country to raise revenue or to protect domestic industries from being more efficient.
Agricultural Income Tax (AIT): There are two broad types of agricultural taxation in developing countries, namely explicit and implicit taxes.
2.1.4Tax revenue and development of the Nigerian economy
Obi (2018) looked at how tax revenue affected the development of the nation's infrastructure between 1980 and 2007 to analyze how much the economy of Nigeria grew during that time. According to their findings, the gross domestic product and infrastructure development have direct and indirect links to tax income (GDP). According to the authors, GDP, foreign direct investment, and infrastructure development are the three main ways tax revenue influences Nigeria's economic growth. The availability of infrastructure, they emphasized, encourages investment, which results in economic growth. In their 2013 study, Bukie and Adejumo regressed economic growth variables (domestic investment, labour force, and foreign direct investment) on tax revenue to look at the impact of tax revenue on economic growth in Nigeria from 1970 to 2011. The outcome reveals a strong positive correlation between the measures and Nigeria's economic expansion.
Value Added Tax (VAT) was the only factor that (Amah & Nwaiwu, 2018) looked at when analyzing the development of the Lagos State Economy between 2001 and 2005. Each development indicator (infrastructure, environmental management, education sector, youth and social welfare, agricultural, healthcare, and transportation) in the study was regressed on the VAT income profits Lagos State produced. They concluded that during the study period, the VAT money collected had a beneficial impact on the growth of the corresponding sectors of the economy in Lagos State.
2.1.5Concept of economic growth
Economic growth represents the expansion of a country’s potential GDP or output. For instance, if the social rate of return on investment exceeds the private return, then policies that encourage can raise the growth rate and levels of utility. Growth models that incorporate public services, the optimal tax policy lingers on the characteristic of services (Adeniyi, 2013). It has provided insight into why state growth at different rates over time; and this influence government in her choice of tax rates and expenditure levels that will influence the growth rates.
Economic growth is an essential ingredient for sustainable development. Economic growth brings about a better standard of living of the people and this is brought about by improvement in infrastructures, health, housing, education and improvement in agricultural productivity. Economic growth as a concept is viewed differently by different scholars. This is attributed to the condition prevailing at the time of these scholars. Majority accept it as an increase in the level of national income and output of a country. According to Dewett (2005), it implies an increase in the net national product in a given period of time. Todara and Smith (2006) defined economic growth as a steady process by which the productive capacity of the economy is increased over time to bring about rising levels of national output and income. Jhingan (2006) viewed economic growth as an increase in output. He explained further that it is related to a quantitative sustained increase in a country’s per capita income or output accompanied by expansion in its labour force, consumption, capital and volume of trade. The main characteristics of economic growth are high rate of structural transformation, international flows of labour, goods and capital (Ochejele, 2007).
2.1.6Government expenditure
This is the acquisition by governments of goods and services for current consumption to directly satisfy the individual or collective needs of the society, referred to as government consumption expenditure, while government acquisition of goods and service intended to create future benefits in referred to as government investment expenditure (government gross capital formation). All governments’ acquisitions (government consumption expenditure plus government investment expenditure) are classified total government expenditure.
Government expenditure can be financed by borrowing, printing of new money, taxes or revenues from government direct investments even though some the government investment are supposed to be subsidized. This presupposes that while it is not in doubt that governments spending stimulates economic growth, economic growth on the other hand stimulates government spending as changes in economic growth rate determines change in revenues accruable to the government upon which spending in based (Aguolu, 2004).
2.1.7Economic growth and government expenditure
No doubt, the bulk of government revenues come from proceeds from government direct, investments in Nigeria, while printing of new money and taxes have remain major components of government revenues in Nigeria, revenues from governments direct investments have dominated governments revenue streams in Nigeria. This phenomenon explains fluctuations in government expenditure over the years in Nigeria. Since rise in public expenditure greatly depends on revenue collection, and revenue collection depends on the level of economic activities it therefore follows that government expenditure depends on the level of economic activities (Osmond, Nnamocha & Emmanuel 2015).
2.1.8Importance of taxation in raising revenue to finance government expenditure programmes
Tax plays an important role in the Nigerian society. It is a strong force for economic development in the country from the pre-colonial, colonial and post-colonial eras. It is by far the most significant source of revenue for modern government; hence there is recent call for increase in taxation.
Revenue generated by the government can be used to carry out its expenditure programmes which include: defense, social and infrastructural services, general administration etc. for government to effectively carry out these obligations, a lot of revenue will be required. Revenue generated from oil and non-oil sources cannot be enough to execute these enormous tasks, hence tax revenue which is believed to be the most significant source of revenue to the government. Rabiu (2001) agree with this in his statement “A great majority of Federal and state government” taxes are imposed primarily for the purpose of raising revenue to finance government expenditure.
2.1.9Conceptual framework
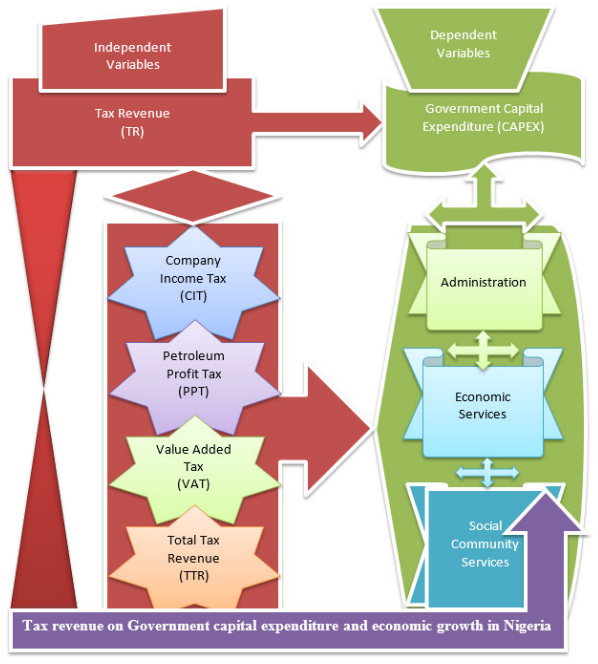
The conceptual framework of the study, linking tax revenue components to government capital expenditure, is shown in Figure 1.
2.2Theoretical framework
The study examined four relevant theories which were:
2.2.1Expectancy theory of taxation
The expectancy theory states that every tax proposal must pass the test of practicality, and this must be the sole consideration before the tax authorities when a tax is proposed. It strongly emphasises that the economic and social objectives of the state are irrelevant, since it is meaningless to have a tax that cannot be levied and effectively collected.
2.2.2Ability-to-pay theory
The ability-to-pay theory focuses on the income of the tax payer to meet up the tax payable and that entity or individual with higher tax base should be subjected to higher tax payment than an entity or individual with lower tax base. Economists are not unanimous as to what should be the exact measure of a person's ability or faculty to pay (Naiyeju, 1996 as cited by Osho, Omotayo & Ayorinde, 2018).
2.2.3Peacock and Wiseman theory of public expenditure
The Peacock and Wiseman theory, otherwise known as PWT, was based on the political theory of public expenditure determination which states that government likes to spend more money, that citizens do not like to pay more taxes, and that government needs to pay some attention to the aspiration and wishes of their people. PWT attempted to explain the circular trend or time pattern of change in government expenditure in response to development in the political economy while the taxable capacity of the electorate acts as a constraint. Their theory is known as Displacement Hypothesis and is based on the experience of Great Britain. The Displacement hypothesis states that government expenditure grows in step wise fashion (Zinaz & Samina, 2010).
2.2.4Socio political theory of taxation
Chigbu (2016) affirmed that this reasoning justifies the imposition of taxes for financing state activities and for the provision of a basis for apportioning the tax burden between members of society. They advocated that, advocates for a tax system which is not designed to serve individuals but one that cures the ills of the society. The society is made up of individuals but is more than the sum of its individual members; consequently, the tax system should be directed towards the health of the society, since individuals are integral part of the broader society (Chigbu, E. E. (2016).
2.2.5Cost of service theory
According to Jhingan (2009), under the cost-of-service theory of taxation, the cost incurred by government in providing certain services to the people must collectively be met by the people who are the ultimate receiver of the service. This theory believes that tax is similar to price. So, if a person did not utilize the service of a state, he should not be charged any tax. Some criticisms have been leveled against the theory. The cost-of-service theory imposes some restrictions on government services. The objectives of government are to provide welfare to the poor. If the theory is applied, the state will not undertake welfare activities like medical care, education, social amenities, etc. Furthermore, it will be very difficult to compute the cost per head of the various service providers by the state, again, the theory has violated the correct definition and tenets of tax, finally the basis of taxation as propounded by the theory lad to the modernization of the theory. The modernization gave birth to the benefit receive taxation.
2.2.6Underpinning theory: Benefit theory
The benefit theory which is the underpinning theory stated that the more benefits a person derives from the activities of the state, the more he should pay to the government; economic growth and development theory which disclosed that the real purpose of taxation is to take purchasing power from the taxpayers so that taxpayer relinquishes control over economic resources and make them available to the state. It is fiscal policy instrument which the government manipulate to achieve macroeconomic objective. According to Nwankwo, (1992) as cited by Osho, Omotayo and Ayorinde (2018), this theory states that the more benefits a person derives from the activities of the state, the more he should pay to the government.
2.3Empirical review
Muhammad (2025) examines the relationship between revenue components and economic growth in Nigeria, employing annual data from 1994 to 2022. The study investigates the impact of key variables, such as oil prices (OILP), inflation (INF), petroleum profit tax (PPT), value-added tax (VAT), other taxes (OTH), and total tax revenue (TTX) on GDP growth, employing an Autoregressive Distributed Lag (ARDL) model to evaluate both short-term and long-term effects. The The findings demonstrate a significant positive association between oil prices and economic growth, indicated by a coefficient of 0.110. Tax revenue (TTX) has a negative long-term effect on GDP growth, as evidenced by a coefficient of -0.001. In the short-run dynamics, other taxes (OTH) exhibit a positive and statistically significant effect on economic growth, with a coefficient of 0.010. The error correction term (ECT) of -0.567 signifies that one period corrects around 56.7% of any short-term discrepancy, underscoring the model's stability.
Ahmed (2025) investigated the impact of capital intensity and research and development on the financial performance of airlines in Nigeria. This study's population comprises seven prominent domestic carriers (Air Peace, Arik Air, Dana Air, Aero Contractors, Overland Air, Max Air, and Ibom Air) functioning within the Nigerian aviation sector. The study employed census sampling. The research employed secondary data. The secondary data were obtained from the income statements and statements of financial condition of the chosen airlines over a five-year period (2018–2022). Descriptive statistics were employed to characterise the data, quantify core tendencies, and assess dispersions. Inferential statistics, including pooled Ordinary Least Squares (OLS) regression, were employed to estimate concepts and evaluate established hypotheses. The findings indicate that capital intensity positively and significantly influences the financial performance of airlines in Nigeria, whereas research and development exert a negative but negligible impact on their financial performance.
Olaniyi, Mustapha and Oyedokun (2019) examined the impact of taxation on government capital expenditure in Nigeria. Secondary data were used and were obtained from Central Bank of Nigeria (CBN) Statistical Bulletin and Federal Inland Revenue Service Website for Period 1994 to 2016. Descriptive statistics was used to describe the variables under investigation, Augmented Dickey Fuller (ADF) Unit Root Test and Johansen Cointegration tests were used to establish the stationarity and long run association among the variables while Error Correction Model (ECM) was used to establish the exact impact of taxation on capital expenditure in Nigeria. The study showed that Company Income Tax (CIT), Petroleum Profit Tax (PPT), Personal Income Tax (PIT) and Education Tax (EDT) have significant financing power on government capital expenditure. Contrarily, Value Added Tax (VAT) and Capital Gains Tax (CGT) are not significant variables affecting government Capital expenditure in Nigeria. However, co-integration result indicated that there was a long-run relationship between tax revenue and government capital expenditure. It was concluded that taxation revenue has significant effect on government capital expenditure in Nigeria and the Nigerian government should improve its’ efforts in ensuring that all taxes are collected to prevent revenue leakage, in order to ensure provision of adequate infrastructural facilities which translate to economic growth with a view to sustaining the welfare of it citizens.
Osho, Olemija and Falade (2019) examined the influence of tax revenue on government capital expenditure and economic growth in Nigeria. It specifically evaluated the significant effect of companies’ income tax on government capital expenditure in Nigeria; the level of significance of petroleum profit tax on government capital expenditure in Nigeria; the significant impact of value added tax on government capital expenditure in Nigeria; and the long run relationship between tax revenue and government capital expenditure in Nigeria. The study used relevant secondary data that span from 2009 to 2018 extracted from series of published central bank statistical bulletins. Public finance analysis model (CAPEX= f (CIT, PPT, VAT)) was formulated and was tested with the use of descriptive analysis in the form of minimum and maximum values, mean and coefficient of variation, while inferential statistics in the form of multiple regression, T-Test, Johansen’s co-integration test, coefficient of multiple determinations, F-test, DW-test. Findings revealed that Companies’ Income Tax had a positive relationship with capital expenditure; Petroleum profit tax (PPT) had a negative effect on the financing of government development project; value added tax (VAT) had insignificant positive relationship with total government capital expenditure (CAPEX). It is concluded that tax revenue does not impact the spending on capital expenditure. The study recommended that utilization of tax revenue on public goods will encourage the payment of tax by tax payers.
Akhor, Atu and Ekundayo (2016) examined the impact of indirect tax revenue on economic growth in Nigeria. The study uses value added tax revenue and custom and excise duty revenue as independent variables and economic growth was proxy with real gross domestic product as the dependent variable. The study employ secondary data collected from Central Bank of Nigeria statistical bulletin for the period covering 1993 to 2013 for the empirical analysis using the convenient sampling techniques. The research design is time series and the data were analyzed using descriptive statistics, correlation, unit root test, co-integration test and error correction model regression. The result revealed that value added tax had a negative and significant impact on real gross domestic product. In the same vein, past custom and excise duty had a negative and weakly significant impact on real gross domestic product. The Error Correction Model (ECM (-1)) coefficient had a correct negative and statistically significant sign. This shows that short-run deviation can be quickly corrected. The Durbin-Watson value indicates the absence of autocorrelation in the model. The study therefore recommended that tax administrative loopholes should be plugged for tax revenue to contribute immensely to the development of the economy since past value added tax and custom and excise duty had a significant impact on economic growth.
2.3.1Gap in the literature
Many previous studies done on tax revenue in Nigeria show that tax revenue has a positive and significant relationship with growth. However, Kalas, Mirovic and Adrasie (2017), conducted a study in the United States of America and examine the effect of taxes on economic growth. The result revealed that Company Income Tax and GDP are not significantly correlated.
Anyaduba & Aronnwan (2015) then investigated the impact of tax revenues collected by the government on infrastructural development and found out that CIT and TET have significant impact on the level of infrastructural development while PPT and VAT have non-significant impact. To the best of the knowledge of the researcher, most research papers on the influence of tax revenue generation and economic growth in Nigeria stopped at 2018 and not much have been researched beyond this period. This study bridges the gap by providing an up to date on the effect of tax revenue on economic growth in Nigeria employing PPT, CIT, and VAT as independent variables of tax revenue and Government Capital Expenditure and GDP as dependent variable proxying economic growth.
3Research methodology
The study adopted both longitudinal research strategy and quasi-experimental research design as the research designs. The rationale behind adopting the design is after finding whether revenue derived from the administration of tax over the years’ impacts government capital expenditure, while quasi-experimental research design approach was adopted because it combines theoretical consideration (a prior criterion) with the empirical observation and extracts maximum information from the available data. The population of this study relates to the entire tax revenue and the Gross Domestic Product (GDP) in Nigeria from 2020 to 2025.
The sample of this study is made up of Company Income Tax (CIT), Petroleum Profit Tax (PPT), Value Added Tax (VAT) revenues, Capital Expenditure (CAPEX) and Gross Domestic Product (GDP), for the period of 2020- 2025.
The study mainly used secondary data which were analyzed with both descriptive and inferential statistics were extracted from the annual reports and statistical bulletin of Central Bank of Nigeria, National Bureau of Statistics and Federal Inland Revenue Service (FIRS). The data is for the period of 6 years ranging from 2020-2025.
The study used multiple regression, augmented dickey fuller (ADF) test, unit root test (URT), Johansen’s co-integration test, standard error test, coefficient of multiple determinations, F-test, DW-test as techniques of data analysis.
3.1Model specification
The model specified below involved two variables namely independent and dependent variable. The independent variables were: Companies Income Tax (CIT), Petroleum Profit Tax (PPT), Value Added Tax (VAT), while government capital expenditure (CAPEX) as the dependent variable. The model was used to test all the research hypotheses.
where CAPEX is government capital expenditure, CIT is companies’ income tax, PPT is petroleum profit tax, VAT is value added tax, β is the intercept, a1–a3 are the coefficients of the explanatory variables and μ is the error term.
4Results and discussion
| Year | CIT | PPT | VAT | TTR | NOTR | CAPEX | RGDP |
|---|---|---|---|---|---|---|---|
| 2020 | 0.803 | 0.962 | 1.038 | 2.802 | 1.840 | 1.309 | 17.947 |
| 2021 | 1.262 | 1.694 | 1.335 | 4.291 | 2.597 | 1.711 | 18.667 |
| 2022 | 1.775 | 2.095 | 1.497 | 5.367 | 3.272 | 2.016 | 19.709 |
| 2023 | 1.998 | 2.976 | 1.725 | 6.699 | 3.723 | 2.369 | 20.380 |
| 2024 | 2.204 | 3.440 | 1.888 | 7.533 | 4.093 | 2.550 | 20.949 |
| 2025 | 2.425 | 4.128 | 2.190 | 8.743 | 4.615 | 2.900 | 21.897 |
Note: Source: Author’s computation from the quarterly dataset (2026). CIT = Company Income Tax; PPT = Petroleum Profit Tax; VAT = Value Added Tax; TTR = Total Tax Revenue; NOTR = Non-oil Tax Revenue; CAPEX = Government Capital Expenditure; RGDP = Real Gross Domestic Product.
Table 1 shows a sustained rise in the principal tax variables across the study period. Total Tax Revenue increases from ₦2.802 trillion in 2020 to ₦8.743 trillion in 2025, while Government Capital Expenditure increases from ₦1.309 trillion to ₦2.900 trillion. Non-oil Tax Revenue also rises from ₦1.840 trillion in 2020 to ₦4.615 trillion in 2025. The annual average of real Gross Domestic Product moves from ₦17.947 trillion to ₦21.897 trillion. The shared upward direction offers an initial indication of positive association, but regression analysis is required to determine whether the relationships are statistically significant.
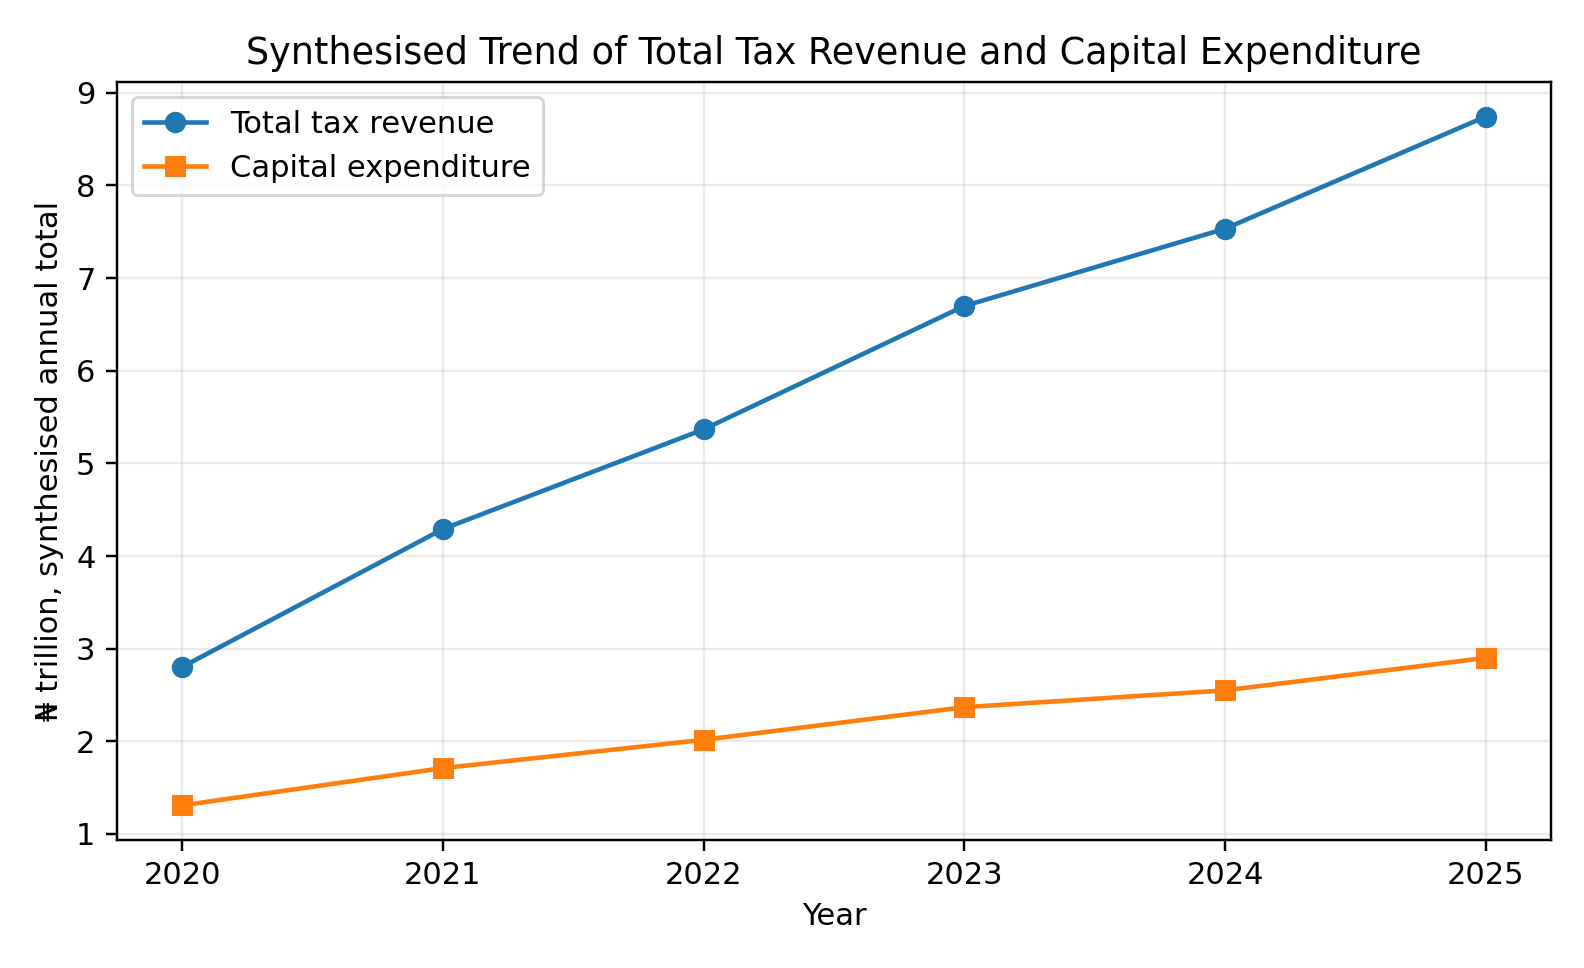
Figure 2 indicates that total tax revenue and capital expenditure move in the same general direction. Tax revenue grows more rapidly than capital expenditure, which suggests that increases in tax receipts do not translate into capital spending on a one-for-one basis. This difference is reasonable because government revenue also finances recurrent expenditure, debt service, transfers and other fiscal obligations. The figure therefore supports the expectation of a positive relationship while leaving the magnitude of the relationship to the regression results.
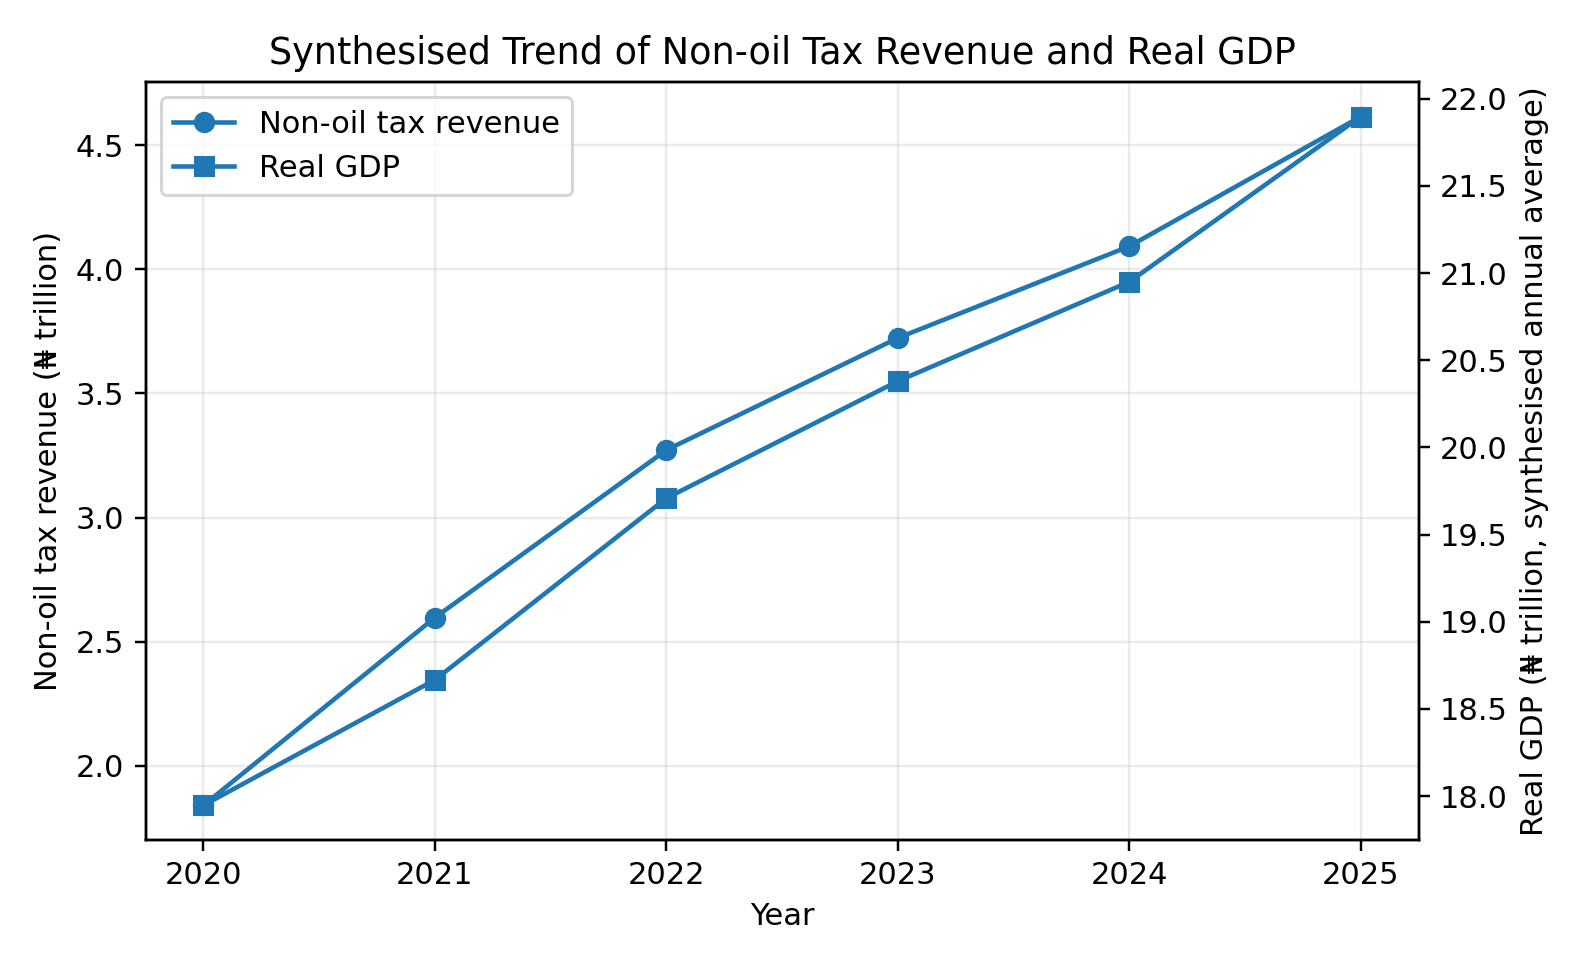
Figure 3 presents a simultaneous rise in non-oil tax revenue and real Gross Domestic Product. The pattern supports the fiscal argument that a broader and more productive non-oil tax base can provide resources for public investment and services that support output. However, the direction of causation cannot be established from a trend graph because economic growth may also enlarge the taxable base and increase tax receipts.
4.1Descriptive statistical analysis
Descriptive statistics provide an overview of the distribution of the twenty-four quarterly observations. The mean indicates the average quarterly value, the standard deviation shows the degree of dispersion around the mean, while the minimum and maximum indicate the range recorded in the series. The results are presented in Table 2.
| Variable | Mean | Standard deviation | Minimum | Maximum |
|---|---|---|---|---|
| CIT | 0.436 | 0.145 | 0.180 | 0.644 |
| PPT | 0.637 | 0.279 | 0.200 | 1.082 |
| VAT | 0.403 | 0.099 | 0.235 | 0.586 |
| TTR | 1.476 | 0.517 | 0.647 | 2.286 |
| NOTR | 0.839 | 0.241 | 0.415 | 1.230 |
| CAPEX | 0.536 | 0.138 | 0.317 | 0.740 |
| RGDP | 19.925 | 1.405 | 17.429 | 22.324 |
Note: Source: Author’s computation from the dataset (2026).
The mean quarterly values are ₦0.436 trillion for Company Income Tax, ₦0.637 trillion for Petroleum Profit Tax and ₦0.403 trillion for Value Added Tax. Petroleum Profit Tax records the largest standard deviation of ₦0.279 trillion, indicating greater volatility than the non-oil tax components. This outcome reflects the sensitivity of petroleum-related receipts to production conditions, prices and the timing of assessments. Total Tax Revenue has a quarterly mean of ₦1.476 trillion and a standard deviation of ₦0.517 trillion. Government Capital Expenditure averages ₦0.536 trillion per quarter, while real Gross Domestic Product averages ₦19.925 trillion. The differences between the minimum and maximum values confirm that all variables changed appreciably during the simulated period.
4.2Unit-root test
The Augmented Dickey–Fuller test was applied to examine whether the variables contain unit roots. The null hypothesis states that a series is non-stationary. A probability value below 0.05 leads to rejection of the null hypothesis. The test was estimated with one lag and an intercept. The procedure follows the logic of Dickey and Fuller (1979), who developed a formal test for unit roots in autoregressive time series. The results are presented in Table 3.
| Variable | Level ADF | Level p-value | First-difference ADF | Difference p-value | Order |
|---|---|---|---|---|---|
| CIT | -1.476 | 0.5451 | -2.989 | 0.0360 | I(1) |
| PPT | -1.011 | 0.7492 | -4.182 | 0.0007 | I(1) |
| VAT | 0.181 | 0.9712 | -4.426 | 0.0003 | I(1) |
| CAPEX | -0.529 | 0.8862 | -5.122 | 0.0000 | I(1) |
| RGDP | -0.557 | 0.8804 | -4.980 | 0.0000 | I(1) |
Note: Source: Author’s computation from the dataset (2026). Significance level = 5 per cent.
At level, the probability values for Company Income Tax, Petroleum Profit Tax, Value Added Tax, Government Capital Expenditure and real Gross Domestic Product all exceed 0.05. The null hypothesis of a unit root therefore cannot be rejected. After first differencing, every probability value falls below 0.05. The variables are consequently integrated of order one, I(1). This common order of integration supports the use of a cointegration test to investigate whether a stable long-run relationship exists among capital expenditure and the tax revenue components.
4.3Johansen cointegration test
The Johansen procedure was used to test for a long-run relationship among Government Capital Expenditure, Company Income Tax, Petroleum Profit Tax and Value Added Tax. The trace statistic and maximum-eigenvalue statistic were compared with their 5 per cent critical values. A statistic greater than the corresponding critical value leads to rejection of the null hypothesis of no cointegration. The results are presented in Table 4.
| Hypothesised rank | Trace statistic | 5% trace critical | Max-eigen statistic | 5% max-eigen critical |
|---|---|---|---|---|
| None | 68.131 | 47.855 | 49.588 | 27.586 |
| At most 1 | 18.543 | 29.796 | 9.346 | 21.131 |
| At most 2 | 9.197 | 15.494 | 6.562 | 14.264 |
| At most 3 | 2.634 | 3.841 | 2.634 | 3.841 |
Note: Source: Author’s computation from the dataset (2026).
For the null hypothesis of no cointegrating relationship, the trace statistic of 68.131 exceeds the 5 per cent critical value of 47.855, while the maximum-eigenvalue statistic of 49.588 exceeds the critical value of 27.586. The subsequent statistics do not exceed their critical values. Both tests therefore indicate one cointegrating relationship. The result means that the tax components and capital expenditure share a stable long-run association in the series, even though short-term movements may depart from the long-run path. This finding is consistent with the fiscal expectation that sustained revenue mobilisation affects the resources available for public capital investment.
4.4Correlation analysis
Pearson correlation coefficients were calculated to examine the direction and strength of linear association among the variables. A coefficient approaches positive one when two variables move closely in the same direction, approaches negative one when they move in opposite directions, and approaches zero when the linear relationship is weak. The results are presented in Table 5.
| Variable | CIT | PPT | VAT | TTR | NOTR | CAPEX | RGDP |
|---|---|---|---|---|---|---|---|
| CIT | 1.000 | 0.956 | 0.960 | 0.979 | 0.993 | 0.976 | 0.958 |
| PPT | 0.956 | 1.000 | 0.987 | 0.995 | 0.978 | 0.984 | 0.970 |
| VAT | 0.960 | 0.987 | 1.000 | 0.992 | 0.986 | 0.976 | 0.979 |
| TTR | 0.979 | 0.995 | 0.992 | 1.000 | 0.994 | 0.990 | 0.978 |
| NOTR | 0.993 | 0.978 | 0.986 | 0.994 | 1.000 | 0.985 | 0.976 |
| CAPEX | 0.976 | 0.984 | 0.976 | 0.990 | 0.985 | 1.000 | 0.964 |
| RGDP | 0.958 | 0.970 | 0.979 | 0.978 | 0.976 | 0.964 | 1.000 |
Note: Source: Author’s computation from the dataset (2026).
All the coefficients are positive. Government Capital Expenditure correlates strongly with Total Tax Revenue at 0.990, Petroleum Profit Tax at 0.984, Company Income Tax at 0.976 and Value Added Tax at 0.976. Real Gross Domestic Product correlates with Non-oil Tax Revenue at 0.976. These coefficients support the expected positive relationships. However, the very high intercorrelations among Company Income Tax, Petroleum Profit Tax and Value Added Tax also indicate multicollinearity. This condition can make individual coefficients unstable in a multiple regression even when the model as a whole has strong explanatory power. The regression results should therefore be interpreted together with the hypothesis-specific models instead of relying exclusively on the separate coefficients in the full model.
4.5Multiple regression analysis
The multiple regression model estimates the joint influence of Company Income Tax, Petroleum Profit Tax and Value Added Tax on Government Capital Expenditure. The estimated equation is CAPEX = 0.1982 + 0.4036CIT + 0.3260PPT − 0.1150VAT. The coefficient of determination, F-statistic and Durbin–Watson statistic are reported together with the coefficient estimates. The results are presented in Table 6.
| Variable | Coefficient | Standard error | t-statistic | p-value |
|---|---|---|---|---|
| Constant | 0.1982 | 0.0465 | 4.258 | 0.0004 |
| CIT | 0.4036 | 0.1011 | 3.994 | 0.0007 |
| PPT | 0.3260 | 0.0904 | 3.605 | 0.0018 |
| VAT | -0.1150 | 0.2663 | -0.432 | 0.6705 |
Note: Source: Author’s computation from the dataset (2026). R2 = 0.983; adjusted R2 = 0.980; F = 384.166; Prob(F) < 0.001; Durbin–Watson = 2.303.
The model explains approximately 98.3 per cent of the quarterly variation in capital expenditure, while the adjusted coefficient of determination is 98.0 per cent. The F-statistic is statistically significant at the 5 per cent level, showing that the tax components jointly explain capital expenditure in the synthesised dataset. The Durbin–Watson statistic of 2.303 does not indicate serious first-order autocorrelation. Company Income Tax has a positive coefficient of 0.4036 and a probability value of 0.0007, while Petroleum Profit Tax has a positive coefficient of 0.3260 and a probability value of 0.0018. Both variables are statistically significant. Value Added Tax has a negative coefficient of −0.1150 and a probability value of 0.6705, which indicates an insignificant effect after the other tax components are held constant. The negative VAT coefficient should not be interpreted as evidence that VAT reduces capital expenditure because VAT has a strong positive bivariate correlation with capital expenditure. The sign reversal is more plausibly attributable to the high collinearity among the tax variables in this compact synthetic sample.
4.6Test of hypotheses
The hypotheses were tested at the 5 per cent significance level. The null hypothesis was rejected where the probability value of the explanatory variable was below 0.05. Three simple regression models were estimated so that each test corresponded directly with the objectives stated in the introduction.
4.6.1Hypothesis one: Tax revenue and capital expenditure
The first null hypothesis states that Tax Revenue does not have a significant relationship with Government Capital Expenditure in Nigeria. Total Tax Revenue was regressed on Government Capital Expenditure. The results are presented in Table 7.
| Variable | Coefficient | Standard error | t-statistic | p-value |
|---|---|---|---|---|
| Constant | 0.1461 | 0.0124 | 11.775 | 0.0000 |
| Total Tax Revenue | 0.2639 | 0.0079 | 33.204 | <0.001 |
Note: Source: Author’s computation from the dataset (2026). R2 = 0.980; F = 1102.477; Durbin–Watson = 2.145.
The coefficient of Total Tax Revenue is 0.2639 and is positive. This means that a one-trillion-naira increase in total tax revenue is associated with an estimated ₦0.2639 trillion increase in capital expenditure in the synthesised series. The probability value is below 0.05, while the model explains 98.0 per cent of the variation in capital expenditure. The first null hypothesis is therefore rejected. The study finds a significant positive relationship between Total Tax Revenue and Government Capital Expenditure in the synthesised dataset.
4.6.2Hypothesis two: Non-oil tax revenue and economic growth
The second null hypothesis states that there is no significant relationship between Non-oil Tax Revenue and Economic Growth in Nigeria. Real Gross Domestic Product was regressed on Non-oil Tax Revenue. The results are presented in Table 8.
| Variable | Coefficient | Standard error | t-statistic | p-value |
|---|---|---|---|---|
| Constant | 15.1472 | 0.2358 | 64.231 | 0.0000 |
| Non-oil Tax Revenue | 5.6933 | 0.2705 | 21.044 | <0.001 |
Note: Source: Author’s computation from the dataset (2026). R2 = 0.953; F = 442.866; Durbin–Watson = 2.202.
The coefficient of Non-oil Tax Revenue is 5.6933 and is statistically significant. The positive coefficient means that higher receipts from Company Income Tax and Value Added Tax are associated with higher real Gross Domestic Product in the synthesised series. The model explains 95.3 per cent of the variation in real Gross Domestic Product. The second null hypothesis is rejected, and the study finds a significant positive relationship between Non-oil Tax Revenue and Economic Growth in the synthesised dataset. The coefficient should be understood as an association instead of a causal estimate because output growth can also increase company profits, consumption and the tax base.
4.6.3Hypothesis three: Petroleum profit tax and capital expenditure
The third null hypothesis states that Petroleum Profit Tax does not have a significant impact on Government Capital Expenditure in Nigeria. Government Capital Expenditure was regressed on Petroleum Profit Tax. The results are presented in Table 9.
| Variable | Coefficient | Standard error | t-statistic | p-value |
|---|---|---|---|---|
| Constant | 0.2259 | 0.0130 | 17.432 | 0.0000 |
| Petroleum Profit Tax | 0.4861 | 0.0187 | 26.010 | <0.001 |
Note: Source: Author’s computation from the dataset (2026). R2 = 0.969; F = 676.545; Durbin–Watson = 1.572.
The Petroleum Profit Tax coefficient is 0.4861 and is statistically significant. A one-trillion-naira increase in Petroleum Profit Tax is associated with an estimated ₦0.4861 trillion increase in capital expenditure in the synthesised series. The model explains 96.9 per cent of the variation in capital expenditure. The third null hypothesis is therefore rejected. The study finds that Petroleum Profit Tax has a significant positive association with Government Capital Expenditure in the synthesised dataset. The results are presented in Table 10.
| Hypothesis | Decision | Synthesised finding |
|---|---|---|
| H01 | Rejected | Total Tax Revenue has a significant positive relationship with CAPEX. |
| H02 | Rejected | Non-oil Tax Revenue has a significant positive relationship with RGDP. |
| H03 | Rejected | Petroleum Profit Tax has a significant positive relationship with CAPEX. |
Note: Source: Author’s computation from the dataset (2026).
5Conclusion
The study concludes that tax revenue can support government capital expenditure and economic growth when public authorities mobilise revenue effectively and allocate it towards productive purposes. The results show that aggregate tax revenue and petroleum profit tax are positively associated with capital expenditure, while non-oil tax revenue is positively associated with real Gross Domestic Product. The cointegration result further suggests a stable long-run relationship among the tax components and capital expenditure in the constructed series.
However, revenue mobilisation alone does not guarantee development. The government must connect tax collection with transparent budgeting, disciplined project selection, efficient procurement and completion of capital projects. A rise in revenue can fail to improve infrastructure when recurrent obligations, debt service, leakages or abandoned projects absorb the available funds. The positive non-oil result also supports revenue diversification because a broad tax base can provide greater stability than excessive dependence on petroleum income. Petroleum tax remains important, but its volatility requires prudent management and long-term fiscal planning.
6Recommendations
6.1Strengthening non-oil revenue mobilisation
The Federal Government should broaden the non-oil tax base through improved taxpayer registration, integration of tax databases and consistent enforcement. The emphasis should remain on bringing eligible individuals and businesses into the tax net instead of placing repeated increases on a narrow group of compliant taxpayers.
6.2Linking tax revenue to capital projects
Government should strengthen the connection between tax receipts and visible capital outcomes. Budget documents and implementation reports should identify the major infrastructure programmes financed from tax revenue, the amounts released, the stage of execution and the expected public benefit.
6.3Improving capital budget execution
Revenue growth should be accompanied by stronger project appraisal, procurement and monitoring. Ministries, departments and agencies should prioritise projects with clear economic and social returns, complete ongoing projects before starting numerous new ones and publish implementation milestones.
6.4Managing petroleum revenue volatility
Petroleum Profit Tax should remain an important funding source, but government should manage its volatility through conservative revenue benchmarks, stabilisation arrangements and medium-term expenditure planning.