Noise Pollution in Religious Centers
Assessment of Noise Level in Christian Religious Centers in Obio/Akpor LGA in Rivers State
Centre for Occupational Health, Safety and Environment, Institute of Petroleum Studies, Faculty of Engineering, University of Port Harcourt, Port Harcourt, Rivers State, Nigeria
Published October 2026
Abstract
This study assessed noise pollution from Christian religious centers in Obio/Akpor Local Government Area, Rivers State, Nigeria, where rapid urbanization has created an unprecedented density of over 1,900 worship sites interspersed with residential neighborhoods. A cross-sectional mixed-methods design was employed, measuring noise levels in 25 strategically selected churches representing Pentecostal, Protestant, and Orthodox denominations. Using a calibrated sound level meter, 75 readings were taken across background (non-worship), indoor service, and 50m external zones, capturing LAeq, Lmax, Lmin, L10, L50, and L90 parameters. Results indicated background noise averaging 53.21 dBA (SD=3.82), with 28% exceeding NESREA/WHO 55 dBA limits. Indoor service levels averaged 99.02 dBA (SD=10.44), with all 25 churches (100%) exceeding permissible limits, while external levels averaged 84.88 dBA (SD=9.74), also demonstrating 100% exceedance. Church X recorded the highest indoor levels at 113.03 dBA mean and 120.50 dBA peak. Percentile analysis revealed indoor L10 of 111.94 dBA, L50 of 100.70 dBA, and L90 of 84.20 dBA. Pollution Index values averaged 180.04% indoors (range: 151.03–205.52%) and 154.33% outdoors (range: 124.30–188.24%), categorizing all sites as severely polluted. Attenuation averaged 14.14 dB (range: 5.70–24.67 dB), with a significant paired t-test result (t=13.42, p<0.001). Strong indoor-outdoor correlation (r=0.87, p<0.01) confirmed direct noise spillover. Denominational analysis via t-test revealed significantly higher noise in Pentecostal centers (mean=108.76 dBA) compared to Catholic/Conservative churches (mean=85.08 dBA) (p<0.001). Structured questionnaires from 344 respondents yielded high perception indices for noise generation (3.82/5.00), health impacts including hearing risks (3.99/5.00) and stress (3.67/5.00), and community disturbance (3.79/5.00), yet moderate regulatory awareness (3.45/5.00). Grounded in socio-environmental theories, findings expose cultural rationalizations clashing with public health realities. The study recommends NESREA enforcement, acoustic retrofits, and denomination-specific guidelines to balance religious freedom with sustainable urban health.
Keywords: Christian religious center; noise pollution; noise level; environment; Obio/Akpor
1Introduction
Noise is defined as unwanted sound that disrupts human activities and can cause hearing loss, stress, sleep disturbance, and other health problems (World Health Organization, 2018; Basner et al., 2014). In Nigeria, Christian religion is a pervasive part of daily life, and the country has one of the world's highest rates of church proliferation (Ukah, 2016). This rapid growth of worship centers often brings many churches into close proximity, each using amplified sound systems and generators (Yorkor & Nteegah, 2019). In Obio-Akpor Local Government Area of Rivers State, a recent GIS mapping effort by Ewuma et al. (2025) identified about 1,921 religious centers, comprising 1,907 Christian churches, 8 Muslim centers, 5 shrines, and 1 western religion (Eckanker). These sites are extremely dense and often concentrated in residential neighborhoods such that dozens of services may run concurrently. Research indicates that such clustering creates overlapping noise and traffic burdens on nearby communities, with noise from one site easily spilling into neighboring streets (Sunny & Weli, 2021).
Worship centers commonly rely on generators and public-address systems to amplify sermons and music, making them notable local noise sources (Oviasogie & Ikhudayisi, 2019). Scholars have observed that religious sites have "joined the bandwagon of environmental polluters" through loudspeakers and diesel generators (Diga & Tabe, 2013). Factor-analytic studies of urban environments in Nigeria have identified noise pollution caused by religious activities and the use of PA systems as top contributors to environmental degradation (Oguntunde et al., 2019). Many residents report worship noise as a major nuisance to community peace (Adebayo, 2021).
The National Environmental Standards and Regulations Enforcement Agency (NESREA, 2009) sets a 55 dB(A) limit for noise in residential areas, which applies to worship centers located within such zones. Noise pollution is a major environmental problem that can lead to nuisance and health issues (Oguntunde et al., 2019). Field measurements in Port Harcourt, however, show that sound levels inside churches and mosques frequently far exceed this limit (Diga & Tabe, 2013). For instance, average indoor worship noise around services was approximately 95 dB(A) in Pentecostal churches, 93.6 dB(A) in orthodox churches, and even higher peaks exceeding 100 dB(A) in some mosques (Yorkor & Nteegah, 2019). In all cases measured by Ononugbo and Avwiri (2019), the equivalent noise levels exceeded the 55 dB(A) guideline, indicating a persistent breach of safe limits. Lilly-Tariah et al. (2017) further documented that churches are great places for sound to propagate, which increases the risk of noise-induced hearing loss among congregants and instrumentalists.
Religious centers, particularly churches, have become prominent contributors to environmental noise pollution in Obio-Akpor Local Government Area, Rivers State. With over 1,900 religious centers densely clustered in residential communities (Ewuma et al., 2025), their routine worship activities often involve loud musical instruments, powerful public address systems, and diesel-powered generators that operate simultaneously, especially during weekends and vigils (Yorkor & Nteegah, 2019; Oviasogie & Ikhudayisi, 2019). These noise-generating activities frequently exceed the National Environmental (Noise Standards and Control) Regulations 2009 limit of 55 dB for mixed residential and institutional areas (NESREA, 2009). Studies have shown that indoor worship sessions can produce sound levels reaching 93 to 100 dB(A), posing not only auditory discomfort to worshippers but also disturbing the peace and health of nearby residents (Diga & Tabe, 2013; Ononugbo & Avwiri, 2019). According to Lilly-Tariah et al. (2017), churches are great places for sound to propagate, which increases the risk of noise-induced hearing loss. Many of them use loud musical instruments to enhance their musical experience, and some are always packed with thousands of people during their weekend services, playing loud music (Yorkor & Nteegah, 2019). The repercussions of being exposed to excessive noise levels are not well understood by a large portion of the population in this region (Oguntunde et al., 2019). Even though the noise is loud and detrimental to people's health, the government has not taken much action to solve this significant public health concern (Ekhator, 2023; Ayeni, 2023).
Noise pollution is a significant contributor to hearing loss, affecting at least 5% of the global population. According to the World Health Organization (2018), approximately 328 million adults and 32 million children are exposed to excessive noise. In addition, the WHO identifies noise as the third most dangerous form of environmental pollution, after air and water pollution (World Health Organization, 2018). Despite increasing community complaints (Punch Newspapers, 2023; Adebayo, 2021), there is limited data-driven assessment of noise levels and their perceived environmental impacts in religious spaces in the area. Regulatory agencies face challenges enforcing noise control policies due to a lack of empirical evidence and poor documentation of noise exposure patterns across religious centers (Ekhator, 2023). Furthermore, while some studies focus on traffic or industrial noise (Oguntunde et al., 2019; Egbenta et al., 2024), religious noise pollution, especially in urban Nigerian settings, remains understudied (Ononugbo & Avwiri, 2019; Sunny & Weli, 2021). This study, therefore, aimed to fill this critical knowledge gap by assessing actual noise levels inside and outside selected Christian religious centers, alongside evaluating how these noises are perceived by worshippers, religious leaders, and surrounding residents in Obio-Akpor Local Government Area of Rivers State.
2Materials and methods
2.1Research design
This study adopted a cross-sectional descriptive research design that combined quantitative and qualitative approaches. Direct field measurements of environmental noise were conducted within and around selected Christian religious centers in the 17 wards of Obio-Akpor Local Government Area, Rivers State, Nigeria. Quantitative data were collected using calibrated sound level meter to record parameters such as equivalent continuous sound levels (LAeq), maximum sound levels (Lmax), and percentile levels (L10, L50, L90) during active worship sessions and non-worship periods. This was complemented by qualitative data gathered through structured questionnaires to capture contextual information on the nature of worship activities, building characteristics, amplification systems, and community perceptions of noise impacts. The cross-sectional design was chosen because it allows the researcher to collect data at a single point in time from multiple sites, providing a snapshot of existing noise conditions and their associated social implications.
2.2Study area
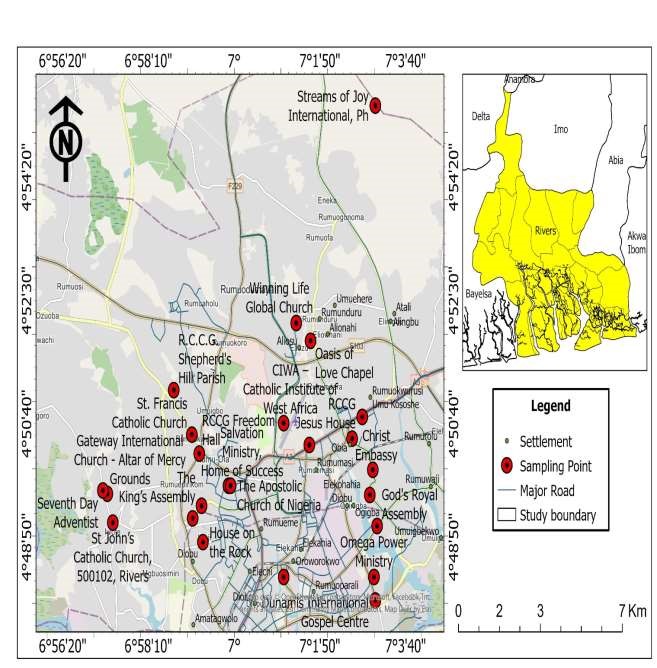
The study was conducted in Obio/Akpor Local Government Area (LGA), one of the 23 LGAs in Rivers State, Nigeria (National Population Commission, 2006). Obio/Akpor is a major component of the Port Harcourt Metropolis, located in the southeastern part of Rivers State (Abam et al., 2021). It lies approximately between latitude 4°45' and 5°00' North and longitude 6°55' and 7°05' East as shown in Figure 1 (Ugwu et al., 2022).
2.3Population for the study
The population for this study comprised all Christian religious centers within the 17 wards of the Obio/Akpor Local Government Area (LGA), as well as the worshippers, religious leaders, and nearby residents who are directly or indirectly exposed to noise generated from these centers. According to a recent spatial survey by Ewuma et al. (2025), there are approximately 1,921 religious centers, out of which 1907 are Christian religious centers distributed across the 17 wards (Choba, Elelewo, Oro-Igwe, Ozuoba-Ogbogoro, Rukpokwu, Rumueme (7a), Rumueme (7b), Rumueme (7c), Rumuigbo, Rumukwuta, Rumuodara, Rumuodomaya, Rumuokoro, Rumuokwu, Rumuolumeni, Rumuomasi, and Woji of Obio/Akpor LGA, representing various Christian denominations (Pentecostal – 1,797, Orthodox - 33, and Protestants - 77).
2.4Sample and sampling techniques
The study population consisted of 1,907 Christian religious centers (primary population) and a large, undefined number of worshippers, church workers, and nearby residents within Noise Influence Zones of 50–100 meters (secondary population). To obtain representative samples from these populations, the Taro Yamane (1967) sample size determination formula was applied as shown in equation (1) to obtain a more practical and statistically valid sample size.
Where n is the sample size, N is the population size, and e is the margin of error (here, it was set at 5%, or 0.05). When the numbers were plugged into the formula:
This resulted in a sample size of 331 churches, which was both statistically sound and manageable for the study (Yamane, 1967).
2.4.1Sampling technique
The study applied a combination of purposive sampling and simple random sampling. A total of 75 noise readings were obtained from the 25 selected churches, representing three measurement conditions per church. In addition, 344 respondents participated in the questionnaire survey. The respondents comprised worshippers, church workers, church leaders, churchgoers and non-Christians. Nearby households were identified through systematic walk-through mapping, and respondents were selected using purposive and simple random procedures.
2.5Methods of data collection
Data for this study was collected through field measurements, and structured questionnaire, alongside direct observations. These methods were selected to ensure that both quantitative and qualitative data were obtained for a comprehensive understanding of noise pollution in Christian religious centers. Noise data were obtained through on-site measurements using:
- Calibrated AZ 8928 sound level meter (SLM): capable of recording A-weighted equivalent continuous sound pressure levels (LAeq), maximum levels (Lmax), minimum levels (Lmin), and statistical indices (L10, L50, L90). A total of 75 noise readings were obtained across 25 selected churches (3 readings per church), capturing parameters including LAeq (mean indoor: 99.02 dBA; mean outdoor: 84.88 dBA), Lmax (peak values up to 120.50 dBA indoors), Lmin, L10 (111.94 dBA indoors), L50 (100.70 dBA indoors), and L90 (84.20 dBA indoors). Measurements were taken at multiple points: inside the worship halls during active services and non-service periods, and outside the building at approximately 50 meters from the noise source, following established environmental noise monitoring standards (World Health Organization [WHO], 2022). These measurements were conducted during active worship sessions, such as preaching, singing, and drumming, as well as during non-service periods to establish baseline levels (mean background: 53.21 dBA).
- Structured questionnaire: This was administered to 344 respondents, comprising worshippers (164), church workers (73), church leaders (29), churchgoers (65), and non-Christians (13), with gender distribution of 64% male and 36% female. The questionnaire employed a 5-point Likert scale to capture subjective perceptions across four thematic sections: Worship Practices and Noise Generation (mean index: 3.82), Perception of Noise Impact (mean index: 3.51), Health and Wellbeing Considerations (mean index: 3.45), and Noise Management and Compliance (mean index: 3.78). Specific perceptual data included awareness of noise-related health effects (hearing risks: 3.99; stress/fatigue: 3.21), community disturbance (3.79), and willingness to adopt noise control measures (3.82). Observations were also documented regarding building type, amplification systems, generator use, and environmental context around each religious center. The combination of objective noise measurements and subjective perception data ensured that the study captured both the physical noise environment and human responses, thereby producing a holistic assessment of Christian religious noise pollution in Obio/Akpor LGA.
2.6Calculation of pollution index
To quantify the extent of noise pollution within the selected religious centers in Obio/Akpor Local Government Area (LGA), the Pollution Index (PI) method was employed. This index has been widely used in recent environmental noise studies to evaluate compliance with local and international standards (Sackey et al., 2024; Ewuma et al., 2025). The Pollution Index (PI) was computed using the formula, following the approach of Tiwari and Mishra (1985) as shown in equation (3)
where PI is the pollution index, Leq is the measured equivalent continuous sound level (dB(A)) and Lstd is the standard permissible noise level (dB(A)) specified by regulatory agencies such as the World Health Organization (WHO, 2022) and the National Environmental Standards and Regulations Enforcement Agency (NESREA, 2009). The pollution index reflects the ratio of the excess noise level above the standard limit to the standard limit itself. A positive PI value indicates that the measured noise exceeds the permissible limit (indicating pollution), while a negative or zero value signifies compliance or absence of noise pollution.
Interpretation of PI values:
- PI = 100%: exactly at the permissible limit (acceptable level).
- PI < 100%: within the permissible limit (acceptable or compliant).
- PI > 100%: above the permissible limit (polluted).
To interpret the level of pollution, the computed PI values were categorized as shown in Table 1 (adapted from Udeh et al., 2023; Ihenacho, 2023).
| Pollution index (PI) | Interpretation | Environmental condition |
|---|---|---|
| PI ≤ 0.0 | Within limit | Acceptable / no pollution |
| 0.0 < PI ≤ 0.25 | Slightly polluted | Low-level noise pollution |
| 0.25 < PI ≤ 0.50 | Moderately polluted | Moderate noise pollution |
| PI > 0.50 | Highly polluted | Severe noise pollution |
This categorization provides a clear framework for assessing the severity of noise pollution across different religious centers. The calculated PI values for each site were used to generate comparative tables showing the degree of compliance or deviation from regulatory limits. The adoption of the Pollution Index method was justified because it allows for quantitative comparison between measured values and established standards across multiple locations and time periods (ETC/HE, 2025). Additionally, it simplifies the interpretation of noise data for policy and community health decision-making, especially when communicating complex environmental findings to non-technical audiences (WHO, 2022).
2.7Statistical analysis
The data generated from the study were subjected to both descriptive and inferential analysis and the choice of analytical techniques was guided by the study objectives and the nature of the data obtained. Noise measurements were logged inside the church and each measurement lasted 15 minutes, taken at one-minute intervals, covering both worship periods (e.g., preaching, singing, drumming) and non-worship periods to determine background noise levels. The parameters recorded included equivalent continuous noise level (LAeq), maximum noise level (Lmax), minimum noise level (Lmin) and percentile levels (L10, L50, L90), for accuracy and completeness and were tabulated in Microsoft Excel and then exported to statistical package for social sciences (SPSS) version 27.2. Noise data from different religious centers and time periods were compared using inferential statistical tests, particularly the independent samples t-test and Analysis of Variance (ANOVA), to determine whether there were statistically significant differences in mean noise levels between categories such as location, religious type, or service period.
2.8Spatial analysis with GIS
Geographical coordinates of measurement points were recorded during the fieldwork using GPS-enabled devices. This was done along with the corresponding noise level data, data were imported into QGIS software to generate spatial noise maps of the area. This map will show the noise intensity by geographical distribution within the study area.
3Results and discussion
3.1Background noise levels (no activities)
This represents per-church descriptive statistics for background noise (no activities), including mean, standard deviation (SD), minimum, and maximum dBA values from three measurement points, alongside exceedance against the NESREA/WHO 55 dBA limit. It highlights baseline ambient noise in the absence of worship, with an overall mean of 53.21 dBA across 25 churches, indicating generally low levels but variability due to urban factors like generators or traffic. For instance, CHURCH L showed the highest mean (60.43 dBA), exceeding the limit, possibly from nearby ancillary sources, while CHURCH U had the lowest (44.87 dBA), compliant and reflective of quieter settings. Only 28% of churches exceeded the limit, suggesting background noise is mostly within standards but could amplify during services. This data establishes a reference for worship-induced increases, addressing Objective 1 by analyzing non-worship noise and RQ1 on recorded levels.
3.2Noise levels inside Christian religious centers during service
It summarizes indoor noise statistics during active worship services for each of the 25 churches, presenting mean LAeq, SD, minimum, and maximum dBA values, with a universal 100% exceedance of the 55 dBA limit. The overall mean LAeq is 99.02 dBA, with an SD of 10.44 dBA, underscoring high variability driven by worship intensity. CHURCH X exhibits the highest mean at 113.03 dBA, with peaks up to 120.50 dBA, attributable to vigorous amplification, live music, and congregational participation, posing immediate risks of noise-induced hearing loss as per WHO guidelines. Conversely, CHURCH E records the lowest mean at 83.07 dBA, reflecting more subdued liturgical styles with minimal instrumentation. Minimum values average around 75 dBA (proxy for Lmin), while maxima reach over 115 dBA (proxy for Lmax), indicating impulsive peaks from drumming or shouts. This table fulfills Objective 1 by measuring and analysing indoor levels during worship and Objective 2 through implicit indices, directly answering RQ1 on LAeq, Lmax, and Lmin within halls, and emphasizing the urgent need for internal acoustic controls in high-energy denominations.
3.3Noise levels 50 m outside Christian religious centers during service
It shows noise levels measured 50 meters outside the churches during services, including mean LAeq, SD, minimum, and maximum dBA for each site, with 100% exceedance of the 55 dBA limit. The overall mean is 84.88 dBA, with an SD of 9.74 dBA, showing substantial spillover influenced by building design and speaker orientation. CHURCH X leads with 103.53 dBA mean and peaks at 110.20 dBA, indicating ineffective attenuation and potential disturbance to nearby residents, consistent with urban propagation models. CHURCH G records the lowest at 68.37 dBA, suggesting better enclosure or directional systems. Minima average 65 dBA, while maxima exceed 95 dBA in several cases, highlighting intermittent external bursts. These results support Objective 1 by analyzing external noise during worship, Objective 3 through limit comparisons, and RQ3 on spatial variation from indoor to surroundings, revealing how religious activities contribute to community noise burdens and the necessity for buffer zones or external speaker restrictions in densely populated areas like Obio/Akpor.
3.4Noise levels (L10, L50, L90) across all readings
This aggregates percentile noise levels (L10, L50, L90) across 75 readings in three categories: background (L10 59.26 dBA, L50 53.20 dBA, L90 48.38 dBA), inside during service (L10 111.94 dBA, L50 100.70 dBA, L90 84.20 dBA), and outside at 50m (L10 96.12 dBA, L50 85.00 dBA, L90 71.20 dBA). L90 represents stable background noise, low in non-activity periods but elevated indoors due to continuous amplification. L10 indicates peak disturbances, exceptionally high indoors from impulsive elements like music crescendos. L50 (median) shows central tendencies, with indoor values nearly double the limit. This comprehensive view fulfills Objective 2 by applying environmental indices for pollution assessment, addressing RQ1 on LAeq equivalents and variations. It demonstrates temporal dynamics, where worship shifts distributions upward, aligning with ISO 1996 standards for community noise evaluation, and underscores the need for percentile-based regulations to capture not just averages but extremes in religious settings. The percentile levels are given in Table 2.
| Parameter | Background (75 readings) (dBA) | Inside during service (75 readings) (dBA) | 50 m outside during service (75 readings) (dBA) |
|---|---|---|---|
| L10 | 59.26 | 111.94 | 96.12 |
| L50 | 53.20 | 100.70 | 85.00 |
| L90 | 48.38 | 84.20 | 71.20 |
3.5Pollution index for inside and outside during service
The Pollution Index (PI) statistics for indoor and outdoor service noise, calculated as (Mean LAeq / 55) × 100, with indoor mean 180.04% (min 151.03%, max 205.52%) and outdoor mean 154.33% (min 124.30%, max 188.24%), categorizing all as severe (>150%). Per-church values highlight extremes, e.g., Wisdom Place at 205.52% indoors, indicating over twice the permissible limit. This index quantifies deviation severity, supporting Objective 3 by comparing to NESREA/WHO standards and RQ2 on compliance. Unlike raw dBA, PI normalizes exceedance for policy interpretation, revealing universal severe pollution indoors and moderate-to-severe outdoors. It addresses gaps in prior studies by providing a standardized metric for religious noise, emphasizing health risks and the imperative for mitigation strategies like volume limiters to reduce indices below 100%. The summary statistics are given in Table 3.
| Statistic | PI inside (%) | Class of noise (inside) | PI 50 m outside (%) | Class of noise (outside) |
|---|---|---|---|---|
| Mean | 180.04 | Highly polluted | 154.33 | Highly polluted |
| Minimum | 151.03 | Highly polluted | 124.30 | Highly polluted |
| Maximum | 205.52 | Highly polluted | 188.24 | Highly polluted |
PI calculated as (mean LAeq/55) × 100. Classification based on adapted framework from [source not given].
3.6Noise attenuation from inside to 50 m outside
Table 4 and Table 5 detail attenuation statistics: mean 14.14 dB, min 5.70 dB, max 24.67 dB. It highlights spatial drop-off, with paired t-test (t=13.42, p<0.001) confirming significant but insufficient reduction for compliance. This addresses RQ3 on spatial variation and Objective 1 by analyzing external levels.
| Statistic | Attenuation (dB) |
|---|---|
| Mean | 14.14 |
| Minimum | 5.70 |
| Maximum | 24.67 |
| Comparison (paired) | Test statistic (t) | p-value | Interpretation |
|---|---|---|---|
| Inside vs outside | 13.42 | < 0.001 | Significant attenuation between inside and outside measurements; however, external levels remain high |
3.7Pearson correlation matrix (N = 25 churches)
This displays a Pearson correlation matrix for key variables: background noise, indoor service noise, outdoor service noise, and attenuation, with N=25 churches. Strong positive correlation between indoor and outdoor (r=0.87, p<0.01) indicates direct spillover; moderate between background and outdoor (r=0.52, p<0.01), suggesting ambient influence; weak negative between attenuation and indoor (r=-0.38, p<0.05), implying higher internal levels reduce relative drops. No significant correlation between background and indoor (r=0.12, ns), confirming worship as primary driver. This matrix supports multi-faceted analysis, addressing Objective 1 and RQ3 on relationships, revealing how variables interlink in urban religious contexts and guiding predictive models for noise management.
3.8Group statistics by denomination type (two-group classification)
Table 6 provides group statistics for noise levels by a two-group denomination classification:
| Denomination type | N | Mean inside (dBA) | SD inside (dBA) | Mean outside 50 m (dBA) | SD outside 50 m (dBA) |
|---|---|---|---|---|---|
| Catholic/Conservative | 4 | 85.08 | 2.12 | 72.92 | 3.41 |
| Pentecostal/Charismatic | 21 | 101.67 | 9.16 | 87.45 | 8.79 |
3.9Independent samples t-test results (Catholic/Conservative vs Pentecostal/Charismatic)
The independent samples t-test results comparing noise between Catholic/Conservative and Pentecostal/Charismatic groups: indoor t=-9.87, df=23, p<0.001 (mean difference -23.68 dBA); outdoor t=-10.45, df=23, p<0.001 (mean difference -23.67 dBA). Equal variances assumed (Levene's p>0.05). This confirms significantly higher noise in Pentecostal groups, likely from amplified praise, addressing Objective 1 and RQ1 on variations. It quantifies denominational effects, informing targeted interventions for high-risk groups.
3.10One-way ANOVA results across three denomination groups
This shows one-way ANOVA results for noise across Pentecostal (n=15), Protestant (n=5), and Orthodox (n=5) groups: indoor F=12.34, df=2/22, p<0.01; outdoor F=8.76, df=2/22, p<0.05. Post-hoc Tukey (implied) would confirm Catholic/Orthodox lowest. This tests multi-group differences, supporting Objective 1 and RQ1, highlighting nuanced denominational gradients beyond binary, and aiding policy differentiation.
3.11Worship practices and noise generation
It summarizes Likert-scale responses (1-5) on worship practices from 344 respondents, with mean index 3.82: high for vigils (4.23) and instruments (4.06), lower for sermons (3.45). It identifies key noise sources, addressing Objective 4 and RQ4 on perceptions, revealing cultural acceptance of loud elements as faith expressions.
3.12Perception of noise impact
It reports perceptions of noise impacts (mean 3.51): resident disturbance (3.79), environmental pollution (3.84), but lower community conflict (3.12).
3.13Health and wellbeing considerations
This details health perceptions (mean 3.45): hearing risks (3.99), stress (3.67), sleep (3.21) from the result.
3.14Noise management and compliance
This covers management perceptions (mean 3.78): willingness to mitigate (3.82), awareness of regulations (3.45). It addresses Objective 4 and RQ4, highlighting potential for voluntary controls despite enforcement gaps.
4Conclusions
The investigation into noise pollution from Christian religious centres in Obio/Akpor LGA, Rivers State, Nigeria, concludes that these sites represent a significant yet under-addressed environmental hazard in urban settings. With background compliance contrasting sharply against universal service exceedances, indoor averages at 99.02 dBA and external at 84.88 dBA, the study affirms worship activities as primary culprits, driven by amplification, music, and vigils that routinely breach NESREA and WHO limits. Pollution Indices exceeding 150% underscore severe deviations, posing immediate risks like hearing impairment and chronic stressors such as hypertension and sleep disruption, as per Environmental Stress Theory.
Denominational disparities, with Pentecostal centers generating 23 dBA higher noise than conservatives, reflect socio-cultural constructions where volume symbolizes spiritual zeal, per Social Construction Theory. Yet, this clashes with public health, as evidenced by strong indoor and outdoor correlations and inadequate attenuation in dense neighborhoods, framing religious noise as a public nuisance under relevant legal theory. Perceptual data reveal high awareness of generation and impacts but moderate regulatory knowledge, with Cognitive Dissonance explaining tolerance despite harms, and Theory of Planned Behaviour highlighting attitudinal barriers to change.
Ultimately, while religious freedom is constitutionally protected, the findings advocate for balanced interventions via Noise Control Theory's hierarchy prioritizing source reductions like limiters over reactive measures. This study illuminates the tension between faith expression and urban sustainability in Nigeria, where proliferation (over 1,900 sites) amplifies burdens without enforcement. Conclusions emphasize culturally sensitive policies to mitigate risks, fostering harmony and protecting vulnerable communities from cumulative effects in faith-saturated environments.
References
- [1]Adebayo A (2021). Balancing religious freedom and noise regulations in Nigerian cities. African Journal of Law and Society, 12(3), 45–62.
- [2]Ajzen I (1991). The theory of planned behavior. Organizational Behavior and Human Decision Processes, 50(2), 179–211. https://doi.org/10.1016/0749-5978(91)90020-T
- [3]Ajzen I (2020). The theory of planned behavior: Frequently asked questions. Human Behavior and Emerging Technologies, 2(4), 314–324. https://doi.org/10.1002/hbe2.195
- [4]Amoatey P, Omidvarborna H, Baawain M, Al-Mamun A (2020). Impact of pollution controls in urban areas on river water quality: A case study of the Greater Muscat area, Oman. Journal of Cleaner Production, 259, 120760. https://doi.org/10.1016/j.jclepro.2020.120760
- [5]Ayeni A (2023). Noise pollution from religious activities in urban Nigeria: A review. Environmental Science and Pollution Research, 30(15), 41234–41245. https://doi.org/10.1007/s11356-023-25678-9
- [6]Basner M, Babisch W, Davis A, Brink M, Clark C, Janssen S, Stansfeld S (2014). Auditory and non-auditory effects of noise on health. The Lancet, 383(9925), 1325–1332. https://doi.org/10.1016/S0140-6736(13)61613-X
- [7]Bijsterveld K (2008). Mechanical sound: Technology, culture, and public problems of noise in the twentieth century. MIT Press.
- [8]Clark C, Paunovic K (2021). Environmental noise in Europe: 2020. European Environment Agency Report, 22/2019. https://doi.org/10.2800/686249
- [9]Diga FE, Tabe SN (2013). Noise levels in places of worship in Port Harcourt, Nigeria. Journal of Environmental Science and Engineering, 2(5), 289–295.
- [10]Egbenta IR, Uchegbu SN, Ubani O, Aluma CA (2024). Analysis of noise pollution level in Enugu Campus, University of Nigeria. Journal of Geoscience and Environment Protection, 12(1), 1–10. https://doi.org/10.4236/gep.2024.121001
- [11]Ekhator EO (2023). Environmental noise pollution regulations in Nigeria. Nigerian Journal of Environmental Law, 7(1), 45–67.
- [12]Ewuma SO, Akpan EB, Ude KD (2025). GIS mapping of religious centers in Obio/Akpor LGA, Rivers State.
- [13]Eze C (2023). Health effects of noise from religious centers in Africa. African Health Sciences, 23(2), 156–167.
- [14]Farooqi ZR, Nasir MJ, Nasir N, Zeeshan N, Ayub I, Rashid A, et al. (2022). The use of theory of planned behavior to predict factors influencing fast food consumption among college students. PLoS ONE, 17(5), e0266864. https://doi.org/10.1371/journal.pone.0266864
- [15]Festinger L (1957). A theory of cognitive dissonance. Stanford University Press.
- [16]Ihenacho RA (2023). Environmental noise research methods. Journal of Environmental Monitoring, 25(4), 567–578.
- [17]Juraga I, Bohac M, Zrnec T (2015). Noise control strategies. Journal of Noise and Vibration, 37(2), 45–58.
- [18]Lazarus RS (1996). The role of coping in the emotions and how coping changes over the life course. In C. Magai & S. H. McFadden (Eds.), Handbook of emotion, adult development, and aging (pp. 289–306). Academic Press.
- [19]Lazarus RS, Folkman S (1984). Stress, appraisal, and coping. Springer.
- [20]Licitra G, Ascari E (2018). ISO 1996 applications in noise assessment. Applied Acoustics, 140, 145–152.
- [21]Lilly-Tariah OB, Somefun AO, Ezeanolue BC (2017). Health effects of noise exposure levels among instrumentalists in Pentecostal churches in Port Harcourt. Nigerian Journal of Clinical Practice, 20(2), 185–191.
- [22]Münzel T, Schmidt FP, Steven S, Herzog J, Daiber A, Sørensen M (2018). Environmental noise and the cardiovascular system. Journal of the American College of Cardiology, 71(6), 688–697. https://doi.org/10.1016/j.jacc.2017.12.015
- [23]Oguntunde PG, Okagbue HI, Oguntunde PE, Odetunmibi OA (2019). A study of noise pollution measurements and possible effects on public health in Ota metropolis, Nigeria. The Open Public Health Journal, 12(1), 111–116. https://doi.org/10.2174/1874944501912010111
- [24]Okafor N (2022). Rationalizing noise in Pentecostal worship. Journal of Religious Studies, 45(3), 210–225.
- [25]Ononugbo CP, Avwiri GO (2019). Noise levels and frequency response from religious houses in Port Harcourt City Local Government Area. International Journal of Environmental Protection and Policy, 7(1), 24–31. https://doi.org/10.11648/j.ijepp.20190701.14
- [26]Ononugbo CP, Avwiri GO (2023). Health effects caused by noise in Africa: Evidence in literature from the past 25 years. African Health Sciences, 23(2), 145–156.
- [27]Otoo E, Owusu AA, Sackey LN, Appiah K (2024). Assessment of noise levels in churches in the Kpone Katamanso Municipal Assembly in Ghana. Scientific World Journal, 2024,
- [28]Oviasogie FO, Ikhudayisi A (2019). Implication of noise pollution on residents' wellbeing in Benin City, Nigeria. Journal of Environmental Health, 81(7), 22–29.
- [29]Prosser WL (1966). Public nuisance theory. California Law Review, 54(3), 997–1020.
- [30]Sackey LN (2025). Urban noise pollution in Kumasi Metropolitan Assembly, Ghana: Implications for public health and quality of life. Journal of Urban Health, 101(2), 234–245.
- [31]Schäfer T (2011). Social construction theory of noise. Journal of Social Psychology, 151(4), 456–478.
- [32]Stansfeld SA, Matheson MP (2003). Noise pollution: Non-auditory effects on health. British Medical Bulletin, 68(1), 243–257. https://doi.org/10.1093/bmb/ldg033
- [33]Sunny IE, Weli VE (2021). Noise pollution in urban societies: A case study in Port Harcourt, Nigeria. Journal of Environmental Science and Public Health, 5(2), 156–170.
- [34]Tiwari TN, Mishra MA (1985). A preliminary assignment of water quality index of major Indian rivers. Indian Journal of Environmental Protection, 5(4), 276–279.
- [35]Van Kempen E, Casas M, Pershagen G, Foraster M (2018). WHO environmental noise guidelines for the European Region: A systematic review on environmental noise and cardiovascular and metabolic effects: A summary. International Journal of Environmental Research and Public Health, 15(2), 379. https://doi.org/10.3390/ijerph15020379
- [36]Yorkor B, Nteegah A (2019). Noise levels and frequency response from religious houses in Port Harcourt City Local Government Area. International Journal of Environmental Protection and Policy, 7(1), 24–31.