SaaSification
Hardware-to-Subscription Pivots: Measuring the “SaaSification” Trap in Industrial Products
Published January 2025
Abstract
Industrial and enterprise hardware companies increasingly combine equipment with software, maintenance, analytics, and other services. The strategic promise is attractive: recurring contracts may deepen customer relationships, monetize installed bases, smooth revenue, and create differentiated offerings. Yet a shift from equipment sales to subscriptions does not automatically create a software-as-a-service business or a durable advantage. It can also move costs forward, complicate sales incentives, unsettle customers accustomed to ownership, and delay cash returns while a firm develops the capabilities required to support service delivery. This article synthesizes research on servitization, product–service systems, hybrid offerings, the service paradox, firm resources, and dynamic capabilities to develop a framework for assessing these opposing possibilities. The framework treats the pivot as a sequence connecting strategic intent, capability development, offer and contract design, customer adoption, unit economics, cash-flow timing, and enterprise value. It proposes that subscription revenue is most defensible when the offer produces measurable customer value, the supplier can deliver it at scale, retention economics are attractive, and the firm’s capital structure can withstand transition investment. It also identifies a measurement problem: company disclosures such as annual recurring revenue and deferred revenue are not necessarily comparable, and they do not reveal churn, customer acquisition cost, or lifetime value unless definitions and underlying data are supplied. The article concludes with testable propositions, a comparative archival research design for Cisco, Deere & Company, PTC, and Honeywell, and a bounded descriptive baseline from their SEC Form 10-K disclosures. It remains a conceptual and non-causal study: the filings illustrate differences in recurring-revenue maturity, adoption indicators, contract timing, profitability, and cash flow, but they do not provide harmonized evidence of retention, customer lifetime value, or causal enterprise-value effects.
Keywords: servitization; subscription business model; industrial products; product–service systems; service paradox; recurring revenue; customer retention; resource-based view; dynamic capabilities
1Introduction
For a manufacturer, the sale of a machine is no longer always the end of the commercial relationship. Connected products can report performance data, software can add functionality after installation, service teams can maintain equipment over a long life cycle, and customers can pay for availability or use rather than ownership. These possibilities have encouraged firms to combine physical products with software and service contracts. The shift is often described as servitization, product–service innovation, or, in an especially digital setting, “SaaSification.” Each term points toward a change in how a firm creates and captures value, but none guarantees that the new model will be profitable.
The appeal of recurring revenue is easy to understand. A supplier may gain a closer view of how its product is used, support customers continuously, and generate revenue after the initial equipment transaction. A customer may prefer predictable costs, access to updates, or payment tied to availability or outcomes. In principle, the relationship can become more durable than a one-time sale. In practice, however, the economics depend on more than billing frequency. Service teams, cloud infrastructure, cybersecurity, implementation, customer success, and product redesign all require investment. A company can report growing service revenue while still carrying duplicated product and service costs or failing to earn the expected return on that investment. This gap between a promising service strategy and the financial outcome is often called the service paradox (Gebauer et al., 2005).
The strategic question is therefore not simply whether recurring revenue is preferable to one-time revenue. It is whether the proposed model creates additional customer value that the supplier can deliver repeatedly, retain customers for, and monetize at a return that compensates for transition costs and risk. The Resource-Based View (RBV) makes this a question about capabilities and defensibility. Software, data, engineering know-how, an installed base, and customer integration can support an advantage, but only if a firm can organize and deploy them effectively and competitors cannot readily reproduce or substitute for them (Barney, 1991). Dynamic-capabilities theory adds the challenge of reconfiguring assets and routines as technologies, customer expectations, and markets change (Teece et al., 1997).
This article develops a conceptual framework for studying the transition from equipment sales to recurring software-and-service contracts. It focuses on four issues that are frequently discussed together but should be measured separately: (1) the value delivered to the customer; (2) adoption, renewal, and retention; (3) the supplier’s unit economics and cash-flow profile; and (4) the durability of the resulting competitive position. The article uses the proposed December 2024–January 2025 setting and the candidate firms Cisco, Deere & Company, PTC, and Honeywell as a research-design example. It does not assert that the four companies have equivalent models or report comparable metrics. Instead, it explains how a future comparative analysis could establish comparability before drawing conclusions.
2Conceptual foundations
2.1Servitization is a change in value delivery, not only in billing
Vandermerwe and Rada (1988) introduced servitization to describe businesses adding services to their core product offerings and creating broader combinations of goods, services, support, self-service, and knowledge. Later work in manufacturing has emphasized the organizational capabilities and processes required to move from selling products toward integrated product–service offerings that deliver value in use (Baines et al., 2009). This matters because an equipment contract can become recurring without changing the customer’s experience or the supplier’s role. A financing plan, warranty extension, or maintenance renewal may be recurring in form but need not represent a deeper service transformation.
Oliva and Kallenberg’s (2003) study of capital-equipment manufacturers is especially relevant because it treats the move into services as a transition requiring organizational development. Manufacturers must learn to identify service opportunities, build service organizations, and manage relationships that continue after installation. Ulaga and Reinartz (2011) similarly argue that successful hybrid offerings depend on specific resources and capabilities for designing, selling, and delivering combinations of goods and services. These contributions shift the focus from the revenue line to the system that produces and sustains it.
2.2The resource-based view and dynamic capabilities
RBV explains why some firms may be better positioned than others to earn returns from a service strategy. Barney (1991) argues that resources can underpin sustained competitive advantage when they are valuable, rare, difficult to imitate, and difficult to substitute. Applied to industrial subscriptions, potentially relevant resources include proprietary software, domain-specific data, a large installed base, trusted relationships, specialized engineering, integration into customer workflows, and a service network capable of responding reliably. None should be presumed valuable simply because it exists. Its strategic value depends on whether it improves customer outcomes or enables the firm to capture value that rivals cannot easily match.
Dynamic-capabilities theory complements RBV by focusing on the firm’s capacity to sense opportunities, seize them, and reconfigure its resources (Teece et al., 1997). A hardware company may need to redesign product architectures, train sales teams to sell outcomes, create software release processes, develop customer-success roles, and change its planning and performance measures. These changes can be difficult because legacy product businesses reward large initial orders and may resist models that defer or redistribute revenue. A successful pivot thus involves both having strategic resources and changing how the firm combines them.
2.3Recurring-revenue economics and value capture
Subscription contracts promise repeat revenue, but the financial quality of that revenue depends on renewal, margin, cost to serve, and the timing of investment. SaaS businesses often assess cohorts, customer acquisition cost, retention, expansion, and customer lifetime value. Those concepts can inform industrial analysis, but industrial contracts often bundle equipment, installation, maintenance, connectivity, financing, software, and usage charges. The unit of analysis and allocation rules therefore need to be made explicit. A churn rate for a software seat is not necessarily comparable to the non-renewal of a multi-year equipment service contract.
Annual recurring revenue (ARR) is usually an annualized snapshot of recurring contracts at a point in time, but firms may define eligible revenue differently. Some exclude usage-based, professional-service, or variable components; others may include certain maintenance contracts. ARR is not equivalent to recognized revenue, bookings, cash receipts, or free cash flow. Deferred revenue or contract liabilities represent amounts billed or received before the related performance obligations are satisfied, subject to the company’s accounting policies. These balances can illuminate contract timing but do not directly indicate customer satisfaction, future renewal, or cash profitability.
The LTV:CAC ratio is conceptually useful because it connects customer acquisition investment to expected lifetime contribution. But it requires credible estimates of customer-level gross margin, retention duration, acquisition cost, and possibly expansion revenue. Industrial companies rarely disclose all these inputs at a comparable level. Where data are not available, a responsible study should not construct an artificial LTV:CAC estimate from ARR and a generic churn assumption. It should say that the economics cannot be calculated from public disclosures and use narrower observable proxies instead.
3Literature review: promise, paradox, and customer acceptance
3.1The strategic promise of services
The literature describes several reasons manufacturers seek to expand services. Services may differentiate products, support customer needs over the installed life of equipment, and create opportunities for higher-value activities. The manufacturing review by Baines and colleagues (2009) presents servitization as a potentially important strategic route, while cautioning that it is not a universal remedy. Raddats and colleagues (2019) organize contemporary research into major streams that include offerings, strategy and structure, motivations and performance, resources and capabilities, and service development, sales, and delivery. Their review reinforces the point that servitization is a multi-part transformation rather than a standalone revenue initiative.
Research on firm value provides a more nuanced picture. Fang et al. (2008) examine the effect of service-transition strategies on firm value and show that the value relationship is conditional rather than a simple “more service is always better” rule. Their contribution is important for this article because it frames service strategy as a question of degree and context: a firm’s existing capabilities, the relatedness of the service to the product, and the point reached in the transition can influence the outcome. The practical implication is that the unit of analysis should not be only the share of service revenue; researchers should also assess what kind of service is sold, how it complements the core product, and whether the company can deliver it efficiently.
3.2The service paradox and the transition trough
The service paradox captures a central tension: firms may increase service offerings and incur substantial associated costs without realizing the corresponding financial returns they expected (Gebauer et al., 2005). The paradox is not evidence that services are intrinsically unprofitable. Rather, it directs attention to the way a service strategy is designed, sold, staffed, and aligned with customer needs. A firm may develop offerings customers do not value, price them below their cost to serve, fail to coordinate product and service incentives, or invest ahead of adoption without a credible path to scale.
Neely’s (2008) cross-country firm analysis supplies a caution against relying only on strategic narratives. It reports heterogeneous financial outcomes in a large sample of manufacturing firms, including lower aggregate profit as a share of sales among servitized firms, with results moderated by firm size and a greater proportion of bankruptcy among servitized firms than expected. These findings cannot be translated mechanically to a small set of later industrial technology companies. They do, however, show why a study should test transition costs and downside exposure alongside revenue growth.
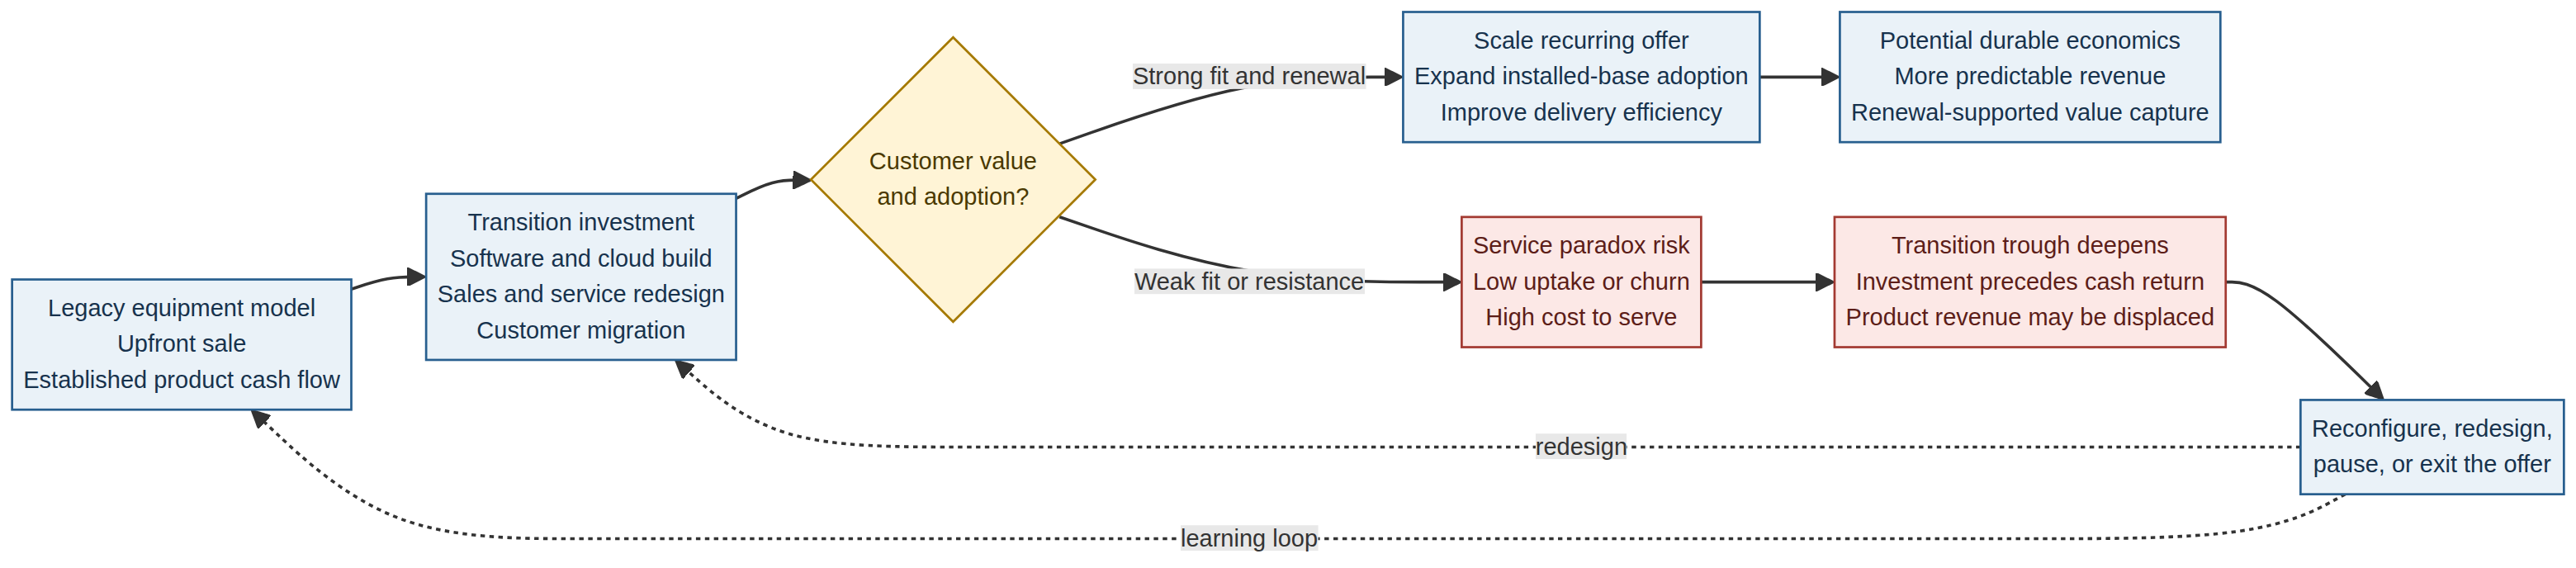
The term “transition trough” is used here as an organizing concept rather than as a claim that every company follows an identical curve. A firm may incur research and development, cloud, integration, training, and sales-transformation costs before the recurring model reaches sufficient scale. If the firm simultaneously reduces product sales or gives up an upfront purchase price, cash generation may weaken during the transition. The trough may be deeper when the new offer requires substantial installation, customization, customer support, or long adoption cycles. Conversely, a firm that builds on an existing service network and a well-understood customer need may be able to increase recurring revenue without a severe cash-flow gap.
The timing distinction is central. Revenue can recur even when cash collections are annual or prepaid; recognized revenue can be deferred over the contract term; and cash costs may arise before revenue is recognized. Consequently, a study needs a time series of operating cash flow, investment, recognized revenue, deferred revenue, and segment margins rather than a single ARR observation. Even then, changes may reflect acquisitions, price increases, foreign exchange, or accounting reclassifications rather than customer adoption.
3.3Customer acceptance and the ownership question
A supplier may prefer a recurring model, while a customer may value ownership, control, and the ability to use equipment without ongoing vendor dependence. Customer acceptance is therefore a substantive part of the research question, not a secondary marketing issue. Product–service system research has examined acceptance and uncertainty associated with such offers (Rexfelt & Hiort af Ornäs, 2009). While that work is not a direct test of industrial subscription contracts, it helps frame issues that a case study should investigate: perceived relative advantage, uncertainty, risk, and the customer’s understanding of the offer.
3.4What the literature leaves unresolved
The literature offers strong conceptual and case-based insight into servitization, capabilities, customer value, and performance trade-offs. It is less able to answer a narrowly specified question about the “SaaSification” of industrial products using comparable public-company ARR and deferred-revenue data. First, the main constructs differ across studies and companies. Servitization may refer to any increase in services, a specific product–service system, or a shift toward advanced outcome-based services. Second, company disclosures use different definitions of recurring revenue and may not disclose renewal or churn. Third, public data often lack the customer-level observations needed to measure customer lifetime value or acquisition costs. Fourth, firms self-select into different business models, so a simple association between recurring revenue and valuation may reflect underlying differences in management quality, industry position, or growth opportunity.
This article addresses these gaps by separating observable outcomes from mechanisms that remain private. It proposes a public-disclosure design for revenue mix, ARR, deferred revenue, margin, and cash flow, supplemented by interviews or customer evidence when the study specifically tests acceptance and retention. It also recommends that performance be assessed through multiple dimensions—growth, profitability, cash generation, retention, and valuation—rather than through a single metric.
| Literature stream | Selected sources | Relevance to the research question | Important limitation |
|---|---|---|---|
| Servitization foundations | Vandermerwe & Rada (1988); Baines et al. (2009); Raddats et al. (2019) | Define the transition and map the research field | Broad concepts do not establish subscription-specific outcomes |
| Product–service systems and acceptance | Mont (2002); Rexfelt & Hiort af Ornäs (2009); Oliva & Kallenberg (2003) | Frame integrated offers, transition process, and customer uncertainty | Acceptance evidence is not equivalent to customer churn in listed industrial firms |
| Service economics and firm value | Gebauer et al. (2005); Neely (2008); Fang et al. (2008); Visnjic Kastalli & Van Looy (2013) | Show that financial effects may be conditional and sometimes disappointing | Samples, measures, industries, and periods differ |
| Capabilities and business-model design | Ulaga & Reinartz (2011); Coreynen et al. (2017); Story et al. (2017) | Explain resources, digitization, and multi-actor service delivery | Capability constructs are not directly measured by ARR or deferred revenue |
| Strategic resources | Barney (1991); Teece et al. (1997) | Supply RBV and dynamic-capabilities lenses for defensibility and reconfiguration | General strategy theory must be operationalized for the industrial setting |
4A conceptual framework for evaluating the pivot
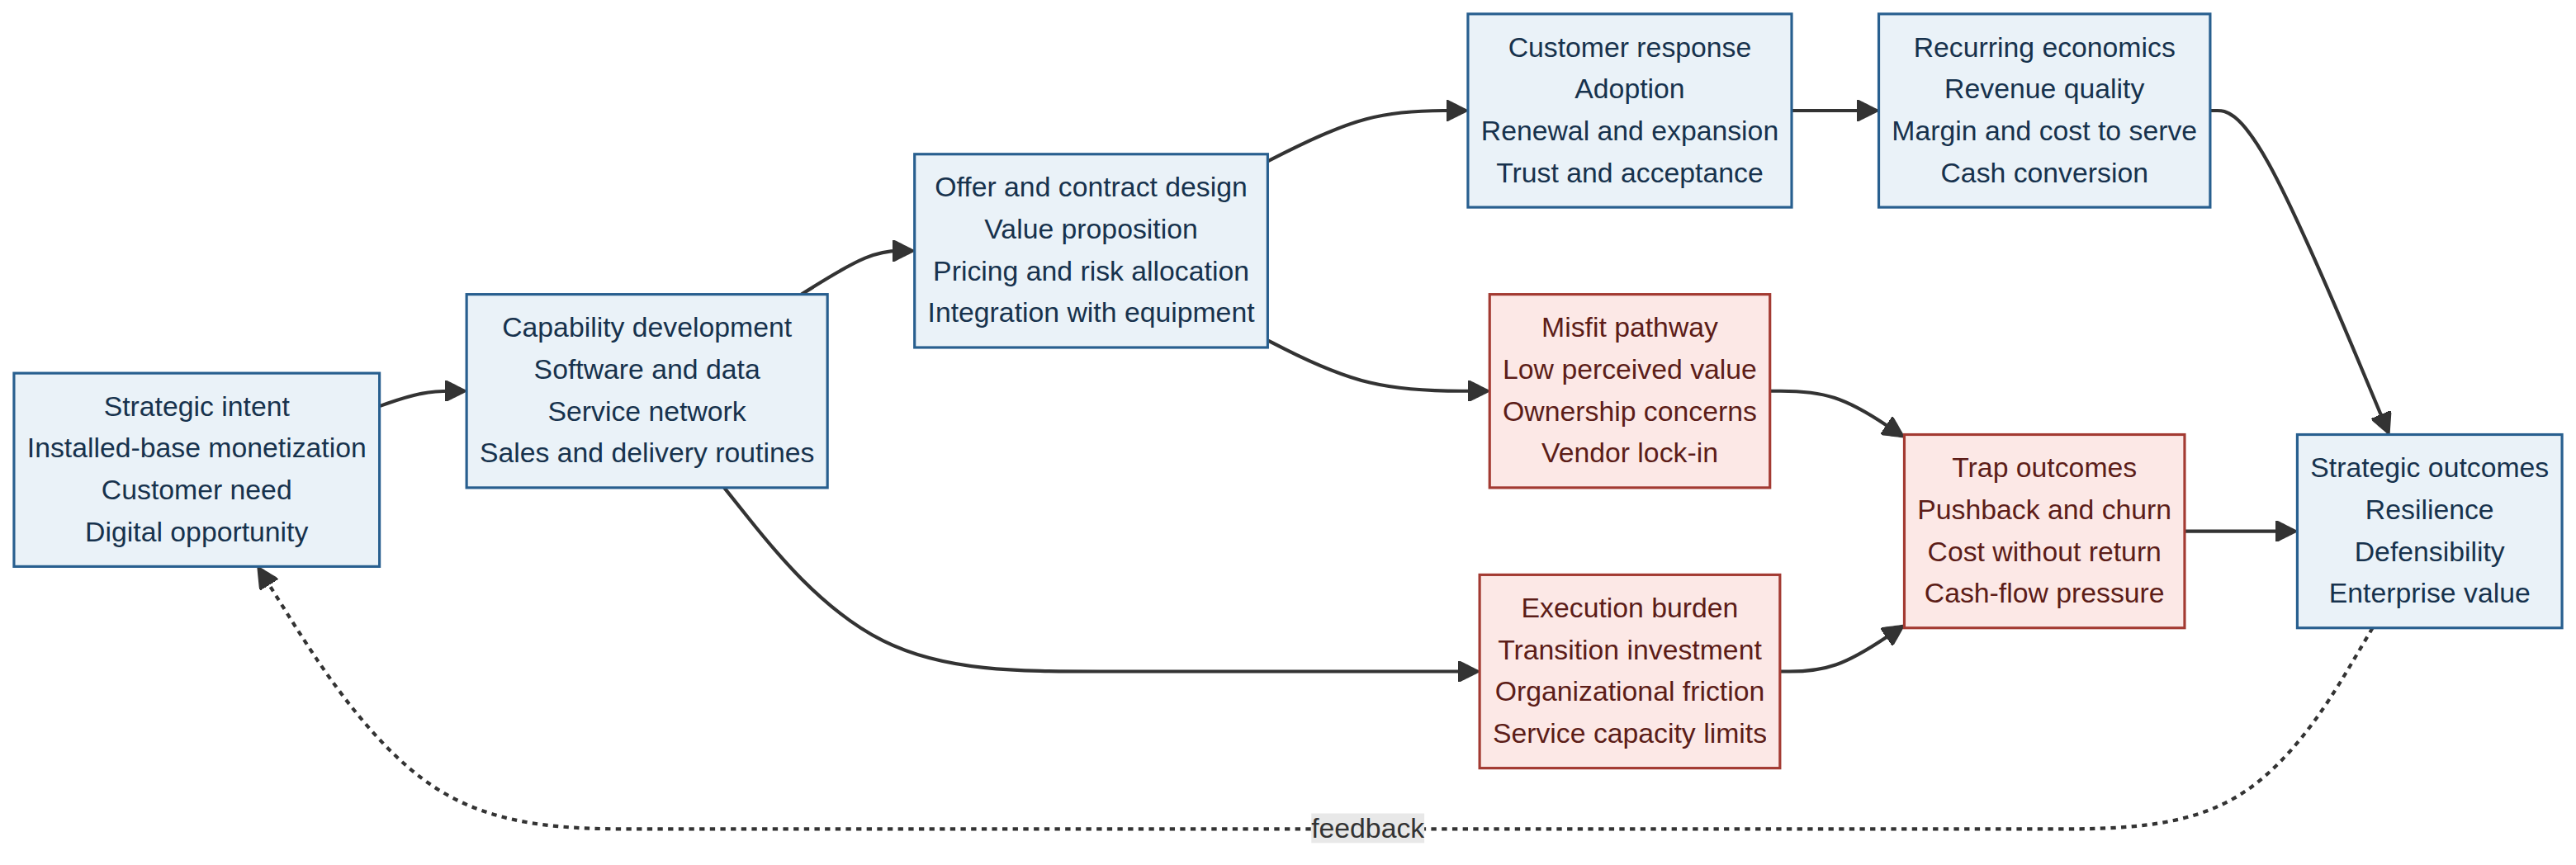
The proposed framework treats a hardware-to-subscription pivot as a chain of linked conditions. Strategic intent begins with a reason to change: installed-base monetization, customer demand, digital functionality, product differentiation, or a desire for more predictable revenue. The firm then has to develop or acquire capabilities to design, sell, implement, and support the new offer. The offer and contract must make economic and operational sense for the customer. Adoption and renewal create recurring revenue, but value capture depends on contribution margins, cost to serve, cash collection, and the extent to which the model is defensible. Outcomes feed back into investment and product strategy.
Two possible paths follow. On the value-creation path, the service solves a continuing customer problem, the supplier uses capabilities that are difficult to imitate, customers renew or expand, and the cost to serve declines or remains controlled as scale grows. The firm benefits from a more resilient relationship and an attractive contribution margin. On the trap path, the supplier emphasizes subscription revenue without proving willingness to pay, customers resist loss of ownership or vendor dependence, service costs accumulate, legacy and new sales incentives conflict, and cash investment arrives before renewal economics. ARR can rise in both paths; the decisive difference lies in the quality and durability of the underlying economics.
4.1Propositions for empirical testing
Proposition 1: A shift toward recurring software-and-service revenue is more likely to be associated with durable enterprise value when the offer is closely related to the manufacturer’s product and addresses a recurring, measurable customer need. The proposition follows from hybrid-offering and service-transition research, which places capability and customer value ahead of the billing form (Ulaga & Reinartz, 2011; Fang et al., 2008).
Proposition 2: The relationship between service expansion and financial performance is non-linear and contingent on organizational capability, scale, and service mix. Early investment may depress margins or cash flow, while poorly matched service offerings may fail to earn sufficient returns (Gebauer et al., 2005; Neely, 2008; Visnjic Kastalli & Van Looy, 2013).
Proposition 3: Customer adoption and renewal mediate the relationship between the subscription offer and recurring-revenue quality. ARR growth without evidence on renewal, expansion, or customer economics is an incomplete indicator of durable value. Customer acceptance should be tested through disclosed retention or contract data, customer interviews, or other direct evidence, not inferred from a company’s strategic messaging.
Proposition 4: Digitization supports servitization when digital resources are integrated with product, service, and ecosystem capabilities. Digital connectivity alone does not guarantee a viable service business; its value depends on the firm’s ability to convert data into reliable customer outcomes (Coreynen et al., 2017; Story et al., 2017).
Proposition 5: The near-term cash-flow effect depends on the relative timing of transition investment, equipment revenue displaced or retained, customer payment terms, and service delivery costs. Firms with greater financial flexibility may be better able to withstand a transition period, but this is an empirical question rather than an assumed advantage.
5Proposed empirical research design
5.1Design and case selection
A comparative archival case study is appropriate for an initial investigation because the core constructs are strategically rich but inconsistently disclosed. The candidate companies are Cisco, Deere & Company, PTC, and Honeywell. They offer potential contrasts in enterprise networking, agricultural equipment, industrial software, and diversified industrial products. They should not be treated as four interchangeable observations. Each case must first pass a disclosure screen: does the company identify recurring software or service revenue, explain its definition, and provide enough historical information to track at least two relevant outcomes?
The December 2024–January 2025 setting needs a precise interpretation. If it is an information cutoff, the study should include only documents publicly available by a specified date in January 2025. That choice may exclude some fiscal-year 2024 filings published after the cutoff. If it instead refers to a period of strategic announcements, researchers should define an event window and allow later filings as follow-up evidence. The protocol should avoid retroactively treating later information as if it were known at the original cutoff.
A multi-year panel is preferable to a single snapshot. For each company, researchers could gather five fiscal years of annual reports and the closest available quarterly materials, then identify a transition period using documented changes in product, service, or subscription strategy. The start of the transition should be based on a specific company disclosure or operating change rather than a date chosen after viewing the financial results. Where acquisitions or segment reorganizations alter the reporting perimeter, the series should be adjusted or clearly marked as non-comparable.
5.2Evidence and data sources
The primary evidence should be company filings and investor disclosures. Form 10-K Item 7 (Management’s Discussion and Analysis) can describe trends, liquidity, segment performance, and risks; the financial statements and notes provide recognized revenue, cash flow, contract liabilities or deferred revenue, and segment information where disclosed. Earnings releases and calls may explain non-GAAP recurring-revenue measures, but their definitions should be captured verbatim and tracked over time. Investor-day materials can provide strategic claims or targets, which should be labeled as management statements rather than realized results.
Public evidence is unlikely to provide comparable churn, customer acquisition cost, or customer lifetime value across the four companies. If these are central to the research question, the design should add interviews with customers or executives, a survey, or access to anonymized cohort data. If access is unavailable, these constructs should be reported as not disclosed rather than imputed. A study based only on public filings can still evaluate recurring-revenue growth, reported customer indicators, margins, cash flow, and investment, but it cannot claim to have directly measured customer lifetime economics.
5.3Construct operationalization
The study should define the outcome “durable enterprise value” before analysis. It can refer to long-run cash generation, sustained operating profitability, retention-adjusted revenue, or market value. These are related but not identical. If market valuation is used, the measure could be a clearly specified market-to-sales or enterprise-value multiple, observed at a defined date and compared with a suitable industry benchmark. If economic returns are the focus, a multi-year operating or cash-flow measure may better match the research question. The selected outcome and its limitations should be stated explicitly.
ARR should be captured only when the company discloses a definition. The data template should distinguish ending ARR from annual recognized subscription revenue, bookings, and cash receipts. If a company reports recurring software and service revenue but not ARR, the study should not manufacture an ARR equivalent without a transparent, consistent formula. Deferred revenue or contract liabilities should be collected as separate balance-sheet measures. These balances may indicate contract timing and advance billings, but they should not be interpreted as future revenue certainty or positive customer sentiment.
| Construct | Candidate measure | Potential source | Interpretation safeguard |
|---|---|---|---|
| Recurring revenue scale | Company-defined ARR; recurring software/service revenue; recurring-revenue share | 10-K, annual report, earnings release or investor materials | Preserve each company’s definition; do not equate ARR with recognized revenue or cash |
| Contract timing | Deferred revenue or contract liabilities; remaining performance obligations | Balance sheet, notes, MD&A | Record acquisitions, foreign exchange, and accounting changes; balance is not retention |
| Customer adoption | Subscribers, connected units, attach rate, installed-base penetration, bookings | Company operating disclosures; customer evidence | Capture denominator and period; treat absent data as “not disclosed” |
| Retention and expansion | Renewal, churn, net retention, contract renewal, usage | Disclosed KPIs or customer/cohort data | Do not infer renewal from ARR growth or deferred revenue |
| Unit economics | Segment gross margin, cost to serve, implementation expense; CAC/LTV only if disclosed | Segment reporting, interviews, internal data | Allocate shared costs transparently; avoid assumed LTV:CAC ratios |
| Transition burden | R&D, cloud/infrastructure investment, restructuring, sales transformation, working capital | Cash-flow statements, 10-K notes and MD&A | Separate one-time from recurring costs and distinguish cash from accounting charges |
| Financial performance | Segment margin, operating cash flow, free cash flow, operating return | Annual reports and filings | Control for portfolio changes and fiscal-period differences |
| Enterprise value | Defined market-value or cash-flow measure over a stated horizon | Market data plus financial filings | Do not claim causality from simple before/after changes |
5.4Comparative evidence from SEC Form 10-K filings
To provide company-level evidence, Table 3 reports a bounded archival baseline from the latest annual filings available at the manuscript’s January 2025 information cutoff. Cisco and Deere report fiscal years ending in July and October 2024, PTC reports the year ending September 30, 2024, and Honeywell’s latest available annual filing at that cutoff covers the year ending December 31, 2023. The firms are therefore not treated as a harmonized sample. The table preserves each company’s own terminology and records non-disclosure rather than imputing ARR, churn, or lifetime value (Cisco Systems, 2024; Deere & Company, 2024; PTC, 2024; Honeywell International, 2024).
| Company / period | Recurring or software indicator | Adoption / retention evidence | Contract timing / disclosed obligations | Profitability and cash-flow evidence |
|---|---|---|---|---|
| Cisco FY2024 | Services revenue was $14.55bn, up 5%; total software revenue was $18.4bn, up 9%; total subscription revenue increased 11%. | No comparable subscriber, renewal, churn, or net-retention rate was disclosed in the 10-K. | Deferred revenue was $28.5bn at July 27, 2024 versus $25.6bn a year earlier; this is a contract-timing measure, not retention. | Services gross margin was 68.1% versus 66.4%; operating cash flow was approximately $10.9bn. |
| Deere FY2024 | Solutions as a Service was described as an investment area, but those products did not represent a significant percentage of 2024 revenue. | The filing defines “engaged acres” as unique acres with at least one operation pass in John Deere Operations Center during the prior 12 months, but does not disclose a comparable count or renewal rate. | No comparable subscription liability or ARR measure was disclosed for Solutions as a Service. | Operating cash flow was $9.231bn; the filing also warns that customers may not embrace the Solutions as a Service value proposition. |
| PTC FY2024 | ARR was $2.2547bn, up 14%; recurring revenue was $2.134bn, equal to about 93% of total revenue. PTC defines ARR as annualized active subscription, SaaS, hosting, and support contracts. | PTC states growth is driven primarily by existing customers expanding their footprint, but does not provide a comparable gross-renewal or net-retention rate in the 10-K. | Deferred revenue was $775.3m and additional remaining performance obligations not yet on the balance sheet were $1.494bn. | Operating cash flow was $750.0m and free cash flow was $735.6m; operating margin was 25.6%. |
| Honeywell FY2023* | Honeywell describes Honeywell Forge software, predictive maintenance, analytics, and installed-base monetization across its businesses, but does not report a comparable ARR or recurring-revenue share. | No comparable connected-unit, renewal, churn, or retention KPI was disclosed in the annual filing. | No company-wide subscription metric comparable with PTC’s ARR was disclosed. | Operating cash flow was $5.340bn. The diversified portfolio and later reporting perimeter make direct comparison especially limited. |
Note: *Honeywell’s FY2023 Form 10-K was the latest annual filing available by the article’s January 2025 cutoff. Dollar amounts are reported in the companies’ stated units. “Not disclosed” means that the filing did not provide a comparable measure; it does not mean that the underlying activity was absent.
The table supplies descriptive evidence for the framework but does not validate the propositions. It does, however, sharpen the comparison. PTC is the most subscription-mature case in the disclosed data, Cisco shows a mixed hardware/software transition with meaningful service economics, Deere shows adoption-oriented technology indicators before Solutions as a Service becomes material, and Honeywell provides a diversified industrial case in which software-enabled services are strategically visible but not separately quantified. Across all four firms, public filings do not provide comparable retention or customer-acquisition data. Accordingly, Proposition 3 cannot be tested from these filings alone, while Propositions 2, 4, and 5 can be examined only as partial, descriptive associations (Cisco Systems, 2024; Deere & Company, 2024; PTC, 2024; Honeywell International, 2024).
5.5Analysis strategy
A quantitative supplement could estimate within-firm changes in recurring-revenue measures, margins, and cash flow before and after a documented pivot. If a larger sample can be built, a panel model could compare firms with different levels of service intensity while controlling for industry, scale, profitability, acquisitions, growth opportunities, and time effects. However, the strategy choice is endogenous: firms may pivot because their product margins are already falling, because they have stronger digital capabilities, or because customers are requesting new contracts. A simple association cannot establish that the pivot caused a financial result. Matching, event-study design, or other identification methods may improve inference, but only if the assumptions and comparison group are credible.
The evidence in Table 3 is the article’s descriptive empirical supplement; it should not be read as a causal test or as a harmonized cross-company performance chart. Once a larger firm-year dataset is assembled, suitable numerical visuals could include a time-series chart of recurring revenue and cash flow, a cross-case margin comparison, or a clearly defined composition chart where categories are exhaustive and mutually exclusive.
6Discussion
The “SaaSification trap” is best understood not as a warning against subscriptions but as a warning against confusing a revenue format with a functioning business model. Recurring contracts can create value when customers receive ongoing benefits, the supplier has the capabilities to deliver those benefits, and the relationship renews at acceptable economics. The same contracts can destroy value when they add complexity and fixed costs without improving customer outcomes or when a company shifts revenue timing faster than it can adapt its organization.
This view also helps interpret customer pushback. A customer may resist a subscription because it is more expensive over the life of the asset, because it limits control, because it introduces vendor lock-in, or because the offered service does not solve a pressing problem. Resistance is not necessarily a short-term communication issue. It may indicate a mismatch between the supplier’s model and the customer’s procurement logic. Conversely, customer acceptance may be strong when the contract transfers risk, reduces downtime, provides frequent upgrades, or converts an unpredictable capital cost into a service level the supplier can reliably meet. The specific mechanism needs evidence.
Cash-flow drag also deserves careful treatment. Subscription models can improve predictability after a sufficient base of customers is established, but the transition may require spending on digital infrastructure, product redesign, service staff, and new sales incentives before the revenue base is mature. Whether that creates a “trough” depends on contract duration, billing frequency, equipment revenue retained, cost-to-serve curve, and customer adoption. Deferred revenue can help describe contract accounting but cannot substitute for cash-flow analysis. A company may collect cash up front and recognize it over time, or recognize revenue while cash collection occurs on another schedule. Researchers should separate these timelines.
Finally, the review underscores a communication issue for scholarship and management. “Recurring revenue” is often used as though it were a single, transparent measure. It is not. ARR, subscription revenue, service revenue, deferred revenue, backlog, bookings, and customer retention each answer a different question. A comparative article can still use these indicators, but it must disclose the definition, period, accounting basis, and degree of comparability for every case. In this field, methodological transparency is part of the substantive argument.
7Implications
7.1Implications for researchers
Researchers should distinguish servitization intensity from subscription share and identify which activity is recurring. They should track product and service economics over time and model timing explicitly. They should not infer customer willingness to pay, churn, or lifetime value from public revenue indicators when the underlying customer data are absent. Comparative work should publish a metric dictionary, source log, and rule for handling non-comparable disclosures. When practical, archival work should be paired with interviews or customer-level data to illuminate mechanisms that annual reports cannot reveal.
Researchers can also improve theoretical precision by distinguishing four routes: ancillary services attached to equipment; digital services that enhance equipment performance; hybrid contracts combining products and support; and outcome-based models in which the supplier assumes more performance risk. These routes may all produce recurring revenue, but they imply different investment, risk, and bargaining structures. A central empirical question is not simply whether a company “servitized,” but which route it pursued and how the offer changed the customer’s economics.
7.2Implications for managers
Managers considering a pivot should begin with the customer problem, not the revenue classification. They should test whether the proposed subscription solves a continuing need, determine which costs the supplier will assume, and make total customer cost and exit terms understandable. They should not assume customers will accept recurring contracts because the product is connected or because competitors use subscriptions. Pilots should test willingness to pay, renewal behavior, implementation effort, and cost to serve.
Internally, firms should align product, software, service, sales, finance, and customer-success teams around a shared measure of customer outcomes. Incentives that reward only equipment bookings may discourage service sales; incentives that reward ARR without retention or margin may encourage low-quality contracts. Managers should track renewal, expansion, support burden, and cash conversion alongside recurring-revenue growth. Investment gates should account for the time required to build both technical capability and customer trust.
8Limitations and future research
This article remains a conceptual review and research framework with a bounded descriptive archival supplement, not a causal or comprehensive empirical assessment of Cisco, Deere & Company, PTC, or Honeywell. Table 3 uses company-level disclosures from SEC Form 10-K filings, but the periods, business-model definitions, and reporting perimeters differ. The filings support comparisons of disclosed recurring-revenue indicators, adoption proxies, contract timing, profitability, and cash flow; they do not establish which company created more value, whether customers renewed at a superior rate, or whether a three-year transition trough exists. The selected literature spans different research designs, industries, periods, and definitions of servitization. Findings from broad manufacturing samples may not apply directly to current enterprise software or industrial equipment firms.
The proposed archival design also has limits. Public disclosures are prepared for investor communication and financial reporting, not to measure customer acceptance or internal sales economics. Metric definitions can change, and segment data may not align with the business-model categories relevant to the study. Market value is influenced by interest rates, growth expectations, risk, and broad sector conditions. Even a well-constructed longitudinal comparison may not identify causality without a credible counterfactual.
Future research could pair public disclosures with interviews from customers and account teams, contract-level data, product telemetry, or anonymized renewal cohorts. Comparative studies could investigate whether subscription acceptance differs by equipment criticality, customer size, regulatory setting, or asset ownership preference. Researchers could also examine the effect of contract design—such as upfront fees, cancellation rights, usage pricing, and performance guarantees—on retention and profitability. Finally, longitudinal work could investigate how the service paradox changes over the life of a pivot, testing whether firms that initially incur higher costs later realize stronger margins or whether early losses persist.
9Conclusion
Moving from equipment sales to recurring software-and-service contracts can reshape how industrial firms create, deliver, and capture value. The literature supports the strategic potential of servitization but also documents meaningful risks: service investment may not yield expected returns, customers may not value or accept the offer, and new capabilities may take time to build. The central conclusion is therefore conditional. Recurring revenue is most likely to support durable enterprise value when it reflects a differentiated customer outcome, is backed by hard-to-replicate capabilities, produces healthy retention-adjusted economics, and can be financed through the transition.
The framework is illustrated with a bounded company-level baseline from SEC Form 10-K disclosures. The comparison shows why ARR, deferred revenue, margins, cash flow, adoption, and valuation must remain distinct measures: PTC reports a defined ARR and recurring-revenue series, Cisco reports service and subscription growth without a comparable ARR measure, Deere reports adoption-oriented technology indicators while Solutions as a Service remains immaterial, and Honeywell describes software-enabled services without a comparable recurring-revenue KPI. These observations strengthen the framework’s empirical relevance without constituting validation of its propositions.
References
- [1]Baines TS, Lightfoot HW, Benedettini O, Kay JM (2009). The servitization of manufacturing: A review of literature and reflection on future challenges. Journal of Manufacturing Technology Management, 20(5), 547–567. https://doi.org/10.1108/17410380910960984
- [2]Barney J (1991). Firm resources and sustained competitive advantage. Journal of Management, 17(1), 99–120. https://doi.org/10.1177/014920639101700108
- [3]Cisco Systems (2024). Annual report on Form 10-K for the fiscal year ended July 27, 2024. https://www.sec.gov/Archives/edgar/data/858877/000085887724000017/csco-20240727.htm
- [4]Coreynen W, Matthyssens P, Van Bockhaven W (2017). Boosting servitization through digitization: Pathways and dynamic resource configurations for manufacturers. Industrial Marketing Management, 60, 42–53. https://doi.org/10.1016/j.indmarman.2016.04.012
- [5]Deere & Company (2024). Annual report on Form 10-K for the fiscal year ended October 27, 2024. https://www.sec.gov/Archives/edgar/data/315189/000155837024016169/de-20241027x10k.htm
- [6]Fang E, Palmatier RW, Steenkamp JBEM (2008). Effect of service transition strategies on firm value. Journal of Marketing, 72(5), 1–14. https://doi.org/10.1509/jmkg.72.5.001
- [7]Gebauer H, Fleisch E, Friedli T (2005). Overcoming the service paradox in manufacturing companies. European Management Journal, 23(1), 14–26. https://doi.org/10.1016/j.emj.2004.12.006
- [8]Honeywell International (2024). Annual report on Form 10-K for the year ended December 31, 2023. https://www.sec.gov/Archives/edgar/data/773840/000077384024000014/hon-20231231.htm
- [9]Mont OK (2002). Clarifying the concept of product–service system. Journal of Cleaner Production, 10(3), 237–245. https://doi.org/10.1016/S0959-6526(01)00039-7
- [10]Neely A (2008). Exploring the financial consequences of the servitization of manufacturing. Operations Management Research, 1(2), 103–118. https://doi.org/10.1007/s12063-009-0015-5
- [11]Oliva R, Kallenberg R (2003). Managing the transition from products to services. International Journal of Service Industry Management, 14(2), 160–172. https://doi.org/10.1108/09564230310474138
- [12]PTC (2024). Annual report on Form 10-K for the fiscal year ended September 30, 2024. https://www.sec.gov/Archives/edgar/data/857005/000095017024127231/ptc-20240930.htm
- [13]Raddats C, Kowalkowski C, Benedettini O, Burton J, Gebauer H (2019). Servitization: A contemporary thematic review of four major research streams. Industrial Marketing Management, 83, 207–223. https://doi.org/10.1016/j.indmarman.2019.03.015
- [14]Rexfelt O, Hiort af Ornäs V (2009). Consumer acceptance of product-service systems. Journal of Manufacturing Technology Management, 20(5), 674–699. https://doi.org/10.1108/17410380910961055
- [15]Story VM, Raddats C, Burton J, Zolkiewski J, Baines T (2017). Capabilities for advanced services: A multi-actor perspective. Industrial Marketing Management, 60, 54–68. https://doi.org/10.1016/j.indmarman.2016.04.015
- [16]Teece DJ, Pisano G, Shuen A (1997). Dynamic capabilities and strategic management. Strategic Management Journal, 18(7), 509–533. https://doi.org/10.1002/(SICI)1097-0266(199708)18:7509::AID-SMJ8823.0.CO;2-Z
- [17]Ulaga W, Reinartz WJ (2011). Hybrid offerings: How manufacturing firms combine goods and services successfully. Journal of Marketing, 75(6), 5–23. https://doi.org/10.1509/jm.09.0395
- [18]Vandermerwe S, Rada J (1988). Servitization of business: Adding value by adding services. European Management Journal, 6(4), 314–324. https://doi.org/10.1016/0263-2373(88)90033-3
- [19]Visnjic Kastalli I, Van Looy B (2013). Servitization: Disentangling the impact of service business model innovation on manufacturing firm performance. Journal of Operations Management, 31(4), 169–180. https://doi.org/10.1016/j.jom.2013.02.001