pan-of-Control Transformations
De-layering and the Elimination of Middle Management: Span-of-Control Transformations
Published May 2025
Abstract
Corporate restructuring programs since 2023 have again promised that removing management layers and widening spans of control will speed up decisions. This article asks whether flattening improves operational decision latency or degrades project execution and middle-tier governance. It draws on Mintzberg’s account of organizational configuration, span-of-control optimization, Galbraith’s information processing theory and research on organizational change resistance, and adds a descriptive archival comparison of restructuring disclosures by Meta Platforms, Microsoft, Salesforce and Amazon for 2022–2024. The filings document restructuring costs and workforce reductions with reasonable precision, but only Meta discloses direct evidence of management-layer removal, and none reports comparable measures of decision latency, project execution or middle-management governance. The theoretical argument is that flattening tends to speed up routine, well-structured decisions while slowing cross-functional decisions and weakening the translation, coordination, control, development and knowledge functions that middle managers perform. The net result depends less on how many layers are removed than on which functions are removed with them. The article closes with practical principles: decide which functions to keep before cutting layers, match spans to the work, build lateral coordination and controls before removing vertical relays, protect the leadership pipeline, and measure decision latency rather than cost alone.
Keywords: de-layering; span of control; middle management; organizational design; restructuring; decision latency
1Introduction
In early 2023, a phrase began to echo through boardrooms and earnings calls: the "year of efficiency." Behind the slogan sat a familiar playbook. Cut the layers between the executive suite and the front line, widen the number of people each remaining manager oversees, and let decisions travel faster because fewer hands touch them. It sounded tidy. It sounded modern. It also sounded a lot like something we had heard before.
That is the first thing worth saying about de-layering: it is not new. Waves of corporate restructuring in the 1990s promised nearly identical benefits, and a sizeable body of research from that decade tells us what happened next (Bramble et al., 1996; Douglas, 1999). What is new is the technological backdrop. Collaboration platforms, enterprise systems, and analytics dashboards now make it plausible, at least on paper, that one manager can supervise twelve, fifteen, or even twenty people where once the comfortable number was six or seven.
This article asks a deliberately practical question. Did corporate transformation programs that flattened organizational hierarchies improve operational decision latency, or did they degrade project execution and middle-tier governance? To answer it, we draw on three theoretical lenses: Mintzberg's account of organizational structure, span-of-control optimization, and Galbraith's information processing theory. We also bring in the human side, because organizational change resistance is not a footnote to structural redesign. It is often the reason a redesign works or fails.
A note on evidence before we begin. The empirical anchor for this topic is the disclosed restructuring expense found in corporate 10-K filings, together with governance studies and enterprise reporting disclosures from public company annual reports. Those disclosures tell us what companies spent and what they said they intended. They rarely provide direct measures of decision latency, project execution, or middle-management governance. Figures 1–4 in this article remain illustrative; the comparative case table (Table 2) is a descriptive archival supplement based on named company filings. It does not turn management claims into findings.
Our short answer, if you want it up front: flattening tends to speed up routine, well-structured decisions and to slow down or quietly damage the things that middle managers did invisibly, such as translating strategy, coordinating across units, coaching, and catching problems early. The net result depends less on how many layers were removed than on which functions were removed along with them.
2Why organizations flatten
2.1The efficiency story
The logic of de-layering rests on a simple observation. Every layer of management adds cost, and every layer adds delay. Information passes upward through a chain of people who each summarize, filter, and sometimes soften it. Instructions pass downward through the same chain and arrive diluted. If you remove a layer, you remove both the salary line and the game of telephone.
This argument has genuine force. Li (1997) described how information and communication technologies allowed organizations to rethink their structures, moving from compromise-driven arrangements toward more harmonious designs in which information could flow without being relayed through every hierarchical step. When a system can show a regional director exactly what a branch is doing, the manager who once compiled that picture by hand looks redundant.
Seethamraju (2005) made a related point about enterprise resource planning systems. When transactions, approvals, and reporting live in a shared platform, a good deal of what managers used to do, namely collecting, checking, and forwarding data, gets automated. The implication for managers, the author argued, was that their role would need to change, not just shrink.
2.2The financial story
There is also a plainer motive. Managers are expensive, and in a year when investors are asking for margin improvement, a restructuring charge can be framed as an investment with a payback period. In a 10-K, that charge usually appears as a distinct line item, accompanied by language about severance, lease consolidation, and "organizational realignment." The disclosure is precise about cost and vague about benefit, which is exactly what you would expect. Costs are known on the day they are incurred. Benefits arrive, if they arrive, over years and are hard to separate from everything else going on.
That asymmetry matters for how we read the evidence. A company can report a restructuring charge with great accuracy and still have no reliable measure of how much slower or faster its decisions became afterward.
2.3The cultural story
Finally, there is a story about speed and ownership. Frigo and Janson (1993) described how General Electric's financial services operation used its "work-out" process to push decisions down and cut through bureaucratic habits. The lesson that many executives took from that era was that hierarchy breeds waiting, and waiting breeds missed opportunities. Taking out layers became shorthand for taking out waiting.
It is an appealing narrative. The trouble is that it treats a layer as a pure obstacle. In practice, a layer is also a place where certain work gets done.
3Theoretical foundations
3.1Mintzberg and the shape of the organization
Henry Mintzberg's framework describes organizations as combinations of five parts: the strategic apex, the middle line, the operating core, the technostructure, and the support staff. Different configurations emphasize different parts and coordinate work in different ways. The machine bureaucracy standardizes work processes. The professional bureaucracy standardizes skills. The divisionalized form standardizes outputs. The adhocracy relies on mutual adjustment.
What makes this useful for the de-layering debate is that the middle line plays a different role in each configuration. In a machine bureaucracy, middle managers enforce standards and relay information. In a divisionalized form, they act as the link between divisional performance and corporate strategy. In an adhocracy, the middle line is thin by design and the work is coordinated through direct conversation among experts.
This means that cutting the middle line is not one intervention. It is several, and their consequences depend on the configuration being operated on. A firm that is already close to an adhocracy may lose little by removing layers. A firm that runs as a machine bureaucracy, with work coordinated through supervision and standard procedures, may discover that it has removed its coordination mechanism without replacing it.
3.2Span of control as a design variable
Span of control, the number of direct reports per manager, is the arithmetic companion to hierarchy. For a given headcount, a wider span means fewer layers. A company of about 10,000 people with a span of six needs roughly five layers of management. Widen the span to twelve and the same company needs about four. The mathematics is neat, which is part of its appeal.
The human reality is less neat. A wider span means less time per direct report for coaching, feedback, and problem solving. It works best where tasks are routine, employees are skilled and self-directed, and the work does not require much real-time judgment from a supervisor. It works poorly where tasks are varied, interdependent, or novel.
Ingvaldsen and Benders (2016) offer a revealing illustration from lean production. They examined supervisors in lean settings and showed that the front-line supervisor is not simply a conduit. Supervisors translate management ideas into practice, and when that role is neglected or squeezed, the ideas get "lost in translation." It is a short step from that finding to the broader concern: remove or overload the translators and the message degrades.
3.3Galbraith and information processing
Jay Galbraith's information processing theory treats organizations as systems that must match their capacity to process information with the amount and uncertainty of the information they face. When uncertainty rises, organizations can reduce the need for information processing, for example by creating slack resources or self-contained tasks, or they can increase their capacity, for example by investing in vertical information systems or creating lateral relations.
De-layering can be read as a bet on the second option. The company invests in vertical information systems, such as dashboards and enterprise platforms, and removes the human relays. If the information the organization faces is mostly structured and predictable, the bet can pay off. If the information is ambiguous, if it involves interpretation, politics, or tacit knowledge, then a dashboard is a poor substitute for a person who understands the context.
Brews and Tucci (2004) examined the structural effects of internetworking, and their work supports a cautious reading. Digital connectivity can change the way firms organize, but the effects depend on the nature of the work and the existing structure. Technology opens possibilities. It does not guarantee them.
3.4Bringing the lenses together
Table 1 summarizes how the three lenses translate into predictions about flattening. It is a simplification, but it is a useful one.
| Lens | Core idea | Predicts de-layering will help when... | Predicts de-layering will hurt when... |
|---|---|---|---|
| Mintzberg's configurations | Middle line role varies by structure | The firm is already close to an adhocracy or the middle line mainly relays information | The firm depends on supervision or standards to coordinate work |
| Span-of-control optimization | Wider spans reduce layers but dilute attention | Tasks are routine and employees are skilled and autonomous | Tasks are varied, interdependent, or need frequent coaching |
| Galbraith's information processing | Structure must match information load and uncertainty | Information is structured and systems can carry it | Information is ambiguous, tacit, or politically sensitive |
| Change resistance | People shape whether structure works in practice | Employees understand and accept the new roles | Trust erodes and survivors withdraw or protect themselves |
4What span-of-control changes actually do
4.1The arithmetic of flattening
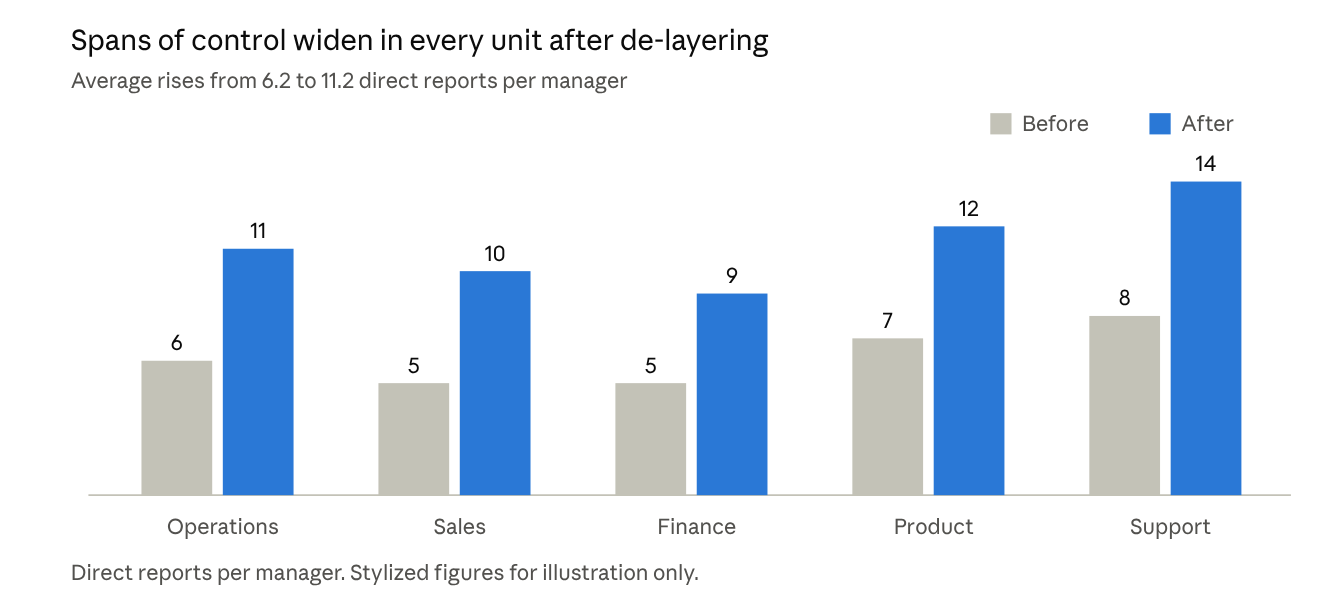
Consider what happens when a company widens its average span from six to eleven. If we hold headcount constant, the number of managers falls sharply, and the number of layers drops by one or two. The cost saving is easy to calculate. The effect on each remaining manager's calendar is just as easy to calculate, and it is rarely done.
A manager with six reports can hold weekly one-to-ones, notice when someone is struggling, and review work in some detail. A manager with eleven reports, who has also absorbed some of the duties of a removed colleague, is in a different job. The weekly one-to-one becomes fortnightly. The review becomes a skim. The conversation about career development gets postponed, then dropped.
This is not a failure of character. It is a failure of arithmetic. A day only has so many hours, and a manager's work has two components: the administrative work that scales with the number of reports, and the judgment work that does not scale at all.
4.2Where the work goes
When a layer is removed, its work does not vanish. It goes somewhere. Some of it is automated or eliminated, and that is the good outcome. Some of it moves upward to senior leaders, who become more involved in detail than they would like. Some of it moves downward to individual contributors, who find themselves doing coordination and reporting on top of their own tasks. Some of it simply does not get done.
Bramble et al. (1996) studied middle management in retailing during a period of corporate restructuring, and their case study captured this redistribution of duties and the pressure placed on those who remained. Currie (1999) examined middle managers in the National Health Service and argued that they held real potential to influence strategic change, a potential that disappears if the role is removed or hollowed out. The sectors differ, but the pattern is similar: middle managers carry strategy into practice, and cutting them cuts that channel.
4.3An illustrative picture of spans
Figure 1 shows a stylized before-and-after picture of average span of control across a hypothetical set of business units. It is illustrative, not drawn from a specific filing.
5The disclosure record: What 10-Ks tell us and what they do not
5.1Reading restructuring expense
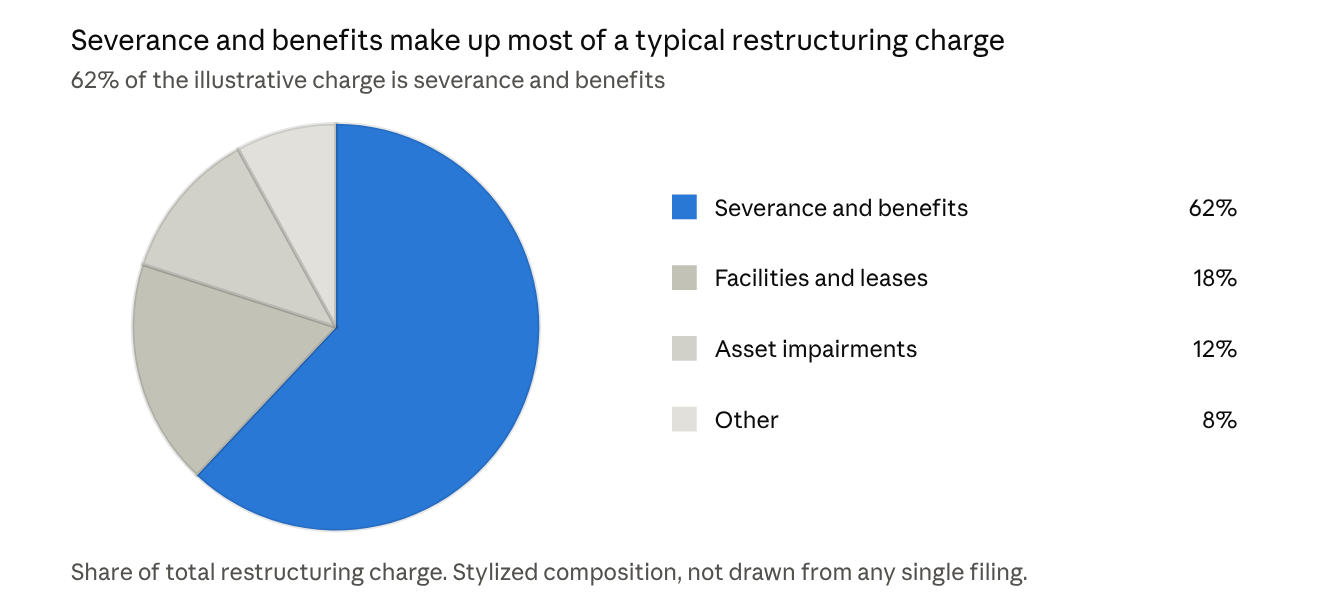
Public company annual reports offer a consistent place to look for the cost side of de-layering. Restructuring expense typically appears as a line in the income statement or in a footnote, broken down into categories such as employee severance and benefits, facility and lease costs, asset impairments, and other charges. Management's discussion often adds a narrative about the objectives.
For researchers, these disclosures have real strengths. They are standardized, audited, and comparable across years. They show the scale of commitment. A firm that books a very large charge is signaling that the change is substantial and not cosmetic.
They also have real limits. First, the charge is a cost, not a result. Second, the categories are broad, and companies vary in what they include. Third, there is a timing problem: costs are recognized when plans are committed, while the effects on execution may unfold over years. Fourth, firms rarely disclose how many of the roles removed were management roles specifically, as opposed to a mixture of functions.
Figure 2 gives an illustrative breakdown of the kind of composition one often sees in a restructuring charge. Again, the split is stylized.
5.2Governance disclosures
Corporate governance studies add a different kind of evidence. Martyn (2018) examined management control systems at the middle manager level and highlighted how much of the machinery of control, such as budgeting, performance measurement, and reporting, runs through the middle tier. If that tier thins out, then the control system either has to be redesigned or has to run on less attention. In practice, firms often do neither deliberately. They discover the gap when something goes wrong.
This is the governance risk in plain terms. Middle managers are, among other things, the people who check. They notice that a forecast looks optimistic, that a project is drifting, that a team is stretched. When there are fewer of them and each has more to watch, these quiet acts of verification are the first to be dropped, because nobody is measured on them.
5.3What a careful reader should look for
If you are reading a 10-K to assess a de-layering program, a few questions are useful. Did the firm disclose repeated restructuring charges across consecutive years, which can suggest the first round did not deliver? Did the risk factors section add language about talent retention, execution capacity, or internal controls after the restructuring? Did headcount fall faster than revenue or output? Did the firm's discussion of benefits become more specific over time, or did it stay at the level of general language about agility?
None of these is proof. Together they offer a pattern a thoughtful reader can weigh.
6Comparative company cases and reproducible method
To move beyond illustrative explanations, this article adds a bounded comparative case study of Meta Platforms, Microsoft, Salesforce, and Amazon. The cases were selected because each disclosed a restructuring or workforce-reduction initiative during 2022–2024, while Meta also filed an explicit statement about flattening management layers. The selection does not treat a general workforce reduction as evidence that middle-management layers were removed. A case is coded as having direct delayering evidence only when the company discloses management-layer removal, managers becoming individual contributors, or a measurable span-of-control change.
Evidence-status convention. “Fact” refers to a number or event reported in a filing. “Management claim” refers to the company’s stated objective or interpretation of its own program. “Interpretation” is the article’s reading of the disclosed evidence. “Hypothesis” identifies a relationship that remains to be tested. “Not disclosed” is a result of the review, not an assumption that the underlying activity did not occur.
| Case / period | Documented intervention | Structural and cost evidence | Observable operating indicators | Decision, execution, and governance evidence |
|---|---|---|---|---|
| Meta, 2022–2023 | Fact: Meta announced restructuring and layoffs. Management claim: its SEC-filed March 2023 update targeted flattening, canceling lower-priority projects, and reducing hiring. (Meta Platforms, 2023, 2024) | Fact: 2023 headcount was 67,317, down 22% year over year; 2023 restructuring charges were $3.452bn, including $1.170bn severance/personnel costs. Direct delayering evidence: many managers were to become individual contributors; the stated general ceiling was 10 direct reports. (Meta Platforms, 2023, 2024) | Fact: 2023 operating income was $46.75bn, up 62%; operating cash flow was $71.113bn. Management claim: Buck2 builds compiled about 50% faster. These outcomes are not attributable to delayering on their own. (Meta Platforms, 2023, 2024) | No company-wide decision-latency, project-on-time, escalation, or middle-management governance KPI was disclosed. Interpretation: this is the strongest direct delayering case, but the outcome evidence remains mixed in type and non-causal. |
| Microsoft, FY2023 | Fact: Microsoft announced actions to align costs with demand, prioritize investments, and consolidate office space. (Microsoft, 2023) | Fact: approximately 10,000 jobs were reduced; the charge was $1.2bn, including $800m employee severance. The 10-K does not identify the share of eliminated jobs that were managers or report a changed span of control. (Microsoft, 2023) | Fact: operating income was $88.523bn, up 6%; reported operating income was $88.523bn and adjusted operating income was $89.694bn. The filing provides no pre/post decision-speed measure. (Microsoft, 2023) | Project-completion, decision-turnaround, escalation, and middle-tier governance outcomes were not disclosed. Interpretation: restructuring is documented; delayering is not established. |
| Salesforce, FY2024 | Fact: the January 2023 Restructuring Plan sought to reduce operating costs and improve margins; workforce reduction was substantially completed by fiscal year-end. (Salesforce, 2024) | Fact: FY2024 headcount was 72,682. FY2024 restructuring charges were $988m, comprising $541m workforce-reduction charges and $447m office-space-reduction charges. No management-layer count was disclosed. (Salesforce, 2024) | Fact: operating cash flow was $10.234bn in FY2024, versus $7.111bn in FY2023. This is an operating outcome, not evidence that decisions or projects became faster. (Salesforce, 2024) | The 10-K does not disclose decision latency, project schedule adherence, escalation frequency, or a middle-management governance outcome. Interpretation: the case supports cost and workforce measurement but not a delayering test. |
| Amazon, FY2022–2023 | Fact: Amazon disclosed planned role eliminations and related severance in 2022; 2023 severance and related charges were not material. (Amazon, 2024) | Fact: 2022 estimated severance was approximately $720m, primarily related to planned role eliminations. 2023 headcount was approximately 1.525m. The filing does not identify management roles or a span change. (Amazon, 2024) | Fact: operating income increased from $12.248bn in 2022 to $36.852bn in 2023. The filing attributes changes to multiple factors, including sales and cost dynamics, not to delayering. (Amazon, 2024) | No public 10-K measure of decision turnaround, project completion, escalation, or middle-management governance was found. Interpretation: this is a restructuring comparator, not a confirmed delayering case. |
Note: Dollar amounts are reported in the companies’ stated units. The fiscal periods differ. Headcount reduction is not coded as middle-management reduction unless the filing provides direct evidence. “Not disclosed” means that the reviewed public filings did not provide a comparable indicator.
6.1Case variables and comparison procedure
The unit of analysis is the firm-year surrounding the disclosed intervention. The observation window is 2022–2024 for Meta, Salesforce, and Amazon and fiscal 2023 for Microsoft, with the immediately preceding fiscal year used as a descriptive baseline where the filing provides it. The source hierarchy is: (1) Form 10-K MD&A and notes; (2) SEC-filed exhibits containing management announcements; and (3) audited financial-statement and internal-control disclosures. Each source is recorded by company, fiscal period, filing date, page or section, and exact metric definition.
Structural change is coded as direct delayering only when the disclosure names layers, managers, individual-contributor conversion, or span of control. Restructuring cost is coded from severance, employee-transition, office, lease, impairment, and related categories. Decision latency is operationalized as disclosed time from issue identification to decision or approval. Project execution is operationalized as schedule adherence, cycle time, release/build time, milestone completion, or documented rework. Governance is operationalized as disclosed internal-control weaknesses, restatements, audit findings, escalation volume, compliance failures, or comparable control outcomes. Missing values are coded “not disclosed”; they are not estimated from headcount, operating income, or management rhetoric.
The comparison is descriptive. For each case, the study records pre/post changes in headcount, restructuring cost, operating income, operating cash flow, and any disclosed operating indicator, then asks whether the filing provides direct evidence for the proposed mechanism. It does not estimate a causal effect because the cases differ in scale, business model, macroeconomic exposure, acquisitions, and the composition of the restructuring. The appropriate empirical claim is therefore that the filings document interventions and selected outcomes, not that delayering caused a particular result.
7Decision latency: Did things get faster?
7.1The case for yes
It would be unfair to treat de-layering as a mistake in every case. There is a real mechanism by which it speeds up decisions. When an approval previously required sign-off from three levels, and now requires one, the elapsed time can fall dramatically. When a front-line team is empowered to resolve a customer issue without escalation, the response time improves.
The gains are most visible for decisions that are frequent, bounded, and well specified. Pricing exceptions within a range, routine purchasing, standard customer remedies, and scheduling are examples. The people who make these decisions have the information they need, and the risk of a bad call is limited.
Hassard et al. (2007), in their ethnographic work on multinationals, give a sense of how new organizational ideologies were presented to employees in terms of empowerment and responsiveness. The rhetoric was often compelling. Their research also showed that the experience at "the sharp end" could differ from the rhetoric, a gap that matters when we ask whether speed actually improved.
7.2The case for no
The counterargument is that the decisions that matter most for strategy are not the frequent, bounded ones. They are the infrequent, cross-functional, ambiguous ones: whether to delay a product launch, how to resolve a conflict between two units' priorities, whether to continue funding a struggling project. These decisions used to be shaped by middle managers who understood both the strategy above them and the constraints below them.
Without that middle tier, these decisions can move in two unhelpful directions. They can escalate to senior leaders, who are now overloaded and less informed about the details. Or they can stall at the level of peers, who have no authority to settle disputes. In both cases, latency increases for exactly the decisions that count.
There is also a subtle effect on decision quality. Faster is not better if the decision rests on thinner information. A decision made quickly on the basis of a dashboard may miss the context that a middle manager would have supplied.
7.3A stylized view of latency over time
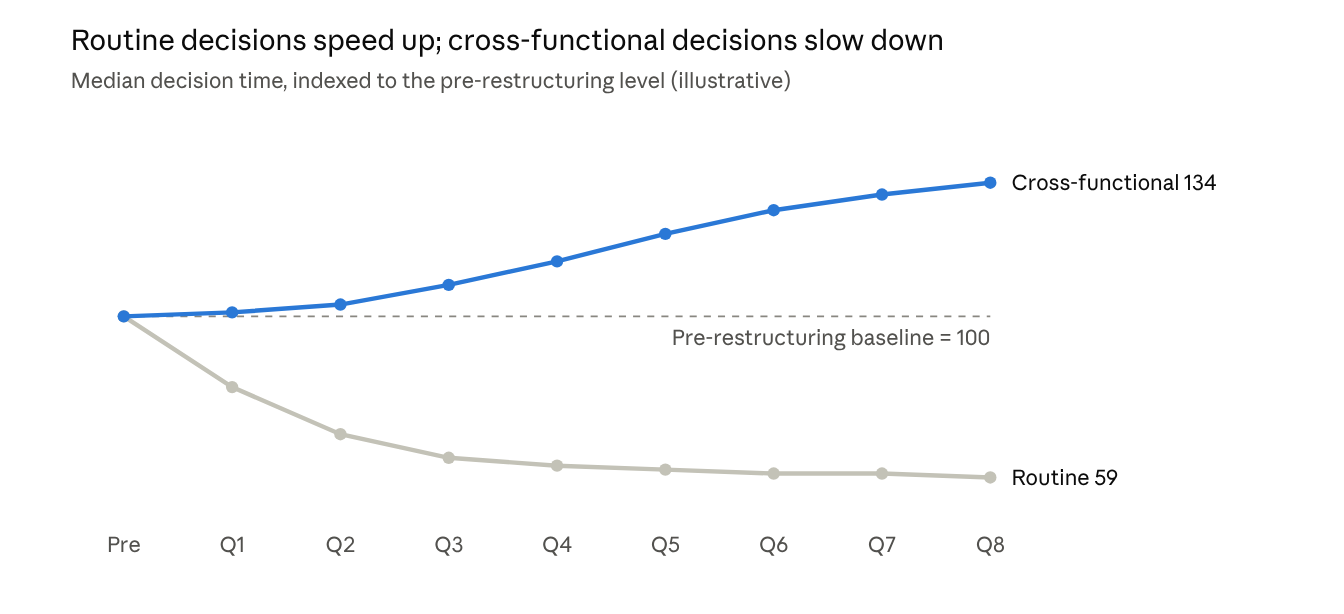
Figure 3 shows a stylized pattern that is consistent with the argument above. Routine decision latency drops soon after restructuring, while cross-functional decision latency first holds steady and then creeps upward as the loss of coordination capacity becomes apparent. Once more, this is an illustration of the argument rather than a reported result.
8Middle-tier governance and project execution
8.1What the middle tier actually does
It helps to be specific about what middle managers do, because the phrase "middle management" tends to attract caricature. In reality, the role bundles several distinct functions.
First, they translate. They take strategy expressed in abstract terms and turn it into priorities that a team can act on. Ingvaldsen and Benders (2016) show this translation role clearly in the lean context.
Second, they coordinate. They connect teams that would otherwise work in isolation, resolve conflicts over resources, and sequence interdependent work.
Third, they govern. They check quality, monitor risk, and enforce controls, which is the function Martyn (2018) highlights.
Fourth, they develop people. They coach, give feedback, and prepare the next generation of leaders.
Fifth, they carry knowledge. They know how things really work, who to call, and why a past decision was made. Much of this knowledge is tacit.
Hankinson and Cowking (1997) studied brand managers in the United Kingdom and, while their subject was a specific function, their findings illustrate how much influence a middle-level role can have on how strategy is expressed in the market. When roles of this kind are consolidated or removed, the influence they exercised goes with them.
8.2How execution degrades
Project execution tends to degrade in recognizable ways after heavy de-layering. Dependencies between teams are missed because nobody owns the connection. Status reporting becomes thinner, so problems surface later. Escalations pile up at the level of senior leaders. Decisions get revisited because the original rationale was never documented.
Savery and Choy (1999) asked whether technology-enabled change was an avant-garde route to operational effectiveness or a careerist's nightmare, and the framing is telling. The same restructuring can look like progress from above and like precarity from below. When employees experience change as a threat to their careers, they behave accordingly, protecting their territory and avoiding risk, and that behavior shows up in project outcomes.
8.3A summary of the evidence
Table 3 groups the sources used in this article by what they contribute to the question, and notes the limits of each.
| Evidence cluster | Representative sources | What it suggests | Main limitation |
|---|---|---|---|
| Technology and structure | Li (1997); Seethamraju (2005); Brews & Tucci (2004) | Technology makes some flattening feasible by absorbing routine information work | Feasibility is not the same as effectiveness |
| Supervisors and translation | Ingvaldsen & Benders (2016) | Front-line and middle roles translate strategy; squeezing them degrades implementation | Rooted in lean production settings |
| Restructuring practice | Frigo & Janson (1993); Douglas (1999); Bramble et al. (1996) | Delayering can speed decisions but redistributes work onto survivors | Largely 1990s evidence, older technology context |
| Middle managers and strategy | Currie (1999); Hankinson & Cowking (1997) | Middle roles influence how strategy is shaped and executed | Sector-specific cases (health care, brand management) |
| Control and governance | Martyn (2018); Hassard et al. (2007) | Control systems run through the middle tier; lived experience differs from the stated ideology | Qualitative, hard to generalize |
| Career and human impact | Savery & Choy (1999); Reiss (2026) | Compressed pipelines create psychological and knowledge costs | Perceptual and qualitative evidence |
8.4The compressed pipeline
One consequence deserves special attention because it arrives late. Middle management is, for many organizations, the training ground for senior leadership. Remove it and you remove the rungs of the ladder. Reiss (2026) investigates this through a qualitative inquiry into compressed leadership pipelines, examining operational, psychological, and knowledge implications. The title's image of a "flattened chasm" captures the concern well: the gap between front-line contributors and senior leaders does not disappear when layers are removed. It becomes harder to cross.
In practical terms, a firm that has flattened aggressively may find, three or four years later, that it has few people ready to take on senior roles, because they never had the chance to practice management at smaller scale. That is a cost that no 10-K restructuring charge will ever capture, and it may be among the largest.
9The human side: Resistance, survivors, and hidden workload
Structure is never only structure. Behind every box on an organization chart is someone who has to decide whether the new design is worth their trust. Organizational change resistance, in this setting, is rarely the dramatic kind. Nobody stages a revolt. What happens instead is quieter: people hold back effort they are no longer sure will be rewarded, they protect information that once was shared freely, and they avoid the kind of risk that might make them visible in a round of cuts.
The employees who stay carry a particular burden. They have watched colleagues leave, they have inherited extra duties, and they have been told that the organization is now leaner and faster. Savery and Choy (1999) captured the tension in the title of their study: is new technology an avant-garde solution to operational effectiveness, or a careerist's nightmare? Survivors usually feel both at once. Bramble et al. (1996) documented a similar mix of pressure and uncertainty among retail managers who remained after restructuring.
This is where the hidden workload accumulates. Figure 4 offers a stylized picture of where the work of removed managers tends to go. The point is not the exact percentages, which will differ from firm to firm. The point is that a fifth or so of the work is genuinely eliminated, and the rest has to land somewhere.
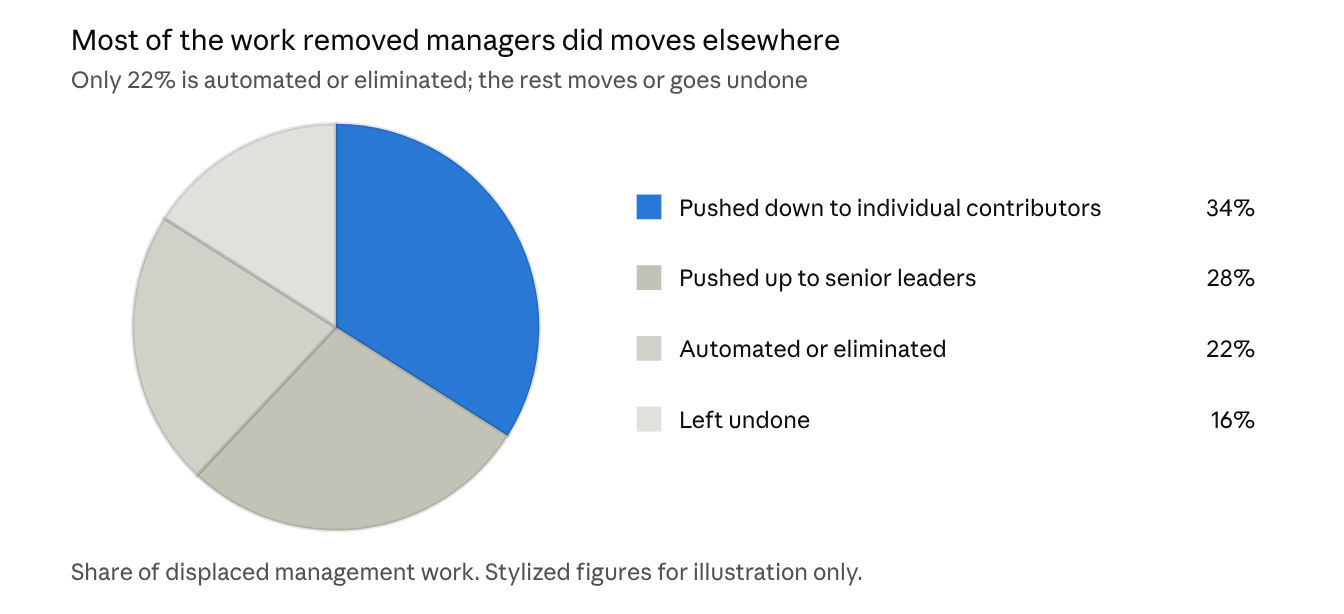
It is worth lingering on the "left undone" slice, because it is the one that never shows up in a restructuring charge or a productivity report. It is the coaching conversation that did not happen, the risk that was not flagged, the cross-team dependency that nobody owned. Individually these omissions look trivial. Collectively they are what a governance failure looks like before it becomes visible.
There is also a lesson in how change is communicated. Hassard et al. (2007) showed that new organizational ideologies, delivered with the language of empowerment, can feel very different at the sharp end. When leaders describe de-layering as liberation while employees experience it as extra work with less support, the credibility gap itself becomes a cost.
10What seems to work
If the evidence is mixed, what should a thoughtful organization do? The research and the logic of the theories point toward a few practical principles.
Decide which functions to keep before deciding which layers to cut. The five functions described earlier (translation, coordination, governance, development, and knowledge carrying) do not vanish when a title is removed. Dive (2016) treats organization design as one of the core pillars of a broader mission, and the implication is that design should start from what the organization needs done, not from a target for headcount.
Match spans to the work. A wide span suits routine, well-understood tasks and skilled, independent teams. A narrow span suits novel, interdependent, or high-stakes work. A single company-wide target, say twelve reports per manager, is a blunt instrument.
Invest in lateral coordination before removing vertical relays. Galbraith's framework suggests that when hierarchy loses its capacity to process information, something has to take its place. Cross-functional teams, liaison roles, and clear decision rights are the usual substitutes. They need to be in place before the layer is gone, not afterward.
Rebuild control deliberately. If budgeting, risk monitoring, and performance review ran through the middle tier, as Martyn (2018) describes, then those processes need a new home. Automated controls can carry some of the load. Human judgment has to carry the rest.
Protect the pipeline. Create stretch assignments, rotational roles, or small-team leadership opportunities so that future senior leaders still get to practice management. Otherwise the compressed pipeline Reiss (2026) describes becomes a succession problem.
Measure latency, not just cost. If speed is the stated goal, track it. Time-to-decision for both routine and cross-functional choices, project slippage, and escalation volume give a far better picture than a restructuring charge ever will. The broader policy literature makes a similar point about explicit priorities: trade-offs only become manageable when someone names them (Aaron & Reischauer, 2011).
11Limitations
This article has limits worth stating plainly. Figures 1–4 are illustrative, while Table 2 is a descriptive archival comparison rather than a causal test. The cases differ in fiscal period, scale, business model, and disclosure practice. Only Meta provides direct public evidence of management-layer removal; the other cases document restructuring or workforce change without establishing that middle-management layers were removed. Public filings also do not provide comparable decision latency, project schedule adherence, escalation frequency, or middle-management governance outcomes. Much of the supporting literature dates from the 1990s and early 2000s, and several sources are sector-specific. Interviews, internal workflow data, project records, and audit or compliance records would be needed to test the mechanisms more directly.
12Conclusion
The comparative evidence does not support a general empirical claim that the “year of efficiency” made organizations faster or slower. It supports a narrower conclusion: restructuring costs and workforce reductions are disclosed with reasonable precision, but direct measures of decision latency, project execution, and middle-tier governance are largely absent. Meta is the one case in this set with explicit public evidence of a flattening program; even there, the disclosed performance indicators are management claims or broad financial outcomes rather than a controlled test of decision speed.
The article’s theoretical prediction remains that routine, well-bounded decisions may get faster when layers come out and authority moves closer to the front line, while decisions that depend on coordination, interpretation, and tacit knowledge may slow. That is a hypothesis supported by the literature and by management reasoning, not a finding established by the four-company archival comparison.
The lesson is not that flattening is wrong. It is that a layer is a bundle of functions, and cutting the layer without deciding what happens to those functions simply moves the problem. Mintzberg's configurations remind us that the middle line plays different roles in different organizations. Galbraith's theory reminds us that capacity to process information has to come from somewhere. And the human evidence reminds us that the people who stay will determine whether the new design works.
Organizations that treat de-layering as a design problem, rather than a cost target, have a much better chance of getting the speed they wanted without paying for it later.
References
- [1]Aaron HJ, Reischauer RD (2011). Setting national priorities: The 2000 election and beyond. Rowman & Littlefield. https://doi.org/10.5771/9780815719465
- [2]Amazon (2024). Annual report on Form 10-K for the year ended December 31, 2023. https://www.sec.gov/Archives/edgar/data/1018724/000101872424000008/amzn-20231231.htm
- [3]Bramble T, Parry K, O’Brien E (1996). Middle management in an era of corporate restructuring: A case study of retailing. Labour and Industry, 7(2), 79–102. https://doi.org/10.1080/10301763.1996.10669162
- [4]Brews PJ, Tucci CL (2004). Exploring the structural effects of internetworking. Strategic Management Journal, 25(5), 429–451. https://doi.org/10.1002/smj.386
- [5]Currie G (1999). The role of middle managers in the NHS: The possibilities for enhanced influence in strategic change.
- [6]Dive B (2016). Mission mastery: Pillar 2—Organization design. In Mission mastery. Springer. https://doi.org/10.1007/978-3-319-25223-0_4
- [7]Douglas C (1999). Organization redesign: The current state and projected trends. Management Decision, 37(8), 621–628. https://doi.org/10.1108/00251749910291587
- [8]Frigo R, Janson R (1993). GE’s financial services operation achieves quality results through “work-out” process. National Productivity Review, 13(1), 53–61. https://doi.org/10.1002/npr.4040130108
- [9]Hankinson G, Cowking P (1997). Branding in practice: The profile and role of brand managers in the UK. Journal of Marketing Management, 13(4), 239–264. https://doi.org/10.1080/0267257X.1997.9964471
- [10]Hassard J, McCann L, Morris J (2007). At the sharp end of new organizational ideologies: Ethnography and the study of multinationals. Ethnography, 8(3), 324–344. https://doi.org/10.1177/1466138107081041
- [11]Ingvaldsen JA, Benders J (2016). Lost in translation? The role of supervisors in lean production. German Journal of Human Resource Management, 30(1), 35–52. https://doi.org/10.1177/239700221562589
- [12]Li F (1997). From compromise to harmony: Organisational re-design through information and communication technologies. International Journal of Information Management, 17(6), 451–464. https://doi.org/10.1016/S0268-4012(97)00027-3
- [13]Martyn P (2018). Examining management control systems at middle manager level. https://doi.org/10.13025/17539
- [14]Meta Platforms (2023). Exhibit 99.1, “Update on Meta’s year of efficiency”, filed March 14, 2023. https://www.sec.gov/Archives/edgar/data/1326801/000132680123000035/mar142023exhibit991.htm
- [15]Meta Platforms (2024). Annual report on Form 10-K for the year ended December 31, 2023. https://www.sec.gov/Archives/edgar/data/1326801/000132680124000012/meta-20231231.htm
- [16]Microsoft (2023). Annual report on Form 10-K for the fiscal year ended June 30, 2023. https://www.sec.gov/Archives/edgar/data/789019/000095017023035122/msft-20230630.htm
- [17]Reiss T (2026). Bridging the flattened chasm: A qualitative inquiry into the operational, psychological, and knowledge implications of compressed leadership pipelines. SSRN. https://doi.org/10.2139/ssrn.7215662
- [18]Salesforce (2024). Annual report on Form 10-K for the fiscal year ended January 31, 2024. https://www.sec.gov/Archives/edgar/data/1108524/000110852424000005/crm-20240131.htm
- [19]Savery LK, Choy RM (1999). “Cutting edge” technology: An avant-garde solution of operational effectiveness or careerist’s nightmare? International Journal of Technology Management, 17(1–2), 145–156. https://doi.org/10.1504/IJTM.1999.002710
- [20]Seethamraju R (2005). Enterprise resource planning systems: Implications for managers and management. Australian Accounting Review, 15(37), 90–96. https://doi.org/10.1111/j.1835-2561.2005.tb00308.x