Elevated Interest Rates
Share Repurchases vs. Debt Deleveraging: CFO Capital Allocation Under Elevated Interest Rates
Published October 2025
Abstract
Corporate finance leaders often face a choice between returning cash to shareholders through share repurchases and using that cash to reduce debt. The choice becomes more consequential when borrowing costs are high, leverage is already material, or future cash flows are uncertain. This article reviews the capital-structure and payout-policy research relevant to that decision and develops a framework for evaluating its effects on financing costs, liquidity, credit capacity, investment, operating return on invested capital (ROIC), valuation, and shareholder returns. The central argument is conditional: neither buybacks nor debt repayment is inherently value-creating. A repurchase can be attractive when the shares are undervalued, the firm has durable surplus cash, and leverage remains consistent with its risk capacity. Debt reduction can be more valuable when the after-tax cost of borrowing is high, refinancing risk is meaningful, or preserving a credit rating and future borrowing capacity matters. The article also clarifies a measurement problem. A buyback can mechanically raise earnings per share and alter equity-based or ROIC denominators without improving operating performance; enterprise value, equity value, ROIC, and total shareholder return must therefore be measured separately. The proposed archival study would compare U.S. nonfinancial firms that allocate relatively more cash to repurchases with firms that prioritize principal repayment, while controlling for baseline leverage, profitability, growth opportunities, cash generation, and valuation. The August–September 2025 cohort has not yet completed a three-year outcome period: that window ends in August–September 2028. Accordingly, this manuscript presents a research framework, not empirical findings, and reports no invented company-level results.
Keywords: share repurchases; debt deleveraging; capital allocation; capital structure; financial flexibility; cost of capital; ROIC; shareholder returns
1Introduction
A company with cash left after paying its operating costs and funding worthwhile projects must decide what that cash is for. It can keep a reserve, invest in its business, acquire another company, repay debt, distribute a dividend, or repurchase shares. These options are not interchangeable. Each changes a different part of the company’s financial position, and each sends a different signal about what management believes the business needs next.
The debate becomes especially sharp when market financing costs rise or remain above a firm’s recent experience. A CFO may see an opportunity to reduce interest expense by paying down debt. At the same time, shareholders may expect repurchases, and management may believe the stock is undervalued. A repurchase can also offset employee stock issuance or return cash that is genuinely surplus to the firm’s needs. The decision is therefore not simply “buybacks versus prudence.” It is a choice among competing uses of capital under uncertainty, with consequences for risk, flexibility, investment capacity, and the distribution of value between current and future owners.
This article focuses on the question: For firms facing elevated borrowing costs, how does allocating cash to share repurchases rather than debt reduction affect leverage, financing costs, ROIC, valuation, and shareholder returns over a three-year horizon? The phrase “elevated borrowing costs” must be defined against a stated benchmark rather than assumed from the calendar. For a future empirical test, it could refer to a firm’s marginal borrowing rate relative to its own pre-period average, a market credit spread, or a benchmark yield over a specified comparison window. What matters conceptually is the price of new or refinanced debt and the firm’s exposure to it, not the policy rate in isolation.
The research question builds on an important distinction. A buyback is a financing and distribution decision, not a new operating investment. Its value depends on what the firm gives up to make it, what price it pays for its own shares, how its capital structure changes, and whether shareholders could use the distributed cash more productively. Debt reduction, by contrast, produces a comparatively observable benefit when it avoids interest expense or reduces expected distress costs. But paying down debt also gives up liquidity and the option to use that cash later. Neither use should be treated as automatically superior.
The article combines payout and capital-structure research, separates accounting mechanics from value creation, and proposes measures for a three-year company-level study. The follow-up window is important: an August–September 2025 cohort cannot complete three years before August–September 2028.
The next sections review the evidence, develop hypotheses, specify the research design, and discuss implications and limitations.
2Theoretical foundations
2.1Capital structure: Useful benchmark, not mechanical answer
Modigliani and Miller’s propositions establish a benchmark for thinking about debt and equity. In a frictionless setting, with no taxes, transaction costs, agency conflicts, or information problems, changing the mix of debt and equity does not change the total value of the firm. Once taxes and market frictions are introduced, that irrelevance result no longer describes the full decision. Debt can create a tax shield, but it also creates contractual claims and increases the chance that a business shock will make fixed payments difficult to meet (Modigliani & Miller, 1958, 1963).
The propositions caution against treating a lower share count as new operating value, but do not settle real-world choices. Taxes, distress risk, agency conflicts, information, and financing access affect debt and equity decisions.
Trade-off theory balances debt’s tax advantages against expected distress costs. An under-levered firm may borrow or repurchase equity; a highly levered firm may instead reduce principal, especially before refinancing or when earnings are volatile. The target is not directly observable. DeAngelo (2022) notes that managers cannot optimize capital structure with precision, so empirical work should not treat a single ratio as a known optimum.
Pecking-order theory emphasizes internal funds when external finance is costly or reveals information. CFO practice also reflects ratings and flexibility (Graham & Harvey, 2001). A firm may repurchase shares while preserving debt capacity, or reduce debt to keep borrowing options open for future investment.
2.2Agency costs and the role of distributions
Jensen’s (1986) free-cash-flow argument explains why paying out surplus cash can sometimes help shareholders. When managers control cash that exceeds the firm’s attractive investment opportunities, they may spend it on projects with low returns, acquisitions that enlarge the organization without creating value, or other uses that serve managerial interests. A payout can reduce this discretion. Debt can serve a similar disciplining role because interest and principal payments commit cash to creditors.
The agency argument is conditional. Buybacks can support EPS targets mechanically, while debt repayment can reduce flexibility enough to constrain good projects. Either choice depends on the counterfactual use of cash and the firm’s investment needs.
Buybacks distribute cash to shareholders; debt repayment reduces creditors’ claims and fixed obligations. Either can limit waste, but a payout may be premature when growth opportunities are strong. Measure subsequent investment rather than assume it is displaced.
2.3Financial flexibility as an asset
Financial flexibility is the capacity to obtain or reorganize financing at a tolerable cost. It can matter even when a firm is not currently distressed. Cash, undrawn credit lines, modest leverage, longer maturities, and access to capital markets can help a business absorb shocks or fund investment when circumstances change. Research by Rapp et al. (2014) finds that firms for which shareholders place greater value on flexibility tend to hold more cash, use lower leverage, and prefer repurchases to dividends. The result illustrates a subtle point: flexible repurchases can coexist with conservative balance-sheet choices.
CFO survey evidence also points to debt capacity as a managerial concern. In a survey of 140 Spanish CFOs, de Andrés et al. (2018) find that respondents value target-debt monitoring and the capacity to maintain additional borrowing room. They also report a preference for internal funds. The study concerns a different country and survey year, so it should not be read as a direct estimate of current U.S. behavior. It does reinforce the idea that managers consider the option value of unused debt capacity when allocating cash.
Flexibility is valuable when uncertainty, growth options, or financing frictions make future capital important, but excess cash can be underused and low leverage can leave tax benefits unrealized. The value of a reserve depends on operating risk and financing access.
2.4Payout policy and signaling
Dividends and repurchases are both ways to distribute cash, but they carry different expectations. Regular dividends are commonly treated as a recurring commitment that managers are reluctant to cut. Open-market repurchase programs have historically been more adjustable. Jagannathan et al. (2000) and Guay and Harford (2000) examine the relationship between payout choice and cash-flow persistence. Their work supports the view that regular dividends are associated with more persistent cash flows, while repurchases can be used for more variable or temporary cash.
Almeida et al. (2026) find that, during the 2008 crisis, firms with programs continuing beyond December 2007 reduced investment, employment, and R&D more than comparison firms. Authorizations and completed repurchases should be measured separately.
Repurchase announcements may signal undervaluation, but a signal is credible only when purchases occur at a reasonable price. Babenko et al. (2012) find stronger announcement reactions when insiders bought shares beforehand. The study should control for valuation and execution.
3Comparing the economic channels
3.1What a repurchase does—and does not do
When a company buys its own shares in the market, cash leaves the company and the number of shares outstanding usually falls. If the shares are purchased below their intrinsic value, the transaction can transfer value to continuing shareholders. If the shares are fairly valued, the distribution can still suit investors who prefer cash, but it does not automatically increase the total value of the company. If the shares are overpriced, continuing shareholders may lose value because the company has transferred too much cash for too few assets.
A lower share count can raise EPS without changing net income, while reduced equity can raise ROE. Buybacks may also alter measured ROIC if they reduce cash or invested capital. These denominator changes are not evidence of better operations.
A repurchase can affect leverage even when it is funded from existing cash. Cash falls, equity falls, and net debt may rise. If new borrowing funds the purchase, gross debt increases as equity is reduced. The scale of the leverage change depends on the funding source and on the cash balance held before the transaction. Aramonte and Schrimpf (2020) explain that buybacks reduce equity and can raise leverage, especially when funded by debt. Their analysis argues that the main financial-stability concern is excessive leverage, rather than the act of repurchasing shares in isolation.
Enterprise value and equity value are distinct. A buyback changes cash, debt, and market capitalization, while shareholder value also includes distributions. Report each measure under an explicit definition rather than equating EPS growth or share-price change with enterprise-value creation.
3.2What debt repayment does—and does not do
Paying down debt reduces contractual principal and can lower future interest expense. The value of that saving depends on the debt’s interest rate, whether the rate is fixed or floating, its maturity, any prepayment penalty, the firm’s tax position, and whether the repayment changes the company’s credit profile. A one-dollar repayment is most attractive when the after-tax cost of the debt is high and the cash would otherwise earn little. Its value is lower when the firm holds very cheap long-term fixed-rate debt and has valuable projects or liquidity needs.
Debt repayment may lower distress risk and protect borrowing capacity, especially for firms with volatile earnings or near-term maturities. It can also drain liquidity; prepayment penalties or valuable fixed-rate debt can reduce the benefit.
Compare marginal costs. For a buyback, weigh the price paid and leverage effect against the opportunity cost of cash. For repayment, weigh after-tax interest savings and lower distress risk against liquidity and investment options. Sensitivity analysis is more informative than a single-point answer.
3.3Interest rates, credit spreads, and refinancing exposure
A firm’s exposure to higher rates depends on the amount of variable-rate debt, the timing of maturities, hedging, and the cost of replacement borrowing. Two firms facing the same benchmark yield can have very different marginal borrowing costs because their credit spreads, ratings, covenants, or access to markets differ. A study that uses only a central-bank rate would therefore measure the environment imperfectly.
For a company with near-term refinancing needs, paying down debt may reduce the amount that must be rolled over at a higher rate. For a company with long-dated fixed-rate debt and a strong balance sheet, immediate debt repayment may be less valuable. The counterfactual matters: if the firm can retain cash and earn a competitive yield, or use it to fund a project, the opportunity cost of repayment rises. If cash yields are lower than the debt’s after-tax cost or the firm needs to protect ratings, repayment becomes more attractive.
The empirical model should interact allocation choices with borrowing cost, spread, leverage, and maturity exposure. “Higher rates always favor debt repayment” is too simple: rates also affect equity valuation and investment hurdles.
4Literature review and research gap
4.1Why firms repurchase shares
The literature identifies several motives for buybacks. Dittmar (2000) examines potential undervaluation, excess capital, leverage adjustment, takeover defense, and dilution from employee options. The relative importance of these motives can change over time. Grullon and Michaely (2002) study the substitution between dividends and share repurchases, while Brav et al. (2005) use a survey of financial executives to document how managers think about payout decisions. Together, these studies caution against treating all repurchases as a single behavior with one explanation.
Because motives are mixed, include valuation and governance measures rather than inferring undervaluation from repurchase expenditure alone.
An authorization is not a completed transaction. Use cash-flow statement amounts where possible and analyze announcements separately from execution; actual purchases and diluted share-count changes provide complementary evidence.
4.2Flexibility and the choice among payouts
One influential argument for buybacks is that they are more flexible than regular dividends. Managers may be reluctant to reduce a dividend once investors expect it to continue, whereas they can adjust repurchases more readily. Jagannathan et al. (2000) and Guay and Harford (2000) connect payout choice to the permanence of cash flows. Rapp et al. (2014) find that firms where financial flexibility has greater value tend to hold more cash, maintain lower leverage, and prefer repurchases over dividends when distributing cash.
Repurchase programs have become stickier, and ongoing programs were associated with real reductions in investment during a shock (Almeida et al., 2026). Investor expectations can make a formally discretionary program less optional.
Abuaf (2012) distinguishes stable cash flows, which may support regular dividends, from variable surplus, which may suit flexible distributions. Cash-flow volatility should therefore affect the choice between repurchasing and reducing debt.
4.3Repurchases, leverage, and investment
A repurchase can serve as a leverage-management tool. Dittmar (2000) identifies leverage adjustment as one motive, and the BIS analysis by Aramonte and Schrimpf (2020) emphasizes that buybacks change the balance between debt and equity. Leveraged buybacks may be sensible for firms that are below their target debt capacity, particularly if there are tax advantages and investment opportunities are limited. They can be dangerous when the firm already has high leverage, weak cash generation, or material refinancing needs.
Lei and Zhang (2016) study debt-financed repurchases and show that results vary with firms’ initial leverage. Their sample covers U.S. repurchases announced from 1994 through 2012, so it does not answer whether the same pattern holds in a more recent interest-rate environment. It is nevertheless a direct precedent for testing debt-financed buybacks rather than assuming that funding source is irrelevant. Their conditional findings also reinforce the need to separate under-levered from over-levered firms.
El Ghoul et al. (2024) find repurchases are often financed from cash flows and are not generally associated with underinvestment in their sample. This counters the claim that buybacks always crowd out investment, but does not establish harmlessness for every firm or period.
4.4Capital structure and managerial practice
The CFO’s problem is not solved by a textbook ratio. Graham and Harvey (2001) show that capital-structure practice reflects a range of concerns, including financial flexibility and ratings. De Andrés et al. (2018) similarly report that surveyed Spanish CFOs consider target debt and reserve borrowing capacity, while preferring internal funds. DeAngelo (2022) argues that managerial knowledge limitations help explain why empirical capital-structure models do not yield precise optimization rules. DeAngelo et al. (2006) also show that payout policy varies with firms’ earned-versus-contributed capital mix, highlighting a lifecycle dimension.
This study connects payout choice and leverage adjustment by comparing repurchase allocation with debt principal repayment under varying borrowing costs. It defines ROIC and valuation separately and recognizes that firms select their own allocation, making causal identification difficult.
4.5Contribution and originality of the framework
The article’s contribution is integrative and measurement-focused rather than a claim of a new causal estimate. First, it places repurchases and debt repayment in the same marginal-value decision: the relevant comparison is the value of buying shares at the execution price versus the after-tax interest saving, refinancing-risk reduction, and liquidity option created by principal repayment. Second, it separates four outcomes that are often collapsed in practitioner discussion—financing risk, operating performance, enterprise value, and shareholder return. Third, it specifies a continuous allocation measure based on executed cash flows, records gross debt issuance and repayment separately, and treats borrowing-cost exposure and maturity risk as moderators rather than assuming that a high-rate environment affects every firm equally. The pilot added below shows how these constructs can be observed in filings, while the full cohort is needed to test the hypotheses.
5Conceptual framework and hypotheses
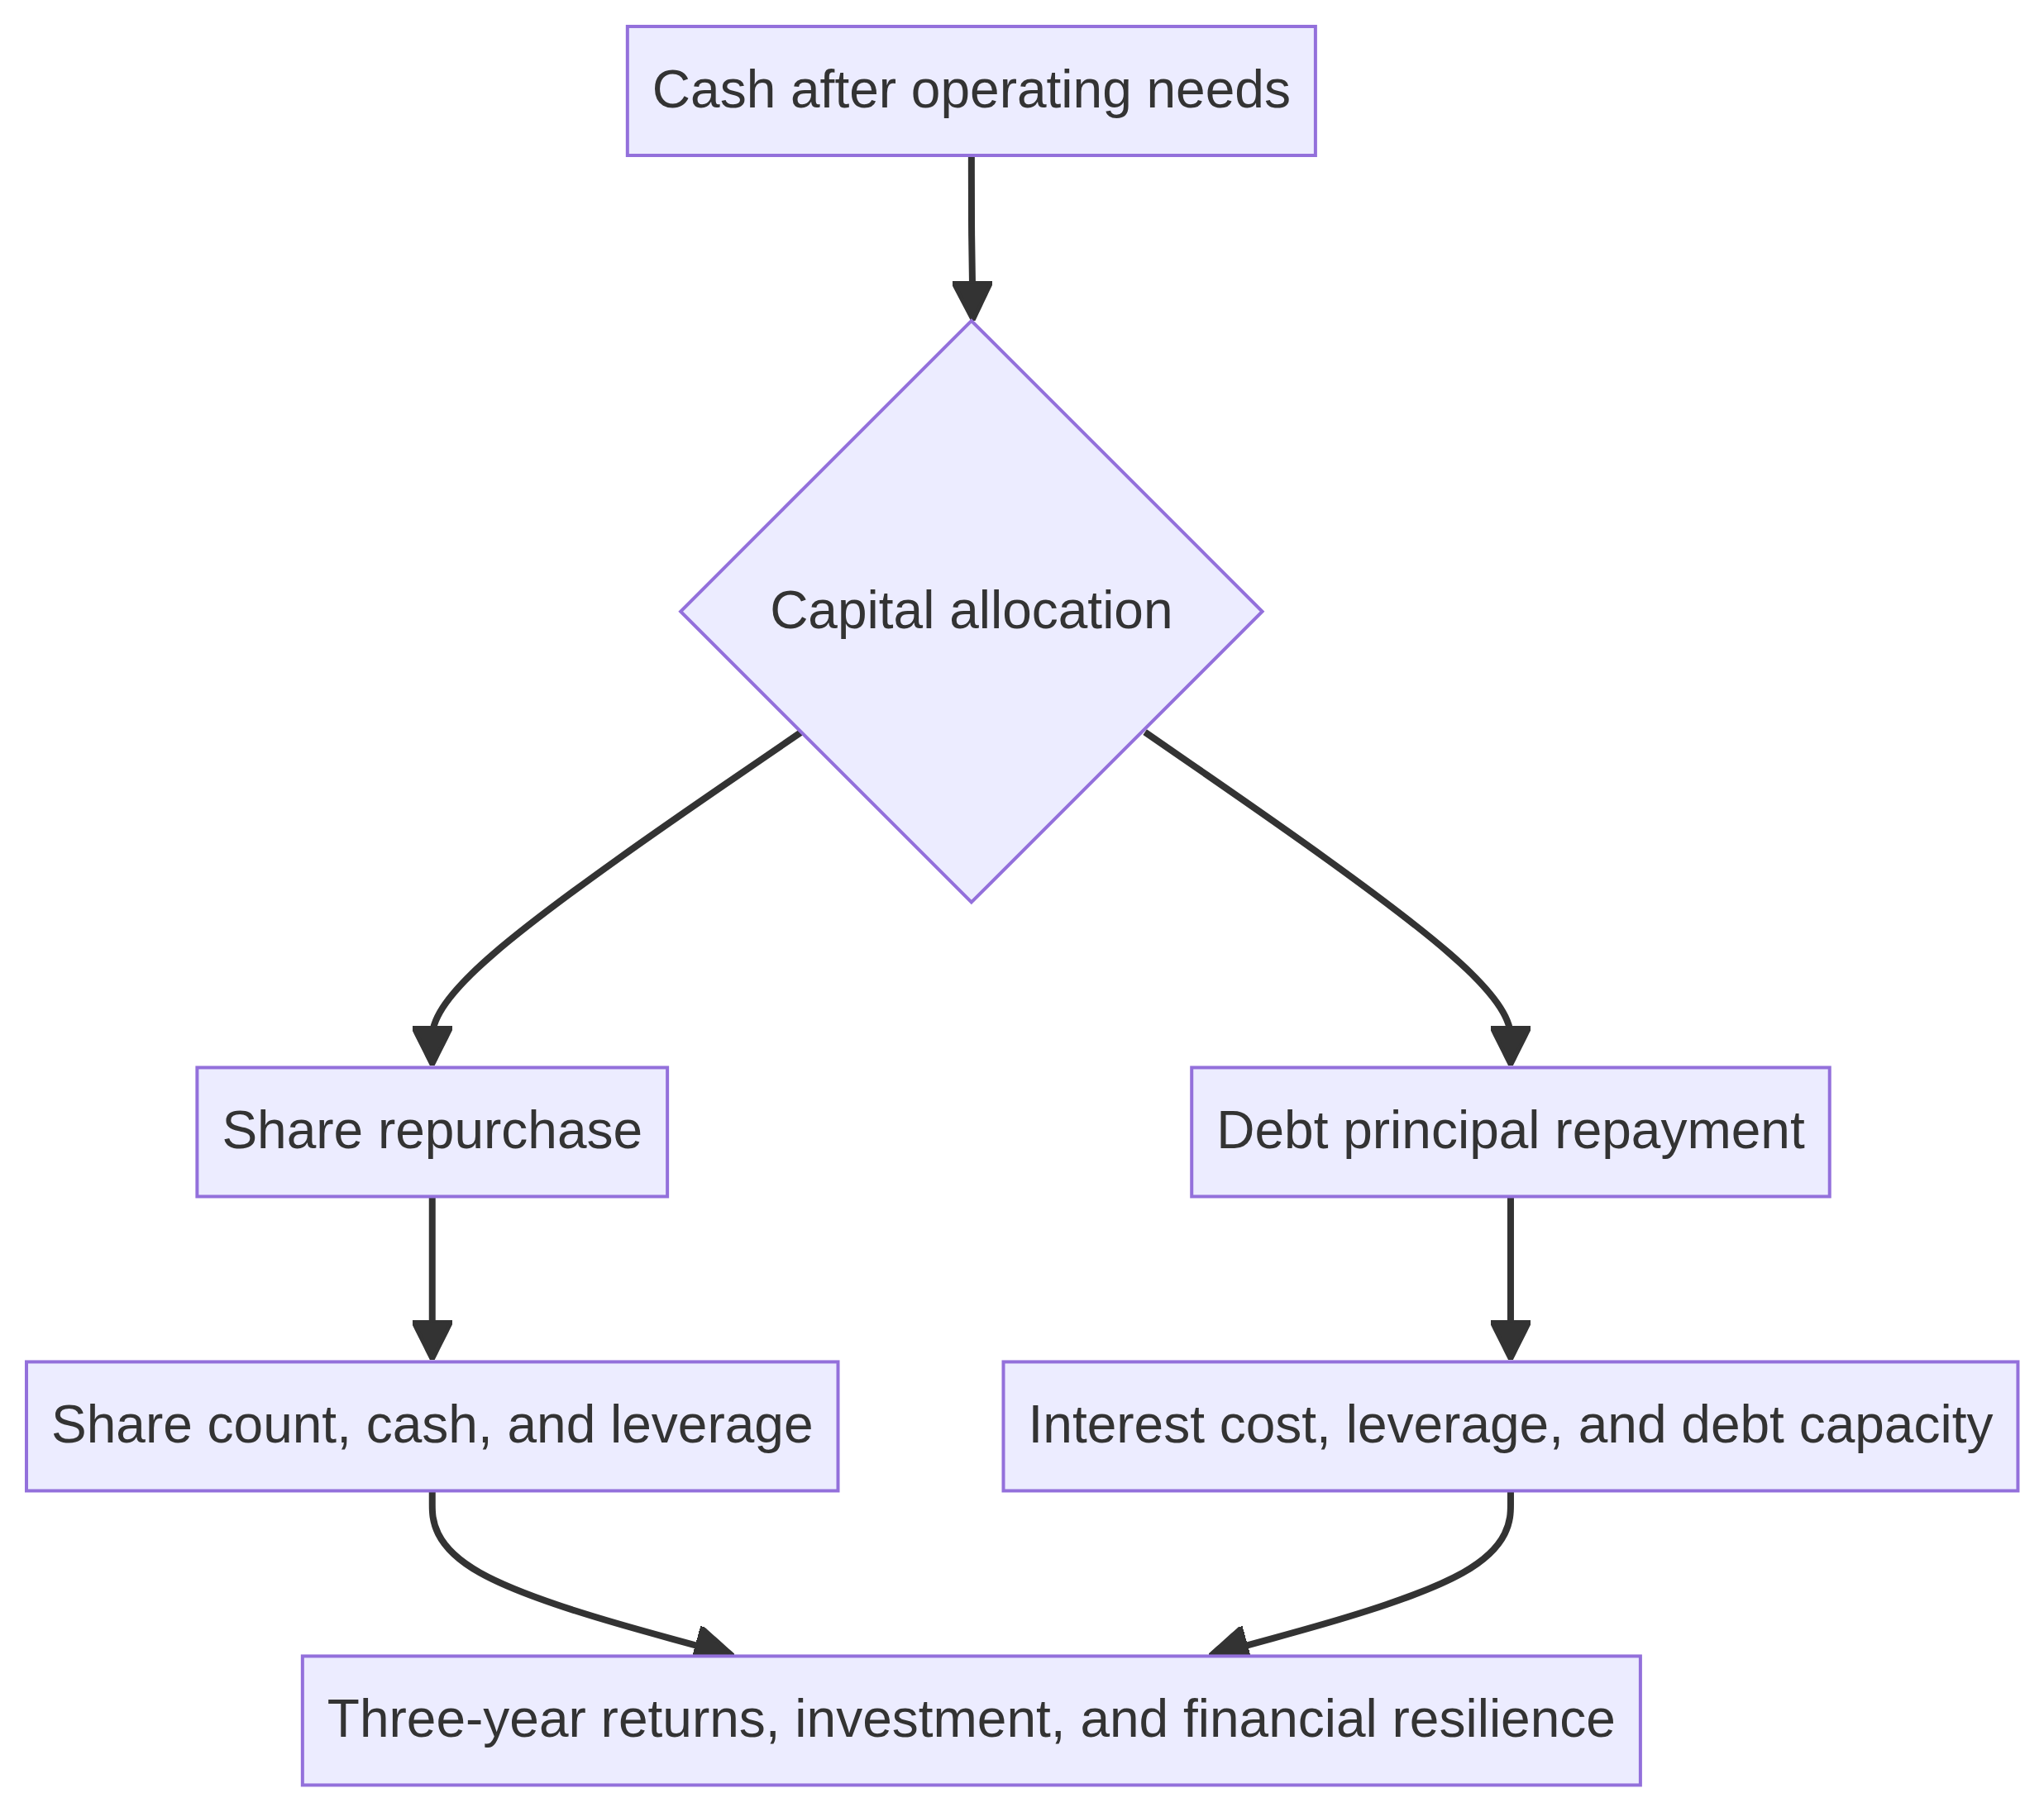
The proposed framework treats cash allocation as a sequence rather than a single binary choice. A firm first covers operating needs, legally or contractually committed payments, and positive-net-present-value investment. It then assesses the liquidity reserve needed for uncertainty. The remaining discretionary cash can be used for buybacks, debt repayment, both, or neither. Leverage, debt maturities, valuation, rate exposure, credit quality, growth opportunities, cash-flow volatility, and governance influence the choice and its consequences.
Figure 1 summarizes the conceptual channels. Repurchases affect share count, cash, equity, leverage, and signaling. Debt repayment affects interest expense, leverage, rating headroom, liquidity, and future borrowing capacity. These channels then influence the outcomes the study measures. The arrows are theoretical relationships, not estimated effects. The figure should not be read as evidence that one branch necessarily produces superior returns.
The framework produces the following hypotheses for later testing:
H1: Conditional allocation hypothesis. A higher share of discretionary cash allocated to repurchases will be associated with stronger subsequent shareholder returns when the firm is under-levered relative to its risk capacity, has adequate liquidity, and has shares trading below a reasonable estimate of intrinsic value. The association is expected to be weaker or negative when leverage is high or the repurchase price is difficult to justify.
H2: Borrowing-cost interaction hypothesis. The relative association between repurchases and debt repayment will depend on marginal borrowing cost and refinancing exposure. Higher borrowing costs should strengthen the association between debt repayment and lower future interest burden, particularly for firms with floating-rate debt or near-term maturities. This hypothesis concerns an interaction, not an unconditional rule that all high-rate periods favor deleveraging.
H3: Financial-flexibility hypothesis. Firms with greater cash-flow volatility, more valuable growth options, or weaker access to external capital will be more likely to preserve liquidity and debt capacity. In those firms, a larger repurchase allocation is expected to be associated with weaker subsequent investment or resilience if it materially reduces flexibility.
H4: Operating-performance versus accounting-mechanics hypothesis. Repurchase intensity may be associated with EPS and ROE changes because the share-count or equity denominators change. After adjusting for cash, financing, and invested-capital effects, those mechanical changes should not be interpreted as equivalent improvements in operating ROIC. The research will report the unadjusted and adjusted measures separately.
H5: Credibility and execution hypothesis. The relationship between repurchase announcements and subsequent valuation will be stronger when firms execute the announced program, when insider or other evidence supports the undervaluation signal, and when the share price paid is reasonable relative to pre-specified valuation measures. Announced authorizations alone should have a weaker association with outcomes than completed repurchases.
Table 1 links the theoretical mechanisms to the hypotheses. Table 2 translates the central constructs into data fields and flags the principal measurement risks. Together, the figure and tables make the research question testable without assuming that buybacks or debt repayment have a uniform effect across firms.
| Theory or evidence base | Mechanism relevant to the allocation choice | Proposed prediction | Important qualification |
|---|---|---|---|
| Modigliani–Miller and trade-off theory | Debt creates tax benefits but also distress risk; changing the financing mix alone does not improve operations | Debt repayment is more valuable when marginal after-tax debt cost and expected distress cost are high | No precise target leverage is observable; taxes and risk differ by firm |
| Jensen’s free-cash-flow theory | Distributions and required debt service can limit wasteful spending | Either buybacks or deleveraging may constrain low-return uses of surplus cash | Payout can also crowd out valuable projects or liquidity |
| Pecking order and CFO practice | Internal cash and unused debt capacity can have option value | Firms with valuable flexibility preserve cash or borrowing room | Survey evidence is descriptive and context-specific |
| Payout flexibility research | Repurchases can distribute temporary cash without a regular dividend commitment | Repurchases may fit variable surplus cash better than permanent payout commitments | Recent evidence finds repurchase programs can become sticky |
| Signaling and valuation | Repurchases can convey management’s view of undervaluation | Returns may be stronger when actual execution and credible valuation signals accompany the program | Announcements alone do not prove undervaluation |
| Leveraged buyback evidence | Debt-financed repurchases increase leverage and can adjust capital structure | Effects should differ by initial leverage, ratings, rate exposure, and investment needs | Historical samples do not establish current-period causality |
| Construct | Proposed operational measure | Candidate source | Key measurement caution |
|---|---|---|---|
| Repurchase allocation | Cash paid for repurchases divided by repurchases plus gross principal repayments, reported as a continuous ratio | Compustat cash-flow items; 10-K and 10-Q reconciliation | This compares two cash uses; it is not proof that a particular repurchase was funded by a particular debt issue |
| Net debt change | Change in short- and long-term debt, with gross issuance and repayment shown separately | Compustat; debt footnotes; FactSet | Net change can hide simultaneous borrowing and repayment |
| Marginal borrowing cost | Interest rate on new or refinanced debt, or effective interest expense relative to average debt as a proxy | Debt filings; FactSet; credit agreements | Average cost may not equal marginal cost; fixed/floating mix matters |
| Credit risk and flexibility | Net leverage, interest coverage, cash, undrawn revolver, maturity wall, rating and spread change | Compustat; credit-rating records; filings | Ratings are discrete and may lag risk changes |
| Operating return | NOPAT divided by average invested capital, with excess cash and financing effects reconciled | Compustat; annual reports | Repurchases and cash depletion can mechanically alter the denominator |
| Equity valuation and returns | Market-adjusted total shareholder return; valuation multiple and Tobin’s Q as separate outcomes | CRSP or FactSet; company market data | Share price, enterprise value, and total shareholder return are not interchangeable |
| Investment and resilience | Capital expenditure, R&D, employment where available, cash-flow volatility, and liquidity outcomes | Compustat; filings; company disclosures | A post-payout decline is not causal evidence without a credible comparison group |
6Proposed empirical research design
6.1Study setting and sample
The proposed sample is U.S. nonfinancial S&P 500 constituents as of a pre-specified date before treatment. Fixing membership limits survivorship bias. Exclude financial institutions in the main analysis because their debt is an operating input; analyze regulated utilities separately or exclude them with a stated rationale.
Use several pre-treatment years and align fiscal periods, filing dates, and market dates. A trailing-twelve-month measure around the 2025 treatment date can support classification, but firms with different fiscal year-ends must not be compared solely by calendar-year labels.
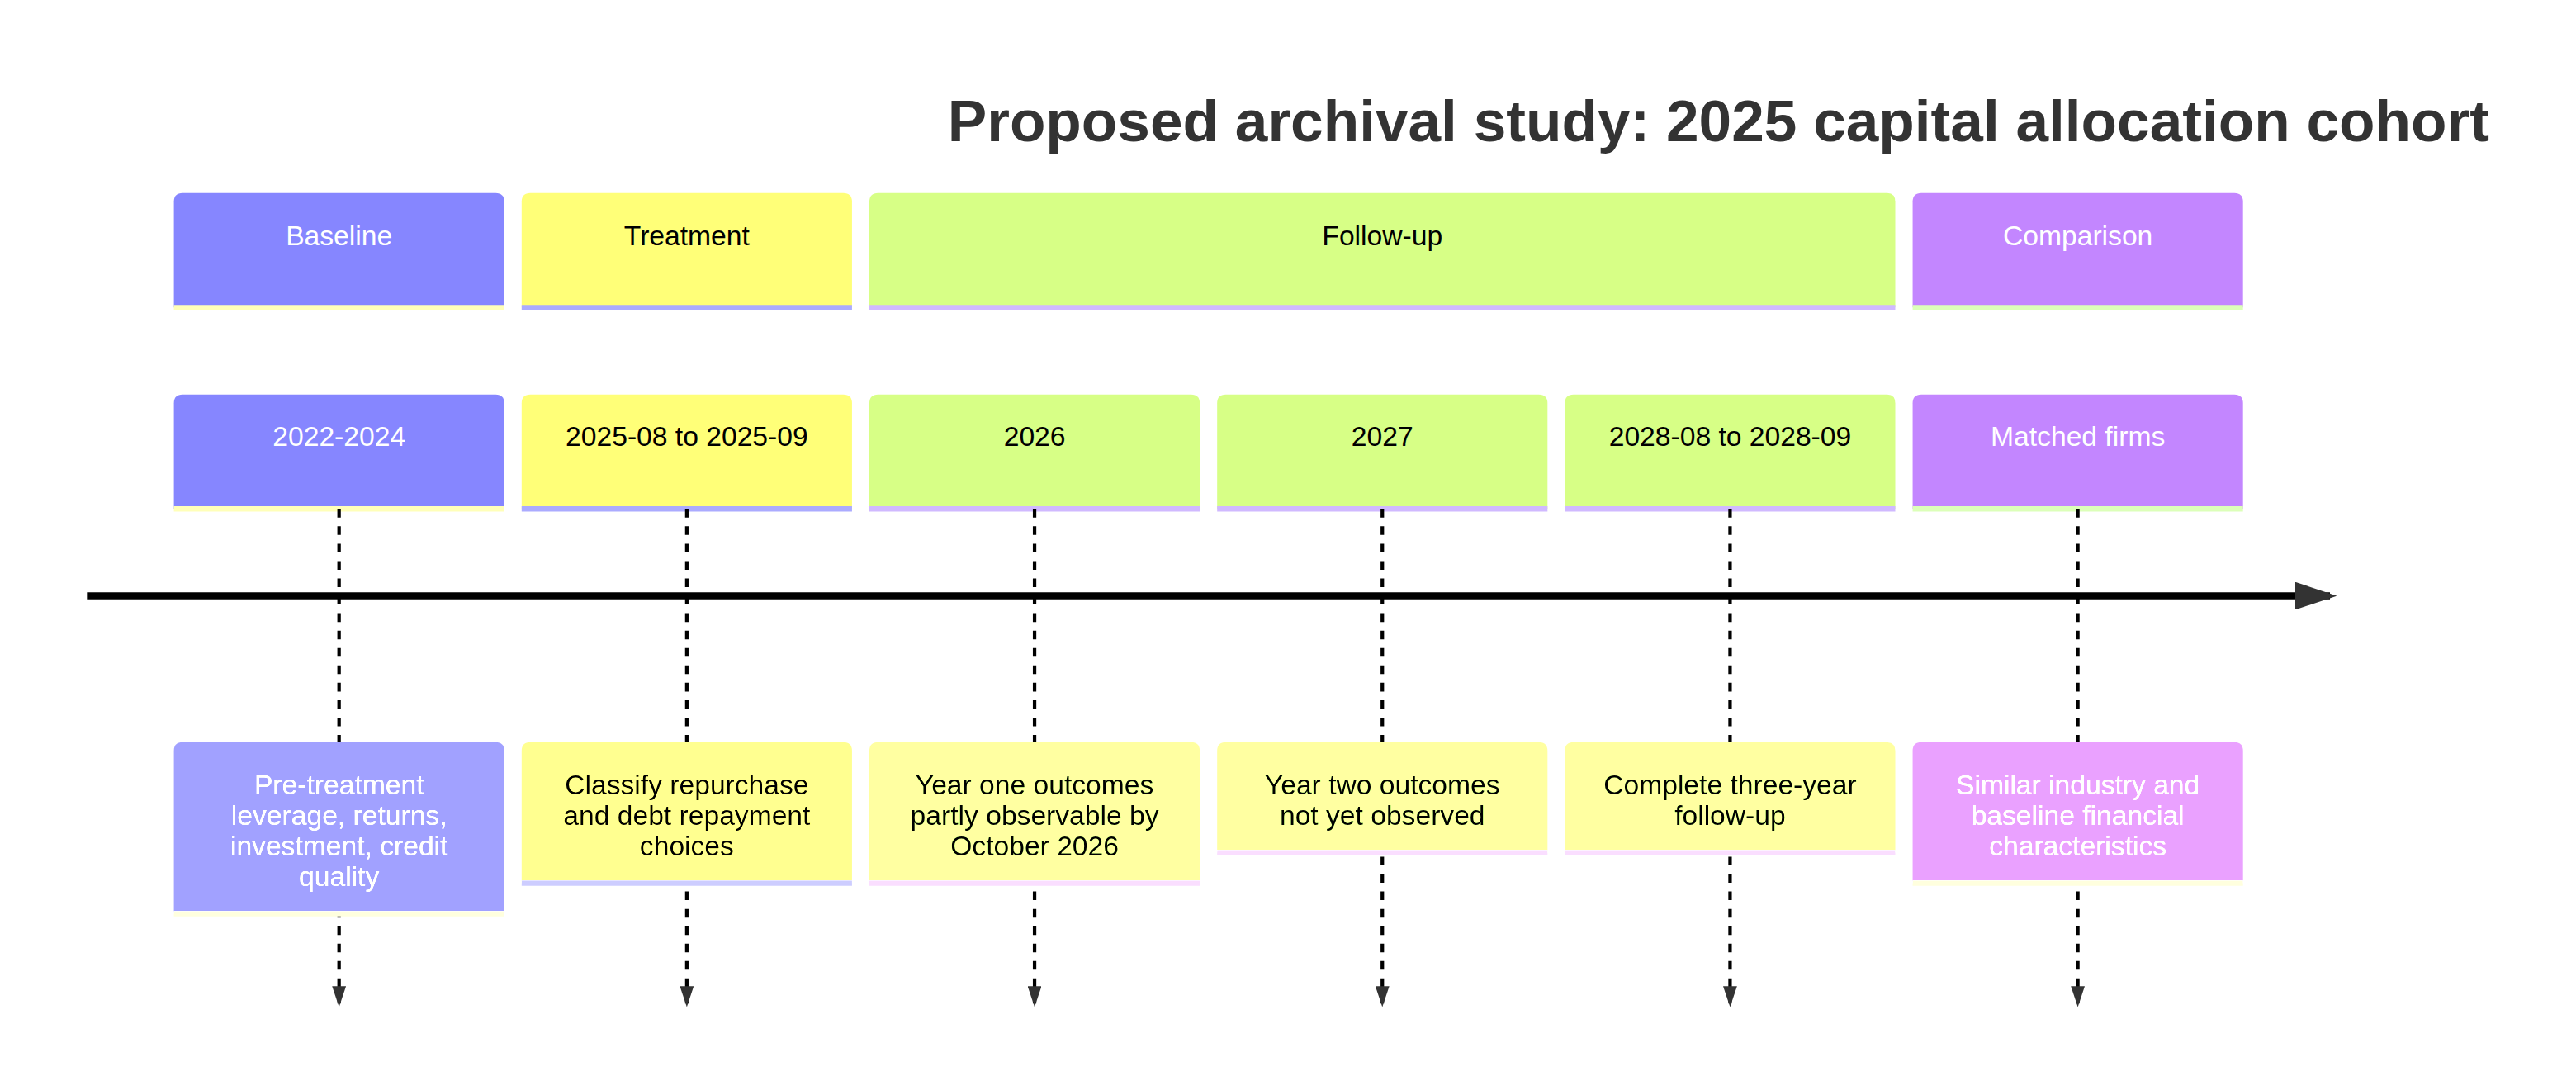
As of October 20, 2026, a 2025 cohort has only partial first-year follow-up; three years ends in August–September 2028. The current article is a protocol, not an empirical test. Interim outcomes must be labeled as such.
Pie charts are not included because no company-level allocation proportions have been collected. Drawing them now would make the conceptual framework appear to report observed sample data. Once the dataset is assembled, a pie chart may be appropriate for a clearly defined categorical composition; bar charts are generally better for comparing firms or years.
6.1.1Preliminary FY2024 archival pilot
To address the company-level evidence gap without converting a small convenience sample into a general result, this article adds a four-company archival pilot. Apple, Microsoft, Alphabet, and Meta were selected because their FY2024 Form 10-K filings report executed share repurchases and financing cash flows for the same broad period. The pilot is a feasibility and measurement exercise. It does not represent the S&P 500, does not establish a treatment effect, and does not use the firms as matched causal comparators.
The allocation ratio is calculated as cash repurchases divided by cash repurchases plus gross principal repayments reported in the financing section. It is not calculated when the filing does not provide a comparable gross principal-repayment line. Amounts below are converted from millions to billions of U.S. dollars. Operating income and operating cash flow are included as descriptive outcomes only; they are not attributed to the allocation choice.
| Firm / FY2024 | Repurchases | Gross principal repayment | Allocation ratio | Operating income / CFO | Interpretation and evidence boundary |
|---|---|---|---|---|---|
| Apple, FY ended Sep. 28 | 94.949 | 9.958 term debt | 90.5% | $123.216bn / $118.254bn | Fact: buyback-heavy cash allocation. The filing reports operating outcomes but does not identify what performance would have been under greater debt repayment. (Apple, 2024) |
| Microsoft, FY ended Jun. 30 | 17.254 | 29.070 | 37.2% | $109.433bn / $118.548bn | Fact: repayment-heavy relative to the pilot ratio. Debt issuance also occurred, so gross flows—not net debt change—are the correct classification inputs. (Microsoft, 2024) |
| Alphabet, FY ended Dec. 31 | 62.222 | 12.701 | 83.0% | $112.390bn / $125.299bn | Fact: buyback-heavy allocation alongside debt repayment. The filing attributes results to multiple business and investment factors, not to repurchases. (Alphabet, 2025) |
| Meta, FY ended Dec. 31 | 19.774 | Not reported as a comparable principal line; $1.058bn finance-lease principal payments | Not calculated | $69.380bn / $91.328bn | Fact: repurchases were reported, but the comparable denominator is unavailable. The case demonstrates why debt type and classification must be reconciled before grouping firms. (Meta Platforms, 2025) |
Note: Apple, Microsoft, and Alphabet ratios use reported cash repurchases and gross debt-principal repayments. Meta’s filing reports Class A repurchases and finance-lease principal payments but does not provide a directly comparable gross debt-repayment denominator in the extracted financing disclosure; its ratio is therefore not calculated. All values are filing figures converted to billions. The table documents allocation patterns, not causal effects.
6.2Treatment definition and comparison groups
Define treatment by actual cash allocation between repurchases and principal repayment. A continuous ratio—repurchases divided by repurchases plus gross principal repayment—is preferable to arbitrary groups and is defined only when both outflows are measurable and positive. Code no-use cases separately.
Record gross issuance, gross repayment, net debt change, disclosed debt-funded buybacks, and cash separately. Net changes can hide simultaneous borrowing and repayment. Attribute a specific borrowing to a buyback only when disclosure supports it.
For descriptive tables, group firms into repurchase-prioritizing, debt-reduction-prioritizing, mixed, and neither categories using pre-specified thresholds. Retain the continuous measure in primary regressions and test alternative cutoffs. Use actual cash-flow execution, not authorization size.
6.3Data sources and variable construction
Compustat can provide statements for repurchases, debt issuance and repayment, dividends, cash, operating income, and investment. Reconcile classifications against SEC filings when categories are aggregated or definitions change. FactSet or licensed CRSP can support market and credit data; filings are needed for maturities, rate type, covenants, and execution details.
The S&P 500 Buyback Index or S&P buyback reports can provide context for broad market activity. They are not a substitute for the company-level cash-flow data needed to classify the study sample. The research should state the source, date, fiscal period, currency, and units for each measure. Where Compustat and a filing disagree, the filing and reconciliation should be reviewed, and the chosen measure should be documented. No FactSet or Compustat data are included in this manuscript; these are proposed sources for the empirical phase.
The best borrowing-cost measure is the rate on new or refinanced debt, including fees where available. Interest expense divided by average debt is a secondary proxy, not the true marginal cost. Also measure floating-rate exposure, maturities, ratings, spreads, and cash. This manuscript includes no licensed company data.
6.4Outcome measures
Define ROIC as NOPAT divided by average invested capital, treating financing and excess cash consistently. Report standard and financing-adjusted versions because a buyback can shrink cash and equity and alter the denominator. A higher ratio is not necessarily better operations.
Report market capitalization and enterprise value separately. Use market-adjusted total shareholder return, including distributions, as the primary investor outcome; valuation ratios can be secondary. EPS alone is inadequate because fewer shares can raise it without increasing firm value.
Track leverage, interest coverage, interest expense, rating changes, spreads, liquidity, maturities, capital expenditure, and R&D. These measures describe financing risk and investment, but a post-payout decline is not causal without a credible comparison group.
6.5Estimation strategy and identification
Begin with descriptive allocation patterns, then estimate panel models of subsequent outcomes against the continuous repurchase-allocation measure and its interaction with borrowing-cost exposure. Include pre-treatment controls and firm, year, and industry-year effects where feasible; cluster errors by firm.
Matching or weighting can improve baseline comparability using industry, leverage, profitability, cash flow, size, growth, valuation, ratings, and maturities. Report balance, common support, and exclusions. These methods reduce measured differences but do not randomize allocation.
Difference-in-differences may be useful if treatment timing and a comparison group can be defended. Test pre-trends and anticipation. An event study around announcements captures short-window market information, not three-year operating consequences.
Do not claim causality without credible identification. Managers choose payouts using information and plans that also predict future performance. Fixed effects, matching, and event plots help, but residual selection remains; use “associated with” unless exogenous variation is defended.
6.6Robustness and validity checks
Test alternative allocation ratios, borrowing-cost proxies, treatment dates, and ROIC definitions. Show gross and net debt movements, report utilities separately, state outlier treatment, and check whether a few large firms dominate aggregate results.
Separate announced programs from actual purchases and test whether spending offsets stock-based compensation. Compare cash expenditure with diluted share-count changes, recognizing that options, awards, and conversions also affect shares.
Report cumulative three-year outcomes and annual paths. One market shock can dominate cumulative returns, while annual leverage and investment measures reveal timing. Do not include company-level charts until source data are reconciled.
6.7Reference audit and research timeline controls
The study separates source verification from substantive interpretation. For the pilot, each company figure was checked against the FY2024 Form 10-K cash-flow statement or the related capital-return disclosure; units were converted from millions to billions only after checking the filing’s unit label; repurchase authorizations were not substituted for executed repurchases; and gross principal repayment was kept separate from net debt change. The four SEC sources are added to the reference list as Apple (2024), Microsoft (2024), Alphabet (2025) and Meta Platforms (2025).
For the literature, the anchor records were checked against publisher or archival pages: Modigliani and Miller (1958) is the American Economic Review article in volume 48, issue 3, pages 261–297; Jensen (1986) is the American Economic Review article in volume 76, issue 2, pages 323–329; and Graham and Harvey (2001) is the Journal of Financial Economics article in volume 60, issues 2–3, pages 187–243, DOI 10.1016/S0304-405X(01)00044-7. The remaining references should be checked using the same fields—author list, year, title, journal, volume/issue, pages or article number, and DOI/URL—before submission. A source is retained only when the cited proposition is supported by the verified record; a search snippet is not treated as verification.
Timeline control: the August–September 2025 cohort is the planned primary cohort; the FY2024 pilot is a completed preliminary observation window; the empirical manuscript should therefore report pilot figures now, label 2025–2026 observations as interim when used, and reserve the completed three-year comparison for the later data freeze.
7Implications for CFOs and investors
For CFOs, the framework encourages a sequence of questions rather than a slogan. First, has the company funded required operations and genuinely attractive projects? Second, what liquidity reserve is appropriate for its cash-flow volatility and strategic plans? Third, how much borrowing capacity should be preserved? Only then should management compare a repurchase with debt repayment. This order does not rule out returning cash. It makes the opportunity cost of doing so more explicit.
A buyback case is strongest when the firm has excess cash after those prior claims, the shares are not overpriced, the firm has capacity to absorb the reduction in cash or increase in leverage, and the transaction fits the firm’s target capital structure. A debt-repayment case is strongest when debt is expensive or floating-rate, a maturity wall is approaching, credit metrics are under pressure, or the firm’s resilience depends on reducing fixed obligations. A mixed allocation may be preferable when the company wants to reduce risk without abandoning a credible repurchase plan.
Investors should look beyond buyback headlines. The amount authorized is not the amount spent. The gross dollars spent are not the same as the net reduction in diluted shares. EPS growth is not the same as operating improvement. A buyback can be sensible when a company is undervalued and financially strong; it can be a poor use of capital when the company overpays, borrows heavily, or neglects important investments. Debt repayment can reduce risk and improve financial flexibility, but it can also leave a business underfunded for worthwhile growth.
For policy discussions, the balance sheet matters more than the label “buyback.” Aramonte and Schrimpf (2020) argue that leverage is the more direct concern when repurchases raise debt relative to equity. That framing avoids treating all distributions as harmful. It also makes the empirical question more precise: does the company’s post-transaction leverage remain compatible with cash-flow risk, investment needs, and the expected cost of refinancing?
8Limitations and future research
This article remains a conceptual review and research framework with a preliminary four-company archival pilot. The pilot demonstrates that executed repurchases, gross principal repayments, operating income, and operating cash flow can be extracted from SEC filings, but it is not a harmonized S&P 500 dataset and does not estimate the effect of repurchases on ROIC, valuation, or shareholder returns. The 2025 cohort has not completed its three-year follow-up. Therefore, the hypotheses should not be presented as findings, and the pilot’s descriptive differences should not be interpreted as causal evidence. The literature covers different periods, markets, and definitions of repurchases, leverage, flexibility, and performance.
Public statements and accounting records also have limits. Cash-flow statements may aggregate or classify repurchases differently, and debt issuance can occur in the same period as repayment. A company’s explanation for its capital allocation is not necessarily a complete account of the decision. Market valuation changes reflect many forces beyond payout policy. Even a carefully matched panel may not isolate causality if managers have private information about future prospects.
Future work could extend the archival design by using loan-level pricing and maturity data, credit-rating actions, or interviews with finance executives. A study could compare firms that face similar borrowing costs but differ in refinancing exposure, or examine whether governance and compensation structures predict repurchase persistence. Another useful extension would test whether repurchase commitments affect investment during later downturns, building on evidence that some programs have become stickier. International comparisons would need to account for differences in disclosure, taxation, and market structure.
9Conclusion
The choice between share repurchases and debt repayment is a capital-allocation problem with no universal answer. The FY2024 pilot shows why the comparison must begin with executed cash flows: Apple and Alphabet were buyback-heavy on the reported ratio, Microsoft was repayment-heavy, and Meta could not be assigned a comparable ratio from the extracted filing line items. These are descriptive allocation patterns, not evidence that one policy caused better operating performance. Buybacks can return genuinely surplus cash, take advantage of undervaluation, and reduce agency costs. They can also increase leverage, consume liquidity, or make accounting ratios look better without improving operations. Debt repayment can reduce interest expense and distress risk, but it sacrifices cash and may reduce the option to invest or borrow later.
A sound study must make these mechanisms visible. It must define the allocation measure, borrowing-cost exposure, leverage, ROIC, enterprise value, equity value, and total shareholder return separately. It must distinguish announced buybacks from completed ones and examine how effects vary with initial leverage, cash-flow volatility, ratings, valuation, and investment opportunities. Because the proposed August–September 2025 cohort reaches three years only in August–September 2028, the current article offers a framework plus a preliminary archival pilot rather than a completed verdict. The defensible conclusion is conditional: use cash where its risk-adjusted marginal value is highest, and judge the result by operating performance, financial resilience, and shareholder value together.
References
- [1]Abuaf N (2012). Excess cash and shareholder payout strategies. Journal of Applied Corporate Finance, 24(3), 39–54. https://doi.org/10.1111/j.1745-6622.2012.00388.x
- [2]Almeida H, Huang R, Xuan Y (2026). Are share repurchases really flexible? Journal of Financial and Quantitative Analysis, 61(1), 176–205. https://doi.org/10.1017/S002210902500016X
- [3]Alphabet (2025). Form 10-K for the year ended December 31, 2024. https://www.sec.gov/Archives/edgar/data/1652044/000165204425000014/goog-20241231.htm
- [4]Apple (2024). Form 10-K for the fiscal year ended September 28, 2024. https://www.sec.gov/Archives/edgar/data/320193/000032019324000123/aapl-20240928.htm
- [5]Aramonte S, Schrimpf A (2020). Mind the buybacks, beware of the leverage. BIS Quarterly Review. https://www.bis.org/publications/mind-buybacks-beware-leverage
- [6]Babenko I, Tserlukevich Y, Vedrashko A (2012). The credibility of open market share repurchase signaling. Journal of Financial and Quantitative Analysis, 47(5), 1059–1088. https://doi.org/10.1017/S0022109012000312
- [7]Brav A, Graham JR, Harvey CR, Michaely R (2005). Payout policy in the 21st century. Journal of Financial Economics, 77(3), 483–527. https://doi.org/10.1016/j.jfineco.2004.07.004
- [8]De Andrés P, de la Fuente G, San Martin P (2018). Capital structure decisions: What Spanish CFOs think. Academia Revista Latinoamericana de Administración, 31(2), 306–325. https://doi.org/10.1108/ARLA-10-2016-0267
- [9]DeAngelo H (2022). The capital structure puzzle: What are we missing? Journal of Financial and Quantitative Analysis, 57(2), 413–454. https://doi.org/10.1017/S002210902100079X
- [10]DeAngelo H, DeAngelo L, Stulz RM (2006). Dividend policy and the earned/contributed capital mix: A test of the life-cycle theory. Journal of Financial Economics, 81(2), 227–254. https://doi.org/10.1016/j.jfineco.2005.07.005
- [11]Dittmar AK (2000). Why do firms repurchase stock? The Journal of Business, 73(3), 331–355. https://doi.org/10.1086/209646
- [12]El Ghoul S, Guedhami O, Kim H, Suh J (2024). The persistence and consequences of share repurchases. Journal of Business Finance & Accounting, 51(1–2), 431–472. https://doi.org/10.1111/jbfa.12699
- [13]Graham JR, Harvey CR (2001). The theory and practice of corporate finance: Evidence from the field. Journal of Financial Economics, 60(2–3), 187–243. https://doi.org/10.1016/S0304-405X(01)00044-7
- [14]Grullon G, Michaely R (2002). Dividends, share repurchases, and the substitution hypothesis. The Journal of Finance, 57(4), 1649–1684. https://doi.org/10.1111/1540-6261.00474
- [15]Guay W, Harford J (2000). The cash-flow permanence and information content of dividend increases versus repurchases. Journal of Financial Economics, 57(3), 385–415. https://doi.org/10.1016/S0304-405X(00)00062-3
- [16]Jagannathan M, Stephens CP, Weisbach MS (2000). Financial flexibility and the choice between dividends and stock repurchases. Journal of Financial Economics, 57(3), 355–384. https://doi.org/10.1016/S0304-405X(00)00061-1
- [17]Jensen MC (1986). Agency costs of free cash flow, corporate finance, and takeovers. The American Economic Review, 76(2), 323–329. https://www.aeaweb.org/aer/top20/76.2.323-329.pdf
- [18]Lei Z, Zhang C (2016). Leveraged buybacks. Journal of Corporate Finance, 39, 242–262. https://doi.org/10.1016/j.jcorpfin.2016.04.004
- [19]Meta Platforms (2025). Form 10-K for the year ended December 31, 2024. https://www.sec.gov/Archives/edgar/data/1326801/000132680125000017/meta-20241231.htm
- [20]Microsoft (2024). Form 10-K for the fiscal year ended June 30, 2024. https://www.sec.gov/Archives/edgar/data/789019/000095017024087843/msft-20240630.htm
- [21]Modigliani F, Miller MH (1958). The cost of capital, corporation finance and the theory of investment. The American Economic Review, 48(3), 261–297. https://www.jstor.org/stable/1809766
- [22]Modigliani F, Miller MH (1963). Corporate income taxes and the cost of capital: A correction. The American Economic Review, 53(3), 433–443. https://www.jstor.org/stable/1809167
- [23]Rapp MS, Schmid T, Urban D (2014). The value of financial flexibility and corporate financial policy. Journal of Corporate Finance, 29, 288–302. https://doi.org/10.1016/j.jcorpfin.2014.08.004