Traffic Performance
Integration of Roadside Friction with Road Geometry and Land Use: An Empirical Case Study of Taiwo Road, Ilorin, Nigeria
Department of Civil and Environmental Engineering, Kwara State University, Malete, Nigeria
Published October 2026
Abstract
This study examined how roadside friction interacts with road geometry and land use to influence traffic performance on Taiwo Road, Ilorin, Nigeria. Video observations and manual traffic counts were undertaken at four road sections over 672 observation intervals during peak periods. Parked vehicles, pedestrians, street vendors and double parking were analysed using descriptive statistics, correlation analysis and Poisson regression. Friction varied spatially with roadside activity and land use, while shoulder width and curved alignment influenced the severity of its operational effects. Pedestrian presence was negatively associated with vehicle volume (β = −0.0039, p = .002; Cohen’s d = 0.245), whereas street-vendor presence was positively associated with volume (β = 0.0054, p = .005; d = 0.219). Field comparisons indicated that double parking reduced effective lane width from 3.5 m to 2.0 m or less, coinciding with a 28.6% reduction in mean operating speed (35 to 25 km/h) and an estimated 30–40% increase in travel delay. None of the individual friction variables significantly predicted lane-changing frequency. The results indicate that roadside friction should be managed as a spatially clustered and compound operational problem. The study recommends coordinated land-use management, parking control, pedestrian facilities, regulated vending and geometry-sensitive traffic management.
Keywords: roadside friction; road geometry; land use; traffic performance; Poisson regression; urban roads
1Symbols, abbreviations and units
β regression coefficient; IRR incidence rate ratio; VIF variance inflation factor; SD standard deviation; CI confidence interval; λ expected count (vehicles or lane changes per interval). SI units are used throughout (m for widths, km/h for speeds, vehicles/h for flow).
2Introduction
Roadside friction factors are activities that take place on the sides of carriageways, or even on the carriageways, that are likely to affect the normal flow of traffic. Such factors—parked vehicles, pedestrians, street vendors, loading and unloading activities and encroaching infrastructure—adversely affect heterogeneous traffic conditions in developing countries far more severely than homogeneous traffic streams (Salini and Ashalatha, 2018; Arya et al., 2020). The friction is not solely a product of the road surface's physical nature but arises from the near-side geometrical layout and roadside operations, whose joint impact produces variations in driving patterns and traffic stream behaviour (Chiguma, 2007; Chauhan et al., 2019).
Crucially, roadside friction does not act in isolation from the roadway environment. Empirical work has shown that friction reduces urban road capacity (Rao et al., 2017), triggers congestion even in small increments (Gulivindala and Mehar, 2018), degrades travel time reliability (Harsha and Mulangi, 2021) and varies with street cross-section and land use (Mansour and Al-Jameel, 2023; Hardini et al., 2025). Obiri-Yeboah et al. (2020) linked friction intensity directly to commercial land use in Kumasi, Ghana. Yet few studies have systematically integrated the three dimensions—friction, geometry and land use—within a single analytical framework, and corridor-level empirical evidence for Nigerian urban roads remains scarce.
The present study addresses this gap by integrating roadside friction with road geometry and land use on Taiwo Road, Ilorin, Kwara State, Nigeria—a representative urban corridor where informally managed roadside operations converge with infrastructural limitations, and where near-constant carriageway width (7.0–7.2 m) provides a natural control for isolating geometric and land-use influences. The specific objectives of the study were to:
- 1. quantify the spatial distribution and intensity of roadside friction elements across the geometrically distinct sections of Taiwo Road;
- 2. examine the compound effects of roadside friction on traffic flow performance, namely vehicle volume, operating speed, effective lane width and travel delay;
- 3. establish the relationship between roadside friction intensity and road geometric characteristics (carriageway width, shoulder width and alignment); and
- 4. evaluate the influence of land use type on roadside friction intensity and the resulting degradation of traffic performance.
The study contributes a validated Poisson regression framework with effect sizes; demonstrates that friction disturbances are compound rather than element-specific; and, using the constant carriageway width as a control, establishes land use as the primary driver of friction intensity with geometry as an amplifier. The remainder of the paper presents the theoretical framework, describes the materials and methods, presents and discusses the results, and concludes with recommendations.
3Theoretical framework
Roadside friction elements may be grouped into static friction (parked vehicles, road furniture, permanent stalls), dynamic friction (pedestrians, moving vendors, loading/unloading), temporary friction (short-term construction, temporary stalls), permanent friction (bus stops, utility poles, drainage structures) and compound friction (simultaneous combinations of elements) (Islam et al., 2018; Mansour and Al-Jameel, 2023; Hardini et al., 2025). The integration of friction with the roadway environment can be conceptualised as a two-stage mechanism: (i) land use and roadside activity generate friction occurrence and intensity, while (ii) geometric characteristics—effective width, shoulder space and alignment—condition how severely a given friction intensity translates into lost capacity, reduced speed and delay. Because the outcome variables of interest (lane changes and vehicle volume per observation interval) are non-negative integer counts, the Poisson regression model was adopted:
where X1–X4 denote the friction predictors (parked vehicles, pedestrians, street vendors and double parking), β0 is the intercept, β1–β4 are coefficients representing the change in the log expected count per unit increase in each predictor, and εi is the error term. The model assumes count outcomes, independence of observations, equidispersion (E(Y) = Var(Y) = λ), linearity in the log link and absence of harmful multicollinearity (Washington et al., 2011). Exponentiated coefficients yield incidence rate ratios:
such that (IRR − 1) × 100 gives the percentage change in the expected count per unit increase in predictor j. Standardised effect sizes were computed as:
and interpreted using Cohen’s (1988) conventions (0.2 small, 0.5 medium, 0.8 large). Multicollinearity was assessed using the variance inflation factor, with VIF < 5.0 regarded as acceptable (Montgomery et al., 2012).
4Materials and methods
4.1Description of study area
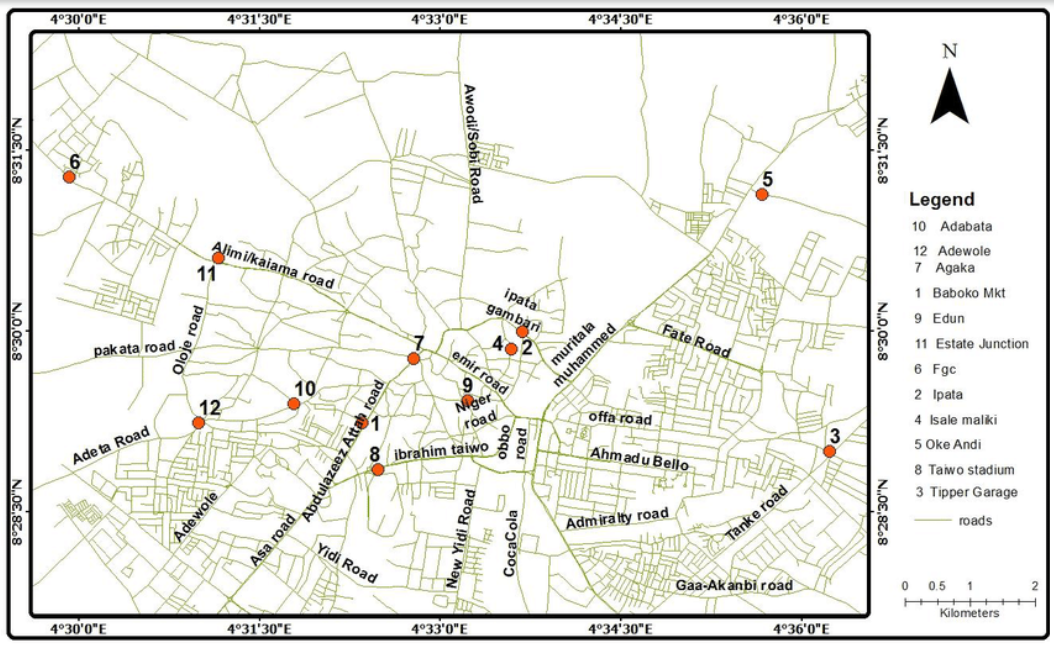
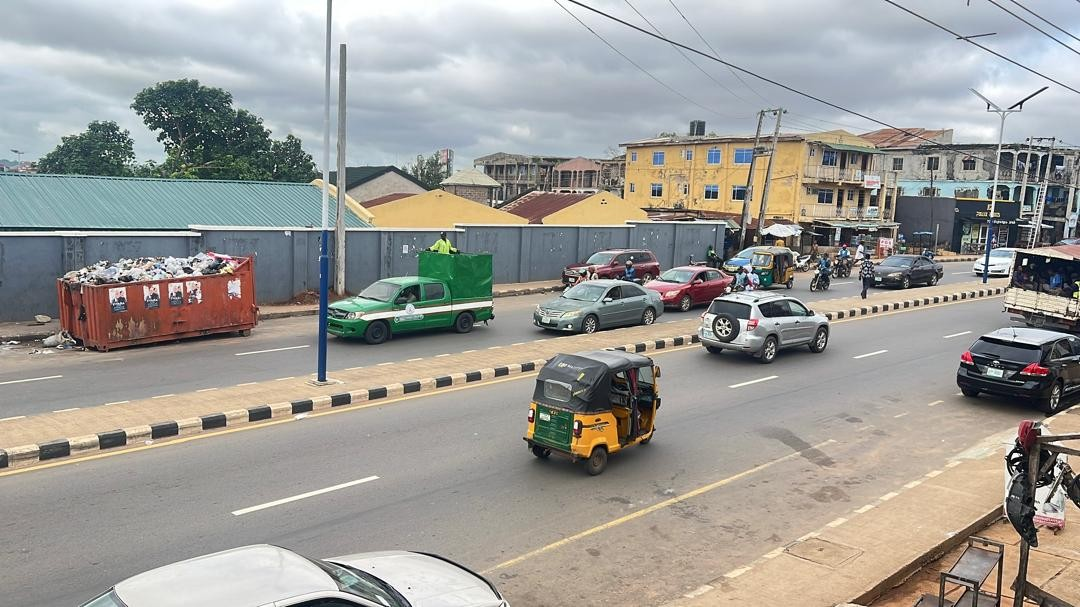
Taiwo Road is one of Ilorin's major urban corridors in Kwara State, Nigeria, serving as a key connection node carrying a heterogeneous mix of private cars, commercial vehicles, motorcycles and tricycles. The roadside environment comprises commercial enterprises, residential estates, intensive roadside markets and institutional facilities. The road was divided into four sections (Figure 1 and Figure 2): Section A (Taiwo Isale–Ikokoro junction; open market, residential, shops), Section B (Ikokoro–Unity Road junction; office blocks, churches, shops, curved alignment), Section C (Unity–Oja Iya junction; shops, street vendors, office blocks) and Section D (Oja Iya junction–Taiwo Oke roundabout; offices, shops, residential). Carriageway widths are fairly consistent (7.0–7.2 m) but outer shoulders vary markedly (1.6–3.0 m), providing a natural control for separating geometric from land-use influences on friction.
4.2Data collection
Primary data were collected through structured field observations using high-resolution video cameras mounted at four fixed locations, complemented by manual traffic counts on formatted tally sheets to cross-validate the video extraction (FHWA, 2017). Observations covered peak periods over a four-week period, yielding n = 672 observation intervals, each comprising counts of vehicle volume, lane-change events and roadside friction events.
4.2.1Quantification of roadside friction distribution and intensity
A preliminary reconnaissance survey along the entire stretch documented friction hotspots photographically. Four sections were selected to represent the diversity of friction conditions based on variation in land use, geometry and observed friction intensity. Friction elements were classified into static, dynamic, temporary, permanent and compound categories, and average hourly intensities were computed per section.
4.2.2Assessment of compound friction effects on traffic flow performance
Speeds were measured from video footage using reference points at known intervals under three conditions: free flow, with parked vehicles, and with double parking. Effective lane widths were measured with tapes under different parking conditions. Travel delay was computed as the difference between observed travel time and free-flow travel time, and lane-changing frequency was categorised as friction-induced or traffic-induced. Poisson regression (equations (1)–(3)) was used to test whether individual elements or their compound presence drive performance outcomes.
4.2.3Relating friction intensity to road geometry
Carriageway and shoulder widths were measured at regular intervals per section, alignment (flat vs. curved) was recorded, and section-wise friction intensity was compared against these geometric characteristics to isolate geometry's amplifying role.
4.2.4Evaluating land-use influence on friction intensity
Land use was mapped (open market, commercial/office, institutional, residential, mixed-use) for each section, and friction intensity—together with its traffic performance consequences—was evaluated against land use type, exploiting the near-constant carriageway width as a natural control.
4.3Data analysis
Data were analysed using a multi-level framework integrating descriptive statistics (means, standard deviations, skewness, kurtosis), spatial section-wise comparison, and Poisson regression. Model validation comprised multicollinearity assessment (VIF), residual analysis, goodness-of-fit statistics (AIC, BIC), the Durbin–Watson statistic, and link and Hausman specification tests. Comparative analysis quantified percentage changes in lane width, speed, throughput, travel time and collision risk across the three traffic conditions.
5Results and discussion
5.1Spatial distribution and intensity of roadside friction (Objective 1)
Playback of continuous video recordings identified four recurring friction elements: parked vehicles, pedestrians, street vendors and double parking. Table 1 and Figure 3 present their average hourly distribution by section. Section A recorded the highest parked-vehicle (54.8/h) and pedestrian (29.9/h) counts, marking it as the principal friction hotspot, while Section B led in street vendors (21.6/h) and double parking (27.5/h). Section C, lowest overall in friction, paradoxically recorded the highest lane-changing frequency (31.5/h), indicating weaving behaviour where the carriageway is comparatively unobstructed. Overall means of 51.9 parked vehicles, 28.0 pedestrians, 20.0 vendors and 25.3 double-parking events per hour confirm substantial and persistent friction loading on the corridor.
| Section | Parked Vehicle | Pedestrian | Street Vendor | Double Parking | Lane Changes |
|---|---|---|---|---|---|
| Section A | 54.8 | 29.9 | 19.4 | 26.6 | 29.5 |
| Section B | 51.4 | 26.4 | 21.6 | 27.5 | 29.1 |
| Section C | 49.4 | 26.0 | 19.4 | 22.5 | 31.5 |
| Section D | 51.9 | 29.6 | 19.6 | 24.4 | 27.6 |
| Mean | 51.9 | 28.0 | 20.0 | 25.3 | 29.4 |
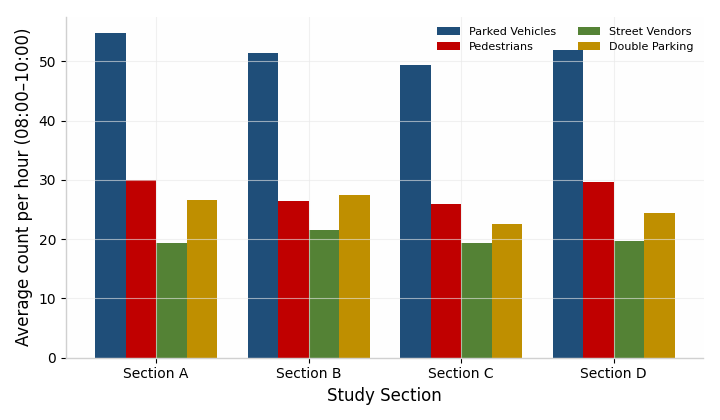
Classification (Table 2) showed that static elements (parked vehicles, double parking) were more consistently present, whereas dynamic elements (pedestrians, vendors) exhibited higher variability and clustering. The positive skewness of pedestrian (1.06), vendor (1.34) and double-parking (1.43) activity confirmed that friction is concentrated in hotspots rather than uniformly distributed, so interventions can be spatially targeted rather than road-wide.
| Category | Elements Identified | Frequency (Mean per Interval) | Distribution Characteristic |
|---|---|---|---|
| Static friction | Parked vehicles | 4.32 | Moderate, evenly distributed |
| Dynamic friction | Pedestrians | 2.33 | Variable, occasional clustering |
| Dynamic friction | Street vendors | 1.67 | Skewed towards hotspots |
| Static friction | Double parking | 2.10 | Occasional but highly disruptive |
| Compound friction | Combined elements | Varies | Context-dependent |
5.2Compound effects of roadside friction on traffic flow performance (Objective 2)
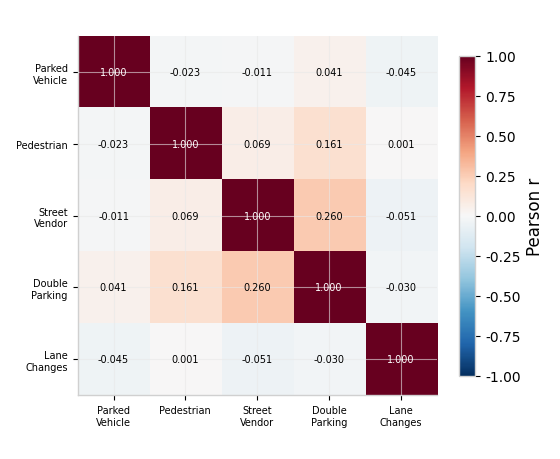
The correlation matrix (Table 3, Figure 4) revealed broadly weak linear associations among friction variables, the strongest being street vendors versus double parking (r = 0.260). Lane changes correlated near-zero with all friction variables, foreshadowing the regression results.
| Variable | Parked Vehicle | Pedestrian | Street Vendor | Double Parking | Lane Changes |
|---|---|---|---|---|---|
| Parked vehicle | 1 | −0.023 | −0.011 | 0.041 | −0.045 |
| Pedestrian | −0.023 | 1 | 0.069 | 0.161 | 0.001 |
| Street vendor | −0.011 | 0.069 | 1 | 0.260 | −0.051 |
| Double parking | 0.041 | 0.161 | 0.260 | 1 | −0.030 |
| Lane changes | −0.045 | 0.001 | −0.051 | −0.030 | 1 |
Model 1 (lane changes, Table 4) showed a highly significant intercept (β = 0.9962, p < .001) but no significant predictor (all p > .05; effect sizes d ≤ 0.125). This suggests that lane-changing on Taiwo Road is driven more by traffic volume, curvature and vehicle interaction than by isolated friction elements—disturbances emerge from compound rather than isolated friction effects. Model fit was acceptable (AIC = 1,247.3; BIC = 1,268.9; log-likelihood = −618.6).
| Predictor | β | Std. Error | z-value | p-value | Interpretation |
|---|---|---|---|---|---|
| (Intercept) | 0.9962 | 0.0661 | 15.068 | < .001 | Baseline rate significant |
| Parked vehicle | −0.0132 | 0.0111 | −1.192 | 0.233 | Not significant; small effect |
| Pedestrian | 0.0019 | 0.0111 | 0.171 | 0.864 | Not significant; negligible |
| Street vendor | −0.0221 | 0.0177 | −1.245 | 0.213 | Not significant; small effect |
| Double parking | −0.0051 | 0.0119 | −0.432 | 0.666 | Not significant; negligible |
Model 2 (total vehicle volume, Table 5) identified two statistically significant predictors. Pedestrian presence exerted a significant negative effect (β = −0.0039, p = .002; IRR = 0.996; Cohen’s d = 0.245), implying roughly 0.4% lower expected volume per additional pedestrian. Street vendor presence showed a significant positive association (β = 0.0054, p = .005; IRR = 1.005; d = 0.219), reflecting the co-location of vendors in commercially active, high-demand zones rather than traffic generation. Parked vehicles (p = .624) and double parking (p = .203) were non-significant for volume despite their physical obstruction, consistent with localised but intense effects.
| Predictor | β | Std. Error | z-value | p-value | IRR (95% CI) | Cohen’s d | Interpretation |
|---|---|---|---|---|---|---|---|
| (Intercept) | 5.2898 | 0.0074 | 715.06 | < .001 | 198.26 [194.42, 202.18] | — | Baseline significant |
| Parked vehicle | −0.0006 | 0.0012 | −0.490 | 0.624 | 0.999 [0.997, 1.002] | 0.038 | Not significant |
| Pedestrian | −0.0039 | 0.0012 | −3.144 | 0.002 | 0.996 [0.994, 0.999] | 0.245 | Significant negative |
| Street vendor | 0.0054 | 0.0019 | 2.804 | 0.005 | 1.005 [1.002, 1.009] | 0.219 | Significant positive |
| Double parking | −0.0017 | 0.0013 | −1.272 | 0.203 | 0.998 [0.996, 1.001] | 0.099 | Not significant |
The comparative analysis (Table 6, Figure 5) quantified the physical consequences of parking-related friction. Double parking reduced effective lane width by 43% (3.5 m to ≤2.0 m), producing a 28.6% reduction in mean operating speed (35 to 25 km/h), a throughput decline from high to low, and a 30–40% increase in average travel delay, with collision risk escalating from low to high. Model diagnostics confirmed reliability: dispersion parameters φ ≈ 1.0 (1.12 and 0.98), Durbin–Watson statistics 1.85–2.15, and VIF values of 1.0026–1.0929 confirming statistical independence among predictors.
| Traffic Parameter | Free Flow | With Parked Vehicles | With Double Parked Vehicles | % Change |
|---|---|---|---|---|
| Lane width | 3.5 m | ≤ 2.8 m | ≤ 2.0 m | −43% |
| Vehicle speed | 35 km/h | 35 km/h | 25 km/h | −28.6% |
| Traffic throughput | High | Medium | Low | Reduced |
| Average travel time | Minimal | Minimal delay | 30–40% delay increase | Significant |
| Collision risk | Low | Moderate | High | Increased |
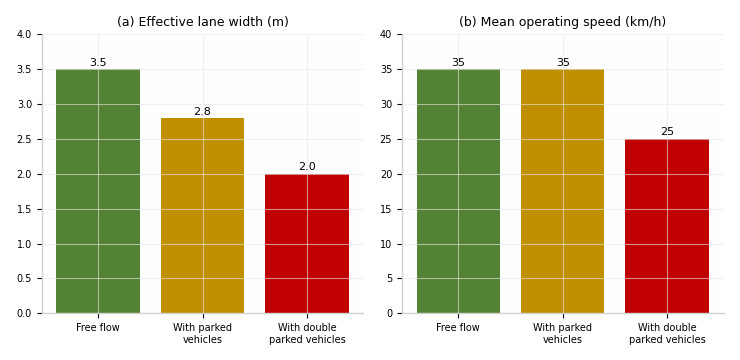
The safety-related interpretation should be treated as an operational inference rather than as a direct estimate of crash risk, because the reported models use roadside-friction predictors and do not provide observed crash counts. Pedestrian activity (β = −0.0039, p = .002) and street vending (β = 0.0054, p = .005) were statistically associated with vehicle-volume outcomes; their potential safety implications arise from pedestrian–vehicle conflict points and driver distraction. Parked and double-parked vehicles were individually non-significant in the volume model (p = .624 and p = .203, respectively), although field observations indicated that double parking narrowed the effective lane, encouraged evasive manoeuvres and reduced speeds to 25 km/h. Correlations between vendors and double parking (r = 0.260), and between pedestrians and double parking (r = 0.161), suggest spatial clustering of friction elements. These findings support targeted safety management, but do not establish a causal change in crash frequency.
| Predictor | Model A (Safety) β | p-value | Model B (Interaction) β | p-value |
|---|---|---|---|---|
| Parked vehicle | −0.0006 | 0.624 | −0.0132 | 0.233 |
| Pedestrian | −0.0039 | 0.002 | +0.0019 | 0.864 |
| Street vendor | +0.0054 | 0.005 | −0.0221 | 0.213 |
| Double parking | −0.0017 | 0.203 | −0.0051 | 0.666 |
5.3Relationship between friction intensity and road geometry (Objective 3)
Section-wise analysis (Table 8) reveals the geometry–friction relationship. Carriageway widths were near-constant (7.0–7.2 m), so capacity supply was essentially uniform across sections; observed differences in performance therefore stem from friction and environmental factors rather than basic cross-section. Shoulder widths, by contrast, varied markedly (1.6–3.0 m). Narrow shoulders constrain manoeuvring space and force friction activities—illegal parking, informal loading, pedestrian intrusion—into the travelled way, amplifying their consequences. Section B illustrates this compounding clearly: despite having the narrowest shoulder (1.6 m), its friction intensity was only moderate because of institutional land use, but its curved alignment and restricted lateral space mean that any friction present translates into severe manoeuvring difficulty. Effective lane width under friction conditions fell as low as 2.0 m against a 7.0–7.2 m carriageway, confirming that roadside encroachment consumes a substantial share of designed capacity. Geometry thus acts as an amplifier: it does not generate friction, but conditions how severely a given friction intensity degrades flow.
| Section | Carriageway Width | Shoulder Width | Alignment | Dominant Land Use | Friction Intensity |
|---|---|---|---|---|---|
| A | 7.0 m | 2.0 m | Flat | Open market, residential, shops | High |
| B | 7.2 m | 1.6 m | Curve | Office blocks, shops, church | Moderate |
| C | 7.2 m | 3.0 m | Flat | Shops, street vendors, office blocks | Very high |
| D | 7.0 m | 3.0 m | Flat | Office blocks, shops, residential | Moderate |
5.4Influence of land use on friction intensity and traffic performance (Objective 4)
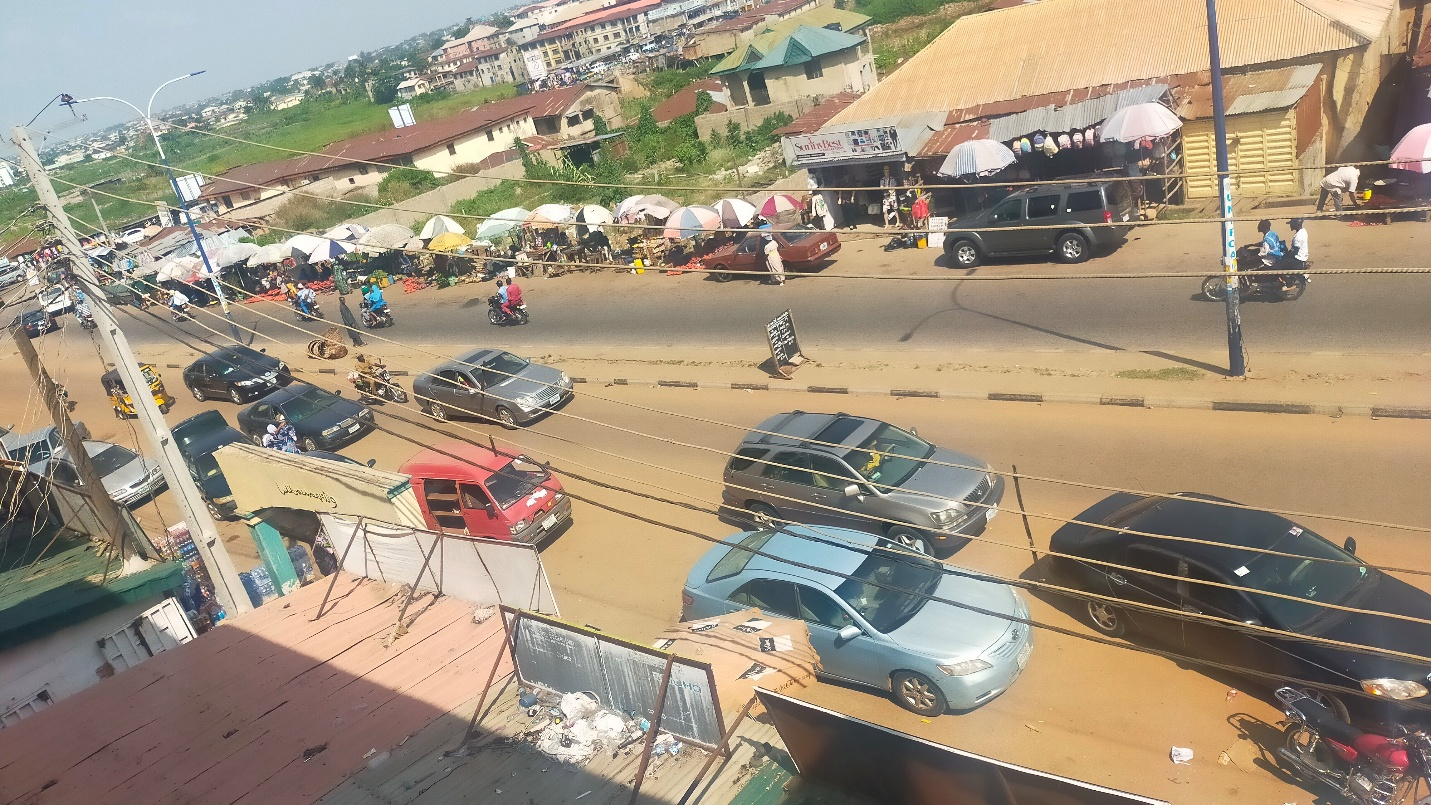
With carriageway width held effectively constant, the section-wise assessment indicates that land use is an important determinant of friction intensity (Table 9). Market-oriented and vendor-intensive areas are associated with high friction, while mixed office and residential areas are generally assessed as moderate to lower in intensity. The section-level event counts in Table 1 also show that the dominant friction element differs by location: Section A recorded the highest parked-vehicle and pedestrian counts, whereas Section B recorded the highest street-vendor and double-parking counts. These findings indicate that land use helps explain where friction occurs, while shoulder width and alignment condition how strongly it affects traffic performance. This interpretation is consistent with Obiri-Yeboah et al. (2020), Hardini et al. (2025), and Mansour and Al-Jameel (2023). Effective management therefore requires land-use planning, geometric design and enforcement to be considered together (Figure 6).
| Land Use Type | Pedestrian Activity | Vendor Presence | Parking Demand | Friction Intensity |
|---|---|---|---|---|
| Open market | Very high | High | High | Very high |
| Commercial/office | Moderate | Low–moderate | High | Moderate–high |
| Institutional | Moderate | Low | Moderate | Moderate |
| Residential | Low–moderate | Low | Moderate | Low–moderate |
| Mixed-use | High | Moderate | High | High |
6Conclusion
This study integrated roadside friction, road geometry and land use on Taiwo Road, Ilorin, using 672 video-based observation intervals across four road sections. The findings show that friction is spatially uneven and that the dominant roadside activity varies by section. Pedestrian presence was negatively associated with vehicle volume (β = −0.0039, p = .002; d = 0.245), while street-vendor presence was positively associated with volume (β = 0.0054, p = .005; d = 0.219). These associations should not be interpreted as proof that vending increases traffic volume causally. The field comparison found that double parking reduced effective lane width from 3.5 m to 2.0 m or less, reduced mean operating speed from 35 to 25 km/h (28.6%), and was associated with a 30–40% increase in travel delay. Individual friction variables did not significantly predict lane-changing frequency. The near-constant carriageway width (7.0–7.2 m) helped distinguish land-use patterns from geometric constraints; variable shoulder widths (1.6–3.0 m) and curved alignment were important operational amplifiers. VIF values of approximately 1.003–1.093 indicated no concerning multicollinearity among the reported predictors.
The study recommends integrating land use planning, geometric design and enforcement: (i) designation and strict enforcement of no-parking zones in market and commercial districts; (ii) provision of off-street parking near markets and shopping areas; (iii) construction of clearly marked walkways, crossings and barriers; (iv) relocation or licensing of street vendors into designated zones; (v) public awareness campaigns; and (vi) further research incorporating time-of-day effects, enforcement presence and traffic simulation. The integrated framework provides a transferable evidence base for traffic management on Taiwo Road and comparable corridors in rapidly urbanising African cities.
Author contributions
S. B. Abdulrasheed: conceptualization, methodology, data collection, formal analysis, software, validation, writing – original draft. B. Ibitoye: supervision, writing – review and editing.
Acknowledgements
The authors acknowledge the Department of Civil Engineering, Kwara State University, Malete, for logistical support during field data collection, and the residents of Taiwo Road, Ilorin, whose cooperation made this study possible.
References
- [1]Arya VS, Binu AB, Pradeep J, Thomas G, Suminamol A, Aparna V (2020). Impact of roadside friction on urban roads. Journal of Transportation Engineering and Traffic Management, 1.
- [2]Chauhan R, Dhamaniya A, Arkatkar S, Sahu PK, Vikram D (2019). Effect of roadside friction parameter on urban road traffic under mixed traffic scenario. Journal of the Eastern Asia Society for Transportation Studies, 13, 314–330.
- [3]Chiguma ML (2007). Analysis of roadside friction impacts on urban roads: Case study Dar-es-Salaam. Doctoral dissertation, KTH Royal Institute of Technology, Stockholm.
- [4]Federal Highway Administration (FHWA) (2017). Traffic Monitoring Guide. U.S. Department of Transportation, Washington, D.C.
- [5]Gulivindala S, Mehar R (2018). Quantifying the effect of roadside friction on capacity reduction of urban roads. Transport Problems, 13(2), 97–108.
- [6]Hardini P, Indriyati EW, Termida NA, Janudardono W (2025). Impact of roadside friction parameters to road performance: A study of road side activities to Jend. A Yani Road, Purbalingga. E3S Web of Conferences, 609, 03001.
- [7]Harsha M, Mulangi RH (2021). Probability distributions analysis of travel time variability for the public transit system. International Journal of Transportation Science and Technology, 11(4), 790–803.
- [8]Islam M, Al Razib S, Hasan M, Ali S, Monir O, Hasan M (2018). Cause of reduction of effective roadway width due to roadside friction in Dhaka City. American Journal of Traffic and Transportation Engineering, 3(1), 6–17.
- [9]Mansour AI, Al-Jameel HAE (2023). Side-friction impacts on urban streets performance in divided and undivided streets. Pollack Periodica, 18(3), 147–153.
- [10]Montgomery DC, Peck EA, Vining GG (2012). Introduction to Linear Regression Analysis (5th ed.). Wiley, New York.
- [11]Obiri-Yeboah A, Amoah A, Gbeckor-Kove M (2020). Analysis of congestion on some road link sections using roadside friction in congestion index in Kumasi. International Journal for Traffic and Transport Engineering, 10(1), 31–40.
- [12]Rao AM, Krishna KS, Basha MS (2017). Impact of roadside friction on capacity and level of service of urban roads: A case study. Transportation Research Procedia, 25, 3361–3370.
- [13]Salini S, Ashalatha R (2018). Modeling the effects of roadside friction on midblock capacity under heterogeneous traffic conditions. International Journal for Traffic and Transport Engineering, 8(4), 448–461.
- [14]Washington S, Karlaftis MG, Mannering FL (2011). Statistical and Econometric Methods for Transportation Data Analysis (2nd ed.). CRC Press, Boca Raton.