Digital Agriculture and Sustainability
From Adoption to Impact: A Lifecycle Monitoring Framework for Scalable and Meaningful Digital Agriculture in India
1Department of Computer Science, MAEER's MIT Arts, Commerce and Science College, Alandi (D), Pune, Maharashtra, India
2Department of Electronics, MAEER's MIT Arts, Commerce and Science College, Alandi (D), Pune, Maharashtra, India
Published October 2026
Abstract
India's pursuit of Viksit Bharat@2047 has placed digital agriculture at the centre of agricultural policy through initiatives such as the Digital Agriculture Mission, AgriStack, the Soil Health Card scheme, the electronic National Agriculture Market (e-NAM) and a rapidly growing agri-tech start-up ecosystem. Yet the success of digital programmes is still reported largely through enrolment and adoption counts: farmers registered, devices distributed or applications downloaded. Such figures reveal little about whether a technology remains in use, why farmers discontinue it, or whether it delivers measurable benefit on the farm. In a country where most operational holdings are small and marginal, this gap between adoption and outcome is a central implementation risk. This chapter proposes the Agri-Tech Lifecycle Monitor (ALCM), a conceptual and design-oriented framework that follows an agricultural technology from introduction through adoption, usage, continued usage, actual benefit and impact. A parallel recovery pathway, comprising abandonment, reason identification, problem analysis, corrective action and re-tracking, treats discontinuation as diagnostic information rather than as failure. The framework defines stage-wise indicators, including the continuation rate, abandonment rate, recovery rate and a proposed Meaningful Digital Transformation Conversion (MDTC) ratio, which expresses the share of adopters who reach a defined measurable-impact stage. A multilingual farmer interface (Marathi, Hindi and English) and a stakeholder dashboard for extension officers, Krishi Vigyan Kendras, farmer producer organisations, technology providers and policymakers form the operational layer. Using an illustrative smart-irrigation scenario, the chapter shows how lifecycle monitoring exposes attrition and unrealised benefit that adoption statistics conceal. It then derives policy lessons and implementation pathways for embedding lifecycle monitoring in programme design, extension systems and digital public infrastructure. The chapter argues that scalable digital agriculture should be judged not by how many farmers adopt a technology, but by how many continue to use it and gain from it.
Keywords: digital agriculture; technology adoption; continued use; dis-adoption; lifecycle monitoring; impact assessment; agricultural extension; Viksit Bharat@2047
1Introduction
Agriculture is in the middle of a technological transition. Internet of Things (IoT) sensors, artificial intelligence (AI), satellite and drone imagery, mobile advisory services, cloud platforms, automated irrigation and digital marketplaces are entering both the farm and the value chain around it. International agencies argue that, if deployed well, these technologies can raise productivity, improve the efficiency of water, fertiliser and labour use, strengthen resilience to climate shocks and widen market access (FAO, 2022; Klerkx et al., 2019). For India, where agriculture supports a large share of the workforce and where around 86 per cent of operational holdings are small or marginal (Department of Agriculture and Farmers Welfare [DA&FW], 2019), digital agriculture is increasingly framed as a pathway towards the national goal of Viksit Bharat@2047.
However, adopting a technology is not the same as being transformed by it. A farmer may register on a mobile advisory application, install a soil-moisture sensor, subscribe to a weather service, purchase a drip-automation kit or list produce on a digital marketplace. Each of these actions is recorded as adoption. None of them, on its own, shows that the technology is still being used months later, or that its use has produced any agricultural benefit.
Consider a farmer who adopts a sensor-based irrigation controller. During the first month the device is used regularly. Then the sensor fails, the mobile network becomes unreliable during the monsoon, the readings prove difficult to interpret, or the annual maintenance charge becomes unaffordable, and the farmer quietly stops using it. A conventional adoption survey would still count this farmer as an adopter. A second farmer may continue using the same device without any meaningful change in water use or yield because the recommendations are poorly calibrated to local soils, complementary inputs are missing, or the economic return does not justify the extra effort. In both cases adoption statistics would overstate the degree of digital transformation.
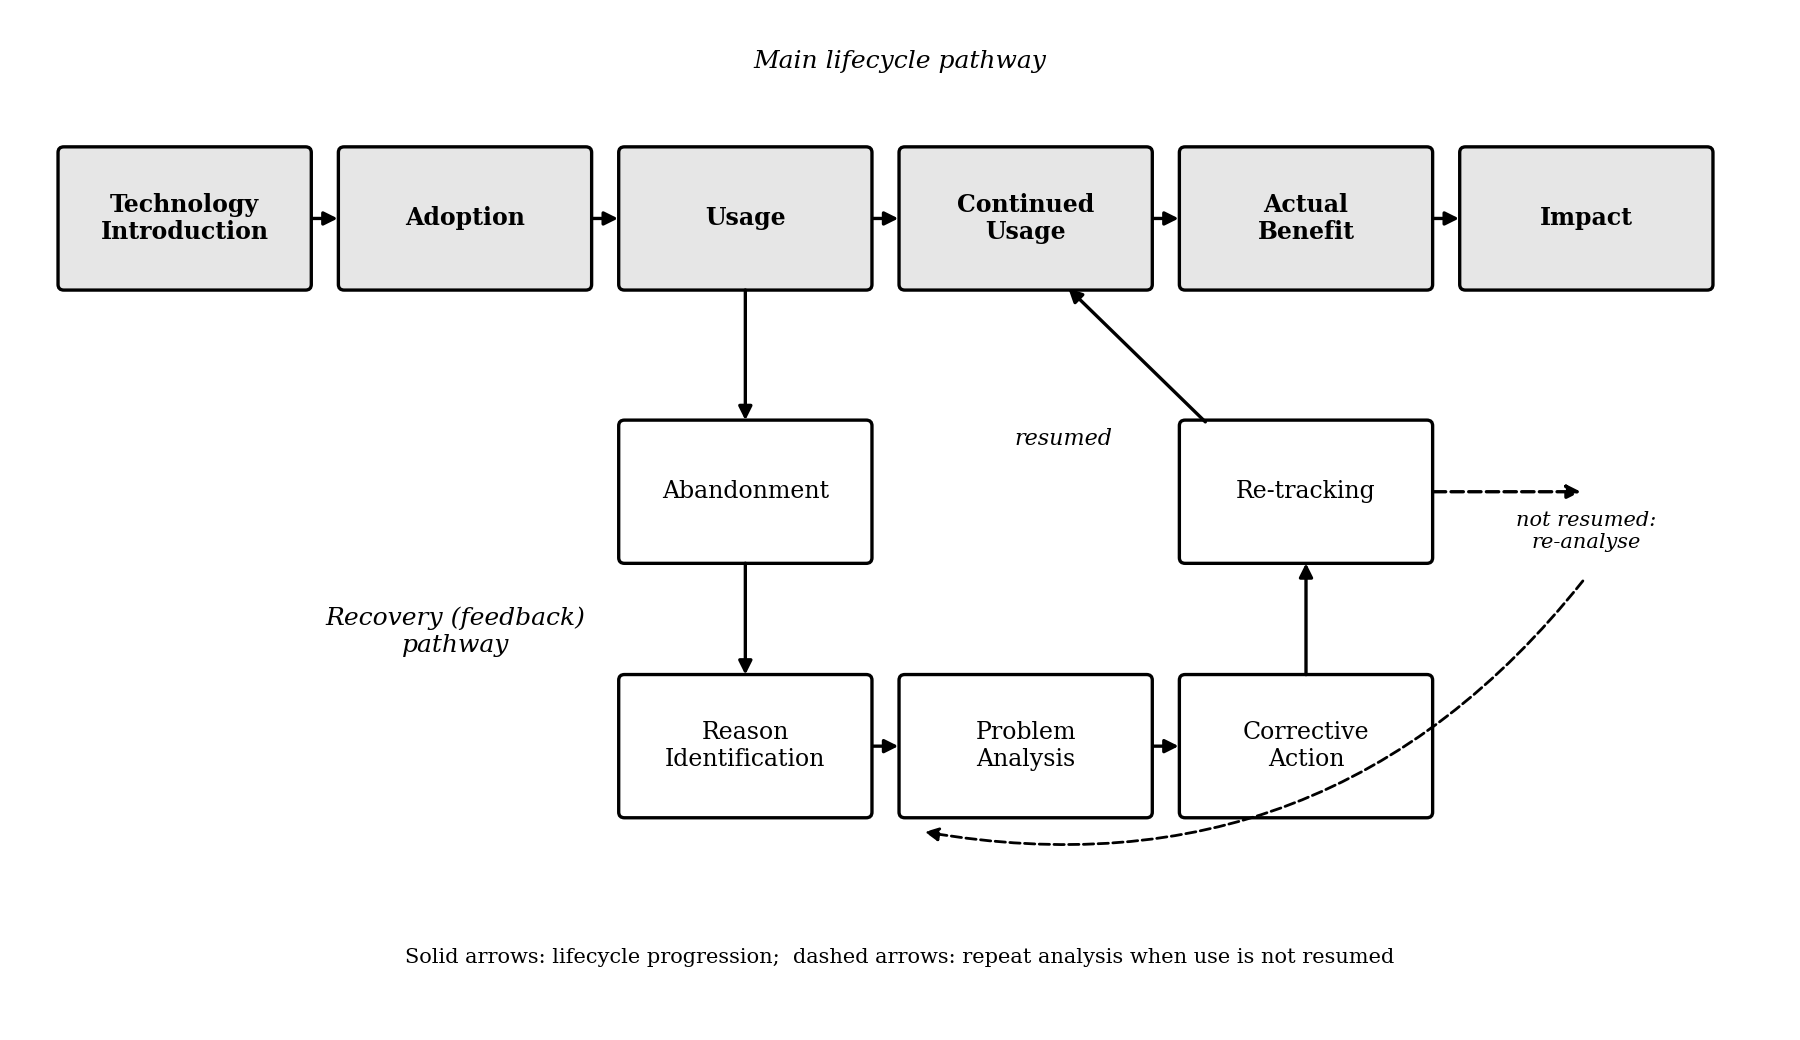
These scenarios lead to the central question of this chapter: What happens after a farmer adopts a technology? We argue that digital transformation should be understood as a lifecycle in which adoption is only one stage. The proposed lifecycle runs from Technology Introduction to Adoption, Usage, Continued Usage, Actual Benefit and Impact. Where use stops, a recovery pathway is triggered: Abandonment, Reason Identification, Problem Analysis, Corrective Action and Re-tracking. We operationalise this lifecycle as the Agri-Tech Lifecycle Monitor (ALCM), a digital monitoring platform designed for Indian implementation conditions.
The chapter makes four contributions. First, it integrates stages that the literature usually studies separately (adoption, continuance, dis-adoption, corrective intervention and impact) into a single monitoring framework. Second, it defines a compact set of stage-wise indicators, including a proposed Meaningful Digital Transformation Conversion (MDTC) ratio. Third, it outlines a multilingual platform architecture suited to smallholders and to India's extension institutions. Fourth, it derives policy lessons and implementation pathways for making lifecycle monitoring a routine part of scalable digital agriculture programmes. The remainder of the chapter is organised as follows. Section 2 sets out the Indian policy context. Section 3 reviews the literature and identifies the research gap. Section 4 presents the methodology and the ALCM framework. Section 5 applies it to an illustrative smart-irrigation scenario. Section 6 draws policy lessons and implementation pathways, Section 7 discusses the wider implications of the framework, Section 8 notes its limitations, and Section 9 concludes with directions for future work.
2Digital agriculture in India: Policy context and the adoption–outcome gap
India has invested heavily in the digital foundations of agriculture over the last two decades. Kisan Call Centres (2004) established telephone-based advisory services; the Soil Health Card scheme (2015) created a nationwide system of soil testing and nutrient recommendations; and e-NAM (2016) linked regulated wholesale markets through an online trading platform. More recently, the Digital Agriculture Mission, approved by the Union Cabinet in September 2024, set out to build AgriStack as digital public infrastructure for agriculture, comprising a Farmers' Registry, geo-referenced village maps and a Crop Sown Registry, alongside the Krishi Decision Support System for geospatial, weather and crop information (Government of India, 2024). Schemes such as Namo Drone Didi, which supports women's self-help groups in providing drone services, and a growing number of agri-tech start-ups and farmer producer organisations (FPOs) have widened the range of technologies reaching farmers.
These initiatives have generated impressive enrolment numbers. Yet the indicators used to report progress are dominated by inputs and first contact: cards distributed, farmers registered, devices sanctioned or transactions initiated. Far less is known about the stages that follow. Do farmers who receive a Soil Health Card actually change their fertiliser application? Do farmers who install a sensor still use it after one or two cropping seasons? When a drone service or advisory application is abandoned, is the reason technical, economic, infrastructural or agronomic, and does anyone act on that information?
This adoption–outcome gap matters for at least three reasons. First, for smallholders the cost of a technology that is adopted but later abandoned is not trivial; it absorbs scarce cash, time and trust. Second, public and private investment decisions made on adoption counts alone risk scaling technologies that do not deliver. Third, the inclusion goals of Viksit Bharat@2047 require evidence on who continues to benefit, disaggregated by holding size, gender, region and digital access, which enrolment data cannot provide. Lifecycle monitoring is therefore not merely a research interest; it is an implementation requirement for scalable digital agriculture.
3Literature review
This section reviews research on digital agriculture across the lifecycle stages relevant to the ALCM: the nature of digital agriculture, determinants of adoption, post-adoption use and dis-adoption, barriers and corrective action, and the measurement of benefits and impact. It closes by identifying the research gap that motivates the framework.
3.1Digital agriculture and Agriculture 4.0
Digital agriculture refers to the integration of digital technologies into agricultural production, resource management and decision-making. Wolfert et al. (2017) describe how big data and connected devices are reshaping the organisation of farm management and the wider food chain. Abbasi et al. (2022) review the Agriculture 4.0 literature and identify technological, socio-economic and implementation barriers to digitisation. Silveira et al. (2021) synthesise the descriptions, technologies, barriers, advantages and disadvantages of Agriculture 4.0, while Khanna et al. (2022) discuss how digital technologies can support more sustainable resource management. Klerkx et al. (2019) emphasise that the social, institutional and power dimensions of digitalisation deserve as much attention as the technologies themselves. Collectively, these studies establish the potential of digital agriculture but focus mainly on the introduction stage and on expected rather than realised benefits.
3.2Determinants of technology adoption
Classical adoption theory treats the decision to adopt an innovation as a function of its relative advantage, compatibility, complexity, trialability and observability (Rogers, 2003), and of perceived usefulness and ease of use (Davis, 1989). In agriculture, Shang et al. (2021) show that the adoption and diffusion of digital farming technologies depend on interactions between farmers, technologies, farms and the wider agricultural system. Dibbern et al. (2024) identify economic, infrastructural, technical, reliability and data-security factors as the main drivers and barriers. In the Indian context, Mittal and Mehar (2016) find that education, landholding size and access to information shape farmers' use of modern information and communication technology, and Mishra et al. (2024) report that limited awareness, inadequate skills, technological complexity and financial constraints impede adoption among rice farmers. This literature explains who adopts and why, but generally treats adoption as the endpoint of analysis.
3.3Post-adoption use, continuance and dis-adoption
Research outside agriculture has long recognised that initial acceptance does not guarantee continued use. The expectation–confirmation model of information-system continuance shows that users continue only when their post-use experience confirms their initial expectations (Bhattacherjee, 2001). Agricultural studies report a similar pattern. Moser and Barrett (2006) document substantial dis-adoption of an intensive rice-cultivation method among smallholders in Madagascar, showing that adoption is dynamic rather than a one-off event. Kernecker et al. (2020) find a gap between farmers' expectations of smart-farming technologies and their actual experience. In India, studies of soil and water conservation technologies have examined continued adoption, discontinuance and technology gaps (Meena et al., 2015; Bagdi et al., 2015), and Cole and Fernando (2021) analyse adoption, diffusion and sustained use of a mobile advisory service among cotton farmers in Gujarat. These findings support monitoring Usage and Continued Usage as distinct stages from Adoption.
3.4Barriers, abandonment and corrective action
Technologies may be abandoned because of high cost, device or system failure, poor connectivity, inadequate training or support, poor fit with local conditions, or failure to deliver the benefits that were promised. Reviews of decision-support tools in agriculture conclude that weak attention to usability, local relevance and ongoing support is a common cause of low uptake and short-lived use (Rose et al., 2016). Aker (2011) and Fabregas et al. (2019) argue that digital advisory services can be cost-effective in developing countries, but only when design, trust and follow-up are addressed. Although these studies identify barriers and discontinuance, they seldom propose a structured, repeatable process for recording abandonment, diagnosing its causes, implementing corrective action and tracking whether use resumes. This motivates the ALCM recovery pathway.
3.5Measuring benefit and impact
Digital technologies are expected to improve productivity, reduce input use and lower costs. Khanna et al. (2022) point to possible reductions in agrochemical and water use, and Abbasi et al. (2022) discuss expected gains in efficiency and resource management. Expected benefits, however, may not translate into realised outcomes on smallholder farms. Monitoring frameworks from public health offer a useful parallel: the RE-AIM framework evaluates interventions not only by reach and adoption but also by effectiveness, implementation fidelity and long-term maintenance (Glasgow et al., 1999). Applied to agriculture, this logic implies tracking indicators such as water use, cultivation cost, labour requirement, input use and productivity before and after use, and distinguishing an Actual Benefit at farm level from a broader Impact.
3.6Research gap
Existing research examines individual stages of the digital-agriculture lifecycle, including introduction, adoption determinants, barriers, continuance, dis-adoption and expected benefits, largely in isolation. There is limited work that integrates these stages into a single, outcome-oriented monitoring approach that follows a technology from introduction to measurable impact, records abandonment with its causes, links those causes to corrective action and re-tracks the farmer afterwards. There is also little guidance on how such monitoring could be embedded in Indian extension institutions and digital public infrastructure. The ALCM is designed to address this gap by distinguishing adoption from actual and continued use, treating abandonment as diagnostic information, supporting corrective action and re-tracking, and connecting technology use to measurable agricultural outcomes.
4Methodology and the ALCM framework
4.1Research approach
The chapter follows a design-oriented, conceptual framework-development approach. Literature on digital agriculture, technology adoption, continued use, dis-adoption, implementation barriers and agricultural outcomes was reviewed to identify the stages through which an agricultural technology passes after it is introduced. These stages were then organised into a lifecycle model, each stage was linked to the data that would need to be recorded and to a quantitative indicator, and an operational platform design was specified. The framework is illustrated with a hypothetical scenario (Section 5) and an evaluation protocol for future pilot validation is proposed (Section 4.8). No primary field data are reported; all numerical values are illustrative.
4.2The ALCM lifecycle
The ALCM comprises a main lifecycle pathway with six stages and a recovery pathway that is activated when a farmer stops using a technology (Figure 1). The main pathway records progression from Technology Introduction to Adoption, Usage, Continued Usage, Actual Benefit and Impact. The recovery pathway records Abandonment, Reason Identification, Problem Analysis, Corrective Action and Re-tracking. If use resumes after corrective action, the farmer re-enters the Continued Usage stage; if not, the case is analysed again. The ALCM therefore operates as a continuous feedback loop rather than as a one-time survey.
4.3Stage-wise data and indicators
Stage 1: Technology Introduction. The platform records the type of technology, its provider, the date and location of introduction, the target group of farmers, its purpose, the infrastructure and training it requires, and the agricultural benefits it is expected to deliver. Examples include a smart-irrigation controller, a soil-moisture sensor network, a weather or pest-advisory service, a drone-spraying service or a digital marketplace.
Stage 2: Adoption. The platform records the number of farmers contacted and the number who adopt, the date of adoption and basic farm and farmer characteristics relevant to the technology (for example, crop, irrigation source and holding size). Where I is the number of farmers to whom the technology is introduced and A the number who adopt it, the adoption rate is:
If 100 farmers are introduced to a technology and 80 adopt it, AR = 80 per cent. An adoption rate of 80 per cent does not mean that 80 per cent of farmers have benefited; it marks only the start of the lifecycle.
Stage 3: Usage. Adoption means that a farmer has accepted a technology; usage means that the farmer actually operates it. The platform records whether the technology is in use, how frequently and for which activities, technical problems encountered, and training or support received.
Stage 4: Continued Usage. Farmers are followed up at defined intervals, typically 1, 3, 6 and 12 months after adoption, with intervals adapted to the cropping calendar and the technology. Where U(t) is the number of adopters still using the technology at time t:
Stage 5: Actual Benefit. Continued use does not by itself indicate success. For farmers still using the technology at the end of the monitoring period T, the platform compares baseline and follow-up values of technology-specific indicators such as water use, cultivation cost, labour and time required, fertiliser and pesticide use, and output. Where B is the number of continuing users who show a measurable improvement against a pre-defined threshold:
Stage 6: Impact. Impact refers to broader, more durable outcomes such as changes in productivity, net farm income, resource-use efficiency or sustainability indicators over at least one full cropping cycle. Because these outcomes are influenced by rainfall, crop choice, prices and management, impact claims should be made against a baseline and, where feasible, a comparison group of similar non-users (Section 4.5).
Table 1 summarises the data recorded and the indicator associated with each stage.
| Stage | Key data recorded | Indicator | Primary data source |
|---|---|---|---|
| Technology Introduction | Technology type, provider, date, location, target farmers, requirements, expected benefits | Farmers reached (I) | Provider / implementing agency |
| Adoption | Farmers contacted and adopting, date, farm and farmer profile | Adoption Rate (AR) | Field officer, registration |
| Usage | In use (yes/no), frequency, activities, problems, support received | Active users | Farmer interface, device logs |
| Continued Usage | Status at 1, 3, 6 and 12 months | Continuation Rate CR(t), Abandonment Rate ABR(t) | Periodic follow-up |
| Recovery pathway | Reason for stopping, action taken, date, re-tracking result | Recovery Rate (RR) | Farmer interface, field officer |
| Actual Benefit | Baseline and follow-up values of water, cost, labour, inputs, output | Benefit Realisation Rate (BRR) | Farm records, sensors, surveys |
| Impact | Productivity, income, resource efficiency, sustainability over a crop cycle | MDTC | Impact assessment, comparison group |
4.4The recovery pathway
When a farmer stops using a technology, the ALCM activates a recovery pathway rather than simply recording a lost adopter.
Abandonment identification. The platform flags any adopter who reports non-use, or whose device or application shows no activity over a defined period. In the illustrative scenario, 80 farmers adopt, 55 are still using the technology at six months, and 25 are flagged as having abandoned it.
Reason identification. Through a short multilingual menu, farmers select the main reason for stopping, for example a technical problem or device failure, high cost, poor connectivity, lack of training or support, difficulty understanding the information, missing complementary facilities, poor fit with local conditions, or expected benefits not received. An open voice or text option captures reasons not listed.
Problem analysis. Reasons are aggregated by technology, village, provider and farmer group so that recurring, systemic problems can be separated from isolated ones. For the 25 farmers in the illustration, reasons might be distributed as: technical problems or device failure (9), high operating or maintenance cost (6), lack of training (5), connectivity problems (3), and poor fit or benefits not received (2).
Corrective action. Each problem category is linked to a corrective action and to the institution best placed to deliver it (Table 2). The platform records what action was taken, by whom and when.
| Reason for abandonment | Corrective action | Responsible actor |
|---|---|---|
| Technical problem / device failure | Repair, replacement under warranty, local technician support | Technology provider; FPO-level service point |
| High operating or maintenance cost | Shared ownership, service model, custom hiring, scheme convergence | FPO; Custom Hiring Centre; State agriculture department |
| Lack of training or understanding | Local-language demonstrations, video and peer training | Krishi Vigyan Kendra; ATMA; Krishi Sakhi |
| Poor connectivity | Offline-first mode, SMS / IVR alerts, delayed synchronisation | Technology provider; Common Service Centre |
| Poor fit with local conditions | Local calibration, crop- and soil-specific settings, design feedback | Technology provider; State Agricultural University |
| Expected benefit not received | Agronomic review of use, complementary inputs, revised advisory | KVK subject-matter specialist; field officer |
Re-tracking. After the corrective action, the farmer is monitored again. If use resumes, the farmer returns to the Continued Usage stage; otherwise the remaining barrier is recorded and analysed further. Where D is the number of abandoning farmers who received a corrective action and R the number who resumed use:
The recovery rate makes the effectiveness of extension and support services visible, an aspect of digital agriculture programmes that is rarely measured.
4.5Benefit and impact assessment
The ALCM separates three levels of outcome: Technology Usage, Actual Benefit and Agricultural Impact. For a smart-irrigation system the chain might read: the system is used; water applied per irrigation cycle falls; irrigation and energy costs fall; and resource-use efficiency improves over the season. To strengthen the credibility of such claims, the framework recommends three safeguards. First, baseline values should be recorded at the Adoption stage, before use begins. Second, benefit should be judged against a pre-defined, technology-specific threshold (for example, at least a 15 per cent reduction in water applied for a comparable activity) agreed with agronomists. Third, wherever possible, outcomes should be compared with a group of similar farmers who do not use the technology, so that changes caused by rainfall, prices or other programmes are not wrongly attributed to it.
4.6Platform architecture
The ALCM is designed as a two-tier digital platform. The farmer interface is deliberately simple. It operates in Marathi, Hindi and English (with further Indian languages possible), uses short yes/no and picture-based questions, and supports voice input and offline use for farmers with limited literacy or connectivity. Its core functions are reporting technology status, reporting problems, selecting a reason for stopping, reporting perceived and measured benefits, and receiving follow-up reminders. A typical interaction asks, "Are you currently using this technology?" and, if the answer is no, "Why did you stop using it?".
The stakeholder dashboard serves field officers, Krishi Vigyan Kendras, Agricultural Technology Management Agencies (ATMA), FPOs, NGOs, technology providers, researchers and policymakers. It displays adoption, current and continued usage, abandonment and its reasons, corrective actions and their status, recovery rates, benefit and impact indicators, and MDTC, filtered by technology, district, provider, crop, holding size and gender. Where farmers give consent, records can be linked to the AgriStack Farmer ID to avoid duplicate registration and to connect lifecycle data with crop-sown and land records. Data may enter the platform from four sources: farmer self-reports, field-officer visits, device or application usage logs, and provider service records.
4.7Meaningful digital transformation conversion (MDTC)
To summarise how much adoption turns into measurable outcome, the chapter proposes the Meaningful Digital Transformation Conversion ratio. Where M is the number of adopters who reach the defined measurable-impact stage:
MDTC uses adopters rather than all farmers introduced to a technology as its denominator because its purpose is to measure how effectively adoption is converted into impact; the adoption rate already captures conversion from introduction to adoption. MDTC is proposed as an analytical concept for this framework, not as an established standard indicator. The definition of "measurable impact" must be fixed in advance for each technology and context, and the ratio should be interpreted alongside the other stage indicators rather than in isolation.
4.8Evaluation protocol
The ALCM is intended to be validated through a pilot involving one technology and a defined group of farmers over at least one full cropping cycle. The evaluation would assess seven criteria: usability (can farmers with different literacy and digital skills use the interface?); completeness (are all lifecycle stages recorded?); tracking (is use captured reliably over time?); problem identification (are recurring barriers detected?); corrective action (are actions and follow-ups recorded and effective?); outcome measurement (can benefits be measured against baselines?); and accessibility (does the platform work across languages and connectivity conditions?). Pilot findings would be used to refine monitoring intervals, indicators, benefit thresholds and the MDTC definition.
5Illustrative application: Smart irrigation in a smallholder cluster
To show how the ALCM works in practice, consider a hypothetical scenario in which a sensor-based smart-irrigation controller is introduced to 100 smallholder vegetable farmers in a Maharashtra village cluster through an FPO. All figures are illustrative.
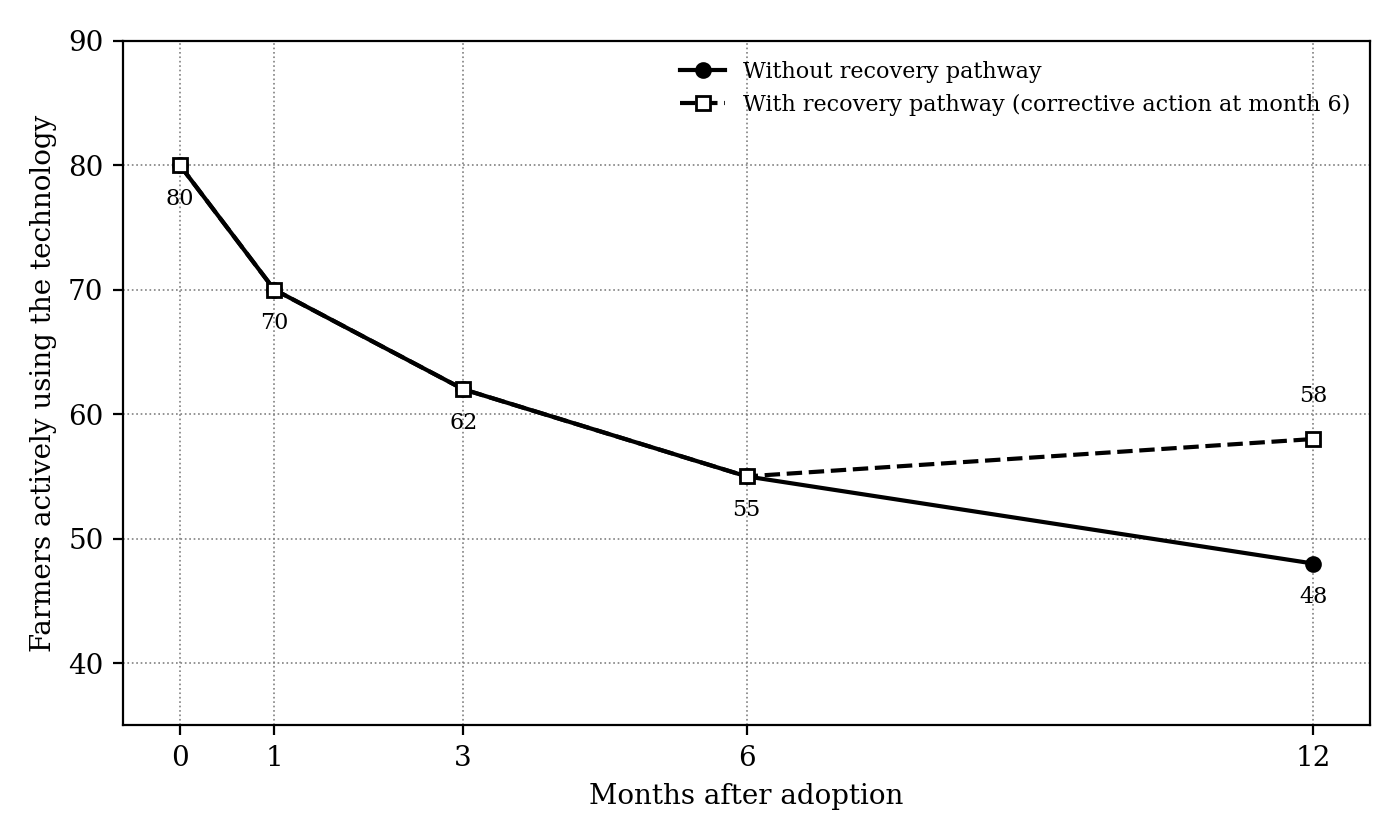
From adoption to continued use. Eighty farmers adopt the controller (AR = 80 per cent). Follow-up shows 70 active users after one month, 62 after three months and 55 after six months, giving CR(6) = 68.75 per cent and ABR(6) = 31.25 per cent. Without any intervention, the number of active users is projected to fall further to 48 at twelve months, a continuation rate of 60 per cent. An adoption-only report would continue to describe all 80 farmers as adopters.
Recovery pathway. At six months the 25 farmers who have stopped are asked why. Technical problems and device failure (9) and cost (6) dominate, followed by lack of training (5), connectivity (3) and poor fit or benefits not received (2). The FPO arranges sensor replacement through the provider's warranty, the KVK runs a Marathi-language field demonstration on interpreting moisture readings, and the provider enables an SMS fallback for areas with weak data coverage. Re-tracking shows that 10 of the 25 farmers resume use (RR = 40 per cent). With this recovery, active users at twelve months stand at 58 instead of the projected 48 (Figure 2).
From use to benefit and impact. Among the 58 farmers using the controller at twelve months, baseline and follow-up records show that 40 meet the pre-defined benefit threshold, for example a reduction in water applied per irrigation cycle from about 1,000 litres to 700 litres for a comparable plot and crop stage (BRR ≈ 69 per cent). Over the full cropping cycle, and after comparison with similar non-user farmers, 25 farmers show a measurable improvement in water productivity and irrigation cost. The resulting MDTC is (25 / 80) × 100 = 31.25 per cent.
The illustration highlights three points. First, an adoption rate of 80 per cent and an MDTC of about 31 per cent describe very different realities; programme managers who see only the former will overestimate success. Second, abandonment that is diagnosed and acted upon is partly recoverable, and the recovery rate gives extension services a measurable role. Third, the gap between continued use (58) and realised impact (25) points to agronomic or complementary-input constraints that hardware support alone cannot resolve.
6Policy lessons and implementation pathways for scalable digital agriculture
The ALCM is not only a research tool. Its logic suggests several lessons for how digital agriculture programmes in India might be designed, financed and scaled. Table 3 summarises these lessons with corresponding implementation pathways.
Measure continuation and outcome, not just enrolment. Programme dashboards and scheme reviews could report six- and twelve-month continuation rates and outcome indicators alongside enrolment. Release of later funding tranches could be linked partly to continuation and benefit realisation, creating incentives for implementers to support farmers after the initial sale or registration.
Build on digital public infrastructure. AgriStack provides a natural backbone for lifecycle monitoring. With farmer consent, a common Farmer ID allows the adoption, use and outcome of different technologies to be tracked without repeated registration, and allows lifecycle indicators to be combined with crop-sown and geospatial data from the Krishi Decision Support System.
Give extension a defined role in recovery. India's extension network, including more than 700 Krishi Vigyan Kendras, ATMA and community resource persons such as Krishi Sakhis, is well placed to act on abandonment data. Assigning these institutions explicit responsibility for corrective action and re-tracking turns extension from a one-time awareness function into a continuing support service.
Make providers accountable for the whole lifecycle. Public procurement and partnership agreements with technology providers could include service-level commitments on repair turnaround, local-language support and minimum continuation rates, together with an obligation to share anonymised lifecycle data.
Design for inclusion and disaggregate the evidence. Lifecycle indicators should be reported by gender, holding size, social group and region so that differences in continued use and benefit become visible. Voice, IVR and offline options are necessary to include farmers with limited literacy, smartphones or connectivity.
Protect farmer data. Lifecycle records combine farmer identity, farm practices and economic outcomes. Collection should be consent-based, limited to stated purposes and aligned with the Digital Personal Data Protection Act, 2023, and farmers should be able to see and control their own records.
Scale in phases. Lifecycle monitoring can begin with a single technology in one district through an FPO or KVK, then expand to clusters and states once indicators, intervals and workflows have been validated.
| Policy lesson | Implementation pathway | Key actors |
|---|---|---|
| Measure continuation and outcome, not enrolment | Report CR(6), CR(12), BRR and MDTC in scheme dashboards; link later tranches partly to them | MoA&FW; State agriculture departments |
| Build on digital public infrastructure | Consent-based linkage to AgriStack Farmer ID; integration with Krishi DSS | MoA&FW; State IT and agriculture departments |
| Give extension a role in recovery | Assign corrective action and re-tracking to KVK, ATMA and Krishi Sakhis | ICAR / KVKs; ATMA; State Rural Livelihood Missions |
| Make providers accountable | Service-level and continuation clauses in procurement; data-sharing obligations | Implementing agencies; agri-tech providers |
| Design for inclusion | Disaggregated indicators; voice, IVR and offline access | All implementers; FPOs; NGOs |
| Protect farmer data | Consent, purpose limitation and farmer access aligned with the DPDP Act, 2023 | Platform operators; MoA&FW |
| Scale in phases | District pilot, then cluster and state roll-out after validation | FPOs; KVKs; State departments |
7Discussion
The ALCM builds on, rather than replaces, established adoption theory. Rogers (2003) already describes an innovation-decision process that ends not with adoption but with a confirmation stage in which users may continue or discontinue, and the expectation–confirmation model explains continued use through the match between expectations and experience (Bhattacherjee, 2001). What these theories describe at the level of the individual, the ALCM turns into an operational monitoring routine: it records the confirmation stage, asks why discontinuance happened and connects that answer to an action. In doing so it moves the analysis from explaining adoption decisions towards managing technology performance in the field.
A second implication concerns how abandonment is interpreted. In conventional reporting a farmer who stops using a technology is simply a lost adopter, and the loss is often attributed to the farmer's reluctance or limited capacity. The ALCM treats abandonment as information about the technology, the support system and the context. When many farmers stop for the same reason, the pattern points to a systemic problem, such as an unreliable sensor model, an unaffordable service charge or a missing local repair network, that can be fixed. This farmer-centred reading is consistent with the argument that the social and institutional dimensions of digital agriculture deserve as much attention as the technology itself (Klerkx et al., 2019).
Third, the framework has different uses for different stakeholders. For farmers, it offers a simple channel through which problems are heard and acted upon. For FPOs and extension agencies, it provides a work list of farmers who need support and a way to show the results of that support through the recovery rate. For technology providers, aggregated reasons for abandonment are direct design feedback, and continuation data offer stronger evidence of value than sales figures. For researchers, longitudinal lifecycle records provide data on post-adoption dynamics that cross-sectional adoption surveys cannot supply. For policymakers, the stage indicators allow programmes to be compared on outcome rather than on reach.
Finally, the ALCM is intentionally technology-neutral. The same lifecycle and indicators can be applied to a soil-testing recommendation, a pest-advisory application, a drone-spraying service or an online marketplace, with only the benefit and impact indicators changing. This makes it possible to compare the performance of quite different technologies within a common monitoring structure, while recognising that the definition of benefit must always be adapted to the technology and to local agro-climatic conditions.
8Limitations
The ALCM is presented as a conceptual and design-oriented framework, and the numerical scenario in Section 5 is hypothetical. Its practical value has yet to be established through field validation. Several limitations should be noted. Self-reported use and benefits may be biased, and repeated follow-up can tire respondents; device logs and field verification can only partly offset this. Attributing outcomes to a single technology is difficult where multiple technologies, programmes and weather shocks interact, which is why baselines and comparison groups are recommended. The benefit thresholds and the definition of "measurable impact" used in MDTC involve judgement and will differ by technology and agro-climatic zone. Finally, sustaining periodic follow-up requires staff time and funding that implementing agencies may not routinely have.
9Conclusion and future work
Digital transformation in agriculture involves far more than introducing or adopting digital technologies. Farmers may adopt a technology and later abandon it, face technical or economic barriers, or continue using it without measurable benefit. Adoption alone therefore cannot represent successful transformation. This chapter has proposed the Agri-Tech Lifecycle Monitor (ALCM), which follows a technology from Introduction to Adoption, Usage, Continued Usage, Actual Benefit and Impact, and which turns abandonment into a diagnostic recovery pathway through Reason Identification, Problem Analysis, Corrective Action and Re-tracking. The framework defines stage-wise indicators, including the continuation, abandonment, recovery and benefit-realisation rates and the proposed MDTC ratio, and specifies a multilingual farmer interface and a stakeholder dashboard suited to Indian institutions.
The main contribution of the ALCM is to shift the question from "How many farmers adopted the technology?" to "What happened after adoption, and did the technology produce measurable agricultural impact?". For India's journey towards Viksit Bharat@2047, this shift matters: programmes that measure continued use and realised benefit can direct resources to technologies and support services that actually work for smallholders, and can scale them with greater confidence.
Future work can extend the framework in four directions. First, pilot implementation across different crops, regions and technologies over successive cropping cycles is needed to validate the indicators, monitoring intervals and MDTC. Second, data from IoT sensors, weather stations, remote sensing and device logs can be integrated to reduce manual reporting. Third, machine-learning models trained on lifecycle data could predict which farmers are at risk of abandonment, enabling earlier corrective action. Fourth, lifecycle data could support comparative benchmarking of technologies by continuation, cost, resource use and outcomes under specific crop and agro-climatic conditions, helping farmers, FPOs and policymakers choose technologies on evidence rather than promise. Throughout, robust access control, encryption and consent mechanisms will be needed to ensure that farmers retain ownership of their data.
References
- [1]Abbasi R, Martinez P, Ahmad R (2022). The digitization of agricultural industry – a systematic literature review on agriculture 4.0. Smart Agricultural Technology, 2, 100042. https://doi.org/10.1016/j.atech.2022.100042
- [2]Aker JC (2011). Dial "A" for agriculture: A review of information and communication technologies for agricultural extension in developing countries. Agricultural Economics, 42(6), 631–647.
- [3]Bhattacherjee A (2001). Understanding information systems continuance: An expectation–confirmation model. MIS Quarterly, 25(3), 351–370.
- [4]Cole SA, Fernando AN (2021). 'Mobile'izing agricultural advice: Technology adoption, diffusion and sustainability. The Economic Journal, 131(633), 192–219.
- [5]Davis FD (1989). Perceived usefulness, perceived ease of use, and user acceptance of information technology. MIS Quarterly, 13(3), 319–340.
- [6]Department of Agriculture and Farmers Welfare (2019). Agriculture Census 2015–16 (Phase I): All India report on number and area of operational holdings. Ministry of Agriculture and Farmers Welfare, Government of India.
- [7]Dibbern T, Romani LAS, Massruhá SMFS (2024). Main drivers and barriers to the adoption of digital agriculture technologies. Smart Agricultural Technology, 8, 100459. https://doi.org/10.1016/j.atech.2024.100459
- [8]Fabregas R, Kremer M, Schilbach F (2019). Realizing the potential of digital development: The case of agricultural advice. Science, 366(6471), eaay3038.
- [9]FAO (2022). The State of Food and Agriculture 2022: Leveraging automation in agriculture for transforming agrifood systems. Food and Agriculture Organization of the United Nations.
- [10]Glasgow RE, Vogt TM, Boles SM (1999). Evaluating the public health impact of health promotion interventions: The RE-AIM framework. American Journal of Public Health, 89(9), 1322–1327.
- [11]Government of India (2023). The Digital Personal Data Protection Act, 2023 (Act No. 22 of 2023). Ministry of Law and Justice.
- [12]Kernecker M, Knierim A, Wurbs A, Kraus T, Borges F (2020). Experience versus expectation: Farmers' perceptions of smart farming technologies for cropping systems across Europe. Precision Agriculture, 21(1), 34–50.
- [13]Khanna M, Atallah SS, Kar S, Sharma B, Wu L, Yu C, et al. (2022). Digital transformation for a sustainable agriculture in the United States: Opportunities and challenges. Agricultural Economics, 53(6), 924–937.
- [14]Klerkx L, Jakku E, Labarthe P (2019). A review of social science on digital agriculture, smart farming and agriculture 4.0: New contributions and a future research agenda. NJAS – Wageningen Journal of Life Sciences, 90–91, 100315.
- [15]Mittal S, Mehar M (2016). Socio-economic factors affecting adoption of modern information and communication technology by farmers in India: Analysis using multivariate probit model. The Journal of Agricultural Education and Extension, 22(2), 199–212.
- [16]Moser CM, Barrett CB (2006). The complex dynamics of smallholder technology adoption: The case of SRI in Madagascar. Agricultural Economics, 35(3), 373–388.
- [17]Rogers EM (2003). Diffusion of innovations. 5th ed. Free Press.
- [18]Rose DC, Sutherland WJ, Parker C, Lobley M, Winter M, Morris C, et al. (2016). Decision support tools for agriculture: Towards effective design and delivery. Agricultural Systems, 149, 165–174.
- [19]Shang L, Heckelei T, Gerullis MK, Börner J, Rasch S (2021). Adoption and diffusion of digital farming technologies – integrating farm-level evidence and system interaction. Agricultural Systems, 190, 103074. https://doi.org/10.1016/j.agsy.2021.103074
- [20]Silveira, F. da, Lermen, F. H., & Amaral, F. G. (2021). An overview of agriculture 4.0 development: Systematic review of descriptions, technologies, barriers, advantages, and disadvantages. Computers and Electronics in Agriculture, 189, 106405. https://doi.org/10.1016/j.compag.2021.106405
- [21]Wolfert S, Ge L, Verdouw C, Bogaardt MJ (2017). Big data in smart farming – A review. Agricultural Systems, 153, 69–80.