Power BI
Digital Project Controls Using Primavera P6, EcoSys, and Power BI in Large-Scale EPC Projects
Published October 2026
Abstract
Large engineering, procurement, and construction projects depend on consistent information about scope, dates, expenditure, progress, and emerging changes. Nevertheless, the systems supporting these functions frequently operate with different reporting periods, coding structures, and approval rules. This structured narrative review examines how Primavera P6, EcoSys, and Power BI can be configured as complementary components of an integrated project controls environment. Peer-reviewed construction and project management literature is interpreted alongside official software documentation. The analysis distinguishes schedule calculation, commercial control, and management reporting, and develops a framework connecting these functions through controlled identifiers, period snapshots, reconciliation, and accountable decisions. The principal finding is conceptual: technical connectivity can improve access to information, but reliable control also requires compatible measurement rules and explicit ownership of each data domain. A proposed integration architecture, a measurement matrix, and a transparent arithmetic illustration demonstrate how reporting errors can arise even when individual source records are correct. The paper identifies implementation priorities for large EPC organizations and discusses their relevance to Saudi industrial programs. It concludes that integration should be assessed through traceability, reconciliation quality, forecasting discipline, and the closure of management actions. No project-level performance improvement is estimated because an implementation dataset was not available.
Keywords: digital project controls; Primavera P6; EcoSys; Power BI; EPC projects; earned value management; data governance; Saudi Arabia
1Introduction
Engineering, procurement, and construction activities create interdependent commitments whose consequences extend across several reporting systems. An engineering deliverable can release a purchase order; equipment availability can determine installation sequencing; and incomplete installation can delay testing and turnover. These relationships are difficult to interpret when schedules, commercial records, and progress reports use incompatible structures. The practical problem is therefore broader than producing a consolidated report. Management needs to know whether reported information describes the same scope, reporting period, and approved basis.
Construction digitalization research describes technological change as an organizational process involving capabilities, collaboration, and established operating arrangements [1, 2]. Research on digital delivery similarly examines how digital information reshapes project delivery relationships and workflows [3]. These studies support a distinction between computerizing existing reports and redesigning the controls process. Replacing a spreadsheet with a dashboard may improve presentation while preserving the same unresolved inconsistencies in progress recognition or cost allocation.
Primavera P6, EcoSys, and Power BI offer a useful setting for examining this distinction. Their proposed roles in this paper are, respectively, schedule calculation, governed cost and forecast management, and analytical presentation. This allocation is an architectural choice rather than a claim that each product is restricted to one function. The central research problem is how to establish trustworthy interfaces between them without creating competing versions of baseline, progress, or forecast information.
The contribution is a practical synthesis of integration requirements that are often considered separately. It connects technical data exchange with the measurement and governance decisions necessary for dependable EPC reporting. Its intended application is large industrial delivery, including Saudi programs with multiple contractors and dispersed work packages. The paper does not evaluate a particular employer, commercial deployment, or completed project. It develops propositions and implementation controls that can subsequently be tested against operational evidence.
2Background and literature review
Digital construction literature provides a foundation for integrated controls but does not establish that a particular software combination improves project outcomes. Studies of digital twin construction formulate information workflows that connect project intent, observed conditions, and management response [4]. Related studies examine semantic requirements for construction digital twins [5]. Their relevance here lies in the importance of consistent meaning: a technically accessible record remains difficult to use if its relationship to physical scope is ambiguous. The architecture proposed below adopts this semantic concern without claiming to constitute a digital twin.
Research reviews examine artificial intelligence applications in construction engineering and management [6]. Their work indicates the range of analytical possibilities, while also motivating care over the evidence supporting prediction. BIM adoption studies investigate the connection between organizational adoption and broader digital transformation initiatives [7]. Together, these sources suggest that analytical sophistication should follow the establishment of understandable processes and credible information. A prediction generated from inconsistent historical snapshots can be precise in appearance yet misleading in application.
Earned value research offers a second foundation. Foundational forecasting studies compare duration forecasting methods and distinguish conventional earned value indicators from time-oriented alternatives [8]. Empirical forecasting studies evaluate deterministic forecasting approaches using project evidence [9]. These studies demonstrate why forecast selection and interpretation matter. A dashboard should not treat one performance index as a sufficient explanation of future completion. Schedule logic, remaining work, and the character of outstanding risks remain necessary for management interpretation.
Research on technology implementation also broadens the discussion beyond individual products. Technology implementation reviews organize implemented construction technologies by their functions, including acquisition, analytics, visualization, and communication [10]. Further studies review advanced informatic technologies for intelligent construction [11]. This functional perspective informs the present framework: the value of an integration should be judged by what information becomes usable for a defined decision. None of these studies is taken as comparative evidence for the P6–EcoSys–Power BI configuration itself.
Official documentation supplies the technical boundary conditions. Oracle describes integration interfaces for P6 EPPM [12]. Hexagon documents its P6 connector, integration methods, forecasting functions, and forecast-change procedures [13–16]. Oracle also distinguishes several progress and earned value fields [17]. Microsoft guidance addresses semantic modeling, refresh, access control, and model relationships [18–25]. These sources establish documented possibilities and constraints; they are not independent evidence of delivery improvements. The review therefore keeps product capability, architectural recommendation, and demonstrated project outcome analytically separate.
3Research aim, objectives and questions
The aim is to develop a defensible integration framework for digital project controls using Primavera P6, EcoSys, and Power BI in large EPC environments. Five objectives guide the analysis: to distinguish the responsibilities of scheduling, commercial control, and reporting systems; to identify common sources of inconsistency; to specify minimum integration and assurance requirements; to explain how integrated reporting can support management intervention; and to outline a feasible evaluation approach for future implementation research.
Three questions follow. RQ1 asks which data and governance conditions are necessary for reliable integration. RQ2 asks how a combined environment can support the interpretation of cost, schedule, progress, and change information. RQ3 asks how organizations should evaluate integration quality without confusing faster report preparation with improved delivery performance. These questions position the paper as a structured review and conceptual design study, rather than an empirical assessment of software effectiveness.
4Review methodology
A structured narrative review was undertaken through targeted public searches of scholarly publisher pages and official technical documentation. Search combinations included digital transformation and construction, digital information and project delivery, construction digital twins, earned value and duration forecasting, Primavera P6 integration, EcoSys forecasting, and Power BI project reporting. Searches were completed in October 2026. The process did not use a reproducible export from Scopus or Web of Science and is not presented as a systematic review of either database.
Academic material was retained when its publicly accessible abstract or text addressed information integration, organizational adoption, project control, or forecasting. Official documentation was included when it clarified an interface, data definition, approval behavior, or reporting constraint relevant to the proposed configuration. General promotional claims, untraceable performance percentages, and third-party implementation advertising were excluded from the evidential argument. Foundational publications were retained because some distinctions, particularly those concerning earned value and digital delivery, remain relevant to the research questions.
The synthesis used a source-to-question matrix. Each source was classified by evidence type, functional relevance, and transfer limitation. Peer-reviewed studies informed the conceptual interpretation; vendor documentation informed implementation feasibility. The quality appraisal considered publication provenance, the specificity of the described method or feature, and whether the source supported the claim attributed to it. Accessible abstracts supported only claims visible in those abstracts; detailed unobserved methods or results were not inferred from publication titles.
Five themes organized the analysis: system responsibility, semantic alignment, integration assurance, reporting interpretation, and managerial response. The proposed tables and figures are original analytical constructions. They do not reproduce a published framework or represent observed operational results. No screening counts, interview sample, project dataset, statistical test, or measured productivity benefit is reported. This approach offers a transparent technical synthesis, but its selective retrieval and lack of full-text access to every academic source limit coverage and critical depth.
5Thematic findings and analysis
5.1Assigning responsibility across systems
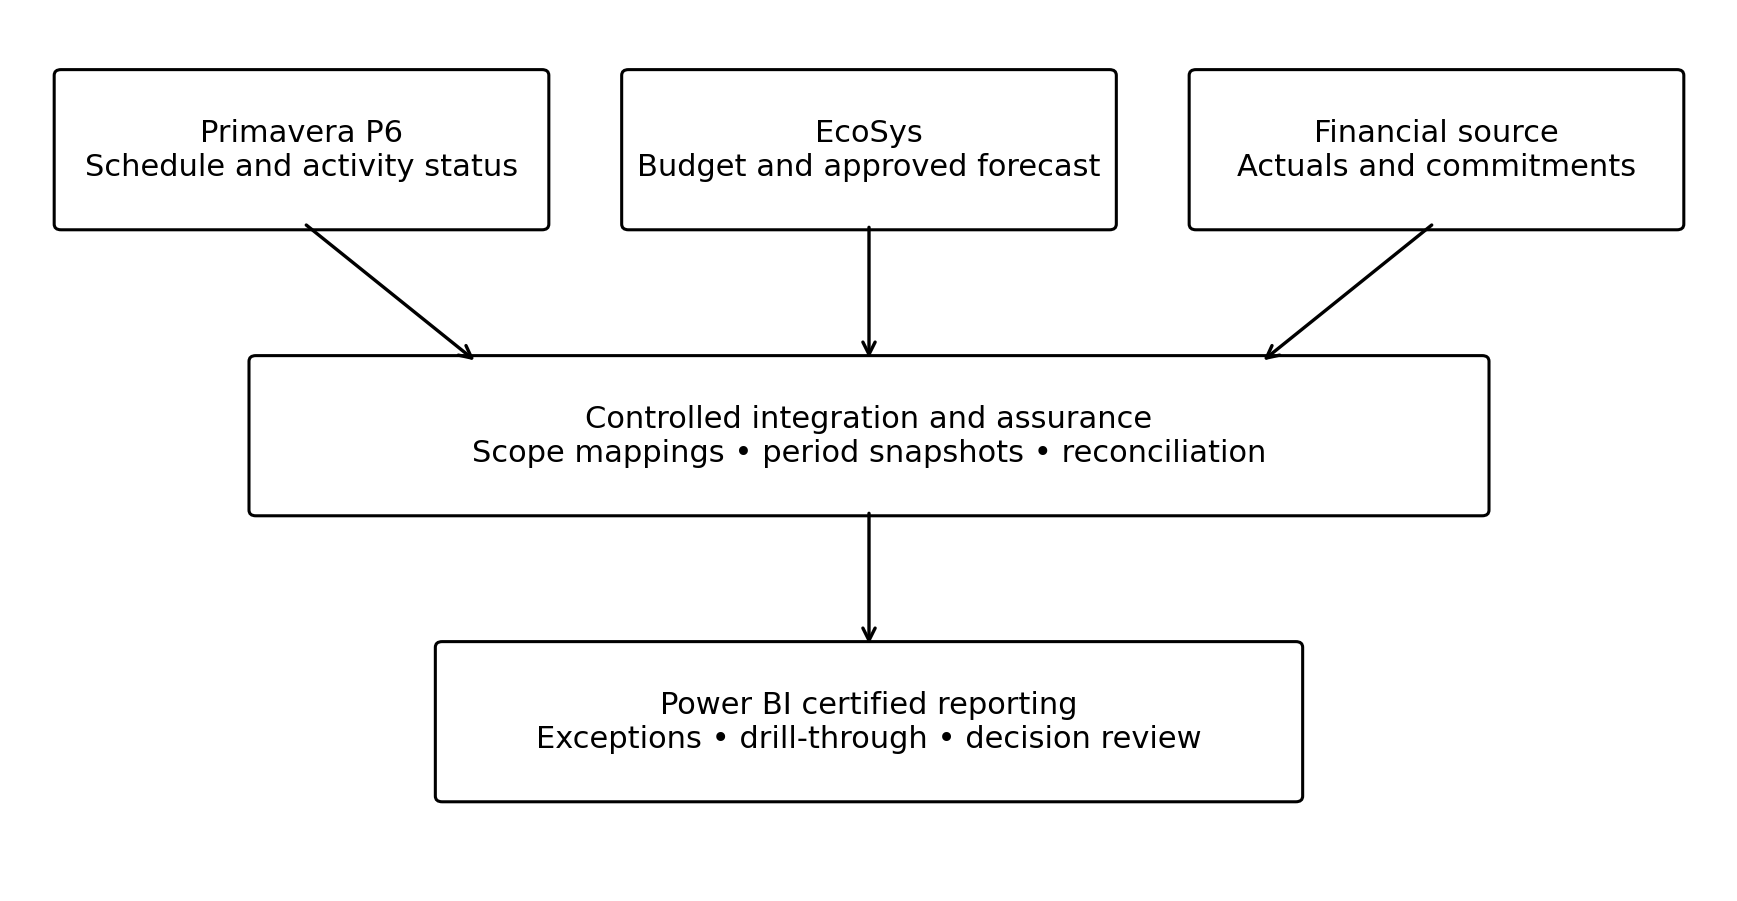
An integrated environment should begin with a register identifying which system is authoritative for each information domain. In the proposed configuration, P6 holds approved schedule logic, activity status, calendars, and calculated dates. EcoSys holds the controlled budget and forecast workflow, with accounting actuals reconciled to the enterprise financial source. Power BI presents certified measures and approved period information. This arrangement requires explicit configuration; it is not an automatic consequence of acquiring the products.
Oracle documents REST and web service integration options for P6 EPPM [12]. Hexagon describes a connector that supports defined exchanges with P6 and allows configuration for particular business requirements [13]. Its wider integration guidance also discusses interfaces with other systems [14]. These capabilities make the configuration technically plausible. However, supported connectivity does not decide whether one system may overwrite another system's forecast or whether a transferred value has received business approval.
A practical responsibility register should identify the originating owner, approving role, permitted destination, update frequency, and correction route for every important field. For instance, a reporting analyst may flag an invalid activity-to-account mapping, while the designated planning and cost owners approve its correction. Analytical convenience should not transfer responsibility for schedule logic to a visualization specialist. Figure 1 summarizes the proposed architecture and the assurance boundary between operational sources and published reporting.
5.2Aligning scope and measurement
Work breakdown structures and cost breakdown structures serve related but different purposes. A schedule may divide installation into activities by area and discipline, while the commercial system organizes expenditure by purchase order and contract line. Directly joining their labels can create incorrect associations. A mapping register should instead connect stable identifiers at an agreed control level and preserve exceptions for review. Descriptive names remain useful for reading but are unsuitable as the only integration key.
The mapping must also recognize differences in granularity. One cost account may support several activities, and an activity may consume several cost categories. A many-to-many mapping therefore requires an explicit allocation rule or a reporting level at which aggregation is valid. Microsoft explains the need to handle relationship cardinality carefully and discusses bridge-table approaches [22]. For project controls, the unresolved business question is who approves the allocation and how it changes when scope is reorganized.
Progress definitions are equally important. Oracle distinguishes activity, duration, units, physical, schedule, and performance percent complete [17]. These values answer different questions. Elapsed duration is not necessarily installed quantity, and expenditure is not proof of accepted work. A common progress dictionary should specify evidence, calculation, approval, and the treatment of partial completion for each work type. Engineering, procurement, fabrication, installation, and testing may require different recognition rules. Integration must preserve those distinctions rather than hide them behind one generic completion field.
5.3Establishing period and baseline consistency
A report can contain individually accurate values yet compare incompatible periods. The schedule might be updated to Friday, while financial actuals include later postings and procurement commitments reflect a different extraction date. Displaying them together does not create a coherent reporting position. An integration contract should distinguish the physical progress cut-off, accounting period, schedule data date, extraction timestamp, and approval timestamp. Any period mismatch should remain visible to readers.
Baseline management requires similar discipline. Original authorization, approved changes, current budget, current forecast, and working scenarios should be retained as separate states. Hexagon describes forecast generation and a process that compares working and current forecasts before a forecast change enters approval [15, 16]. The proposed controls architecture carries these status distinctions into reporting. A revised forecast should not silently replace the reference against which earlier performance was assessed.
Historical snapshots should preserve what management knew when a decision was taken. Otherwise, changes to activity coding or approved budgets can rewrite previous dashboard results. A snapshot identifier linked to reporting period and baseline version allows a reviewer to reconstruct a published report. Late adjustments should create a documented restatement or enter a subsequent period according to the agreed policy. This is especially important when a historical report later informs a contractual discussion or a review of forecast credibility.
5.4Designing the analytical data model
A reliable analytical model should declare the grain of each fact table before measures are designed. Suitable examples include one record per activity and snapshot, one per account and reporting period, and one per change line and revision. Shared dimensions can identify project, work package, contract, discipline, location, and period. Microsoft describes star-schema modeling and the importance of consistent fact-table granularity [18]. Here, these principles provide a way to avoid accidental duplication while allowing comparable scope to be examined across systems.
Schedule activities should not be joined directly to accounting transactions merely because they share a project code. If several records exist on both sides, the join can multiply values. Higher-level totals may conceal this error when filters suppress different subsets of the data. Microsoft guidance on many-to-many scenarios is relevant to this risk [22]. The proposed design instead aggregates at a controlled common level or uses approved allocation bridges, with automated reconciliation against source totals before publication.
Date relationships also need explicit treatment. A change can have submission, approval, and implementation dates, while a transaction has posting and service dates. These dates should not be treated as interchangeable simply because a report includes one calendar filter. Microsoft's guidance on active and inactive relationships helps frame the modeling choice [25]. Each published measure should document the date basis it uses, and readers should be able to distinguish when work occurred from when a commercial adjustment was approved.
5.5Governing refresh and access
Connecting a report to available sources is a distinct task from certifying the information presented. Microsoft documents a range of Power BI data sources [23], while gateway guidance addresses access to relevant on-premises environments [24]. Scheduled refresh and incremental refresh provide different mechanisms for maintaining semantic models [19, 20]. The practical configuration depends on deployment, source support, licensing, and administration. The architecture should therefore specify achievable reporting latency rather than advertise unrestricted real-time visibility.
A useful publication rule is that a complete accepted reporting set must pass validation before replacing the previous certified set. If one extraction fails, the report should identify stale data rather than show a partially updated position without explanation. Refresh completion, source timestamp, rejected records, and reconciliation status should be visible to the controls team. A successful technical refresh proves that a process ran; it does not establish that the resulting figures are commercially approved or correctly interpreted.
Access controls should follow contract boundaries and organizational responsibilities. Microsoft's row-level security guidance explains filtering behavior and its relationship to model design [21]. In an EPC setting, a subcontractor may need access only to assigned work packages, while portfolio management requires a broader view. Testing should examine permitted and prohibited combinations, including exported information and elevated workspace roles. Confidentiality requirements must be translated into a tested permission design rather than assumed from the presence of a sign-in screen.
5.6Interpreting performance and forecasts
Integrated reporting should make the calculation and meaning of each measure explicit. Planned value represents the authorized value of work scheduled; earned value represents the authorized value assigned to accomplished work; and actual cost represents the cost incurred for the relevant scope and period. Cost performance index is EV divided by AC, while schedule performance index is EV divided by PV. These ratios require aligned scope, consistent progress rules, and compatible accounting treatment before comparisons become meaningful.
Research on earned value forecasting demonstrates why interpretation should extend beyond a single ratio [8, 9]. In particular, a conventional schedule index expressed through budgeted value cannot by itself identify the remaining critical path or explain commissioning readiness. A favorable aggregate index can coexist with a delayed critical package. Dashboard interpretation should therefore combine summary indicators with logic-based milestone forecasts, open constraints, and analysis of the work that remains. Aggregation is useful for orientation but cannot replace diagnosis.
Forecasting should retain competing explanations. A mechanical estimate based on historical performance provides a reference, while a bottom-up estimate reflects remaining quantities, resources, commitments, and identified changes. Differences between them should trigger discussion rather than automatic substitution. A recovery plan may require additional expenditure; conversely, lower reported expenditure can reflect delayed procurement rather than efficiency. Table 1 identifies the controls needed to keep these interpretations connected to their evidence.
| Information domain | Required control | Acceptance evidence |
|---|---|---|
| Scope and coding | Approved activity-to-account mapping | No unexplained unmatched records |
| Progress | Work-type recognition rules | Approved quantities or milestones |
| Reporting period | Explicit cut-off and snapshot | Consistent approved reporting set |
| Cost and forecast | Separate actual, commitment, EAC and ETC | Reconciliation to authorized sources |
| Changes | Status and revision retained | Traceable approval and forecast impact |
| Analytics | Declared grain and relationship tests | Totals preserved across report filters |
| Management action | Owner, due date and closure basis | Decision log and follow-up evidence |
5.7Turning exceptions into management action
A dashboard contributes to control only when a reported exception enters an accountable response process. The proposed action cycle begins with verification of the data, proceeds to assessment of the underlying constraint, and ends with an approved intervention and subsequent review. Each action should have an owner, due date, decision rationale, and a clear basis for closure. This prevents a recurring red indicator from becoming a substitute for an actual decision.
Different exceptions require different responses. A negative cost variance may arise from productivity loss, incorrect allocation, delayed accrual, or approved scope growth. A late milestone may reflect an external dependency rather than poor performance within the affected package. The report should support examination of these possibilities through links to approved records. Its role is to reduce the time needed to assemble a defensible explanation, while preserving professional judgment about causation and responsibility.
The feedback process should also examine whether intervention changed the forecast assumptions. If procurement expediting is approved, the revised delivery date, additional cost, responsible party, and residual uncertainty should be reflected consistently. Otherwise, the same intervention may appear as an improved date in one report and an unrecognized cost exposure in another. This integration of decision records with updated assumptions is a proposed control principle, requiring project-level validation rather than being treated as an established software benefit.
6Discussion
The synthesis identifies semantic consistency as the central dependency of digital project controls. Technical interfaces can transmit records, but the organization must determine whether those records refer to equivalent scope and approved states. This distinction explains why an apparently integrated environment can still require extensive manual reconciliation. When coding, progress rules, and approval responsibility remain unresolved, automation can distribute disagreement more quickly rather than remove it.
A second implication concerns evidence. Official documentation confirms capabilities, whereas the academic literature offers broader theories and findings about digital delivery and forecasting. Neither evidence class establishes the effectiveness of the exact architecture proposed here. The contribution is therefore an explicit design argument: shared scope definitions, preserved reporting states, and reconciliation controls are expected to improve the trustworthiness of integrated information. Whether those improvements translate into earlier intervention or better delivery must be tested separately.
A simple arithmetic illustration makes the aggregation risk visible. Assume that one accepted account-period record contains actual cost of SAR 1 million. If this record is joined to four activity rows without a valid allocation, summing the joined cost column produces SAR 4 million. No source transaction has changed; duplication arises within the analytical transformation. Figure 2 compares correct preservation of the assumed account total with unallocated duplication as the number of matching activity rows increases.
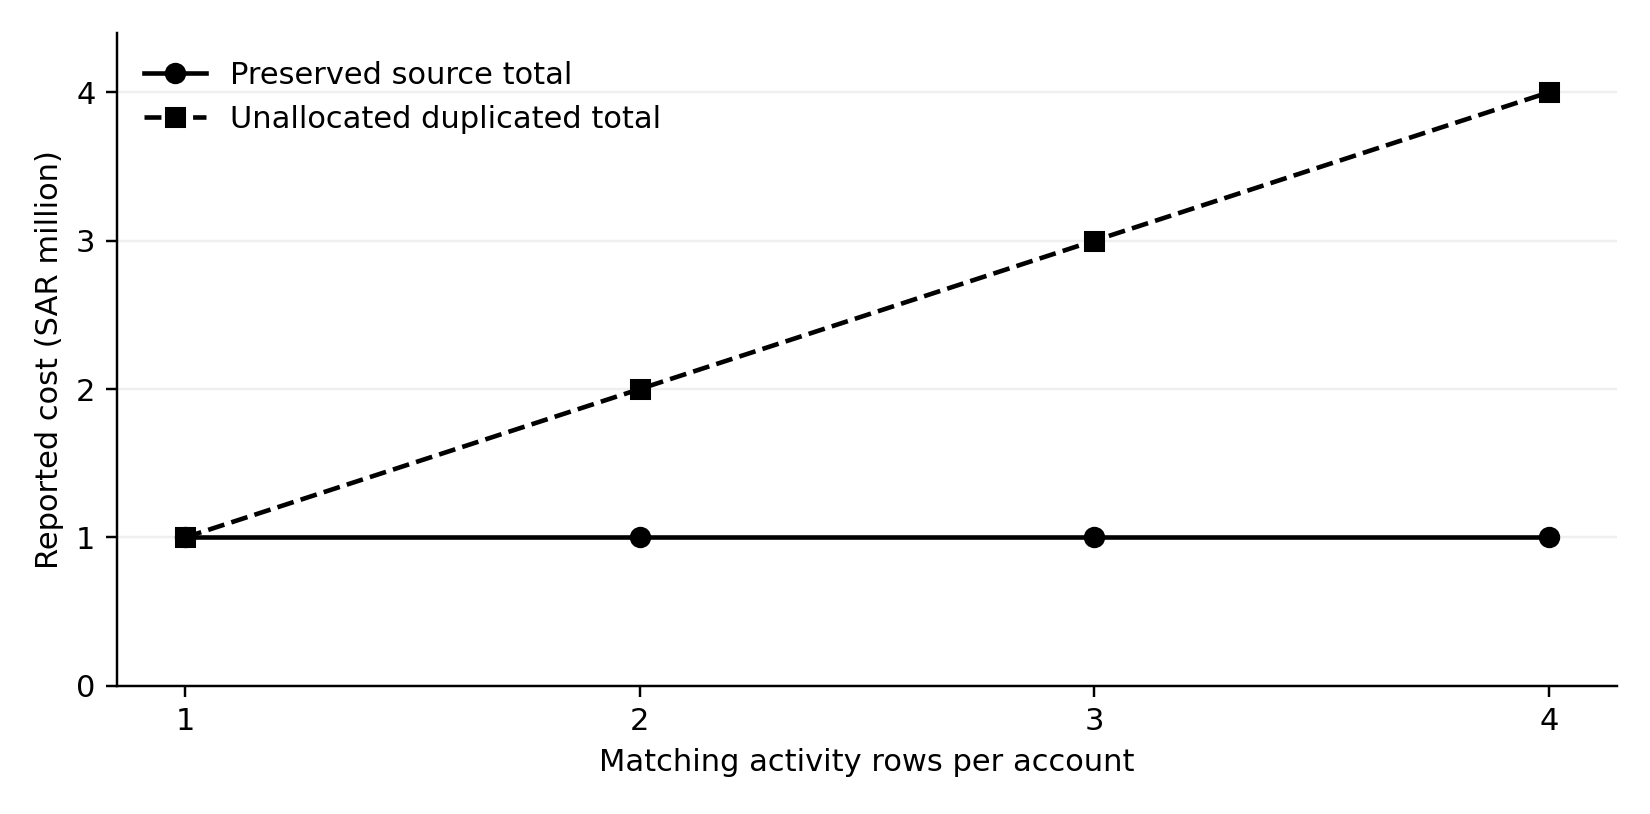
The illustration does not imply that either software product inherently creates this error. It isolates a modeling failure that can occur in a poorly designed integration. The appropriate response is to preserve the declared grain, apply an approved allocation when needed, and reconcile totals under multiple filter combinations. A report that matches the portfolio total but fails at contract or discipline level is not sufficiently validated for management use.
A third issue is implementation sequencing. Advanced predictive techniques are attractive, particularly given developments in construction analytics. However, an organization should first establish whether its historical snapshots consistently represent the information available at the time. Training on retrospectively corrected values can leak later knowledge into earlier forecast evaluation. Baseline integrity and chronological validation are therefore prerequisites for a credible predictive research program, not merely administrative preparation.
7Implications for Saudi industrial programs
Saudi industrial programs provide a relevant application setting because industrial facilities combine engineering deliverables, equipment supply, construction interfaces, and turnover dependencies. The proposed model can support coordinated reporting across these functions when organizations agree common control accounts and decision rules. Its relevance does not establish that Saudi projects universally use the same systems or encounter identical weaknesses. Implementation should begin with the actual contracting structure and information needs of the program.
Reporting arrangements should distinguish enterprise standards from package-specific requirements. Common definitions for period status, baseline authorization, and change approval enable aggregation, while detailed progress recognition can remain appropriate to the work type. Training should cover interpretation as well as software operation: planners, cost engineers, commercial personnel, and managers need to understand why a given measure may diverge from physical conditions. Without this shared understanding, a common dashboard may still support conflicting conclusions.
A phased implementation is preferable to immediate portfolio-wide automation. One representative package can establish whether identifiers, approval steps, and reconciliations function as intended before additional contracts are connected. Table 2 proposes a sequence with concrete acceptance evidence. The sequence is a design recommendation rather than a proven implementation standard. It should be adapted to source-system constraints, contractual reporting obligations, and the availability of accountable data owners.
| Phase | Principal task | Evidence required before expansion |
|---|---|---|
| Define | Assign owners and measurement rules | Approved responsibility and data dictionaries |
| Map | Align scope and reporting structures | Reviewed mapping and exception register |
| Pilot | Integrate a representative work package | Source totals and snapshot reconstruction |
| Validate | Test measures, permissions and failures | Accepted reconciliation and security checks |
| Operate | Certify reports and resolve exceptions | Published status and completed actions |
| Evaluate | Compare information and forecast quality | Chronological records with confounders noted |
Economic evaluation should include the continuing effort required to maintain interfaces and reporting rules. Costs can include configuration, licenses, historical cleansing, training, administration, assurance, and modifications after source-system upgrades. Benefits should be assessed against a documented starting position, using such measures as reconciliation effort, accepted reporting latency, forecast revision quality, and action closure. Reduced report preparation time should be reported as an operational result, separately from any subsequent claim about cost or schedule improvement.
8Challenges and future research
Several limitations affect the proposed framework. Contract-level data may remain commercially restricted, legacy identifiers may be incomplete, and reporting calendars may differ across organizations. A product upgrade can also alter interfaces or field behavior. Such conditions make integration an ongoing operating responsibility rather than a one-time technical installation. Governance arrangements should include periodic regression checks and a process for changing mappings without rewriting accepted history.
Future research should evaluate a documented implementation with preserved pre-integration and post-integration reporting periods. Outcomes could include unmatched-record frequency, reconciliation differences, time from period close to certified report, and the proportion of exceptions receiving a completed action. A stronger design would also track forecast error at fixed horizons and record changes in scope, delivery stage, contract strategy, and project complexity. These factors can influence performance independently of reporting technology.
Comparative research should examine whether tighter integration produces useful intervention at different organizational maturity levels. It should also investigate failure cases, including situations where dashboards increased confidence in unreliable data. Qualitative interviews could explore how teams negotiate disputed progress or forecast assumptions, while quantitative records establish whether disputes and corrections diminish over time. Such mixed evidence would provide a more defensible basis for performance claims than vendor demonstrations or retrospective testimonials.
This review itself has restricted coverage and does not provide a complete systematic evidence base. Its sources mix peer-reviewed research and official technical documentation because the research question spans organizational mechanisms and specific software capabilities. The resulting framework is suitable for analytical development and field testing. It should not be interpreted as proof of a universal implementation method or a quantified business case for any commercial platform.
9Conclusion
Primavera P6, EcoSys, and Power BI can be organized into complementary scheduling, commercial control, and reporting functions, subject to deployment-specific configuration. The main challenge is establishing consistent scope, reporting periods, progress definitions, and approved states across those functions. Official interfaces provide the means to exchange information, but accountable ownership and reconciliation determine whether the exchanged information can support a defensible decision.
The proposed framework connects these requirements through responsibility registers, controlled mappings, period snapshots, certified semantic models, and an action cycle that links exceptions to interventions. Its practical value lies in making the assumptions behind integration visible and testable. Future implementation studies should measure information quality and forecast behavior before attributing delivery improvement to the software environment. Reliable digital project controls ultimately require evidence that information is comparable, traceable, and acted upon.
References
- [1]Oesterreich TD, Teuteberg F. Understanding the implications of digitisation and automation in the context of Industry 4.0: A triangulation approach and elements of a research agenda for the construction industry. Computers in Industry. 2016;83:121–139. https://doi.org/10.1016/j.compind.2016.09.006
- [2]Olanipekun AO, Sutrisna M. Facilitating digital transformation in construction—A systematic review of the current state of the art. Frontiers in Built Environment. 2021;7:660758. https://doi.org/10.3389/fbuil.2021.660758
- [3]Whyte J. How digital information transforms project delivery models. Project Management Journal. 2019;50(2):177–194. https://doi.org/10.1177/8756972818823304
- [4]Sacks R, Brilakis I, Pikas E, Xie HS, Girolami M. Construction with digital twin information systems. Data-Centric Engineering. 2020;1:e14. https://doi.org/10.1017/dce.2020.16
- [5]Boje C, Guerriero A, Kubicki S, Rezgui Y. Towards a semantic construction digital twin: Directions for future research. Automation in Construction. 2020;114:103179. https://doi.org/10.1016/j.autcon.2020.103179
- [6]Pan Y, Zhang L. Roles of artificial intelligence in construction engineering and management: A critical review and future trends. Automation in Construction. 2021;122:103517. https://www.sciencedirect.com/science/article/abs/pii/S0926580520310979
- [7]Kassem M, Ahmed AL. Digital transformation through building information modelling: Spanning the macro-micro divide. Technological Forecasting and Social Change. 2022. https://doi.org/10.1016/j.techfore.2022.122006
- [8]Vandevoorde S, Vanhoucke M. A comparison of different project duration forecasting methods using earned value metrics. International Journal of Project Management. 2006;24(4):289–302. https://doi.org/10.1016/j.ijproman.2005.10.004
- [9]Batselier J, Vanhoucke M. Evaluation of deterministic state-of-the-art forecasting approaches for project duration based on earned value management. International Journal of Project Management. 2015. https://doi.org/10.1016/j.ijproman.2015.04.003
- [10]Chen X, Chang-Richards AY, Pelosi A, Jia Y, Shen X, Siddiqui MK, et al. Implementation of technologies in the construction industry: A systematic review. Engineering, Construction and Architectural Management. 2022;29(8):3181–3209. https://doi.org/10.1108/ECAM-02-2021-0172
- [11]Zhang L, Li Y, Pan Y, Ding L. Advanced informatic technologies for intelligent construction: A review. Engineering Applications of Artificial Intelligence. 2024:109104. https://www.sciencedirect.com/science/article/pii/S0952197624012624
- [12]Oracle. Oracle Primavera P6 EPPM version 26 documentation—Integration guides. https://docs.oracle.com/en/industries/construction-engineering/primavera-p6-project/26/integration.html
- [13]Hexagon. Integrating EcoSys with P6 Connector, version 2.0. 2025. https://docs.hexagonppm.com/r/en-US/Integrating-EcoSys-with-P6-Connector-2.0/Version-2.0/1236458
- [14]Hexagon. EcoSys integration methods, version 8.6. https://docs.hexagonppm.com/r/en-US/EcoSys-Integration-Methods/Version-8.6/871885
- [15]Hexagon. Forecasts. EcoSys Projects Help, version 4.11. https://docs.hexagonppm.com/r/en-US/EcoSys-Projects-Help-4.11/Version-4.11/1268705
- [16]Hexagon. Create forecast change. EcoSys Projects Help, version 3.02. https://docs.hexagonppm.com/r/en-US/EcoSys-Projects-Help-3.02/Version-3.02/1254120
- [17]Oracle. Available columns of the Activities page. Primavera P6 Help. https://docs.oracle.com/cd/F51301_01/p6help/en/47261.htm
- [18]Microsoft. Understand star schema and the importance for Power BI. Microsoft Learn. https://learn.microsoft.com/en-us/power-bi/guidance/star-schema
- [19]Microsoft. Configure scheduled refresh. Microsoft Learn. https://learn.microsoft.com/en-us/power-bi/connect-data/refresh-scheduled-refresh
- [20]Microsoft. Configure incremental refresh and real-time data for Power BI semantic models. Microsoft Learn. https://learn.microsoft.com/en-us/power-bi/connect-data/incremental-refresh-overview
- [21]Microsoft. Row-level security (RLS) guidance in Power BI Desktop. Microsoft Learn. https://learn.microsoft.com/en-us/power-bi/guidance/rls-guidance
- [22]Microsoft. Many-to-many relationship guidance. Microsoft Learn. https://learn.microsoft.com/en-us/power-bi/guidance/relationships-many-to-many
- [23]Microsoft. Data sources in Power BI Desktop. Microsoft Learn. https://learn.microsoft.com/en-us/power-bi/connect-data/desktop-data-sources
- [24]Microsoft. On-premises data gateways in Power BI. Microsoft Learn. https://learn.microsoft.com/en-us/power-bi/connect-data/service-gateway-onprem
- [25]Microsoft. Active vs inactive relationship guidance. Microsoft Learn. https://learn.microsoft.com/en-us/power-bi/guidance/relationships-active-inactive