Digital Financial Services
UPI Transaction Growth in India: A Quantitative Time-Series Analysis of April 2024–March 2025
1Pillai College of Arts, Commerce and Science (Autonomous), New Panvel, Maharashtra, India
2Department of Information Technology, Pillai College of Arts, Commerce and Science (Autonomous), New Panvel, Maharashtra, India
Published October 2026
Abstract
India’s Unified Payments Interface (UPI) is now a major channel for retail digital payments. This paper examines monthly UPI activity from April 2024 to March 2025 using administrative statistics published by the National Payments Corporation of India (NPCI). Over the period, transaction volume increased from 13,303.99 million to 18,301.51 million, a rise of 37.56%. Transaction value grew by 26.10%, while the number of banks live on UPI increased from 583 to 661. The calculated average ticket size fell from ₹1,476.60 to ₹1,353.56, suggesting that transaction counts grew faster than the total value transferred. Volume and value were strongly positively correlated (Pearson’s r = 0.976). The paper also compares fiscal-quarter totals and adjusts monthly figures for the number of calendar days. After this adjustment, average daily transaction volume increased by 33.13%, and the month-to-month volatility in volume growth was lower than in the unadjusted series. These findings describe changes in aggregate UPI activity during one financial year; they do not establish why the changes occurred. The short study period and national-level aggregation limit the conclusions that can be drawn.
Keywords: Unified Payments Interface (UPI); digital payments; transaction volume; transaction value; NPCI; time-series analysis
1Introduction
1.1Background
The Unified Payments Interface (UPI) is a real-time payment system developed by the National Payments Corporation of India (NPCI). It enables transfers between bank accounts through participating mobile applications and supports both person-to-person (P2P) and person-to-merchant (P2M) payments. Since its launch in 2016, UPI has become an important part of India’s retail payment infrastructure. One feature of the system is interoperability: customers using different participating applications can make payments without needing to use the same application as the recipient.
NPCI publishes monthly statistics on UPI activity, including the number of banks live on the platform, transaction volume and transaction value. Because these figures cover system-wide activity, they offer a consistent basis for describing national trends. However, aggregate totals do not identify individual users, merchants, transaction purposes or regional differences. This study uses the published monthly series to examine how UPI activity changed over the 2024–25 financial year.
1.2Rationale of the study
A record figure for one month does not, by itself, show how activity changed across a full year. Monthly totals can rise or fall, and part of that movement may reflect differences in the number of days in each month. It is also useful to distinguish the number of payments from the total rupee value: the two measures may not grow at the same rate. This study therefore examines monthly volume and value together, considers the number of banks live on UPI, calculates average ticket size, and compares raw monthly totals with daily averages adjusted for calendar length.
1.3Objectives
- Measure monthly UPI transaction volume and value.
- Identify peaks, troughs and month-on-month changes.
- Examine changes in the number of banks live on UPI and average transaction size.
- Describe the relationship between transaction volume and transaction value.
- Summarise activity by quarter and compare raw monthly totals with calendar-adjusted daily averages.
1.4Research questions
The analysis addresses four questions: (1) How did UPI transaction volume and value change from month to month between April 2024 and March 2025? (2) Did transaction volume grow faster than transaction value, and how did average ticket size change? (3) How closely were volume and value associated, and how did they move alongside the number of banks live on UPI? (4) How much did adjusting for the number of calendar days change the picture of month-to-month volume growth?
1.5Organisation of the paper
The next section reviews the sources and relevant context. The data and methods are then explained, followed by the monthly data. The analysis is presented next, the main results are summarised, and their interpretation is discussed. Implications and limitations are outlined before the conclusion.
2Literature review
2.1Official reporting on UPI growth
Official publications provide useful context for the growth in UPI activity. The Press Information Bureau reported approximately 16.73 billion UPI transactions in December 2024, which is consistent with the December volume used in this analysis (Press Information Bureau, 2025). Business Standard also reported the month’s high transaction count in its January 2025 coverage (Business Standard, 2025). The Department of Financial Services’ Annual Report 2024–25 (Department of Financial Services, 2025) provides broader government context on financial services and digital payments. These sources help situate the dataset, although news reports and official summaries do not replace a review of peer-reviewed research.
2.2Administrative data as evidence
NPCI’s monthly product statistics (National Payments Corporation of India, n.d.-a) report participating banks, transaction volume and transaction value. These records are useful for describing the scale and timing of system activity because they are published on a recurring basis and cover national totals. Their aggregation is also a limitation: they cannot explain which groups made the payments, what the payments were for, or how activity differed between states, merchants or user categories.
2.3Analytical approaches
Quantitative work on digital-payment adoption uses several approaches. Survey-based studies can examine users’ awareness, attitudes and reasons for adopting a payment method. Analyses of administrative data instead describe observed activity at the system level, using measures such as transaction counts, values and growth rates. These approaches answer different questions and can complement each other. The present study is descriptive: it identifies patterns in published monthly totals but does not test individual-level explanations for those patterns.
2.4Research gap and contribution
This paper brings together four measures—transaction volume, transaction value, banks live on UPI and average ticket size—for the same twelve-month period. It also compares fiscal-quarter totals and adjusts monthly figures for the number of calendar days. The contribution is therefore a combined descriptive view of activity and a check on how calendar length affects month-to-month comparisons. The paper does not claim to establish causal explanations, and its short time span limits the conclusions that can be drawn about seasonality.
3Methodology
3.1Study area / scope
The unit of analysis is the national UPI system, observed monthly from April 2024 to March 2025. The period covers the twelve months of India’s 2024–25 financial year, giving twelve observations for each monthly series. No geographic subgroups or individual transactions are analysed.
3.2Data collection
The dataset consists of publicly available NPCI statistics (National Payments Corporation of India, n.d.-a, n.d.-b) on banks live on UPI, monthly transaction volume and monthly transaction value. Volume is recorded in millions of transactions and value in ₹ crore. Average ticket size is calculated from the reported value and volume; daily averages are calculated by dividing each monthly total by the number of calendar days in that month. No survey or interview data were collected. Table 1 defines the variables and their units.
| Variable | Unit | Source / construction |
|---|---|---|
| Banks live on UPI | Number | NPCI; monthly count of participating banks |
| Transaction volume | Million | NPCI; number of UPI transactions in the month |
| Transaction value | ₹ crore | NPCI; total rupee value of UPI transactions in the month |
| Average ticket size | ₹ | Calculated: value × 10 ÷ volume (value in ₹ crore, volume in million) |
| Daily average volume / value | Million / ₹ crore per day | Calculated: monthly total ÷ calendar days in the month |
3.3Analytical techniques
The analysis uses descriptive statistics, month-on-month growth rates, average ticket size, Pearson correlation and exploratory ordinary least squares (OLS) regression. The regression is included to describe association, not to estimate a causal effect. The measures are calculated as follows.
- Point-to-point growth = (X in March 2025 ÷ X in April 2024 − 1) × 100.
- Month-on-month (MoM) growth = (X in month t ÷ X in month t−1 − 1) × 100.
- Average ticket size = (value in ₹ crore × 10⁷) ÷ (volume in millions × 10⁶), which simplifies to value × 10 ÷ volume.
- Calendar-adjusted daily average = monthly total ÷ number of calendar days in that month (28 in February 2025).
- Trend estimation: a linear time trend and a log-linear trend (natural log of the series regressed on a month index) are fitted to estimate average monthly change and average monthly percentage growth.
- Pearson correlation and ordinary least squares (OLS) regression are used to describe association between series.
- Quarterly aggregation uses fiscal quarters: Q1 (April–June 2024), Q2 (July–September 2024), Q3 (October–December 2024) and Q4 (January–March 2025).
3.4Data quality and ethical considerations
The source data are publicly available national aggregates. Calculated measures were derived from the monthly figures shown in Table 2, and the December 2024 transaction volume was compared with the government figure cited in the literature review. The dataset contains no personal-level records. All results are interpreted descriptively. In particular, twelve observations are too few to support strong causal or seasonal conclusions.
4Data
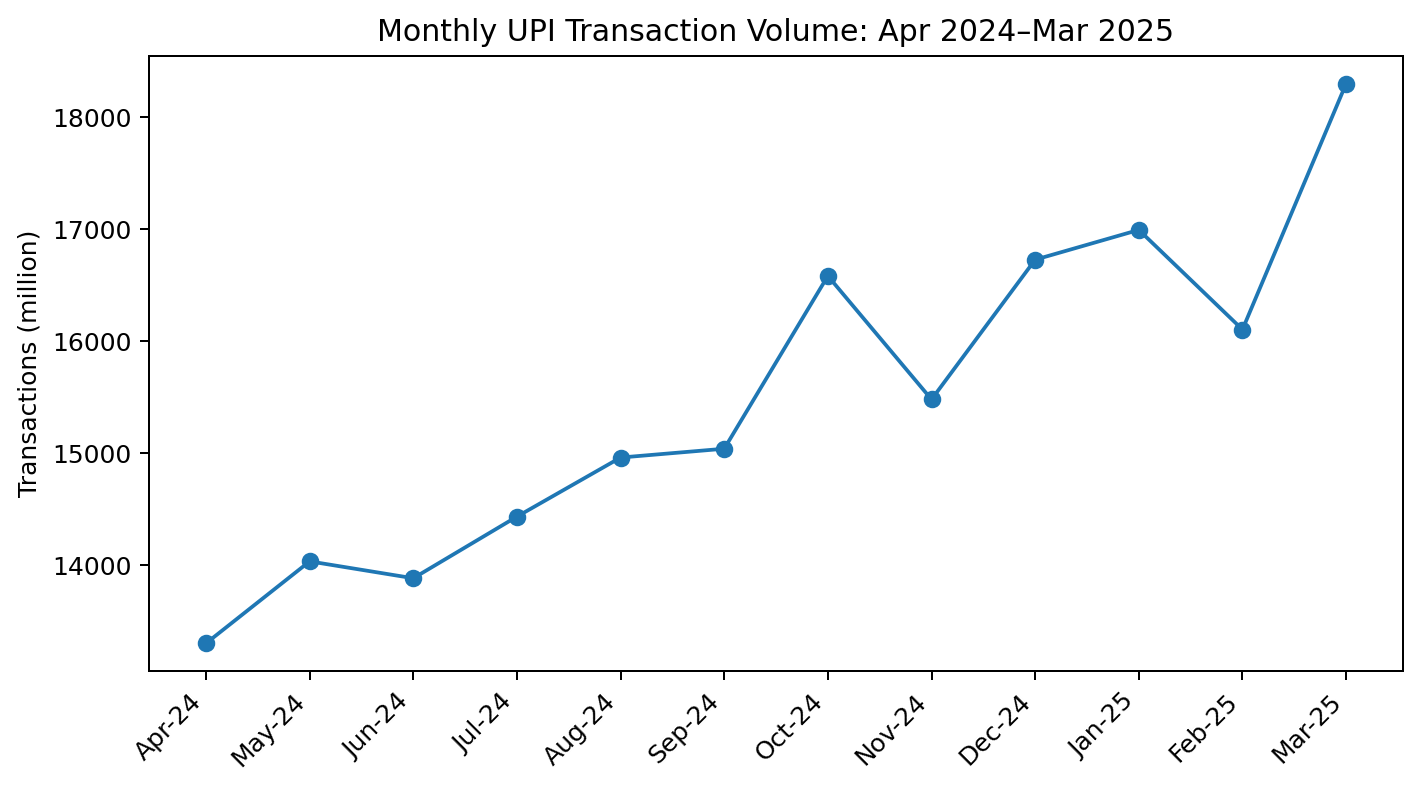
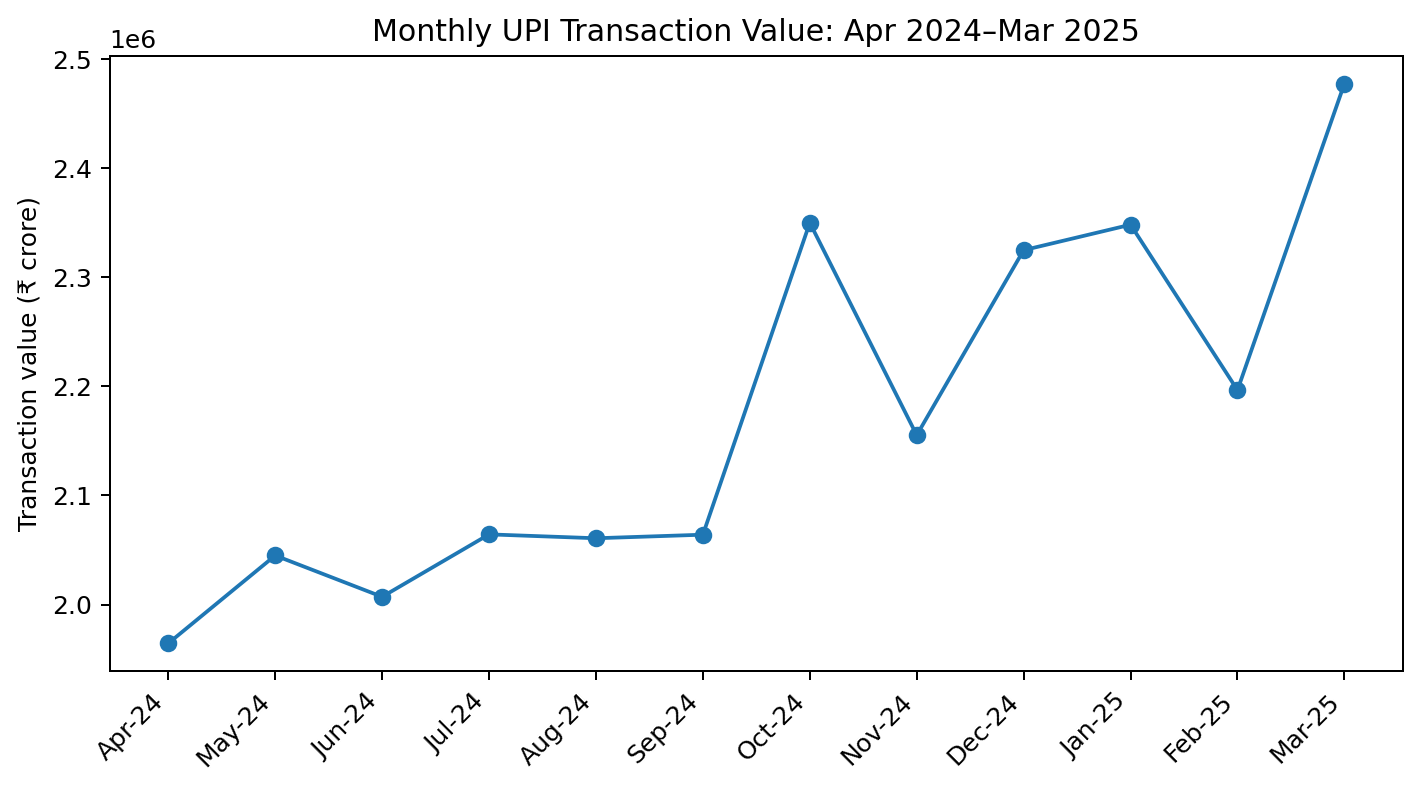
Table 2 reports the monthly statistics used in the study, and Figures 1 and 2 plot monthly transaction volume and value.
| Month | Banks live | Volume (Mn) | Value (₹ Cr) | Avg. ticket (₹) |
|---|---|---|---|---|
| Apr-24 | 583 | 13,303.99 | 1,964,464.52 | 1,476.60 |
| May-24 | 598 | 14,035.84 | 2,044,937.05 | 1,456.94 |
| Jun-24 | 602 | 13,885.14 | 2,007,081.20 | 1,445.49 |
| Jul-24 | 605 | 14,435.55 | 2,064,292.41 | 1,430.01 |
| Aug-24 | 608 | 14,963.05 | 2,060,735.57 | 1,377.22 |
| Sep-24 | 622 | 15,041.75 | 2,063,994.71 | 1,372.18 |
| Oct-24 | 632 | 16,584.97 | 2,349,821.46 | 1,416.84 |
| Nov-24 | 637 | 15,482.02 | 2,155,187.40 | 1,392.06 |
| Dec-24 | 641 | 16,730.01 | 2,324,699.91 | 1,389.54 |
| Jan-25 | 647 | 16,996.00 | 2,348,037.12 | 1,381.52 |
| Feb-25 | 653 | 16,106.19 | 2,196,481.69 | 1,363.75 |
| Mar-25 | 661 | 18,301.51 | 2,477,221.61 | 1,353.56 |
4.1Descriptive statistics
Table 3 summarises the series. Transaction volume shows greater relative variation than transaction value in this twelve-month series: the coefficients of variation are 9.61% and 7.63%, respectively. Average ticket size varies less (2.83%). Both volume and value are at their lowest in April 2024 and highest in March 2025. These summaries describe variation within the study period and should not be treated as estimates of long-run behaviour.
| Series | Mean | Median | Std. dev. | Minimum | Maximum | CV (%) |
|---|---|---|---|---|---|---|
| Volume (Mn) | 15,488.84 | 15,261.89 | 1,487.77 | 13,303.99 (Apr-24) | 18,301.51 (Mar-25) | 9.61 |
| Value (₹ Cr) | 2,171,412.89 | 2,109,739.91 | 165,700.97 | 1,964,464.52 (Apr-24) | 2,477,221.61 (Mar-25) | 7.63 |
| Banks live | 624.08 | 627 | 24.72 | 583 (Apr-24) | 661 (Mar-25) | 3.96 |
| Avg. ticket (₹) | 1,404.64 | 1,390.80 | 39.75 | 1,353.56 (Mar-25) | 1,476.60 (Apr-24) | 2.83 |
Note: CV = coefficient of variation (standard deviation ÷ mean). Sample standard deviation (n − 1) is used.
5Analysis
5.1Transaction volume
Monthly transaction volume rose from 13,303.99 million in April 2024 to 18,301.51 million in March 2025, an increase of 37.56%. The largest month-on-month rise occurred in March 2025 (+13.63%), while the largest decline occurred in November 2024 (−6.65%). Volume declined in June, November and February. It was above the twelve-month mean of 15,488.84 million in October, December, January, February and March.
A fitted linear trend corresponds to an increase of about 384 million transactions per month (R2 = 0.868). A log-linear trend implies average monthly growth of about 2.51%. The compound monthly growth rate between the April and March observations is approximately 2.94%. These estimates are not identical because they use different methods and because the March observation sits well above the fitted linear trend.
5.2Transaction value
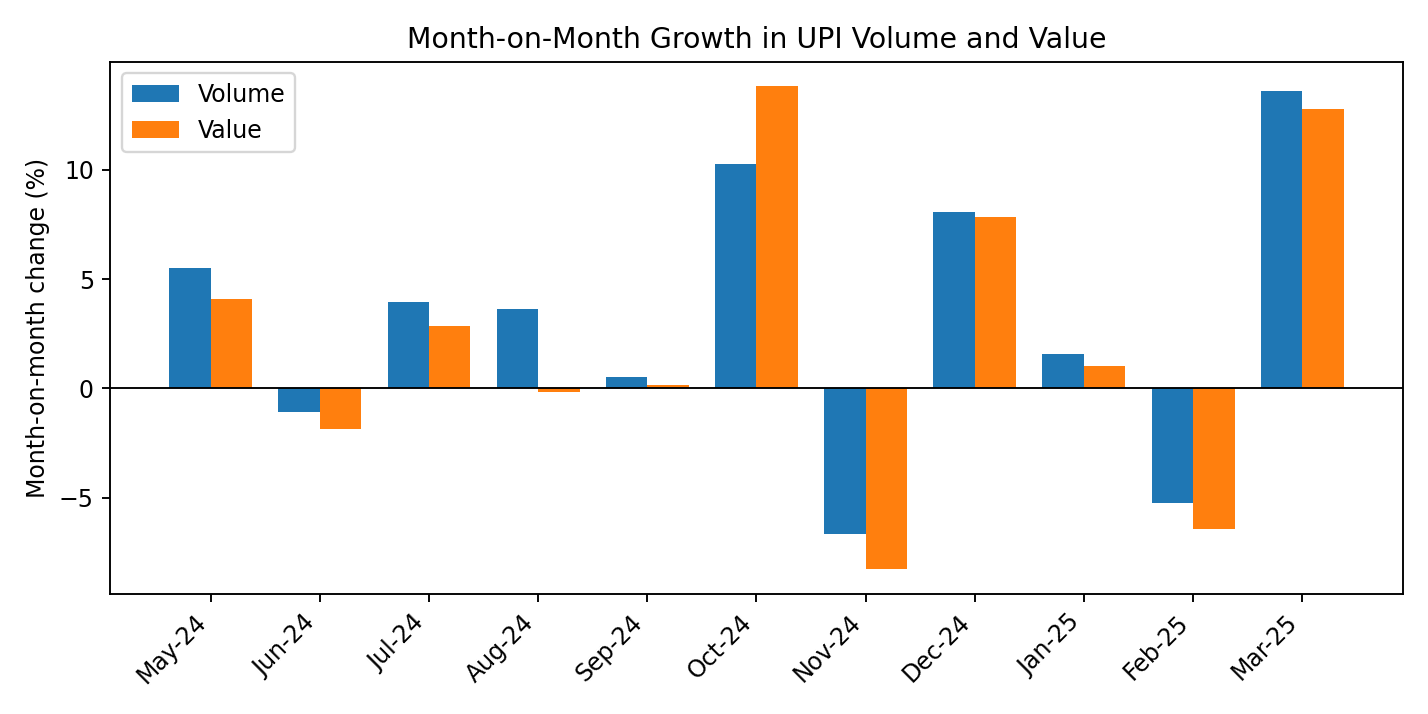
Transaction value increased from ₹1,964,464.52 crore in April 2024 to ₹2,477,221.61 crore in March 2025, a rise of 26.10%. The largest monthly increase was in October (+13.85%), followed by a decline in November (−8.28%). Value fell in June, August, November and February. The fitted linear trend adds about ₹39,378 crore per month (R2 = 0.734); the log-linear trend implies average growth of about 1.82% per month. Both trend fits are weaker than the corresponding fit for transaction volume. Figure 3 compares the month-on-month growth of volume and value.
From July to September 2024, monthly transaction value stayed close to ₹2.06 million crore, while volume increased from 14,435.55 million to 15,041.75 million transactions. This is a useful example of why transaction counts and total value should be examined separately: more payments were recorded over this interval without a comparable increase in the total rupee value.
5.3Month-on-month movements
Table 4 reports monthly changes in the main series and in calendar-adjusted daily volume. Volume and value changed in the same direction in every month except August, when volume rose by 3.65% while value slipped by 0.17%. October and March recorded the strongest increases, while November and February recorded declines in both raw series. Across the eleven month-to-month changes, the standard deviation of volume growth was 6.20 percentage points and that of value growth was 7.04 percentage points.
| Month | Banks added | Volume MoM (%) | Value MoM (%) | Avg. ticket MoM (%) | Daily-adj. volume MoM (%) |
|---|---|---|---|---|---|
| May-24 | +15 | +5.50 | +4.10 | −1.33 | +2.10 |
| Jun-24 | +4 | −1.07 | −1.85 | −0.79 | +2.22 |
| Jul-24 | +3 | +3.96 | +2.85 | −1.07 | +0.61 |
| Aug-24 | +3 | +3.65 | −0.17 | −3.69 | +3.65 |
| Sep-24 | +14 | +0.53 | +0.16 | −0.37 | +3.88 |
| Oct-24 | +10 | +10.26 | +13.85 | +3.25 | +6.70 |
| Nov-24 | +5 | −6.65 | −8.28 | −1.75 | −3.54 |
| Dec-24 | +4 | +8.06 | +7.87 | −0.18 | +4.58 |
| Jan-25 | +6 | +1.59 | +1.00 | −0.58 | +1.59 |
| Feb-25 | +6 | −5.24 | −6.45 | −1.29 | +4.92 |
| Mar-25 | +8 | +13.63 | +12.78 | −0.75 | +2.63 |
5.4Banks live on UPI
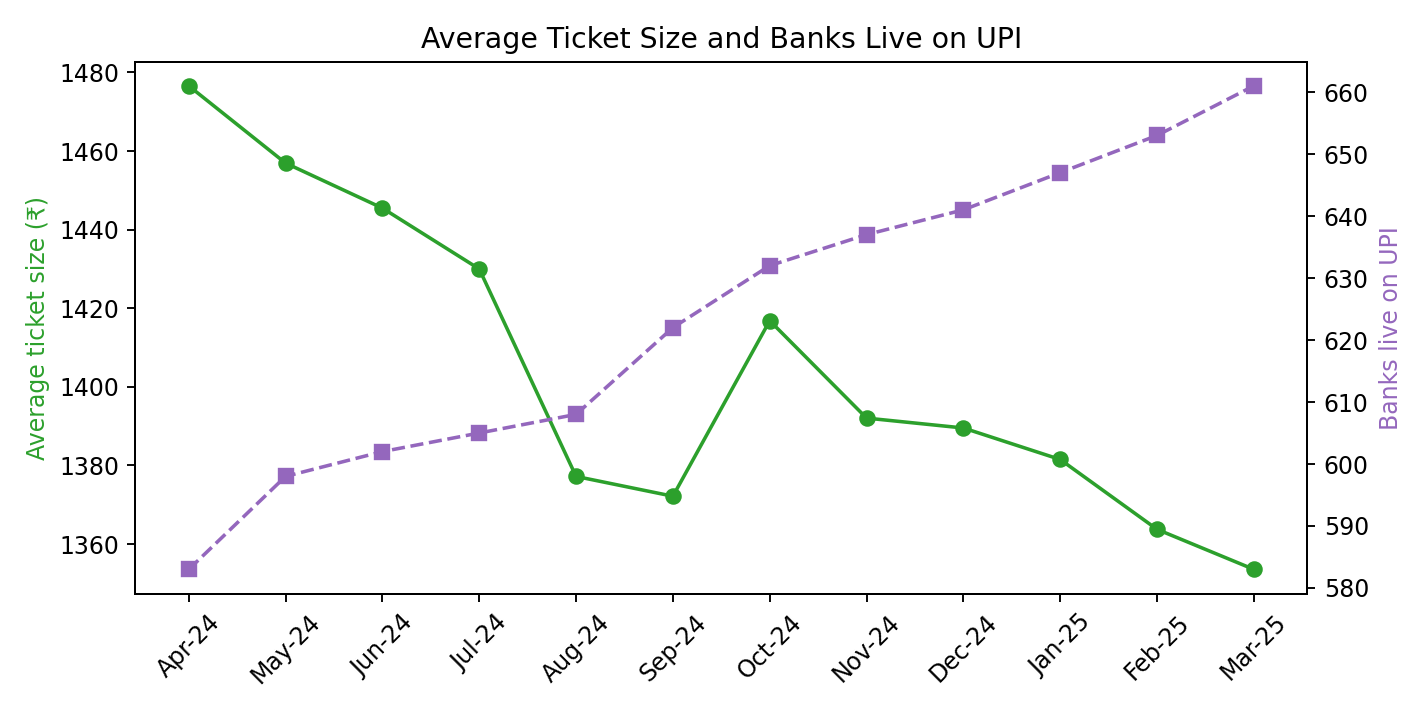
The number of banks live on UPI increased from 583 to 661, a gain of 78 banks or 13.38%. This count indicates participation by banks on the platform; it should not be interpreted as a measure of active customers. The largest monthly additions were 15 banks in May 2024 and 14 in September 2024. The bank count also rose steadily over time, with a correlation of 0.992 with the month index.
Dividing total monthly transaction volume by the number of banks live produces a simple system-level index. On this basis, the ratio increased from 22.82 million to 27.69 million transactions per live bank, a rise of 21.33%. This is only an arithmetic indicator: transactions are not distributed evenly across banks, so the ratio should not be read as the activity level of a typical bank.
5.5Average ticket size
Average ticket size fell from ₹1,476.60 in April 2024 to ₹1,353.56 in March 2025, a decline of 8.33% (Figure 4). This is consistent with transaction volume growing faster than total transaction value. The average fell in ten of the eleven month-to-month comparisons; October was the exception, with a 3.25% increase as value grew faster than volume. The largest monthly fall was in August (−3.69%). Average ticket size and transaction volume were negatively correlated (r = −0.777), although this association does not explain why the average changed.
The average ticket size is calculated from monthly totals, so it cannot show the distribution of individual payments. A lower average could reflect smaller payments by existing users, a greater share of low-value transactions, or a combination of factors. The available aggregate data cannot distinguish between these possibilities.
5.6Quarterly analysis and calendar adjustment
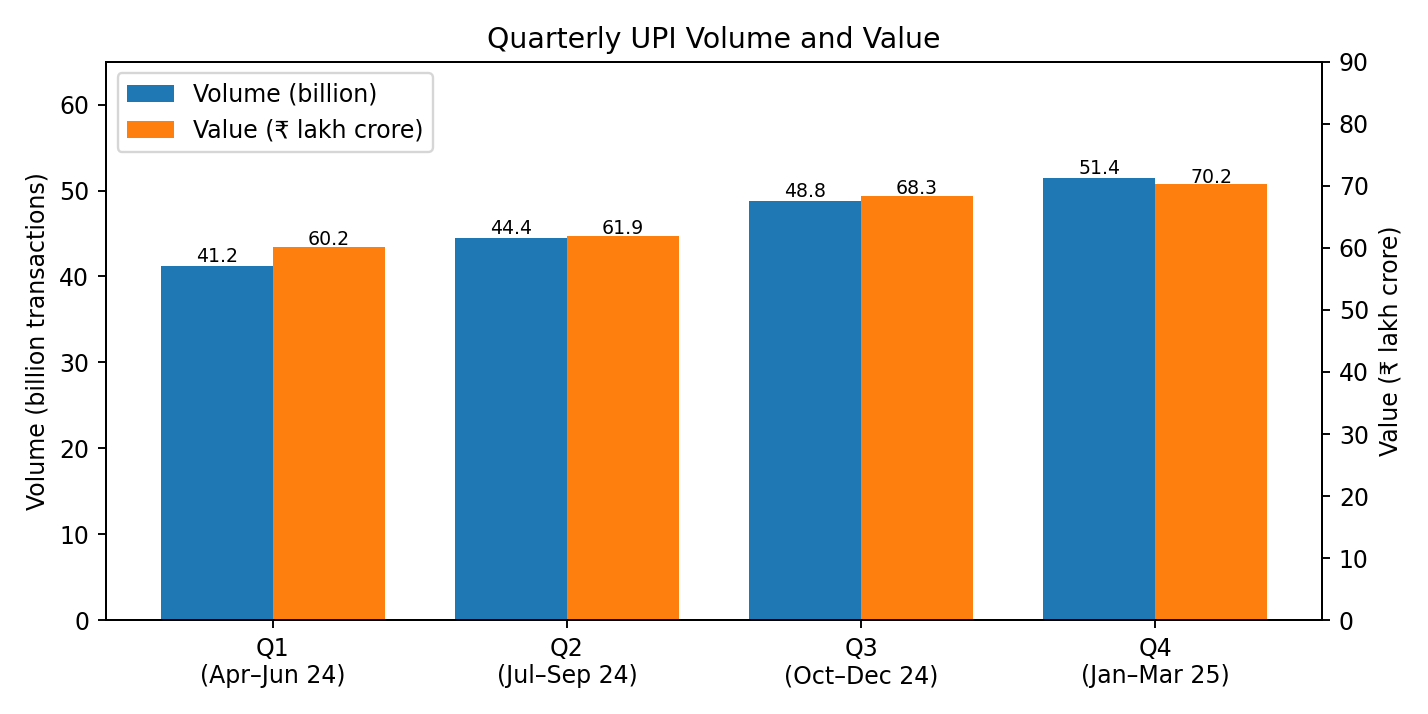
Quarterly totals (Table 5 and Figure 5) help reduce the emphasis on individual monthly swings. Transaction volume increased in each quarter, with quarter-on-quarter growth of 7.80% in Q2, 9.80% in Q3 and 5.34% in Q4. Q4 volume was 24.69% above Q1. Value grew more slowly: Q4 was 16.71% above Q1, and the largest quarter-on-quarter increase occurred in Q3 (+10.35%). Across the full year, the dataset records 185,866.02 million transactions, with a total value of ₹26,056,954.65 crore and an overall average ticket size of about ₹1,401.92.
| Quarter | Avg. banks live | Volume (Mn) | QoQ (%) | Value (₹ Cr) | QoQ (%) | Avg. ticket (₹) |
|---|---|---|---|---|---|---|
| Q1 (Apr–Jun 24) | 594.33 | 41,224.97 | – | 6,016,482.77 | – | 1,459.43 |
| Q2 (Jul–Sep 24) | 611.67 | 44,440.35 | +7.80 | 6,189,022.69 | +2.87 | 1,392.66 |
| Q3 (Oct–Dec 24) | 636.67 | 48,797.00 | +9.80 | 6,829,708.77 | +10.35 | 1,399.62 |
| Q4 (Jan–Mar 25) | 653.67 | 51,403.70 | +5.34 | 7,021,740.42 | +2.81 | 1,366.00 |
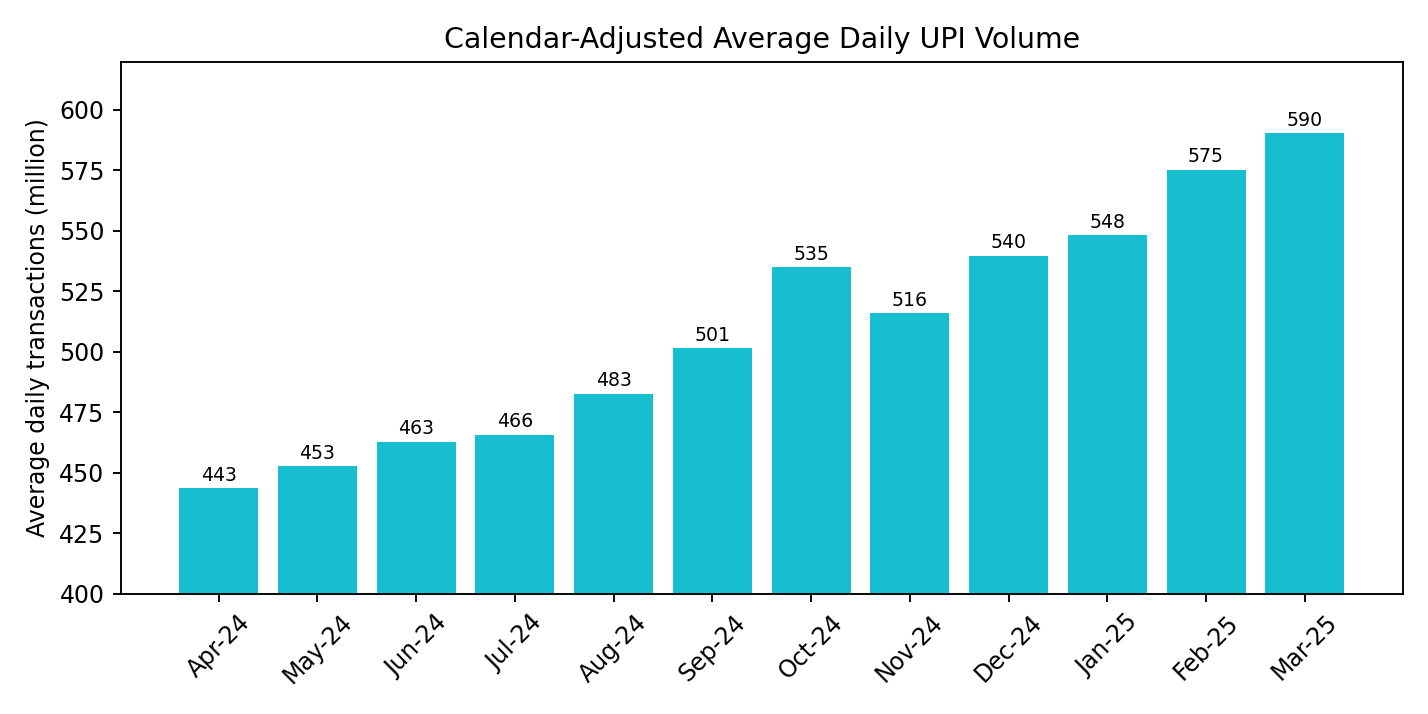
Monthly totals are affected by the number of days in each month. Dividing each total by the relevant calendar-day count allows a more comparable view of average daily activity (Figure 6). Average daily volume rose from 443.47 million transactions in April 2024 to 590.37 million in March 2025 (+33.13%). Average daily value increased from ₹65,482 crore to ₹79,910 crore (+22.03%). Both increases are smaller than the changes in raw monthly totals, partly because April has 30 days and March has 31.
February illustrates the effect of calendar adjustment. Although raw transaction volume fell by 5.24% from January, the daily average increased by 4.92% because February 2025 had 28 days. The raw March increase of 13.63% was 2.63% when measured as daily average volume. In contrast, the October increase and November decline remained after adjustment. The standard deviation of month-on-month volume growth fell from 6.20 to 2.68 percentage points after adjustment. This calculation accounts for month length only; it does not adjust for weekends, holidays or other calendar effects.
5.7Association between volume, value and participation
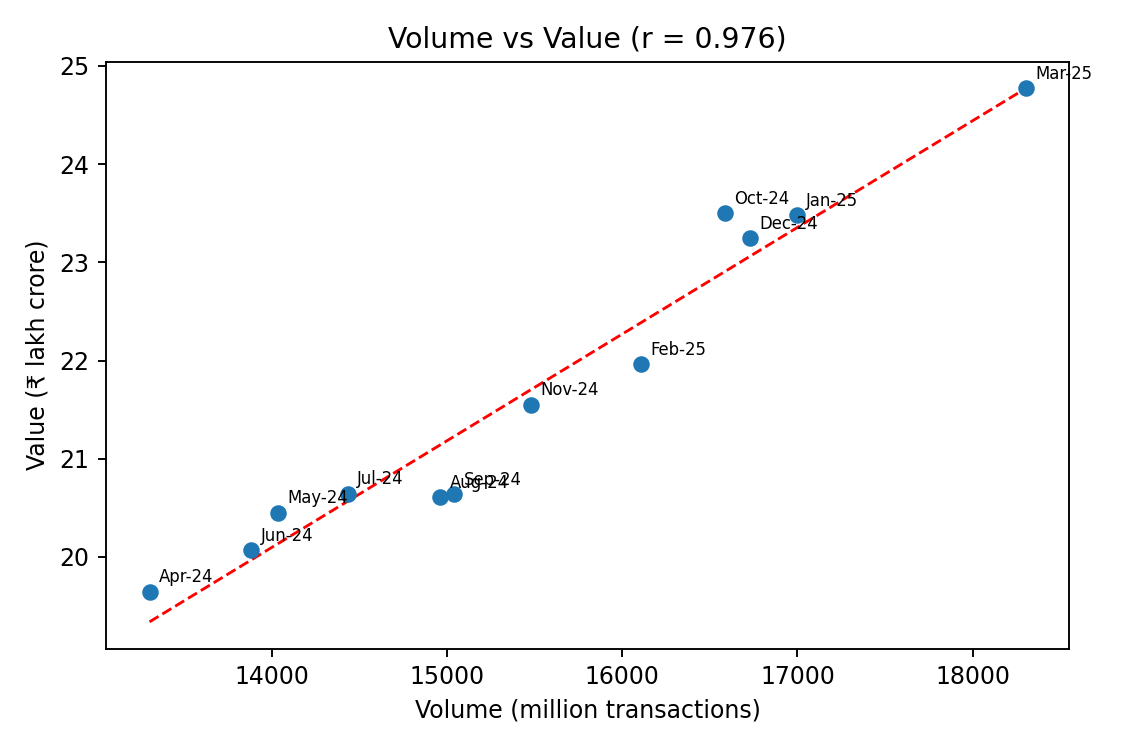
Transaction volume and value have a strong positive Pearson correlation (r = 0.976; Figure 7). Their month-on-month growth rates are also strongly correlated (r = 0.973). Volume is correlated with the number of banks live at r = 0.935, while the correlation between value and the bank count is 0.873. These figures describe how the series move together; they do not show that changes in one variable caused changes in another.
An exploratory regression of transaction volume on the number of banks gives R2 = 0.875 and a slope of 56.28 million transactions per additional bank, with an intercept of −19,635.38 million. This result should be treated cautiously because both series increase over time. The bank count itself is highly correlated with the month index (r = 0.992), and adding a time index reduces the estimated bank coefficient to about 41 million. With only twelve observations and strongly trending variables, the regression is illustrative rather than conclusive.
6Results
The main results are listed below and summarised in Table 6.
- Volume growth: +37.56%
- Value growth: +26.10%
- Bank participation growth: +13.38%
- Highest monthly volume: March 2025 (18,301.51 million)
- Highest monthly value: March 2025 (₹2,477,221.61 crore)
- Volume–value correlation: r = 0.976
- Average ticket size: approximately ₹1,476.60 in April 2024 versus ₹1,353.56 in March 2025
- Calendar-adjusted daily volume growth: +33.13%; daily value growth: +22.03%
- Q4 volume was 24.69% higher than Q1; Q4 value was 16.71% higher
- Average ticket size fell in ten of the eleven months
| Indicator | April 2024 | March 2025 | Change |
|---|---|---|---|
| Banks live on UPI | 583 | 661 | +13.38% |
| Transaction volume (Mn) | 13,303.99 | 18,301.51 | +37.56% |
| Transaction value (₹ Cr) | 1,964,464.52 | 2,477,221.61 | +26.10% |
| Average ticket size (₹) | 1,476.60 | 1,353.56 | −8.33% |
| Daily average volume (Mn/day) | 443.47 | 590.37 | +33.13% |
| Daily average value (₹ Cr/day) | 65,482.15 | 79,910.37 | +22.03% |
7Discussion
7.1Sustained expansion with short-run volatility
The overall pattern is upward, but growth was not continuous from month to month. Volume fell in June, November and February, while value fell in four months. The largest monthly changes are substantial relative to the typical monthly increase. Looking only at April and March gives a clear picture of overall expansion; looking at each month shows the uneven path between those endpoints. The quarterly results provide a complementary view because volume rose in every quarter.
7.2Frequency versus value
Volume grew by 37.56%, compared with 26.10% for transaction value. The calculated average ticket size therefore declined. In other words, the system processed more transactions, but the total rupee value did not rise at the same pace. This pattern may be consistent with more frequent low-value payments, but the aggregate data cannot confirm that explanation or identify which transaction categories account for the change.
7.3Participation and scale
The number of banks live on UPI rose by 13.38%, more slowly than transaction volume, which increased by 37.56%. The volume-per-live-bank ratio also increased by about 21%, but it is only a broad arithmetic index, not a measure of each bank’s activity. The comparison suggests that the increase in total activity was not matched by a similar increase in the number of participating banks. It cannot establish whether the change came from more active users, more frequent payments, merchant adoption or other factors.
7.4Calendar and seasonal patterns
Adjusting for month length changes the interpretation of some headline movements. The February decline in raw volume becomes an increase in daily average volume, while the large March rise is much smaller after adjustment. The October increase and November decline remain visible in the adjusted series. Festive-season spending is sometimes proposed as an explanation for October growth, but this dataset cannot test that explanation. A single year of observations is not enough to separate seasonal effects from other changes over time.
7.5Interpretation boundaries
The dataset describes changes in aggregate activity but cannot identify their causes. Further analysis would need additional information, such as payment category, user or merchant characteristics, regional data, and relevant economic indicators. The present results are best understood as a descriptive baseline for more detailed research.
8Implications
8.1For payment-system operators and regulators
- Payment-system operators and regulators need to monitor transaction counts as well as transaction value. By March 2025, the system averaged about 590 million transactions per day. The monthly data also show that raw transaction volume can change considerably, which is relevant when planning capacity and resilience. These results support ongoing monitoring, but they do not by themselves specify the capacity required at peak times.
- Monthly administrative statistics provide a consistent way to track changes in digital-payment activity. Their value is greatest when the figures are interpreted alongside their definitions, calendar effects and limitations.
8.2For banks and payment service providers
- Because transaction counts increased faster than total value, transaction-processing demand may have grown faster than the rupee amounts transferred. Banks and payment-service providers should therefore monitor transaction volume as well as value when assessing operational workloads.
8.3For future research
- Future work could analyse person-to-merchant and person-to-person payments separately to examine whether their growth patterns differ.
- Further studies could combine UPI statistics with measures of internet access, smartphone use, income, inflation or state-level economic conditions.
- A dataset covering several years would provide a stronger basis for investigating seasonal patterns and distinguishing them from longer-term trends.
9Limitations
- No user or merchant survey was conducted.
- The study covers only twelve months.
- Correlation and regression do not establish causality.
- Aggregate monthly data cannot reveal individual-user behaviour, failed transactions, fraud exposure or demographic differences.
- Banks live on UPI are not equivalent to active users.
- Average ticket size is a derived average; it cannot show the distribution of individual payment amounts.
- Calendar adjustment corrects only for month length, not for weekends, holidays or other within-month patterns.
- With twelve observations and strongly trending series, regression estimates are unstable and are presented as illustrative.
10Conclusion
Between April 2024 and March 2025, UPI transaction volume increased by 37.56%, transaction value by 26.10%, and the number of banks live on the platform by 13.38%. Average ticket size declined by 8.33%, indicating that transaction counts grew faster than the total value transferred. The monthly series shows overall expansion alongside short-term fluctuations. Volume and value were strongly associated, but the analysis does not establish a causal relationship between them or explain the reasons for growth.
Two adjustments help qualify the headline results. First, transaction volume increased in every fiscal quarter, although the rate of growth varied. Second, dividing monthly totals by calendar days reduced the apparent volatility of volume growth and showed that average daily volume rose by 33.13% over the period. Because the study covers only twelve months of national aggregate data, further research using longer time series and more detailed transaction categories would be needed to investigate causes and seasonal effects.
11AI-use disclosure
Generative AI tools were used to assist with language editing and manuscript revision. The author(s) remain responsible for verifying the source data, calculations, interpretations and references, and for ensuring that the final manuscript reflects their own understanding and complies with the target journal’s policy.
References
- [1]Business Standard (2025). UPI transactions continue upward trajectory. Business Standard, 3 January 2025. https://www.business-standard.com/finance/news/upi-transactions-touch-all-time-high-in-december-125010300498_1.html
- [2]Department of Financial Services (2025). Annual report 2024–25. Ministry of Finance, Government of India. https://financialservices.gov.in/beta/sites/default/files/2025-05/Annual-Report-2024-25.pdf
- [3]National Payments Corporation of India (n.d.-a). Unified Payments Interface (UPI) product statistics. https://www.npci.org.in/product/upi/product-statistics
- [4]National Payments Corporation of India (n.d.-b). UPI ecosystem statistics. https://www.npci.org.in/what-we-do/upi/upi-ecosystem-statistics
- [5]Press Information Bureau (2025). Exponential growth in digital transactions. Government of India, 17 January 2025. https://static.pib.gov.in/WriteReadData/specificdocs/documents/2025/jan/doc2025117486701.pdf