Artificial Intelligence, Computer Vision
Beyond Clean Benchmarks: A Reproducible Severity-Sweep Evaluation of AI-Generated Image Detector Robustness
Bharati Vidyapeeth College of Engineering, Pune, Maharashtra, India
Published October 2026
Abstract
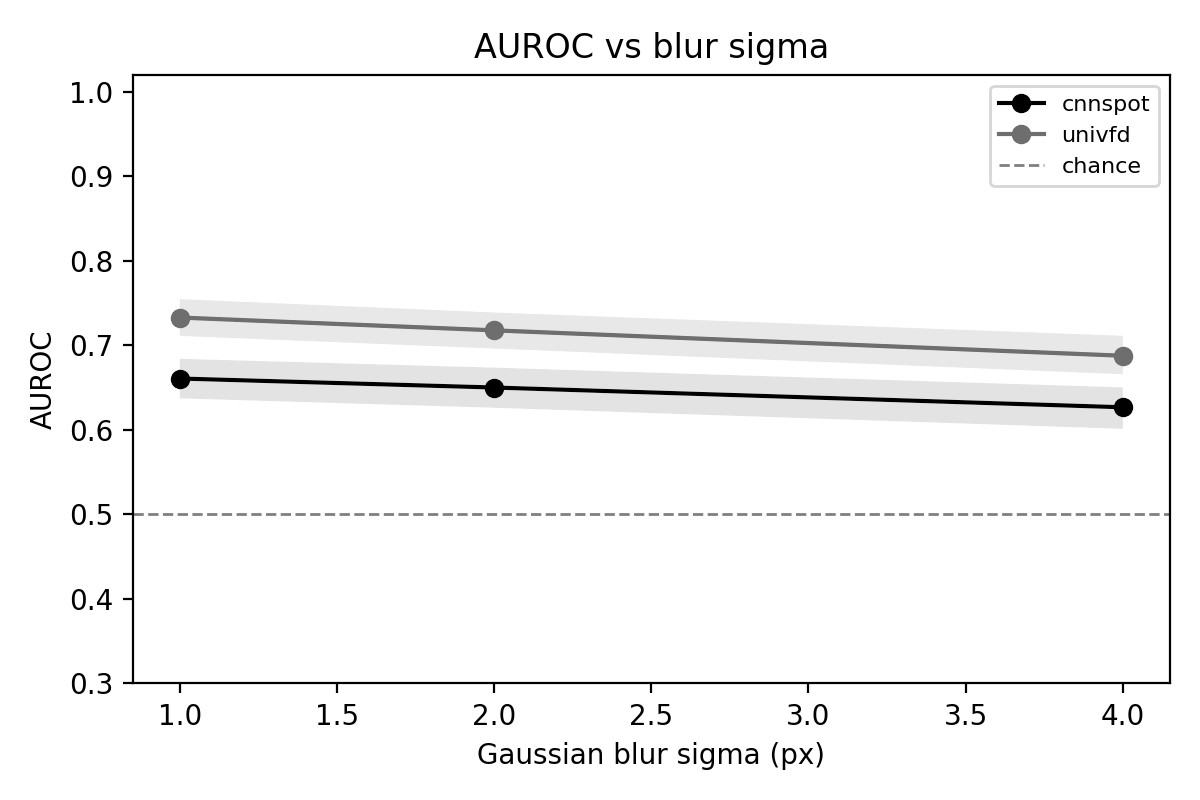
AI-generated image detectors are used often for verifying news, moderating content and handling evidence. However most tests for these detectors use images. Images that circulate in the world are often recompressed, resized, cropped or filtered. Large studies already show that detector accuracy drops when images are degraded. This study does not claim to discover that. Instead it offers a severity-sweep test. This test asks whether a detector that works well on images will still work well when the images are intentionally degraded. Two detectors that are publicly available were tested. CNNSpot is a network trained with ProGAN. UnivFD is a CLIP linear probe. The detectors were not retrained. They were tested on 2,000 images: 1,000 images and 1,000 synthetic images from Stable Diffusion v1.5, ADM, Midjourney and BigGAN. These images come from a community mirror of GenImage. Five image transformations were applied at levels of severity: JPEG compression, resizing, centre cropping, blur and Gaussian noise. Two chains of transformations were also used. On images UnivFD performed better than CNNSpot with AUROC values of 0.741 versus 0.662. All conditions showed the pattern. Gaussian blur was the transformation that consistently lowered AUROC for both detectors. For CNNSpot AUROC fell from 0.661 to 0.627 when sigma increased from 1 to 4. For UnivFD AUROC fell from 0.733 to 0.688 over the range. JPEG compression, resizing and noise produced non-monotonic changes. Cropping unexpectedly improved AUROC for both detectors. No single transformation reduced AUROC by than 0.10. The chains of transformations were usually no more harmful than the steps. Two of four planned detectors were tested. The dataset is small. Contains a mix of generators. Therefore the findings apply to these two detectors in these conditions. The results indicate that the reliability of detection tools should be checked step by step for each transformation than relying on a clean-image benchmark score. This has implications for how organisations validate, deploy and govern tools.
Keywords: generated image detection; trustworthy AI; robustness evaluation; digital forensics; responsible AI
1Introduction
Generative image models can now create pictures that look almost real. People find it hard to tell them apart from photos. Because of this detectors that can spot images are moving from research tools to tools. Newsrooms and fact-checkers use them to sort out images. Social media platforms use them to flag media. Investigators sometimes use them when the authenticity of evidence is questioned. All of these organisations rely on a probability score from the detector. The choices made from that score can affect reputation, law and society. If an organisation trusts a detector much it is a governance risk well as a technical one. Missing an image can let misinformation spread. A false alarm on an image can hurt the credibility of evidence.
Most studies test detectors on images. In reality images are resized by messaging apps, recompressed by media cropped for viewing or taken as screenshots before they reach a detector. This problem has been known for a while. Early forensic research showed that post-processing weakens GAN-image detectors (Wang et al., 2020).
A recent benchmark evaluated seventeen detectors and several vision-language models under transmission and re-digitisation conditions (Li et al., 2025). This study does not claim that detector accuracy can be lowered, because that is already known.
This study focuses on how to evaluate detectors. Standard benchmark tests show that detectors become weaker. They do not tell how performance changes as the damage becomes stronger whether the ranking of detectors on images stays the same when images are degraded or whether combining operations is worse than doing each operation alone. These are the questions an organisation must answer before deciding if a clean-image score is enough to choose a tool. We answer these questions with a severity-sweep test on two detectors that have designs. We present the results. Note the limitations.
The contributions of this paper are: (1) A graded-severity test of five transformations and two combined chains on two detectors, CNNSpot and UnivFD. (2) An analysis of whether the ranking of the two detectors on images remains the same after transformation. (3) A comparison of chains with their steps. (4) A seed-controlled evaluation method that stores results for each image.
The predictions can be extended to detectors. The study is deliberately small. The claims that come from it are consequently limited.
2Related work and research gap
Wang et al. (2020) showed that a ResNet-50 classifier trained on ProGAN images called CNNSpot could generalise to several other generators. This set a baseline.
Ojha et al. (2023) argued that classifiers trained on artefacts from a single generator transfer. They instead trained a probe on CLIP features, named UnivFD and this improved generalisation across generators.
Reconstruction-based approaches such as DIRE (Wang et al., 2023). Its lightweight version Distil-DIRE (TrueMedia.org, n.d.) measure the error between an image and its diffusion reconstruction. AIDE (Yan et al., 2025) combines a frequency branch with a branch.
These four detectors motivated the plan for this study but only CNNSpot and UnivFD were executed, as described in Section 4.2.
Benchmarks have broadened the evaluation. GenImage (Zhu et al., 2023) supplies images from eight generators and also documents format and resolution differences between real and synthetic classes that can confound detectors.
AI-GenBench (Pellegrini et al., 2025) evaluates detectors on generators that appear after the training period.
The related work is RRDataset and RRBench (Li et al., 2025). They assemble images from under scenarios, internet transmission and re-digitisation. They benchmark seventeen detectors and a set of vision-language models. Include a study. Their reported pattern shows that detectors lose accuracy under these conditions with differences between detector families.
A further line of work targets degradations. Li et al. (2026) exploit the stability of the phase spectrum to detect compressed images while Choi et al. (2025) use the robustness of self-supervised features to cropping for training-free detection. These studies treat robustness as a design goal. Demonstrate it for a degradation. They do not isolate how a given off-the-shelf detector behaves across a range of severities.
In summary the studies above establish that degradation matters. That some architectures resist degradations. What remains less examined is the shape of the degradation curve for a fixed pair of detectors whether the clean-image ordering persists along that curve and whether compounding transformations adds harm beyond the single step. The present study addresses these three points on a scale. It does not extend or replace the large benchmarks cited.
3Research questions and hypotheses
Four research questions were posed before the analysis. The wording of the hypotheses follows what the experiments can test given that two detectors were executed.
RQ1: How do AUROC and threshold-based metrics change with severity for JPEG compression, resizing, cropping, blur and Gaussian noise? H1: AUROC decreases monotonically with severity for each transformation. A decrease of 0.10 AUROC or more was set as the threshold for significance.
RQ2: Do the two detectors differ in AUROC under conditions? H2: The AUROC of UnivFD and CNNSpot differs at the 95% confidence level in each condition. Because the two detectors represent a CNN family and a CLIP family this comparison cannot be generalised to reconstruction-based or frequency-based families.
RQ3: Is the ordering of detectors preserved after transformation? H3, as originally planned a Spearman rank correlation between transformed rankings requires three or more detectors. Could not be computed with two. This question is therefore reported as a check of whether the ordering of the two detectors ever reverses.
RQ4: Does a chain of transformations reduce AUROC more than its constituents? H4: The AUROC of a compound chain is lower than that of each constituent transformation assessed with paired bootstrap comparisons.
4Methodology
4.1Dataset
Images came from tiny-genimage a community-maintained Kaggle version of GenImage that keeps its synthetic pairing and training and validation structure. The evaluation set contained 1,000 images and 1,000 synthetic images with 250 images from each of four generators: Stable Diffusion v1.5, ADM, Midjourney and BigGAN. BigGAN replaced Stable Diffusion v1.4, which was in the plan; this added a non-diffusion generator to the mix.
Both detectors were used frozen no training and validation split was needed and no training data could leak into the evaluation.
All 2,000 images passed through the harmonisation step before any transformation to limit resolution and format confounds between the synthetic classes and every transformation was then applied identically to the same 2,000 images.
4.2Detectors
Four detector families were. Two detectors were executed: CNNSpot and UnivFD. Both detectors were run as published with their released checkpoints and no retraining or fine-tuning was performed. Distil-DIRE and AIDE were not executed because their inference entry points could not be verified within the pipeline. No results for either detector are. Implied anywhere, in this paper. Table 1 records the status of each detector. All findings relating to RQ2 and RQ3 therefore concern one CNN detector and one CLIP-based detector only.
| Detector | Family | Output | Status |
|---|---|---|---|
| CNNSpot (Wang et al., 2020) | CNN (ResNet-50) | Probability | Executed, sweep |
| UnivFD (Ojha et al., 2023) | CLIP + linear probe | Probability | Executed, sweep |
| Distil-DIRE (TrueMedia.org, n.d.) | Diffusion reconstruction | Reconstruction-error score | Not executed |
| AIDE (Yan et al., 2025) | DCT + semantic hybrid | Probability | Not executed |
4.3Transformations
Table 2 lists the transformations. JPEG compression used quality factors 95 75, 50 and 25. Resizing downsampled the image to scales of 0.25, 0.5 0.75 and 1.0. Upsampled it back to the canvas. Cropping removed 10%, 25% and 50% of the area from the centre. Resized the result back to the canvas. Gaussian blur used sigma values of 1, 2 and 4 and Gaussian noise used sigma values of 5, 10 and 20 on an 8-bit scale. Two compound chains were defined to resemble content sharing: chain A (25% crop then resize to 0.5 JPEG quality 50) and chain B (resize to 0.5 JPEG quality 75 then JPEG quality 50 which amounts to double compression).
| Transformation | Severity levels |
|---|---|
| JPEG compression | Quality 95 75 50 25 |
| Resizing | Scale 0.25 0.5 0.75 1.0 ( up to canvas) |
| Centre cropping | 10%, 25%, 50% of area removed, resized to canvas |
| blur | Sigma 1 2 4 |
| noise | Sigma 5 10 20 (8-bit scale) |
| Compound chain A | Crop 25% resize 0.5 JPEG quality 50 |
| Compound chain B | Resize 0.5 JPEG quality 75 JPEG quality 50 |
4.4Metrics and statistics
Area under the ROC curve (AUROC) was the metric because it does not depend on a threshold. F1, precision and recall were computed at a threshold chosen on the images with Youden’s J statistic and then held fixed for all transformed conditions so that the threshold was not tuned to any degraded condition. Robustness was summarised by absolute and relative AUROC drop. Relative retention is uninformative close to the ceiling. Was not used as a measure. The 95% confidence intervals came from a bootstrap that preserved class balance, with 500 to 2,000 resamples depending on the analysis. Differences between a compound chain and each of its constituents were tested with paired bootstrap comparisons and the Benjamini and Hochberg (1995) procedure controlled the discovery rate across the set of comparisons.
5Results
All values below were produced by one pipeline run on Google Colab (T4 GPU) over the 2,000-image set and each value is derived from the stored per-image prediction file.
5.1Clean baseline
UnivFD outperformed CNNSpot on images with an AUROC of 0.741 (95% CI 0.719 to 0.762) against 0.662 (95% CI 0.638 to 0.685). The intervals do not overlap. At their thresholds both detectors favoured precision over recall: CNNSpot reached a precision of 0.674 and a recall of 0.517 and UnivFD reached a precision of 0.827 and a recall of 0.493. Both therefore missed about half of the images at these thresholds.
5.2Severity sweeps (RQ1)
| Condition | CNNSpot | UnivFD |
|---|---|---|
| Clean (95% CI) | 0.662 (0.638 to 0.685) | 0.741 (0.719 to 0.762) |
| JPEG, quality 95 to 25 | 0.655 to 0.660 (no change) | 0.742 to 0.769 (rises) |
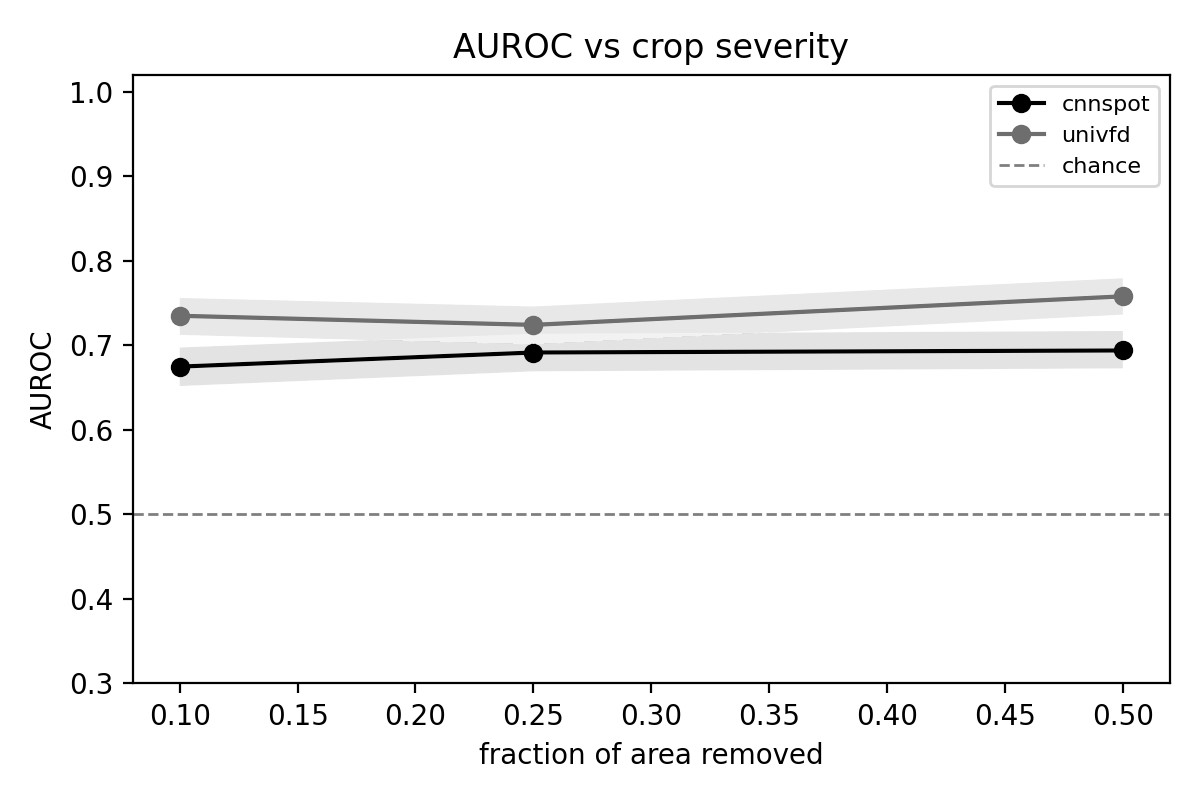
| Crop 10% to 50% removed | 0.675 to 0.694 (rises) | 0.735 to 0.758 (rises, dip at 25%) |
| Blur, sigma 1 to 4 | 0.661 to 0.627 (falls) | 0.733 to 0.688 (falls) |
| Resize | Small not significant | Small not significant |
| Noise | No consistent trend | No trend |
JPEG compression left CNNSpot unchanged with AUROC between 0.655 and 0.660 across all quality levels. UnivFD did not degrade either: its AUROC rose from 0.742 at quality 95 to 0.769 at quality 25 contrary to the expectation under H1. Resizing had an effect on both detectors that was not statistically distinguishable from no effect and Gaussian noise showed no trend because the confidence intervals overlapped heavily.
Cropping produced a result. When 10% to 50% of the area was removed AUROC rose for CNNSpot from 0.675 to 0.694 and for UnivFD from 0.735 to 0.758 (Figure 2). The rise is not strictly monotonic for UnivFD, whose curve dips at 25% removal. Of the five transformations only blur is therefore consistent with H1.
5.3Cross-detector comparison (RQ2) and ordering (RQ3)
UnivFD exceeded CNNSpot in AUROC in every condition, which is consistent with H2 for this pair of detectors. A Spearman analysis of ranking stability could not be run on two detectors. The analysis script returned no output for it. Descriptively the clean-image ordering with UnivFD above CNNSpot was never reversed in any condition. With two detectors this shows only that one outperformed the other consistently. It says nothing about the stability of rankings among a set of detectors.
5.4Compound transformations (RQ4)
Table 4 lists the comparisons between compound chains and their constituents that remained significant after false-discovery-rate correction. Differences are expressed as the constituent’s AUROC minus the compound’s AUROC so a negative value means that the compound chain achieved the AUROC. In five of the six comparisons the compound chain scored higher than the constituent. For chain A, CNNSpot scored 0.029 higher than with resizing and 0.033 higher than with JPEG and UnivFD scored 0.016 higher than with cropping alone and 0.023 higher than with resizing alone. The exception was UnivFD on chain A against JPEG quality 50 where the compound chain scored 0.018 which indicates an architecture-effect. For chain B the only significant comparison was against resizing for UnivFD. Again favoured the compound chain. H4 is therefore not supported by the comparisons tested.
| Detector | Chain | Constituent | AUROC difference* | Corrected p | Higher AUROC |
|---|---|---|---|---|---|
| CNNSpot | A | Resize 0.5 | -0.029 | < 0.001 | Compound |
| CNNSpot | A | JPEG Q50 | -0.033 | < 0.001 | Compound |
| UnivFD | A | Crop 25% | -0.016 | < 0.001 | Compound |
| UnivFD | A | Resize 0.5 | -0.023 | < 0.001 | Compound |
| UnivFD | A | JPEG Q50 | +0.018 | < 0.001 | Constituent |
| UnivFD | B | Resize 0.5 | -0.039 | < 0.001 | Compound |
* Constituent AUROC minus compound AUROC. Only comparisons significant after correction are listed.
6Discussion
6.1Findings by research question
The evidence for RQ1 is. Uneven. Blur consistently lowered AUROC for both detectors. Only by amounts. JPEG, resizing and noise produced changes while cropping raised AUROC. The finding that degradation is not uniform across transformation types agrees with the literature that robustness depends on the degradation applied (Li et al., 2025). However the direction found here for cropping and compression differs from the expectation of loss. The CNN-versus-CLIP difference in RQ2 stayed the same in every condition tested. The ordering of the two detectors never changed (RQ3) which is a result because it is based on a single pair. Compound chains were mostly not more damaging than their constituent steps (RQ4) so a chain should not be assumed to be worse than its step.
6.2Why might cropping raise AUROC?
The crop operation removes a region. Resizes the remaining part to the original canvas, which makes the retained content larger. One untested explanation is that this magnification makes level artefacts more visible to the detector. Alternative explanations include an interaction with the resolution or format differences between the classes that harmonisation may not fully remove and an effect of the resampling step itself. None of these was. The result should be treated as an observation that needs replication, not as a mechanism.
6.3Implications for reliability and governance
These implications are inferences from the evidence above and no organisational deployment was studied. First, a detector’s output is a signal and not proof of image origin. Both detectors missed about half of the images at their optimal thresholds so a negative result gives little assurance. Provenance and watermarking approaches can supply evidence where the generating system supports them and detector output is best combined with signals, metadata and human review in high-stakes settings.
Second reliability appears to be transformation-specific. In this sample blur degraded both detectors compression and resizing did not and cropping scores. A single clean-benchmark number would conceal this pattern so assurance of a detection tool should include a sweep over the processing operations that are for the intended use. For evidence the processing history of an image matters when interpreting a score. For moderation a tool validated on images has not necessarily been validated on the cropped recompressed images that reach the moderation queue.
Third the asymmetry between precision and recall implies that threshold choice is a policy decision. A threshold tuned to avoid flagging images as here will miss ones and the balance between these errors should be set according to the cost of each in the application. Organisations adopting tools should therefore document the threshold, the validation conditions and the known failure cases.
6.4A methodological note
The adapters for Distil-DIRE and AIDE failed on use with the checkpoints because an import path had been copied from documentation without verification, against the cloned repository. This is why they are not evaluated. We record the failure because documentation of a third-party interface is not evidence that it works and extending the pipeline to those detectors will require time for the kind of verification.
7Limitations and future work
Two of four planned detectors were evaluated so findings for RQ2 to RQ4 concern one CNN detector and one CLIP-based detector. Should not be generalised to detectors as a class. The 1,000 real and 1,000 synthetic images give power particularly where intervals overlap. The data come from a reduced community mirror of GenImage with BigGAN in place of Stable Diffusion v1.4 and harmonisation reduces but may not remove real-versus-synthetic confounds. The detectors were used as released so the results describe off-the-shelf robustness and not the best attainable robustness. The baseline AUROC of both detectors is modest which leaves headroom to observe degradation and means that conclusions may differ for detectors. Synthetic transformations cannot reproduce real social-media pipelines benign post-processing was considered, not adversarial manipulation. The mechanism behind the cropping result was not investigated.
Future work should add reconstruction-based and frequency-based detectors so that ranking stability can be tested with three or more detectors, enlarge and diversify the evaluation set test the cropping effect with controlled Resizing alternatives and include transformations drawn from sharing pipelines.
8Reproducibility
The evaluation was made repeatable. Random seeds, package and Python versions GPU type, dataset identifiers and timestamps were recorded in run logs. All detector outputs were stored in one predictions file. Every reported value comes from that file.
The GenImage release is on Baidu Yunpan. This study used the tiny-genimage mirror, which can be downloaded in Colab using the Kaggle API. The CNNSpot checkpoint was fetched with its repository download script. UnivFD was fetched from its repository. Code, transformation definitions and analysis scripts are kept in one repository [ANONYMISED REPOSITORY LINK TO BE INSERTED BY THE AUTHORS BEFORE SUBMISSION]. Distil-DIRE and AIDE were left out of the pipeline.
9Conclusion
This study asked if performance on images shows how AI-generated image detectors react to transformations. Two public detectors, CNNSpot and UnivFD were tested on a shared set of 2,000 images. UnivFD did better than CNNSpot in every case. Only Gaussian blur lowered AUROC for both detectors. JPEG compression, resizing and noise had effects. Cropping increased AUROC. Compound chains were usually no more harmful than their parts. The practical lesson is that robustness depends on the transformation and a clean-benchmark score says little about how a detector will react to a transformation. Claims about a detection tool’s reliability should be based on tests under the conditions in which the tool will be used. Because two detector families were studied on a dataset the conclusions apply only to those detectors and those conditions. More work is needed before the results can be applied to detectors or situations.
References
- [1]Benjamini Y, Hochberg Y (1995). Controlling the false discovery rate: A practical and powerful approach to multiple testing. Journal of the Royal Statistical Society: Series B (Methodological), 57(1), 289–300. https://doi.org/10.1111/j.2517-6161.1995.tb02031.x
- [2]Choi S, Lee H, Lee M (2025). Training-free detection of AI-generated images via cropping robustness. In: Advances in Neural Information Processing Systems (NeurIPS 2025). https://arxiv.org/abs/2511.14030
- [3]Li C, et al. (2025). Bridging the gap between real-world evaluation: Benchmarking image detection in challenging scenarios. In: Proceedings of the IEEE/CVF International Conference on Computer Vision (ICCV), pp. 20379–20389. https://arxiv.org/abs/2509.09172
- [4]Li K, Ren W, Wang W, Cao X (2026). Detecting compressed AI-generated images via phase spectrum robustness. In: Proceedings of the IEEE/CVF Conference on Computer Vision and Pattern Recognition (CVPR).
- [5]Ojha U, Li Y, Lee YJ (2023). Towards universal fake image detectors that generalize across generative models. In: Proceedings of the IEEE/CVF Conference on Computer Vision and Pattern Recognition (CVPR), pp. 24480–24489. https://arxiv.org/abs/2302.10174
- [6]Pellegrini L, et al. (2025). AI-GenBench: A new ongoing benchmark for AI-generated image detection. In: Proceedings of the International Joint Conference on Neural Networks (IJCNN). https://doi.org/10.1109/IJCNN64981.2025.11228377
- [7]TrueMedia.org (n.d.). Distil-DIRE: A lightweight distilled variant of DIRE for image detection [Computer software]. GitHub. https://github.com/truemediaorg/ml-models
- [8]Wang SY, Wang O, Zhang R, Owens A, Efros AA (2020). CNN-generated images are surprisingly easy to spot… for now. In: Proceedings of the IEEE/CVF Conference on Computer Vision and Pattern Recognition (CVPR), pp. 8695–8704.
- [9]Wang Z, et al. (2023). DIRE for diffusion-generated image detection. In: Proceedings of the IEEE/CVF International Conference on Computer Vision (ICCV), pp. 22445–22455.
- [10]Yan S, et al. (2025). A sanity check for AI-generated image detection. In: Proceedings of the International Conference on Learning Representations (ICLR). https://github.com/shilinyan99/AIDE
- [11]Zhu M, et al. (2023). GenImage: A million-scale benchmark for detecting AI-generated image. In: Advances in Neural Information Processing Systems (NeurIPS), Datasets and Benchmarks Track. https://arxiv.org/abs/2306.08571