Queue Management Systems
Digital Queue Management Systems: A Literature Review of Waiting-Time Estimation, Virtual Queues, and Service Operations
Department of Computer Science and Engineering, Sanjay Ghodawat Institute, Atigre, Maharashtra, India
Published October 2026
Abstract
Digital queue systems represent service requests as trackable tokens, allowing progress to be monitored without the need for a physical line. The effectiveness of these systems is determined by how accurately they predict waiting times, how clearly they communicate updates, and how efficiently they support staff activities. This paper examines sixteen studies focusing on delay estimation, virtual queues, customer experience, and the evaluation of queue systems. The research highlights that recent service history and current queue status can provide reliable estimates, while fluctuating demand and limited data can affect accuracy. It also emphasizes that wait time information influences customer behavior, making it an integral part of the service experience rather than just an informational display. While studies show benefits in specific contexts, these findings cannot be directly applied to other service environments. We analyze the reviewed methods and their limitations, identify shortcomings in multi-organization queue systems, and connect these insights to the QueueEase system. The review recommends that evaluations should assess estimate accuracy, update reliability, access control, perceived fairness, and the workload of staff. QueueEase offers a prototype framework for this research; however, it has not yet been tested in a live pilot to confirm these outcomes.
Keywords: Digital queue; virtual queue; waiting-time estimation; delay information; service operations; multi-organization system
1Introduction
Queues influence how people experience services in clinics, colleges, banks, government offices, and customer-support centers. A physical line indicates who is next, but it rarely offers a reliable estimate of how long one might wait. Visitors may have to stay in place to hear their name called, while staff manage calls and record outcomes through local procedures. Digital queues can show progress through a token, but software alone does not ensure shorter waits or fairer service.
Queueing research treats delay estimates as both predictions and messages.
Customers may decide whether to join, stay, or switch to another service after seeing an estimated wait time. These choices can then affect the workload that the estimate is meant to describe. Reviews connect prediction accuracy with customer behavior and the provider’s information strategy [2]. Service operations research also links demand, staffing, routing, and customer behavior [1].
This paper reviews work relevant to QueueEase, a multi-organization digital queue project.
It focuses on wait estimation, customer response to queue information, digital queue operations, and implementation evidence. The aim is to identify design lessons and an evaluation gap, not to claim that QueueEase has improved service outcomes.
2Review method
We carried out a focused narrative review of sixteen research papers published between 2003 and 2025. Eleven of these were published from 2019 onwards, while earlier studies laid the groundwork for estimation and service operations. The selected papers cover topics such as real-time prediction, time-varying demand, virtual-queue behavior, digital queue implementations, or the evaluation of waiting times and customer satisfaction. The set includes both analytical and simulation studies, empirical comparisons of predictors, field experiments, randomized evaluations, surveys, and case studies of systems in use.
We analyzed each study by considering its setting, methodology or technology, reported contribution, and limitations.
Due to the diversity of the findings, a pooled numerical estimate is not feasible. The studies explore call centers, emergency departments, restaurants, campus offices, and ride-sharing queues. We interpret each result within the context of its original setting. This is a focused review, not a systematic review; the search should be expanded and properly documented according to the project guidelines before submitting to a journal.
3Literature review
3.1Estimating waits from queue state and history
Queue-length methods are straightforward, but a simple count does not fully reflect the amount of work remaining when service times differ or staffing levels change.
Ibrahim and Whitt compared queue-length estimates with recent-delay measures, including the delay of the last customer to begin service. Their analysis and simulations showed that using delay history can improve real-time estimates in large, heavily loaded systems [3]. However, performance still depends on the current state of the queue and the information available.
Later research considered varying arrival patterns.
Ibrahim and Whitt found that alternating periods of high and low demand can skew predictions based on recent data if those observations are treated as typical of current conditions. They evaluated improved predictors through simulation [4]. In practical use, this means that an average based on recent data can become outdated after a change in arrival rates or staffing. A system should update estimates from the current state, recognize when there is limited data, and have a backup method rather than presenting an inaccurate estimate as precise.
Smith and Nelson explained that an average waiting time must correspond to a specific time period and be aligned with customer experience [5].
Daily averages might obscure changes throughout the day; uncertainty in an estimated mean is also different from variability in an individual’s wait. In an emergency department, Benevento et al.combined process-mining-derived queue features with linear and nonlinear learning methods. They found lower prediction errors when queue-state features were included with traditional predictors [6]. This supports incorporating process state, although hospital workflows may not apply to other service areas.
Thiongane et al. compared various prediction methods, including history-based predictors, regression, spline regression, and neural networks, using real multi-skill call-center data [7].
Their findings emphasize that candidate methods should be tested against operational data rather than being chosen based on their names alone. These studies together suggest that estimates should be context-aware and evaluated against actual service outcomes.
3.2Customer response to virtual-queue information
Ibrahim’s survey categorizes delay-information research based on how customers respond and how providers decide what information to share [2].
Announcements can help customers plan, but more information is not always better. When visitors select a queue based on displayed estimates, their actions can shift demand. Zhang, He, and Zhao modeled the balance between herding behavior and congestion, showing how visibility of queues can influence customer choices and service policies [8]. Their model warns that a recommendation can alter the workload that made a queue seem appealing.
A large field experiment with a ride-sharing platform tested initial wait information and updates across 1,425,745 rides.
Yu, Zhang, and Zhou found that both the displayed wait time and the pattern of updates influenced customer abandonment [12]. This means that update frequency is both a design choice and a technical consideration. However, platform users and ride-sharing service mechanics differ from visitors waiting in physical queues.
Jo, Chi, and Kim examined waiting fairness and behavioral intentions in both physical and virtual restaurant queues.
In their setting, virtual queues were linked with lower perceived waiting costs [15]. A finding from a restaurant may not apply to a clinic or campus office, where urgency, fairness rules, and information needs vary. Interfaces should present status and estimate changes in an understandable way, and then test comprehension with the intended users.
3.3Digital queues and service outcomes
Bidari et al. evaluated a queue-management system in an emergency department through a randomized controlled study involving 236 patients. They reported shorter actual and perceived wait times and higher satisfaction for the intervention group [9]. The design provides evidence for that specific setting but does not prove that every digital queue has the same effect.
Robbins used discrete-event simulation to study mobile order-ahead systems in quick-service restaurants.
The simulated hybrid queue suggested possible system-wide waiting benefits, but raised concerns about fairness for walk-in customers who see app users bypassing physical lines [10]. The model highlights the need to explain which customers share capacity and how service priority works.
Ehrler et al. evaluated a semi-automatic SMS recall system in an adult emergency department using surveys and system usage logs. Patient responses were mostly positive, while caregivers raised concerns about increased workload [11]. Leemanza and Kristin looked at wait-time targets and satisfaction feedback in an outpatient pharmacy using an interrupted time-series intervention. They found shorter waits during the intervention period, though the usual limitations of a single-site design apply [14]. These studies link user convenience with staff effort and operational practices.
Campus-based work is particularly relevant to QueueEase. Deoraj, Essop, and Aroba describe a virtual queue system for Durban University of Technology, focusing on service access and data security [13]. Vergara and Orozco present a virtual queue case study in selected university offices and assess client satisfaction and staff productivity [16]. Both studies are grounded in their institutional contexts; they focus on design rather than universal performance standards.
3.4Comparing evaluation methods
Analytical queue models can explain how an operating rule functions under certain assumptions, but they cannot demonstrate how a specific interface will be used. Simulation allows researchers to compare scenarios that may be hard to manipulate in real-world settings, although its conclusions depend on the model's inputs. Historical-data prediction studies can test whether additional queue features improve estimates, but they do not inherently show that displaying the estimate improves the customer experience. Field experiments and randomized trials can estimate effects within their study settings, while surveys and case studies help uncover usability and implementation issues.
This distinction is crucial when comparing published outcomes. The ride-sharing experiment tests how information affects real customer abandonment on a large scale [12], while a simulated order-ahead system explores how app orders and walk-ins interact [10]. The emergency-department trial evaluates a queue intervention with patient outcomes [9], whereas the SMS study includes caregiver perspectives and use logs [11]. These papers complement each other, but their measures cannot be placed on a single scale. A sound review reports what each design can establish and avoids ranking systems based on results collected under different service rules.
For a small multi-counter pilot, a transparent baseline may be more useful than a complex model that is hard to explain. A team can compare a configured service-time fallback, a recent-history estimate, and an estimate that also accounts for work ahead. It should use the same test cases or time periods for each method and report mean absolute error as well as the direction of error. Overestimates and underestimates can have different consequences: an underestimate may cause a visitor to return too early, while a large overestimate may discourage joining. The evaluation should describe both rather than hiding them in one average.
Prediction should also be evaluated by demand condition. A model that performs acceptably during a quiet period may fail after a staffing change or arrival surge. Reporting results separately by service, time block, and workload can reveal where an estimator is useful. Where a service has too few completed tokens to support a stable average, the interface can show a broad estimate or state that the estimate is unavailable. The literature does not establish one threshold for every service; the project must define and justify its own fallback rule.
A comparison table (Table 1) helps expose a second pattern: newer technology does not automatically mean stronger evidence. Some recent studies use advanced prediction methods but still rely on one institution’s records [6–8]. Other studies use established interventions and stronger designs to estimate outcomes in a narrowly defined setting [9], [12]. A literature review should therefore compare both the method and the evidence level. A neural model evaluated on a single historical dataset may support a prediction claim, while a randomized intervention can support a causal claim for its participants. Neither alone demonstrates that a complete multi-organization queue platform will work under every operating condition.
Operational outcomes should be separated from user outcomes. Average wait, queue length, and staff utilization describe system behavior. Perceived waiting, trust, satisfaction, and willingness to remain describe user response. A lower perceived wait does not necessarily mean the service completed work faster, and higher throughput does not guarantee that every user considers the process fair. The emergency-department and restaurant studies illustrate why both views matter [9], [11], [12], [15]. A well-designed evaluation reports these measures separately and explains how they relate.
The role of real-time communication deserves separate attention. An update can reassure a user that the token is still active, but it can also create a new expectation. If the displayed wait changes often, visitors may interpret the change as instability; if it changes rarely, the number may become stale.
The ride-sharing experiment shows that both wait time and update methods can influence customer abandonment [12].
A counter service should test an update policy that matches its operations instead of copying a schedule from another industry.
Accessibility and service urgency also impact virtual waiting.
A smartphone interface may make waiting easier for some visitors, while excluding those without reliable connectivity or comfort with mobile apps. Emergency or priority services may require triage rules that do not follow a simple first-in-first-out order. The studies reviewed here do not resolve these policy questions for QueueEase. A deployment should maintain an assisted or in-person route where needed and make priority rules visible without disclosing private information.
Finally, the quality of evidence depends on data definitions.
Studies may define the waiting interval as arrival-to-first-contact, token-to-call, or order-to-ready. These durations are not interchangeable. Before comparing systems or reporting an improvement, a team must define the event timestamps, exclusions, and treatment of cancellations and no-shows. The prediction literature emphasizes time-specific estimates [5], while implementation studies show the need to consider workflow and user experience [9], [11], [14]. Clear definitions make later comparisons reproducible.
3.5Design implications for a multi-organization system
Virtual queues change where a customer waits, but they do not remove the need to manage service priority.
A physical line offers visible evidence of order, while a virtual line relies on a token record and communication from the system. If tokens can be cancelled, skipped, called, or reassigned, each transition should have a clear rule and an auditable timestamp. A visitor needs to know whether a token remains active; staff need to know which actions they may take; administrators need records that explain what happened when a queue is disputed.
Multi-organization software adds a further requirement: every request must be checked against both the user’s role and the organization or service that owns the record.
The literature on service operations emphasizes assignment and routing as determinants of performance [1], while campus system work identifies security as a central design concern [13]. These ideas translate into testable requirements: an organization administrator should see only that organization’s data, and a staff account should operate only on the service to which it is assigned. Such checks should be performed at the API and database boundary, not only by hiding controls in the interface.
Live status is useful only when it remains consistent with stored queue state.
Server-sent events can push updates to a connected browser, but a disconnected client needs a way to recover current state. A robust workflow therefore combines persisted state with event delivery: the event informs the client that a change occurred, while a fresh API read restores the authoritative token status after reconnecting. The studies reviewed here focus mainly on prediction and customer behavior; cross-process delivery and reconnection are technical questions that QueueEase must verify directly.
Notification content should also avoid revealing more information than necessary.
A token status update can inform a visitor without broadcasting another visitor’s identity or queue history. Administrative exports should likewise contain only the fields needed for operations. The project report describes authentication sessions, role controls, audit records, and rate limits. Implementation of these controls still requires verification through positive and negative access tests. A successful screen demonstration alone does not prove isolation.
4Comparison of reviewed studies
| Author / year | Method or technology | Reported contribution | Limitation |
|---|---|---|---|
| Gans et al., 2003 [1] | Review of call-center operations | Connects demand, staffing, routing, and customer response. | Call centers differ from walk-in multi-service counters. |
| Ibrahim, 2018 [2] | Survey of delay-announcement research | Organizes prediction, customer response, and disclosure choices. | Review identifies context dependence; no single design fits all. |
| Ibrahim & Whitt, 2009 [3] | Queue-state and delay-history estimators; analysis and simulation | Shows recent customer delays can inform live estimates. | Results depend on the model and operating conditions. |
| Ibrahim & Whitt, 2011 [4] | Refined history predictors under time-varying arrivals | Shows non-stationary demand can bias delay-history estimates. | Many-server model; not a software implementation evaluation. |
| Smith & Nelson, 2015 [5] | Simulation and interpretation of waits | Clarifies time-specific waits and individual variability. | Illustrative service setting; no virtual interface comparison. |
| Benevento et al., 2019 [6] | Process mining; linear and nonlinear predictors on ED data | Queue features improved predictions in the studied ED. | Hospital workflow may not transfer to other sectors. |
| Thiongane et al., 2020 [7] | Empirical comparison of regression, splines, neural nets, history | Compares predictors using real multi-skill call-center data. | Call-center workload and skill routing are setting-specific. |
| Zhang et al., 2020 [8] | Analytical queue model of herding and congestion | Explains how visible queues can affect joining and service choices. | Theoretical model; no multi-service application test. |
| Bidari et al., 2021 [9] | Randomized controlled queue-system evaluation | Reports wait and satisfaction differences in an ED. | One hospital context; effect is not universally transferable. |
| Robbins, 2021 [10] | Discrete-event simulation of app and walk-in queue | Studies system wait and fairness in a hybrid queue. | Simulation assumptions; not a field deployment. |
| Ehrler et al., 2022 [11] | SMS intervention; user survey and use logs | Reports patient acceptance and staff-workload concerns. | Single clinical context; remote waiting is not for every patient. |
| Yu et al., 2022 [12] | Large randomized field experiment in ride-sharing queues | Shows wait magnitude and updates affect abandonment. | Platform-specific behavior and service mechanics. |
| Deoraj et al., 2024 [13] | Campus virtual-queue system design and security discussion | Applies virtual queues to university service access. | Institution-specific; limited measured outcome evidence. |
| Leemanza & Kristin, 2024 [14] | Interrupted time-series in outpatient pharmacy | Studies wait targets and satisfaction feedback alongside wait. | Single site and intervention; other changes may affect results. |
| Jo et al., 2025 [15] | Physical versus virtual restaurant waiting study | Links perceived waiting equity with customer intentions. | Restaurant context and behavioral outcomes only. |
| Vergara & Orozco, 2025 [16] | University-office virtual queue case study | Examines client satisfaction and staff productivity. | Selected offices; results depend on local implementation. |
5Research gap
The reviewed work provides useful predictors and evidence showing that digital queues can impact customer experience, but there are still important gaps when it comes to shared systems used by multiple organizations. Most studies on prediction focus on a single type of service or model. For instance, a campus office, a clinic, and a bank may differ in terms of customer arrivals, service times, priority rules, and staffing levels. An estimate cannot be considered accurate until it is compared with actual observations from the specific service and time period in question [2], [4–7].
Queue information can also influence customer behavior.
Field and customer studies show that displayed waiting times, update patterns, and perceived fairness are linked to decisions about abandoning a queue or deciding to wait [10–12], [15]. As a result, a system needs to evaluate not only the accuracy of predictions but also the messages shown to users. Operational feasibility also involves factors like staff workload and access limits. These issues are commonly discussed in queue system studies [9], [11], [13], [16], and tenant isolation and staff permissions limited to specific services require explicit software testing.
The QueueEase project addresses an integration gap by ensuring that queue lifecycle management, service schedules, staff assignments, organizational boundaries, and live updates all function together within a single application.
QueueEase is designed with these functions in mind. This is a practical design contribution, not proof that it is better than existing systems. A pilot study is needed to determine whether the combined workflow is reliable and useful.
Three research questions arise from this gap. First, how does an estimate based on recent service history compare to one that also considers the current state of the queue across different services and periods of demand? Second, how reliably do queue changes reach connected users under normal operation and after a client reconnects? Third, can visitors and staff complete workflows specific to their roles while the API prevents access outside their assigned organization and service? These questions can be addressed using logged system observations and structured acceptance tests, without requiring the team to claim a reduction in waiting time before collecting evidence.
6Proposed work: QueueEase
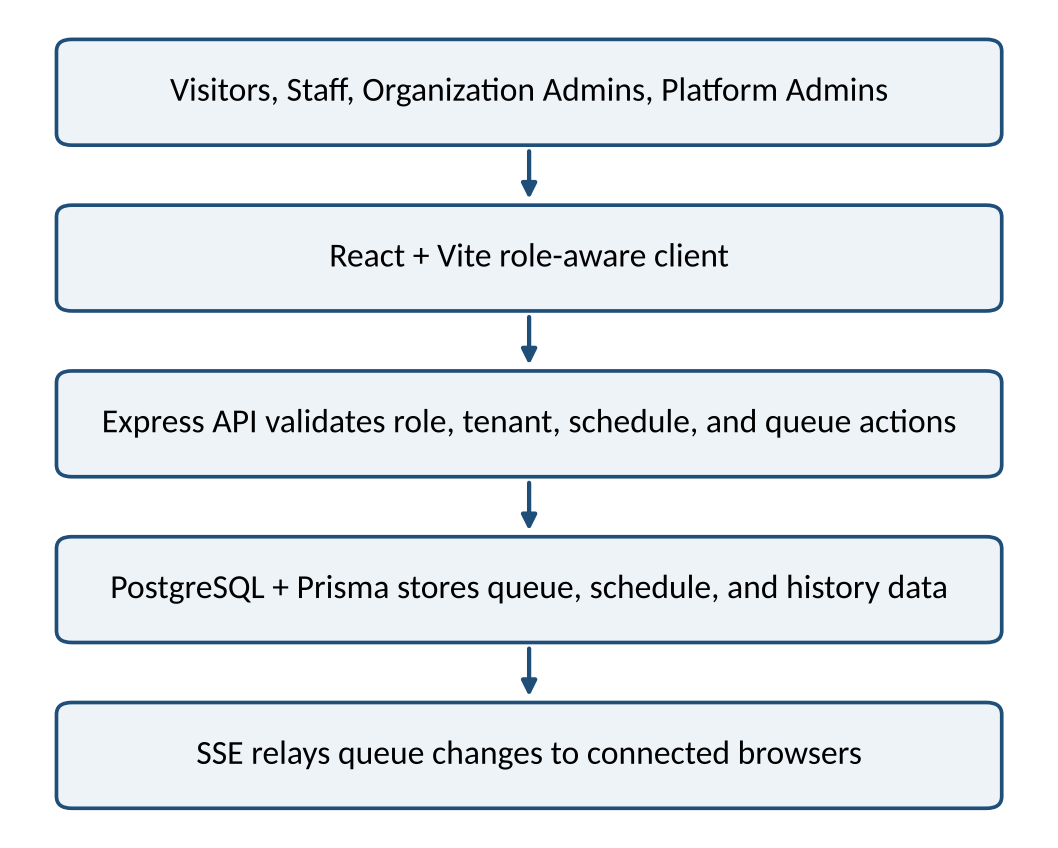
QueueEase is a web-based system used by multiple organizations. Visitors choose an organization and a service, request a token, monitor the status of their token and an estimated waiting time, and can cancel a token if eligible. Staff handle the queue for their assigned service. Organization administrators are responsible for managing local staff, services, counters, schedules, and operational records. Platform administrators manage organization data and assign administrator roles. The project report outlines the use of a React/Vite client, an Express API, PostgreSQL via Prisma, and Server-Sent Events with a PostgreSQL-backed relay [17].
The wait estimate is based on the durations of completed services and the current workload in the queue. Figure 1 shows the workflow and data flow of the system.
This approach aligns with existing literature that emphasizes recent service history and the current state of the queue, but it is not a trained forecasting model and has not been tested against real-time wait times [3–7]. QueueEase should clearly indicate that these estimates are approximate and should compare each estimated wait time with the actual time taken to serve the visitor before making any claims about accuracy.
The proposed evaluation includes four key components.
First, it involves recording displayed estimates and actual wait times, and then calculating absolute errors for each service and time period. Second, it records the times events are created and when clients receive them, and tests how the system behaves when reconnecting. Third, it checks the ownership of tokens, staff assignments, and whether organizations are properly isolated from each other. Fourth, it collects visitor feedback and measures staff workload in a pilot study approved by a guide. The report should include details about the sample, test environment, any missing data, and any changes in staffing or schedules during the study.
For the estimation part, it is important to define start and end timestamps before gathering data.
For instance, the actual wait time can be measured from when a token is successfully created until the first allowed call to service, and a separate measure can be taken for the time from the call to the actual start of service if the workflow distinguishes these stages. Each estimated wait time should be compared with the corresponding actual wait time, and the number of observations, mean absolute error, and signed error should be reported. Results should be organized by service and time period to ensure that strong performance in one service does not mask weak performance in another. If a token is cancelled or skipped, it should be decided in advance whether it is excluded from analysis or treated separately.
For live updates, the creation and reception times of events should be recorded using synchronized clocks.
The system's behavior should be tested during the initial connection, normal status updates, temporary network loss, reconnection attempts, and a refresh of the status after reconnection. Authorization should be tested by creating test accounts for each role and attempting both allowed and disallowed actions, including requests across different organizations. Expected and actual results should be documented in a test table. For a user study, simple questions about token status, expected wait times, and perceived fairness should be asked, and the number of respondents and the recruitment method should be recorded. A small student project can generate meaningful pilot data if it honestly reports on these conditions.
7Evaluation plan
A pilot should start with a clear service, schedule, and queueing policy. The team needs to choose a small number of services with guidance and approval from the organization, identify the staff involved, and note the dates and conditions for each observation. The baseline period should use the same definitions as the QueueEase period. If there are changes in staffing, service hours, or eligibility rules during the study, the report should document the change rather than blaming the software for every difference.
For each eligible token, record the time it was issued, the first time it was called, when service started, the final outcome, and the estimate shown to the visitor at that moment.
One key measure is the difference between the displayed wait time and the actual wait time from token creation to the first call. The mean absolute error gives an idea of the typical error size in predictions, while signed error shows if estimates are generally too high or too low. It is important to report the number of observations and their distribution, as a single average can hide a few very long waits. Cancellations and skipped tokens should be analyzed separately or excluded based on a rule decided before looking at results.
Technical tests should run at the same time as service measurements.
For real-time delivery, track when events are created, when they are published, and when they are received by the browser. Test typical updates, multiple connected clients, lost connections, reconnections, and fresh status reads. For authorization, create accounts for each role and try actions that are allowed and denied. Include scenarios like a visitor requesting another user’s token, staff acting on an unassigned service, and an administrator accessing a different organization. Record both the expected and actual responses and avoid including personal data in screenshots or exported test results.
User feedback should ask if participants understood their token status, if the estimated wait was helpful, and if the process felt fair and orderly.
Staff feedback should cover the time needed to call and update tokens, missed notifications, and extra administrative tasks. Use a short and consistent form and report how many people responded. The pilot should not promise that waiting time will decrease; instead, it should check if the workflow works and provide an initial view of errors, usability, and the workload involved.
Several factors could affect the results.
A short observation period might miss changes in demand that happen seasonally or during the day. People might act differently because they know the pilot is being studied. Staff might learn the software during the measurement time, and low token volume could make average service times unstable. Comparing before and after without considering other changes such as staffing or policy updates can lead to inaccurate conclusions. These limitations can be minimized by documenting the context, collecting enough observations where possible, comparing similar service periods, and treating the first deployment as a pilot rather than a final evaluation.
8Conclusion
The studies discussed here indicate that digital queues can help make the progress of service more visible, but their effectiveness relies on accurate estimation, clear communication, established operating rules, and the specific needs of the service being provided. The current state of the queue and the service history can assist in making more reliable estimates; however, fluctuating demand and limited data can introduce uncertainty. Providing wait times can influence customer choices, and the workload of the staff can determine whether a system is feasible to implement. Insights from various sectors including healthcare, restaurants, ride-sharing services, and universities provide useful strategies and important considerations, but these should not be applied without similar evidence from the specific context. Therefore, the review advocates for a cautious approach: clearly explain the estimates used, define how service outcomes will be measured, and thoroughly test the entire process within the intended environment.
9Future scope
QueueEase integrates visitor tokens, service-specific staff actions, administration tools, schedules, estimates, and live updates into a single prototype. Future steps should validate the entire workflow and assess performance through real-world observations. The team can compare historical estimates with queue-state approaches, evaluate update frequency and fairness, and test additional services after ensuring security and functionality. Further research could explore accessible and multilingual interfaces, alternative notification methods, and system performance under increased queue loads. Any claimed benefits should be supported by documented pilot studies, not just implemented features alone.
References
- [1]Gans N, Koole G, Mandelbaum A. Telephone call centers: Tutorial, review, and research prospects. Manuf Serv Oper Manag. 2003;5(2):79–141. https://doi.org/10.1287/msom.5.2.79.16071
- [2]Ibrahim R. Sharing delay information in service systems: A literature survey. Queueing Syst. 2018;89:49–79. https://doi.org/10.1007/s11134-018-9577-y
- [3]Ibrahim R, Whitt W. Real-time delay estimation based on delay history. Manuf Serv Oper Manag. 2009;11(3):397–415. https://doi.org/10.1287/msom.1080.0223
- [4]Ibrahim R, Whitt W. Real-time delay estimation based on delay history in many-server service systems with time-varying arrivals. Prod Oper Manag. 2011;20(5):654–667. https://doi.org/10.1111/j.1937-5956.2010.01196.x
- [5]Smith JS, Nelson BL. Estimating and interpreting the waiting time for customers arriving to a non-stationary queueing system. In: Proc. Winter Simulation Conference (WSC). 2015. p. 2610–2621. https://doi.org/10.1109/WSC.2015.7408369
- [6]Benevento E, Aloini D, Squicciarini N, Dulmin R, Mininno V. Queue-based features for dynamic waiting time prediction in emergency department. Meas Bus Excell. 2019;23(4):458–471. https://doi.org/10.1108/MBE-12-2018-0108
- [7]Thiongane M, Chan W, L’Ecuyer P. Delay predictors in multi-skill call centers: An empirical comparison with real data. In: Proc. 9th Int. Conf. Operations Research and Enterprise Systems (ICORES). 2020. p. 100–108. https://doi.org/10.5220/0009181401000108
- [8]Zhang H, He QM, Zhao X. Balancing herding and congestion in service systems: A queueing perspective. INFOR Inf Syst Oper Res. 2020;58(3):511–536. https://doi.org/10.1080/03155986.2020.1734902
- [9]Bidari A, Jafarnejad S, Faradonbeh NA. Effect of queue management system on patient satisfaction in emergency department: A randomized controlled trial. Arch Acad Emerg Med. 2021;9(1):e59. https://doi.org/10.22037/aaem.v9i1.1335
- [10]Robbins TR. The impact of mobile order ahead apps on QSR queuing. J Strateg Innov Sustain. 2021;16(2). https://doi.org/10.33423/jsis.v16i2.4298
- [11]Ehrler F, Rochat J, Siebert JN, Guessous I, Lovis C, Spechbach H. Use of a semiautomatic text message system to improve satisfaction with wait time in the adult emergency department: Cross-sectional survey study. JMIR Med Inform. 2022;10(9):e34488. https://doi.org/10.2196/34488
- [12]Yu Q, Zhang Y, Zhou YP. Delay information in virtual queues: A large-scale field experiment on a major ride-sharing platform. Manage Sci. 2022;68(8):5745–5757. https://doi.org/10.1287/mnsc.2022.4448
- [13]Deoraj S, Essop MS, Aroba OJ. Investigating a virtual queueing system for Durban University of Technology: A comprehensive review approach to improve efficiency. In: Proc. 2024 Conf. Information Communications Technology and Society (ICTAS). 2024. p. 38–44. https://doi.org/10.1109/ICTAS59620.2024.10507144
- [14]Leemanza Y, Kristin E. Effectiveness of wait time targets and patient satisfaction feedback in decreasing wait times for prescription services in an outpatient pharmacy. Can J Hosp Pharm. 2024;77(1):e3438. https://doi.org/10.4212/cjhp.3438
- [15]Jo EH, Chi OH, Kim J. How waiting decisions are made: A comparison of restaurant waiting equity and behavioral intentions in physical and virtual queues. J Hosp Tour Manag. 2025;63:140–152. https://doi.org/10.1016/j.jhtm.2025.03.009
- [16]Vergara K, Orozco MM. Virtual queuing management system towards client satisfaction and staff productivity in selected offices at University of Perpetual Help System—Pueblo de Panay. Int J Res. 2025;12(4):709–721. https://zenodo.org/records/15347517