Supply Chain Management
Integration of Construction Supply Chain Management and Project Controls for Improved Cost Performance in Mega Projects
Published October 2026
Abstract
Cost escalation in megaprojects is frequently recorded as a project-controls problem although a material proportion of its antecedents originates outside the conventional cost ledger: in supplier capacity, procurement decisions, fabrication readiness, delivery uncertainty and poorly sequenced site work. This integrative review examines how construction supply chain management (CSCM) can be connected to project controls to improve the timeliness and reliability of cost decisions. Thirty DOI-identifiable publications dated 2020–2025 provide the core analytical literature, complemented by critical examination of the managerial mechanisms linking procurement and production information to schedule and cost forecasts. The review adopts thematic synthesis rather than a statistical meta-analysis because the publications differ in design, context and outcome measures. Four interdependent mechanisms emerge: a common work-package data structure; supplier-informed lookahead and change control; reconciliation of earned value, commitments and remaining exposure; and governance that assigns accountability for corrective action. An integrated control architecture and an explicitly hypothetical, internally reconciled numerical example illustrate how cost signals can change when upstream commitments and schedule consequences become visible. The argument is not that technology independently creates savings, but that decision quality improves when trusted supply-chain evidence is translated into actionable project forecasts. The paper develops research propositions and a validation agenda for complex, multi-contractor delivery environments, while identifying contractual, data-quality and organizational conditions under which integration may fail.
Keywords: construction supply chain management; project controls; megaprojects; cost performance; procurement integration; earned value management; cost forecasting
1Introduction
Mega projects bring together extensive networks of owners, designers, engineering contractors, specialist fabricators, logistics providers and subcontractors. Their schedules span extended periods, and their production systems must accommodate design development, shifting site access, long-lead equipment and competing demands upon regional supplier capacity. A cost report, however technically accurate, cannot explain future expenditure if it only reproduces accounting transactions already incurred. The economic consequences of a late technical approval may develop in the supply network long before a visible schedule variance or invoice is recorded. This mismatch between the location of emerging risk and the location of formal measurement provides the central problem addressed here (Denicol et al., 2020; Stefano et al., 2023).
Project controls conventionally assemble scope, the work breakdown structure, schedule, budgets, progress measurements, commitments, changes, risk allowances and forecasts. Construction supply chain management coordinates sourcing, production, transportation, storage, interfaces and supplier relationships. These functions are often administered through separate teams and software systems even when their decisions concern the same work packages. Such functional segmentation makes a delay in engineering approval appear operational to the procurement team, contractual to the commercial team and temporal to the planning team, although its eventual financial consequence is shared. Zenezini et al. (2024) report evidence that integrated supply-chain platforms can influence time and risk management without demonstrating a direct independent effect upon cost management. The finding cautions against assuming that software expenditure automatically delivers savings.
The distinction is especially important where numerous projects draw upon overlapping pools of equipment, materials and specialist labour. A package may be reported as under budget because purchase orders have yet to be placed, not because its eventual cost is lower. Conversely, a procurement package may exceed its original allowance after scope growth even when its purchasing performance has been effective. Timely control therefore requires consistent treatment of authorised change, supplier pricing, commitments, physical accomplishment, remaining work and contingent exposures. The broader megaproject literature calls for managing cross-organisational production systems rather than treating cost and schedule symptoms in isolation (Stefano et al., 2023; Zani et al., 2024).
The aim of this review is to develop a defensible, operationally useful account of how coordination between CSCM and project controls can improve the quality of cost prediction and corrective decisions in mega projects. Its objectives are to (i) distinguish the distinct information and decision responsibilities of each function; (ii) identify the causal pathways by which supplier and logistics conditions affect cost outcomes; (iii) synthesise integration mechanisms capable of converting early warnings into accountable control actions; and (iv) formulate a measurable conceptual architecture and future research propositions. These objectives differ from studies focused primarily on general supply-chain resilience: the present unit of analysis is the work-package-to-forecast decision cycle.
Three research questions guide the paper. First, which information discontinuities prevent supply-chain intelligence from appearing in project cost forecasts? Second, through which schedule, commitment, risk and change-control mechanisms could integration alter cost performance? Third, what governance arrangements and performance indicators would permit a credible evaluation of such integration? The contribution is a bridging framework that combines the network-level perspective developed by Stefano et al. (2023) with recent work on cost-control systems (Zahoor et al., 2021; Yilmaz et al., 2025), and maintains a clear separation between documented evidence, analytical interpretation and illustrative calculations.
2Conceptual foundations
2.1Supply-chain coordination as an economic control problem
Construction procurement is sometimes reduced to purchase-order administration, yet package cost is determined by a sequence of linked decisions. Specification stability shapes viable supplier options; capacity reservation changes quoted prices; factory slots constrain delivery dates; site readiness determines unloading and storage requirements; and sequencing changes the productivity of installation crews. Where these decisions are isolated, individual participants can optimise their own budgets while transferring delay, inventory or rework costs to others. Mesa et al. (2020) model the significance of integration among organisations in an integrated delivery setting, demonstrating why contractual and behavioural arrangements matter alongside information exchange.
Elmughrabi et al. (2020) formulate collaborative construction supply-chain planning as a joint project scheduling and material-ordering problem, rather than as two sequential activities. The implication for control is substantial. A schedule update should not merely announce when materials will be needed: it should be tested against fabrication capacity, transport constraints, available storage and the financial consequences of shifting deliveries. The appropriate economic question is the change in total delivered and installed cost, not simply whether the purchase order is cheaper. The resource-allocation analysis by Zhang et al. (2023) similarly highlights the relevance of production, transport and time-window decisions to prefabricated construction logistics.
Cross-project interactions create another layer of dependence. Ekeskär et al. (2022) show how shared logistics arrangements can require cooperation among main contractors whose commercial interests remain competitive. A delayed shipment in one package may appropriate a crane booking, road access slot or warehouse capacity already allocated to another. Such externalities often escape a single contractor's cost coding. The analytical boundary must therefore be wide enough to identify network effects, while the reporting structure remains sufficiently granular to assign actions, responsibility and recoverable costs.
2.2Project controls as measurement and prediction
Project controls are most valuable when they establish a credible view of future final cost rather than merely document historical variance. Earned value management (EVM) brings together planned value (PV), earned value (EV) and actual cost (AC), with cost performance index CPI = EV/AC and schedule performance index SPI = EV/PV. These measures permit standardised interrogation of progress, but interpretation depends on the quality of the baseline, rules of credit and cost accrual. Zahoor et al. (2021) evaluate EVM in building projects and explain why reporting financial expenditure without its relationship to actual progress weakens forecasts.
Recent evidence also discourages treating any one completion formula as universally accurate. Elsaid et al. (2025) compare earned-value-related forecasting techniques across 30 construction projects, demonstrating that forecasting performance is an empirical question that depends on project context and stage. Ates and Eirgash (2025) illustrate the managerial usefulness of integrated scope, time and cost indicators in infrastructure case studies. Neither contribution implies that CPI alone captures unfinished fabrication risk, supplier insolvency exposure, non-approved variations or poorly timed orders. Conventional forecasts require contextual interpretation and additional forward-looking information.
Accordingly, cost forecasting should reconcile several distinct quantities: cost already incurred; value and timing of irrevocable purchase commitments; independently estimated cost to finish work not yet committed; probable consequences of approved or pending changes; and exposure from materialised or plausible delivery risks. A cost-performance index can provide one diagnostic estimate at completion, whereas a package-informed bottom-up forecast can explain which purchase orders, delivery obligations and installation assumptions account for the projected remainder. The two forecasts should challenge each other, not be combined mechanically in a way that double counts existing commitments.
2.3Governance, integration and control rights
Data exchange alone cannot resolve conflicting decision incentives. The commercial manager may seek fixed pricing before design stabilises; the planner may prefer accelerated release; the supplier may resist reserving scarce factory capacity without a deposit. Integrated project delivery research stresses the effect of collaborative commercial structures on how participants disclose constraints and resolve trade-offs (Ashcraft, 2022). The value of an integrated control process consequently depends upon governance that permits whole-project decisions without making one party absorb every short-term disadvantage.
Lovallo et al. (2023) argue that governance of large projects should address behavioural and institutional sources of underperformance, while Farid et al. (2025) identify shortcomings in reporting, competency availability and unsystematic risks from project-owner cases. These observations matter for the proposed framework because a dashboard can display a warning that no authorised individual is empowered to act upon. Clear escalation thresholds, documented decision rights, and the separation of forecast production from commercial claims management are required to prevent signals from becoming passive records.
3Review design and analytical method
This article uses a focused integrative literature review with structured thematic comparison. An integrative approach is appropriate because the question spans different but connected bodies of work: construction logistics, cost engineering, project planning, digital integration, collaborative procurement and megaproject governance. A statistical meta-analysis would be misleading: the available contributions mix quantitative surveys, simulation, modelling, case studies, methodological papers and literature reviews, with no common intervention or cost-outcome definition. The synthesis therefore seeks explanatory mechanisms and boundary conditions rather than a pooled effect size (Denicol et al., 2020; Stefano et al., 2023).
The analytical corpus was assembled by targeted discovery of publications dated from January 2020 to December 2025 whose titles, abstracts or full text connected at least two of the following concepts: construction supply chains, procurement, logistics, project planning, progress measurement, cost estimating, forecasting, governance or megaproject delivery. The thirty works listed in the references were selected for topical relevance and a traceable DOI, not as a claim that the complete universe of eligible studies was retrieved. A publication was treated as directly relevant when it supplied evidence about a plausible link between upstream operations and downstream project-control decisions; general sustainability or technology work was used only where its coordination mechanism could be specified. The uploaded examples informed the analytical framing, but sources published outside the requested period were not cited.
Evidence extraction was organised around the unit of analysis, method, information interface, decision mechanism, measured outcome, and limitations of transfer. Each publication was first read for its stated finding rather than for an anticipated supporting conclusion. Results concerning technologies were differentiated from evidence concerning the organisational adoption of the technology. Likewise, an author’s proposed model was distinguished from an implemented and measured effect. Thematic comparison then grouped the evidence into visibility and data structure, temporal alignment, financial reconciliation, commercial governance and adaptive intervention. Contradictions were retained rather than averaged away; in particular, evidence of improvements in time or risk was not recoded as demonstrated cost savings.
Methodological quality was assessed interpretively by asking whether each claim had a clear unit of observation, a proportionate research method, stated measurement rules and transparent limitations. Numerical study characteristics are reported in Table 1 to show the heterogeneity of the literature; they are not combined into a cross-study success rate. This review neither reports invented database screening totals nor asserts exhaustive coverage. Its main limitation is deliberately bounded retrieval and the predominance of evidence produced outside the exact conditions of a single Saudi giga project. This transparency makes the resulting framework suitable for further testing rather than presenting it as already validated.
| Study | Design | Numerical basis | Interpretive scope |
|---|---|---|---|
| Denicol et al. (2020) | Research synthesis | 6,007 records; 86 full papers | Megaproject performance |
| Stefano et al. (2023) | Literature review | 2,106 abstracts; 94 full papers | Megaproject supply networks |
| Zani et al. (2024) | Literature review | 10,078 records; 141 full papers | Organisation design |
| Zenezini et al. (2024) | Survey and modelling | 594 invitations; 197 replies; 172 retained | Digital platforms; cost/time/risk |
| Elsaid et al. (2025) | Forecast comparison | 30 construction projects | Earned-value accuracy |
| Ateş and Eirgash (2025) | Applied case analysis | 2 infrastructure projects | Earned-value decision support |
Note: Counts describe distinct methods and cannot be combined into a pooled effect.
4Synthesis of integration mechanisms
4.1Shared work-package identifiers and trustworthy data
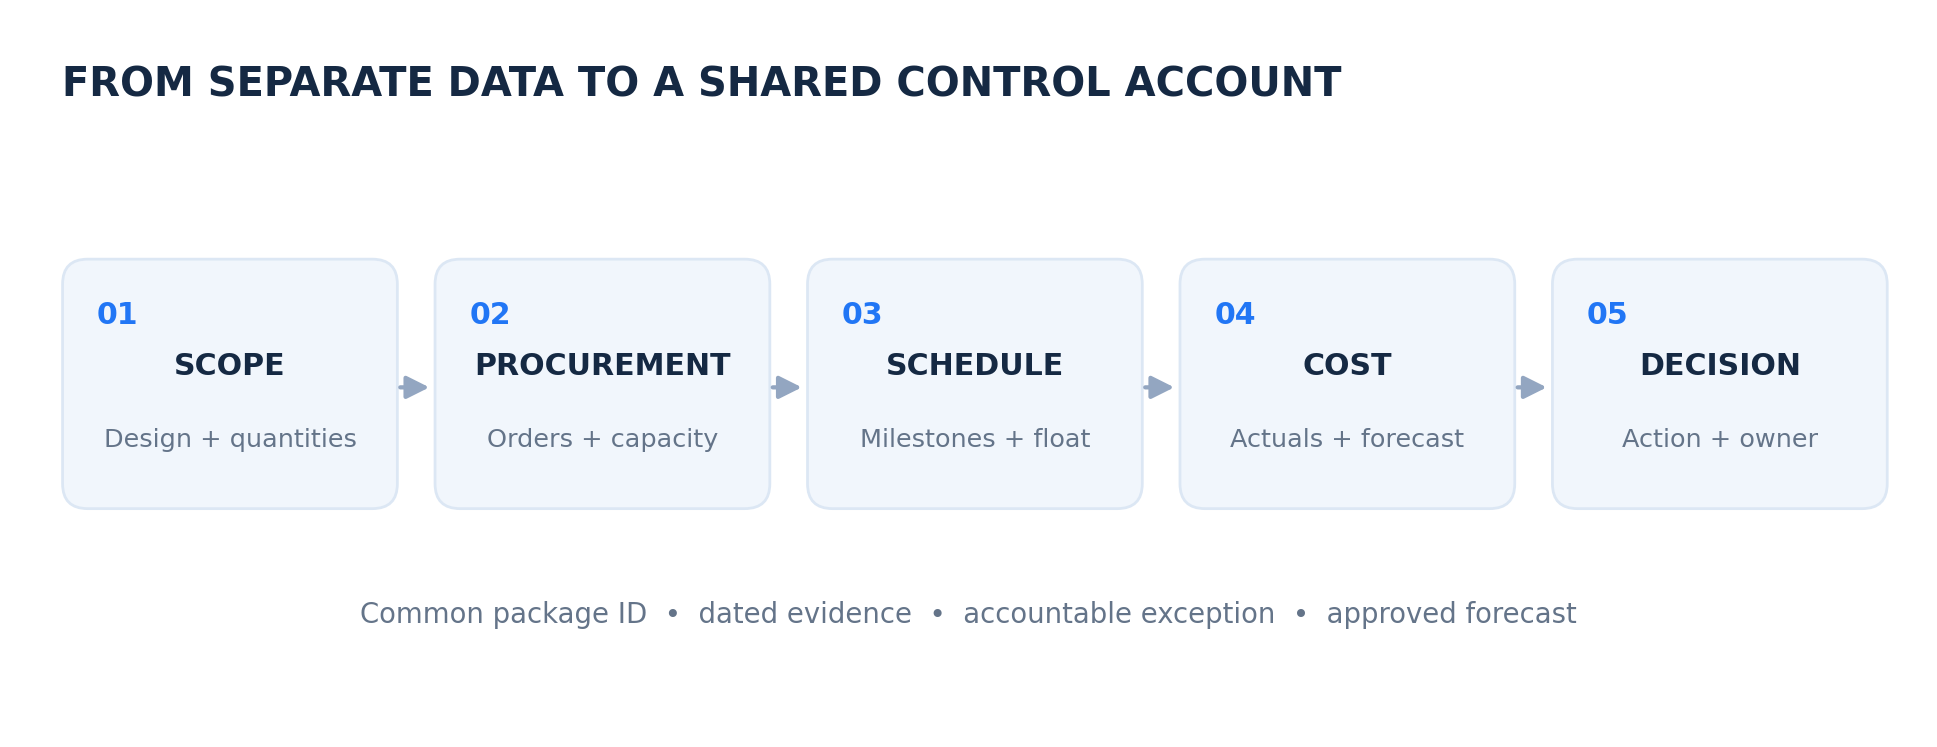
The primary technical interface is a common description of the work. Engineering quantities, procurement requisitions, purchase orders, delivery batches, schedule activities, installed quantities and cost codes commonly have different identifiers. An aggregation designed for accounting may not identify the item that controls a critical lift. An engineering bill of quantities may split components differently from subcontract payment applications. Unless these objects can be mapped to a stable control account or work package, a purchasing exception cannot be reliably interpreted in the final cost forecast. Yilmaz et al. (2025) support connecting cost processes to model-based information, while Rahman et al. (2025) demonstrate how model requirements, progress entry and earned-value reporting may be linked.
A robust information architecture needs both common keys and controlled differences. Supplier names, delivery destinations, item specifications, drawing revisions, approved change references and tax treatment should be standardised. The system also needs a timestamp and evidence owner for each status field. The status 'shipped', for example, should not be mistaken for 'delivered', and 'delivered' should not mean 'inspected and available for installation'. These distinctions are cost relevant because the project may incur demurrage, rehandling, standing time or accelerated logistics between those states. BIM-supported procurement procedures can strengthen traceability, but they do not remove the need for transactional data stewardship (Popov et al., 2021; Elghaish et al., 2023).
Integration must also recognise information asymmetry. A supplier may disclose promised dispatch dates but not detailed capacity constraints; a subcontractor may have reason to withhold its recovery plan during a claim; and a construction manager may report nominally completed quantities that are not available for successor work. Access controls and independent verification are therefore part of the measurement design, not an optional cyber-security appendix. Perera et al. (2022) emphasise the organisational cost of fragmented communication networks. The decisive test is whether an adverse event produces one traceable record connected to schedule consequence, commercial exposure and a named decision owner.
4.2Procurement-informed lookahead planning
Master schedules usually show dependencies at a level too coarse to represent factory release, inspection, transport routing and material handling. Detailed work-package lookahead planning can create earlier decision windows if it includes supplier-furnished milestones and realistic lead-time distributions. For example, installing a mechanical system on a planned date depends upon design approvals, purchase-order release, off-site manufacture, inspection, delivery permits, lifting arrangements and preceding civil works. Any of these gates can change the planned install sequence and the resources held ready at site.
Ballard and Tommelein (2021) differentiate the production-management role of collaborative planning from retrospective reporting. Warid and Hamani (2023) identify practical implementation challenges in the Gulf region, while Power et al. (2021) argue for stronger upstream and downstream participation in collaborative commissioning planning. Antonini et al. (2023) present a logistics planning method embedded in lookahead routines for highway works, linking visual management to constraint removal. Their insight is that a procurement milestone becomes useful only when coupled to the next feasible on-site action. A 'green' shipment status is misleading if the storage yard is closed, the installation crew is unavailable or the associated design has been superseded. Consequently, the lookahead window should integrate supplier certainty and site readiness rather than calculate dates solely from the current critical path.
An integrated weekly control cycle can classify each critical package as ready, recoverable or blocked, supported by a reason code and recovery owner. The classification should distinguish genuine inventory shortage from schedule demand volatility. If the contractor repeatedly changes installation dates, the supplier may respond with increased prices or reduced confidence in delivery windows. That effect is a supply-demand coordination cost, not necessarily supplier underperformance. Sadeghi et al. (2022) examine lean–agile supply-chain strategy under volatile construction conditions; their study supports the need to judge intervention in its operating context rather than assume one preferred discipline. Modelling work on joint scheduling and material release suggests that simultaneous decisions are preferable where supplier capacity and site demands interact (Elmughrabi et al., 2020; Zhang et al., 2023).
4.3Linking supplier commitments to forecast final cost
The most immediate financial contribution of CSCM is improving the estimate to complete. Consider a steel package that has spent less than its budget at the reporting date. Without visibility of an outstanding fabrication variation, expediting quotation and supplier backlog, the cost report may display a favourable current variance that is certain to reverse. If the procurement team supplies validated prices, expected delivery variations and acceptance status by control account, the cost engineer can replace optimistic residual allowances with better-supported forecasts. This is not a new budgeting method; it is a more disciplined reconciliation between commercially committed expenditure and the work remaining (Zahoor et al., 2021; Ateş and Eirgash, 2025).
The reconciliation should apply an explicit hierarchy. Actual cost is recognised according to the project's accrual policy. Open commitments are included to the extent their scope is not already counted in actual cost. Uncommitted work is estimated from quantities, productivity, market quotations and forecast conditions. Probable changes and quantified risks are added in accordance with a documented treatment of contingency and approvals. Potential recoveries or claims are shown separately unless recognised under the applicable reporting policy. The purpose is to ensure that forecast cost is auditable: one can move from a headline estimate at completion to the underlying material commitments and installation assumptions without reversing an opaque adjustment.
This approach also clarifies how digital platforms may influence cost indirectly. Zenezini et al. (2024) find significant relationships between platform adoption and risk or time management, but not a direct statistical relationship with cost management in their study. An integrated platform may nevertheless improve future cost by reducing order errors, exposing delivery threats before they affect installation, and enabling targeted mitigation. The causal chain contains mediators: information quality, managerial response latency, schedule stability and the costs of corrective action. Claims that a platform 'reduces costs by a fixed percentage' ignore these mediators and overstate the transferable evidence.
4.4Schedule–cost pathways and the economics of disruption
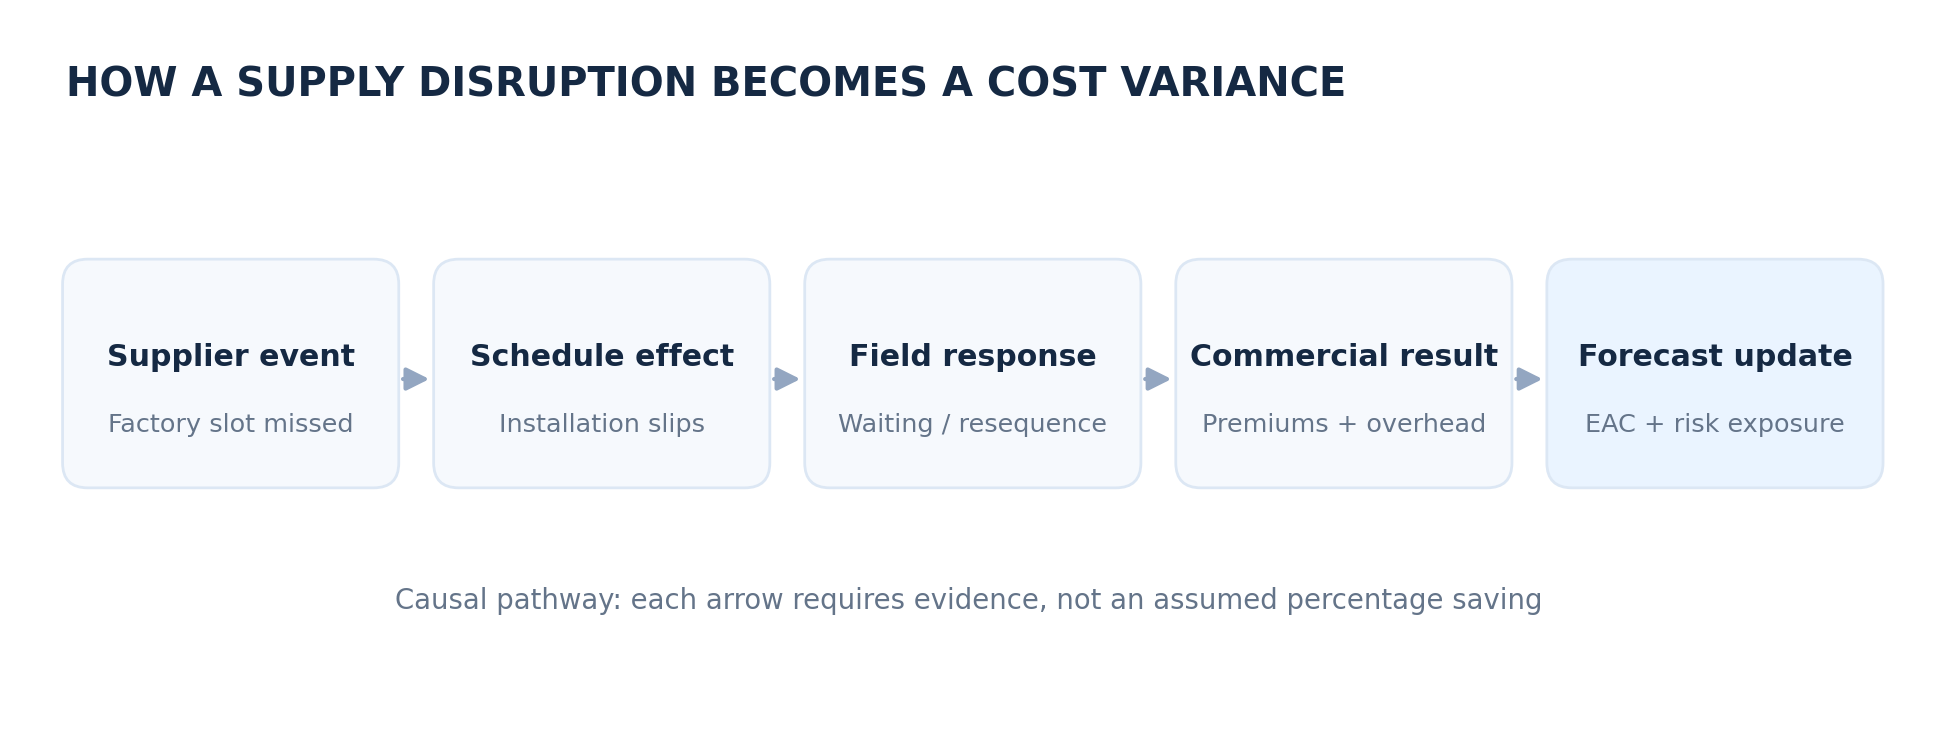
An upstream delay changes costs through multiple pathways. A delivery delay may create idle labour and equipment; subsequent resequencing may reduce productivity; acceleration may trigger premium shifts or parallel work fronts; delayed commissioning may prolong supervision and site overheads. Conversely, prematurely delivered material can create storage, finance, deterioration or rehandling costs. A robust control model must represent both sides of the time-cost relationship. The central mechanism is not delay alone, but the interaction of delayed supply and the project's available recovery options (Antonini et al., 2023; Ibrahim et al., 2025).
Critical-path indicators are necessary but insufficient when interface congestion creates secondary cost effects. A shipment may have schedule float yet require scarce lifting equipment at precisely the time a critical activity needs it. Shared logistics settings intensify this problem because one package's expedient rerouting can increase others' waiting costs (Ekeskär et al., 2022). Therefore, the commercial evaluation of mitigation should encompass the portfolio of affected control accounts, taking account of claims, productivity, access and safety consequences. An option that saves two days but introduces more temporary works may be inferior to a longer, lower-cost resequencing measure if completion risk is otherwise manageable.
4.5Supplier risk, change control and contingency
Procurement risks become controllable when expressed as specific threats to cost or schedule assumptions. A generic label such as 'material delay' conceals distinct mechanisms: unapproved drawings, factory congestion, rejected inspection, customs uncertainty, incomplete payment security or site refusal of a delivery. Each calls for a different response, probability assessment and accountable owner. Da Cunha et al. (2022) demonstrate the value of structured multi-criteria assessment for critical supply items in large-scale engineering and construction. Such methods can prioritise intervention, but their scores must not be mistaken for probabilities unless they are calibrated as probabilities.
Change control is the corresponding commercial discipline. When a design change alters ordered quantities or fabrication sequencing, the project should estimate supplier cancellation charges, rework and replacement lead times before approving the change where practicable. Approved scope changes then update the relevant control accounts and baseline under defined governance. Pending changes and project risks may be forecast separately to avoid portraying an unapproved entitlement as secured funding. Supply-chain data strengthens this process by identifying which packages have moved beyond reversible design decisions. Procurement strategies must therefore be judged partly by how they preserve options during scope uncertainty, not solely by unit-rate competitiveness (Karlovsek et al., 2024; Lovallo et al., 2023).
4.6Digital integration without technological determinism
Multiple technologies can support the preceding mechanisms: common data environments for controlled revisions, 4D/5D models for workface and quantity alignment, enterprise procurement systems for commitments, barcode or radio-frequency identification for item tracking, and analytics for exceptions. Onyia et al. (2024) discuss barriers to digital adoption in construction supply chains; Elghaish et al. (2023) analyse a model-based information architecture for component traceability. The technologies differ in maturity and purpose. Their value should be assessed against the quality of decisions made possible, rather than the volume of sensors or dashboards installed.
A practical adoption order is to standardise cost-package structures and change controls before introducing sophisticated automation. Otherwise, an automated feed reproduces incompatible categories at greater speed. Popov et al. (2021) treat procurement as a process requiring model-based workflow redesign, while Du (2021) discusses BIM-enabled cost simulation. Neither approach eliminates the need for cost engineers to interrogate commercial assumptions or for planners to verify whether progress quantities represent executable handovers. Digital maturity should therefore be measured as a reduction in unresolved data mismatches, late exceptions and unowned actions, not as the mere count of software licences.
5An integrated supply chain–project controls architecture
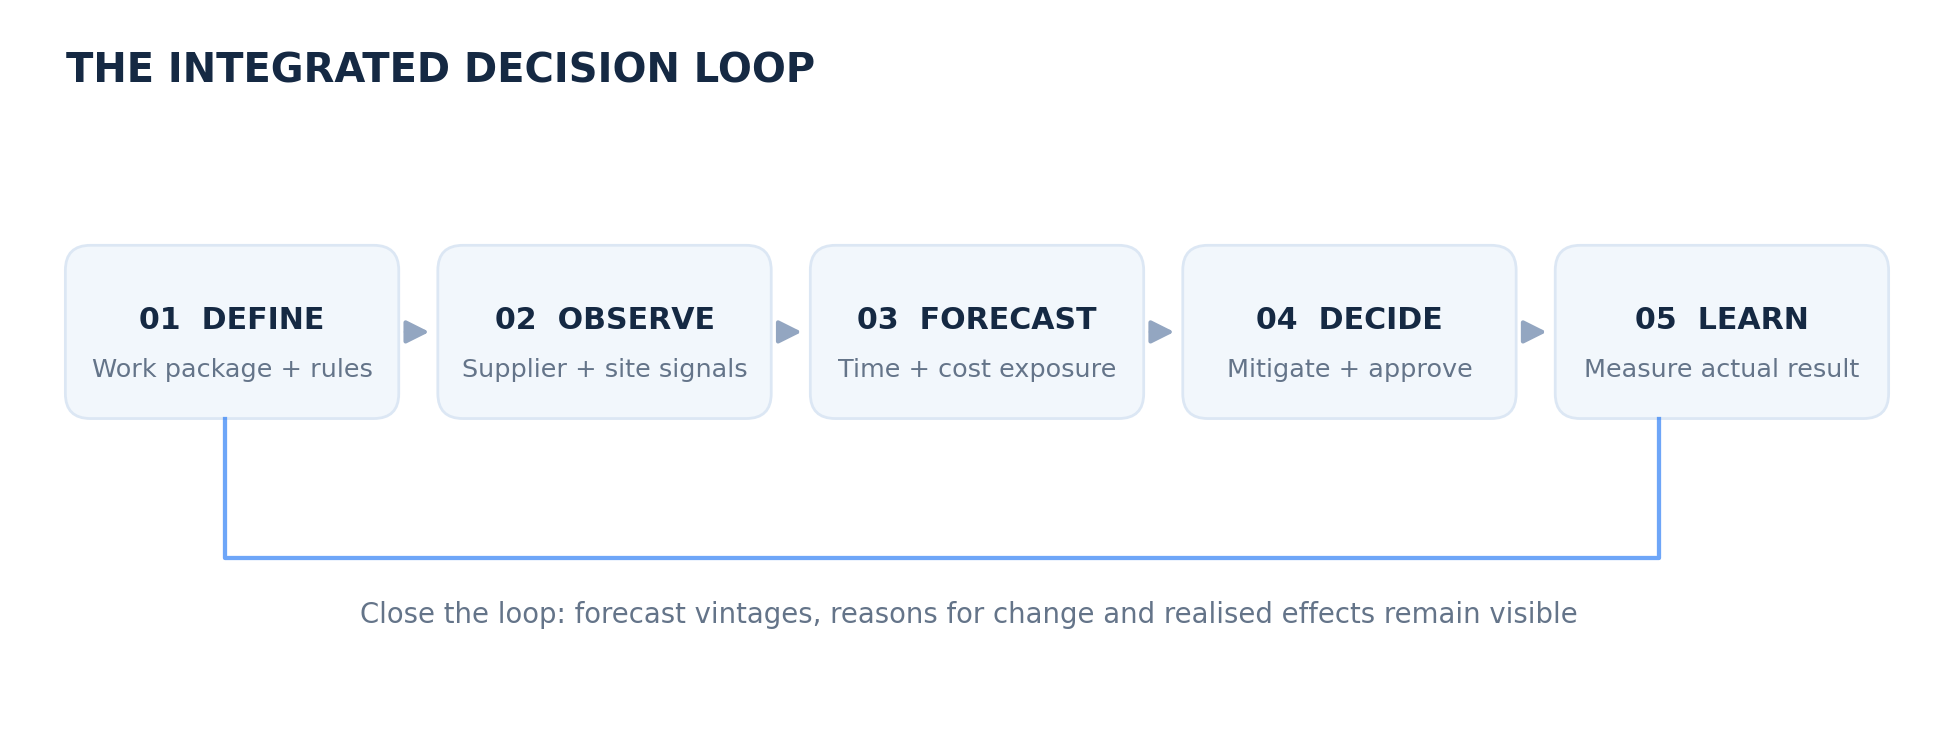
The proposed architecture consists of five linked layers: package definition, operational evidence, predictive interpretation, decision governance and post-decision learning. Its organising principle is that each material or subcontract package is traceable through scope, schedule, commitment, installed quantity, forecast cost and risk. Package definition establishes coding and measurement rules. Operational evidence records design status, vendor production, logistics and site readiness. Predictive interpretation translates deviations into likely effects on quantities, resource utilisation, critical milestones and cost to complete. Governance determines whether to accelerate, resequence, substitute, renegotiate or retain the existing plan. Learning records whether the selected intervention achieved the expected outcome.
At the centre sits an integrated control account rather than a single software product. The account links a deliverable to responsible contract parties, a schedule window, a current budget, a cost accrual position, remaining commitments and a documented risk register. The commercial and planning teams jointly author a forecast narrative when a threshold is exceeded. For example, a long-lead equipment package can remain schedule-critical even when actual expenditure is low; the narrative should expose the supplier's predicted factory completion, inspection status and expected consequences for downstream commissioning. In this manner, the same evidence informs near-term interventions and aggregate cost reports (Yilmaz et al., 2025; Rahman et al., 2025).
The architecture also requires explicit temporal rules. A procurement report may be produced daily, the schedule weekly, vendor accruals monthly and owner reporting every four weeks. A shared repository cannot make these observations simultaneous. The forecast needs a defined data cut-off and a field indicating whether a supplier update occurred after the formal period end. Late transactions should be handled through controlled post-close adjustments, not invisible overwriting. Confidence bands can distinguish firm commitments, validated supplier forecasts and judgemental allowances. Such provenance permits decision-makers to recognise uncertainty rather than conceal it inside a single deterministic estimate at completion.
6Numerical demonstration and control logic
A worked illustration clarifies how integration could affect interpretation without presenting fictional field observations as empirical findings. Assume a mega-project workstream with a budget at completion (BAC) of SAR 1,000 million at the reporting date. Its planned value is SAR 500 million; earned value, SAR 450 million; and actual cost, SAR 480 million. CPI therefore equals 450/480 = 0.9375, and SPI equals 450/500 = 0.90. These values indicate that less value has been earned than planned and that recorded cost per unit of earned value exceeds the baseline rate. A straightforward cumulative-cost EVM projection gives EAC = BAC/CPI = SAR 1,066.7 million, or an overrun of SAR 66.7 million. The calculation is a diagnostic scenario, not a prediction for any named project.
To illustrate a package-based cross-check, divide the same SAR 1,000 million budget among structural steel, façades, mechanical–electrical–plumbing services, major equipment and other works. Assign each package a plausible illustrative earned value, actual cost and forecast completion cost as shown in Table 2. The column totals exactly reproduce the baseline figures: BAC SAR 1,000 million, EV SAR 450 million and AC SAR 480 million. The bottom-up package forecast totals SAR 1,065 million, broadly consistent with the mechanical CPI-based projection but analytically more informative. It locates prospective overruns in steel, façades and services, while recognising a small offset in other works. Neither forecast should be interpreted as more accurate until its assumptions are tested against subsequent outcomes.
| Work package | BAC | EV | AC | Forecast EAC | EAC–BAC |
|---|---|---|---|---|---|
| Structural steel | 180 | 90 | 104 | 200 | +20 |
| Façades | 120 | 45 | 58 | 139 | +19 |
| MEP services | 200 | 70 | 74 | 218 | +18 |
| Major equipment | 100 | 50 | 52 | 110 | +10 |
| Other works | 400 | 195 | 192 | 398 | −2 |
| TOTAL | 1,000 | 450 | 480 | 1,065 | +65 |
Note: BAC = budget at completion; EV = earned value; AC = actual cost; EAC = estimate at completion.
A supplier-informed investigation would then examine what is driving each package. In this hypothetical case, the steel forecast may include a fabrication change, the façade forecast additional access scaffolding, and the services forecast delayed interface approvals. The cost engineer distinguishes firm commitments from remaining estimates and risk allowances, while the planner assesses whether delivery windows overlap with labour-intensive successor activities. The accountable team evaluates alternatives, such as preserving a factory slot, combining shipments, authorising a design freeze or adjusting installation sequencing. Every proposed intervention receives a cost-to-implement, a likely time effect, a responsible approver and a defined review date. Avoiding cost is not demonstrated until these effects materialise in subsequent approved forecasts and ultimately final accounts.
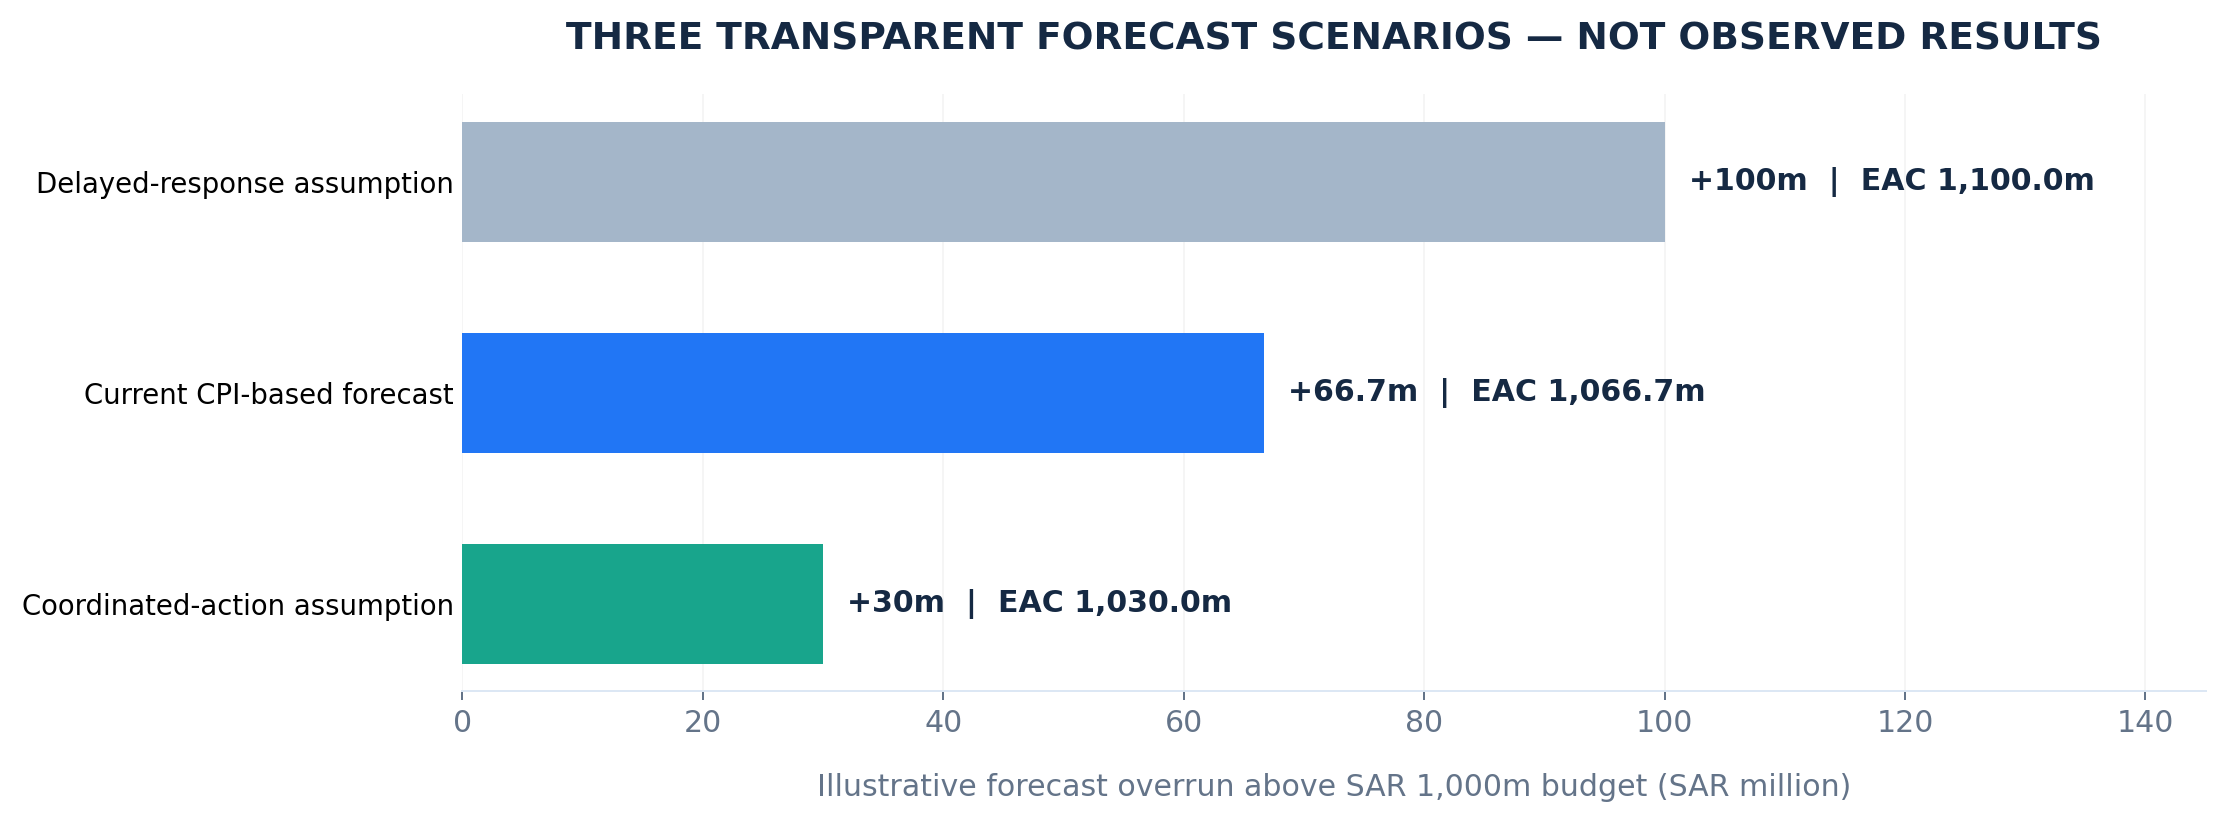
Consider three deliberately stylised completion scenarios. A delayed-response case assumes the accumulated effects of congestion and expediting increase EAC to SAR 1,100 million. A business-as-usual case retains the current CPI-based EAC of SAR 1,066.7 million. A timely coordinated-action case assumes a package-specific forecast of SAR 1,030 million after credible mitigations. The corresponding predicted overruns are SAR 100 million, SAR 66.7 million and SAR 30 million. The difference between status quo and the integrated-action scenario is SAR 36.7 million, or 3.67% of BAC; it is an assumed scenario contrast, not an estimated treatment effect. Table 3 and Figure 4 display the arithmetic explicitly so that no numerical output could reasonably be mistaken for a measured sample of projects.
| Completion assumption | EAC (SAR m) | Forecast overrun | Overrun / BAC | Status |
|---|---|---|---|---|
| Delayed corrective response | 1,100.0 | 100.0 | 10.00% | Illustrative stress case |
| Current CPI-based continuation | 1,066.7 | 66.7 | 6.67% | Arithmetic estimate |
| Coordinated corrective action | 1,030.0 | 30.0 | 3.00% | Illustrative mitigation case |
Note: Not measured savings or outcomes of a case study.
Scenario comparisons become useful only when their causal assumptions can be audited. The SAR 36.7 million difference could be decomposed into reductions in emergency transport, reduced trade waiting, fewer design-driven corrections and lower supervisory prolongation, with offsets for intervention costs. Yet the model is sensitive to remaining productivity and work content. An intervention that lowers logistics expenditure but increases installation hours may not improve final cost. The appropriate forecast therefore needs both supply-chain quantities and project-control estimates of on-site consequences. Where the same risk has already been included in contingency or committed variation value, adding it again as an independent supplier-risk allowance would artificially inflate EAC (Elsaid et al., 2025; Zahoor et al., 2021).
For validation, a project dataset should preserve successive forecast vintages rather than overwrite prior values. Researchers could compare the absolute forecast error at common percentage-complete points, tracking whether a supplier-informed projection is better calibrated than an otherwise equivalent conventional projection. They should also measure issue-to-decision time and mitigation cost, because faster reporting alone cannot establish improved performance. Real projects introduce confounders: experienced teams may adopt digital tools earlier, commercially collaborative contracts may attract more capable suppliers, and the projects with the highest supply risks may have the strongest control systems. These factors should inform matching or quasi-experimental designs rather than be treated as irrelevant background (Zenezini et al., 2024; Stefano et al., 2023).
7Discussion
The synthesis suggests that integration should be understood as the design of a feedback loop, not as a merger of departments or databases. Operational information matters when it alters a defensible forecast and a feasible intervention. A supplier delay known only to procurement has low organisational value until converted into the expected schedule and cost consequence; a cost forecast known only to the project-controls team has similarly limited value when the purchase or production decision capable of changing it lies elsewhere. The fundamental managerial innovation is therefore the governed translation between operational evidence and financial choice.
This interpretation helps reconcile apparently conflicting empirical results. A platform may strengthen visibility and risk management without a measurable direct association with cost performance, as Zenezini et al. (2024) report. The effect may be mediated by scheduling, contingent on user skill, or obscured by differences in contract structure and project size. In comparison, simulation or optimisation studies can show how coordinated material and schedule decisions reduce a modelled objective, but their solutions depend on assumptions about information completeness, production capacities and feasible decisions (Elmughrabi et al., 2020; Zhang et al., 2023). These are complementary forms of evidence, not interchangeable causal demonstrations.
Large project governance creates particular constraints. Project owners need timely integrated reporting, but over-centralised approval can delay commercially urgent mitigation. Farid et al. (2025) show that inaccessible competences and inappropriate reporting present real governance challenges. The appropriate response is an authority matrix calibrated to financial exposure and reversibility: routine delivery substitutions may be delegated within approved tolerances, while changes to specification, project completion or significant risk allocations require formal governance. Such controls should protect transparency without forcing every minor logistical choice into the owner's monthly review cycle.
Integration can also create costs and new vulnerabilities. Shared logistics systems require arbitration among users; data integration demands maintenance; early purchase commitments can increase cash exposure and obsolescence risk if design is unstable. Ekeskär et al. (2022) demonstrate that coordination among contractors is shaped by cooperative and competitive relationships. In addition, implementation burdens fall unevenly upon subcontractors with different digital capacities (Onyia et al., 2024). A credible business case should therefore include systems administration, process training, audit effort and supplier participation, not compare idealised integration against a cost-free conventional alternative.
A further boundary condition concerns the definition of success. Lower final cost relative to a poorly specified original budget may reflect scope reduction rather than improved procurement or control. Conversely, a defensible scope increase can raise the authorised budget without representing a managerial failure. Cost performance should therefore be analysed against a transparent change-adjusted baseline, accompanied by measures of quality, completion, safety and strategic value. Waqar et al. (2025) demonstrate the relevance of wider supply-chain performance dimensions, while Ashcraft (2022) highlights commercial arrangements designed to support project-wide rather than purely transactional optimisation. The review's cost emphasis is not an argument for compromising those other outcomes.
8Practical implications and research propositions
Implementation can begin with a limited set of packages whose lead times and interface risks are economically material. The owner should require a shared coding dictionary, common progress rules, a controlled procurement-status taxonomy and a monthly reconciliation among procurement, planning and cost engineering. Weekly operational reviews need not reproduce the complete executive report; their purpose is to identify exceptions, quantify implications and assign actions. Thresholds could trigger escalation when a long-lead milestone moves beyond available float, when cost-to-complete assumptions are unsupported by supplier evidence, or when a forecast change exceeds the package's approved risk tolerance.
For researchers, Proposition 1 is that work-package information interoperability will reduce the time between the occurrence of supply-chain disruption and its inclusion in the authorised cost forecast, provided status data are verified. Proposition 2 is that procurement-informed lookahead planning will improve the calibration of schedule-related cost-to-complete forecasts, conditional upon the reliability of supplier milestones and site-readiness assessments. Proposition 3 is that jointly governed mitigation decisions will lower avoidable cost escalation relative to separated control processes when participating firms have appropriate incentives to disclose constraints. Each proposition specifies a mechanism and a condition rather than claiming a universal improvement from integration.
A validation design should compare work packages or projects with different levels of integration while controlling for delivery method, size, phase, technical complexity and baseline stability. Outcome measures should include forecast error, realised cost variance, frequency and age of unresolved procurement constraints, proportion of orders with confirmed delivery evidence, and percentage of mitigation actions implemented on time. Documentary evidence can be supplemented by interviews to determine whether reported warnings actually influenced decisions. Longitudinal measurements would be more persuasive than one-off perceptions of digital-tool usefulness; audit trails are essential to distinguish correlation from a plausible sequence of intervention and effect (Yilmaz et al., 2025; Zani et al., 2024).
9Limitations
The review is deliberately integrative and based on thirty DOI-traceable contributions rather than a formally exhaustive database census. Publication methods and definitions are heterogeneous; results generated in housing, Nordic digital-platform samples, general infrastructure and prefabrication should not be treated as directly transferable estimates for every mega project. The numerical illustration is hypothetical and cannot establish causality, forecast accuracy or financial savings. Differences in accounting, contract forms, tax treatment and baseline authorisation can further change how cost performance is measured. A future evidence assessment could apply a registered search protocol and formal study-quality appraisal to test the robustness of the proposed mechanisms.
The conceptual architecture also assumes the existence of minimum viable organisational trust and access to commercial data, conditions that cannot be taken for granted in adversarial contracts. Suppliers may hold proprietary forecasts, claims may be unresolved and contractor reporting may be influenced by incentives to defer recognition of overruns. Where these constraints dominate, a technically integrated platform can produce precise but systematically biased numbers. Testing should therefore distinguish the availability of data from its credibility, and the speed of decision-making from the effectiveness of the decisions reached (Lovallo et al., 2023; Denicol et al., 2020).
10Conclusion
Construction supply-chain management and project controls are often treated as complementary but separate support functions. This review argues that improved cost performance becomes more plausible when they are designed as a single traceable decision process linking supplier readiness, site production, physical progress, commitments, risk and final-cost forecasts. Recent literature supports several elements of this argument, especially inter-organisational coordination, joint scheduling and procurement decisions, model-enabled information exchange and earned-value measurement. However, evidence does not justify a universal claim that platform adoption independently reduces project costs.
The proposed architecture places the work package at the centre of integration and establishes controlled interfaces between operational evidence, predictive analysis and commercial action. The worked example demonstrates how forecasts can be reconciled and compared transparently without presenting fabricated project data as empirical findings. The next research priority is longitudinal validation using actual forecast vintages, supplier events, mitigation decisions and final accounts. The managerial priority is simpler but demanding: ensure that an early supply warning changes the cost forecast when warranted, reaches the person authorised to act, and remains auditable after the decision is made.
References
- [1]Antonini BG, Pimentel FM, Fireman MCT, Etges BMBS, Campos FR, de Lima Junior J, Kronbauer BK (2023). Logistics planning within the Last Planner System for highway construction projects. Proceedings of the 31st International Group for Lean Construction Conference, 1291–1302. https://doi.org/10.24928/2023/0191
- [2]Ashcraft H (2022). Transforming project delivery: integrated project delivery. Oxford Review of Economic Policy, 38(2), 369–384. https://doi.org/10.1093/oxrep/grac001
- [3]Ateş B, Eirgash MA (2025). Proactive and data-driven decision-making using earned value analysis in infrastructure projects. Buildings, 15(14), 2388. https://doi.org/10.3390/buildings15142388
- [4]Ballard G, Tommelein I (2021). 2020 current process benchmark for the Last Planner System of project planning and control. Lean Construction Journal, 53–155. https://doi.org/10.60164/47e7h7a1b
- [5]da Cunha RA, Rangel LAD, Rudolf CA, Santos L (2022). A decision support approach employing the PROMETHEE method and risk factors for critical supply assessment in large-scale projects. Operations Research Perspectives, 9, 100238. https://doi.org/10.1016/j.orp.2022.100238
- [6]Denicol J, Davies A, Krystallis I (2020). What are the causes and cures of poor megaproject performance? A systematic literature review and research agenda. Project Management Journal, 51(3), 328–345. https://doi.org/10.1177/8756972819896113
- [7]Du X (2021). Construction cost simulation based on artificial intelligence and BIM. Scientific Programming, 2021, 9744286. https://doi.org/10.1155/2021/9744286
- [8]Ekeskär A, Havenvid MI, Karrbom Gustavsson T, Eriksson PE (2022). Construction logistics in a multi-project context: coopetition among main contractors and the role of third-party logistics providers. Construction Management and Economics, 40(1), 25–40. https://doi.org/10.1080/01446193.2021.2012815
- [9]Elghaish F, Hosseini MR, Kocaturk T, Arashpour M, Bararzadeh Ledari M (2023). Digitalised circular construction supply chain: an integrated BIM–blockchain solution. Automation in Construction, 148, 104746. https://doi.org/10.1016/j.autcon.2023.104746
- [10]Elmughrabi W, Ben Sassi O, Dao TM, Chaabane A (2020). Collaborative supply chain planning and scheduling of construction projects. IFAC-PapersOnLine, 53(2), 10761–10766. https://doi.org/10.1016/j.ifacol.2020.12.2858
- [11]Elsaid M, Nassar K, Alqahtani FK, Abotaleb I (2025). Comparative analysis of earned value management techniques in construction projects. Scientific Reports, 15, 23606. https://doi.org/10.1038/s41598-025-05834-z
- [12]Farid P, Klakegg OJ, Bakke C (2025). Mega construction projects: governance challenges for the project owner. Procedia Computer Science, 256, 1474–1481. https://doi.org/10.1016/j.procs.2025.02.281
- [13]Ibrahim A, Zayed T, Lafhaj Z (2025). Trends and gaps in lean construction practices for construction of megaprojects: a critical review. Alexandria Engineering Journal, 118, 174–193. https://doi.org/10.1016/j.aej.2025.01.046
- [14]Karlovsek J, Meath C, Miles-Mwangangi L, MacDonald C, Brockmann A (2024). Implementing circular economy principles in infrastructure procurement to support circular supply chains. Engineering, Construction and Architectural Management, 31(11), 4645–4658. https://doi.org/10.1108/ECAM-09-2022-0908
- [15]Lovallo D, Cristofaro M, Flyvbjerg B (2023). Governing large projects: a three-stage process to get it right. Academy of Management Perspectives. https://doi.org/10.5465/amp.2021.0129
- [16]Mesa HA, Molenaar KR, Alarcón LF (2020). Modeling supply chain integration in an integrated project delivery system. Sustainability, 12(12), 5092. https://doi.org/10.3390/su12125092
- [17]Onyia U, Ani IS, Nwankwo UF (2024). Addressing the challenges towards the adoption of digital technologies in construction supply chain management. Discover Civil Engineering, 1, 118. https://doi.org/10.1007/s44290-024-00132-5
- [18]Perera H, Azadnia AH, Ghadimi P (2022). Development of a multi-agent system to tackle communication fragmentation and information exchange in the construction industry. IFAC-PapersOnLine, 55(10), 335–340. https://doi.org/10.1016/j.ifacol.2022.09.409
- [19]Popov V, Medineckienė M, Grigorjeva T, Zabulėnas AR (2021). Building information modelling: procurement procedure. Business, Management and Economics Engineering. https://doi.org/10.3846/bmee.2021.14653
- [20]Power W, Sinnott D, Mullin A (2021). Improving commissioning and qualification delivery using Last Planner System. Lean Construction Journal, 36–52. https://doi.org/10.60164/c7g8d2i4i
- [21]Rahman AD, Handayani TN, Nugroho ASB, Dewi NNP, Yudhistira AT (2025). A BIM-based system for earned value analysis in construction projects. ASEAN Engineering Journal, 15(3), 101–111. https://doi.org/10.11113/aej.v15.23087
- [22]Sadeghi S, Akbarpour A, Abbasianjahromi H (2022). Provide a lean and agile strategy for an antifragile sustainable supply chain in the construction industry (residential complex). Cleaner Logistics and Supply Chain, 5, 100079. https://doi.org/10.1016/j.clscn.2022.100079
- [23]Stefano G, Denicol J, Broyd T, Davies A (2023). What are the strategies to manage megaproject supply chains? A systematic literature review and research agenda. International Journal of Project Management, 41(3), 102457. https://doi.org/10.1016/j.ijproman.2023.102457
- [24]Warid O, Hamani K (2023). Lean construction in the UAE: implementation of Last Planner System. Lean Construction Journal, 2023, 1–20. https://doi.org/10.60164/96f4a5e0g
- [25]Waqar A, Houda M, Ahsan M, Nisar S (2025). Enhancing project performance through sustainable supply chain management: a comprehensive analysis of residential construction practices. Environmental Challenges, 18, 101075. https://doi.org/10.1016/j.envc.2024.101075
- [26]Yilmaz S, Kumar D, Hada S, Demirkesen S, Zhang C, Li H (2025). A PMBOK-based construction cost management framework for BIM integration in construction projects. International Journal of Construction Management, 25(8), 861–875. https://doi.org/10.1080/15623599.2024.2371626
- [27]Zahoor H, Khan RM, Nawaz A, Ayaz M, Maqsoom A (2021). Project control and forecast assessment of building projects in Pakistan using earned value management. Engineering, Construction and Architectural Management, 29(2), 842–869. https://doi.org/10.1108/ECAM-11-2020-0989
- [28]Zani CM, Denicol J, Broyd T (2024). Organisation design in megaprojects: a systematic literature review and research agenda. International Journal of Project Management, 42(6), 102634. https://doi.org/10.1016/j.ijproman.2024.102634
- [29]Zenezini G, Mangano G, Castelblanco G (2024). Impact of integrated supply chain platforms on construction project management. Proceedings of the 41st International Symposium on Automation and Robotics in Construction, 381–387. https://doi.org/10.22260/isarc2024/0050
- [30]Zhang W, Yu C, Zhong RY (2023). Stability measure for prefab balancing in prefabrication construction supply chain management. Computers & Industrial Engineering, 183, 109518. https://doi.org/10.1016/j.cie.2023.109518