Construction Project Management
Operational Risk and Safety Management in the Nigerian Residential Real Estate Sector Using Artificial Intelligence
Department of Civil Engineering, University of Ibadan, Ibadan, Oyo State, Nigeria
Published October 2026
Abstract
Operational failures and weak safety management continue to undermine residential real estate development in Nigeria, while the potential of artificial intelligence (AI) to address them remains little examined. This study assessed operational risks and safety management practices, their association with safety compliance and project performance, and the potential of AI in residential real estate development in Lagos and Ibadan. A cross-sectional quantitative survey, guided by Risk Management Theory, Safety Culture Theory and the Technology Acceptance Model, used a structured five-point Likert questionnaire; 141 of 180 questionnaires distributed were valid (78.3%). Data were analyzed with means, standard deviations, rankings and Pearson correlation. All sixteen operational risks scored 4.04-4.46, led by inadequate worker skills and training (4.46) and poor supervision (4.45); human-related and technical/structural risks ranked first and second. PPE training (4.01) and provision (3.91) were the highest-rated safety practices, whereas risk registers and non-punitive near-miss reporting (2.98) were lowest. Management commitment (4.50) and safety culture (4.49) were rated the strongest influences on compliance. Operational risk was positively and significantly correlated with safety compliance (r = 0.879) and project performance (r = 0.840), both p < 0.001. Respondents rated AI's potential highly (means 4.09-4.48), with predictive risk assessment ranked highest in impact, but endorsed inadequate digital infrastructure (4.48) as the main barrier. Visible protection appears to outpace preventive safety management, and AI is a conditional rather than demonstrated solution. Associations do not establish causation.
Keywords: operational risk management; construction safety; residential real estate; artificial intelligence; safety compliance; construction project performance; Nigeria
1Introduction
Real estate development contributes to economic growth, employment and urban development worldwide (UN-Habitat, 2022; World Bank, 2021), and in Nigeria the sector continues to expand with urbanization and population growth (National Bureau of Statistics, 2023). Construction is nevertheless among the most dangerous industries (International Labour Organization, 2020; Kheni et al., 2008), and Nigerian cities have recorded building collapses, accidents, project abandonment and financial losses attributed to poor construction practice, inadequate supervision, structural deficiencies, substandard materials and weak operational risk management (Windapo and Rotimi, 2012; Oloyede, 2010; Fadamiro and Atolagbe, 2006; Awoyera et al., 2021).
Regulators such as the Lagos State Building Control Agency (LASBCA) and the Council for the Regulation of Engineering in Nigeria (COREN) are mandated to enforce building and safety standards, but inadequate inspection capacity, corruption, political interference and weak penalties limit their effect (LASBCA, 2022; COREN, 2021; Oke et al., 2021). Safety culture and leadership commitment shape safety outcomes (Schein, 2010; Cooper, 2000; Reason, 1997), and digital technologies such as artificial intelligence (AI) and Building Information Modelling (BIM) are reported to improve hazard identification, compliance monitoring and decision-making (Succar, 2009; Pan and Zhang, 2021; Hamdan and Alshibani, 2022).
Operational risks therefore remain inadequately managed in many Nigerian residential developments, the factors that shape safety compliance have not been sufficiently examined in this context, and AI adoption in the sector is limited and largely unexplored (Ebekozien, 2020). Prior studies have largely treated operational risk, safety management, compliance and project performance as separate phenomena, and empirical work on AI in Nigerian real estate is scarce.
The study aimed to assess safety performance and operational resilience in the Nigerian real estate sector through three objectives:
- 1. To identify the operational risks and safety management practices prevalent in the sector.
- 2. To examine the effects of operational risks on project performance and safety compliance.
- 3. To evaluate the potential of AI in enhancing operational risk and safety management.
It covers the planning, design, construction and early-occupancy stages of residential developments in Lagos and Ibadan and is intended to inform developers, contractors, project managers and regulators.
2Literature review
2.1Operational risks in residential development
Operational risk is the risk of loss resulting from inadequate or failed internal processes, people, systems or external events (Basel Committee on Banking Supervision, 2011); in construction it covers any uncertainty that can disrupt activities, reduce performance or compromise safety. Human-related risks arise from inadequate training, weak supervision, negligence and unsafe practice (Hinze, 2011; Reason, 1997), aggravated in Nigeria by high labour turnover and informal labour (Aigbavboa and Thwala, 2016; Ebekozien, 2020). Technical risks stem from design deficiencies, poor workmanship and substandard materials, which are repeatedly identified as principal contributors to Nigerian building collapses (Windapo and Rotimi, 2012; Oloyede, 2010; Awoyera et al., 2021). Financial risks include inaccurate forecasting, inflation, exchange-rate volatility and funding delays (Love et al., 2018; Aibinu and Jagboro, 2002). Environmental risks include flooding, erosion and inadequate geotechnical investigation (Adelekan, 2016), regulatory risks arise from inconsistent enforcement and approval delays, and technological risks include equipment failure and low technology adoption (PMI, 2021). Surveys elsewhere found financial, safety, regulatory, environmental and technical risks (Zou et al., 2007), and design errors, inadequate planning and cost escalation (El-Sayegh, 2008), to be significant. ISO 31000 and the COSO enterprise risk management framework offer structured responses (ISO, 2018a; COSO, 2017).
2.2Safety management practices and compliance
Safety management is the systematic identification, assessment, control and monitoring of workplace hazards (ILO, 2001), and ISO 45001 embeds it in organizational decision-making (ISO, 2018b). Its core practices are safety policy and pre-construction planning, training and competency development, hazard identification and risk assessment, and audits, inspections and incident reporting (Hughes and Ferrett, 2020; Burke et al., 2006; Aven, 2016; Reason, 1997). Robust systems are associated with lower accident rates (Hinze, 2011), yet smaller Nigerian contractors often operate with limited safety infrastructure, informal risk assessment and constrained reporting (Aigbavboa and Thwala, 2016; Oke et al., 2021). Safety compliance is shaped by safety culture and climate, leadership commitment, worker competence, regulatory enforcement, economic pressure and communication (Neal and Griffin, 2006; Cooper, 2000; Choudhry et al., 2007; Kheni et al., 2008). At site level in Lagos, owner-supervised sites recorded more near misses and accidents than sites with trained supervisors (Kasim et al., 2020).
2.3Operational risk and project performance
Project performance is conventionally judged by cost, time and quality and extended to safety, reputation and sustainability (PMI, 2021). Operational risk has been linked to cost overruns (Love et al., 2018), delays driven by inadequate planning, poor coordination and regulatory bottlenecks (Odeh and Battaineh, 2002; Fellows and Liu, 2015), quality failures (Juran and Godfrey, 1999) and reputational damage (Hillson, 2017); in Nigeria, financial constraints and structural failures have been tied to project abandonment and collapse (Aibinu and Jagboro, 2002; Windapo and Rotimi, 2012).
2.4Artificial intelligence in risk and safety management
AI refers to computer systems that perform tasks ordinarily requiring human intelligence (Russell and Norvig, 2021). Construction applications include machine-learning risk prediction (Pan and Zhang, 2021; Cheng et al., 2020), computer-vision monitoring of PPE compliance and unsafe behaviour (Fang et al., 2018; Hamdan and Alshibani, 2022), AI–BIM integration for design risk simulation (Succar, 2009; Marzouk and Hisham, 2014), Internet-of-Things (IoT) sensing (Li et al., 2019) and digital twins (Boje et al., 2020). Barriers reported for Nigeria include inadequate digital infrastructure, high implementation costs, scarce technical expertise and resistance to change (Ebekozien, 2020).
2.5Theoretical and conceptual framework
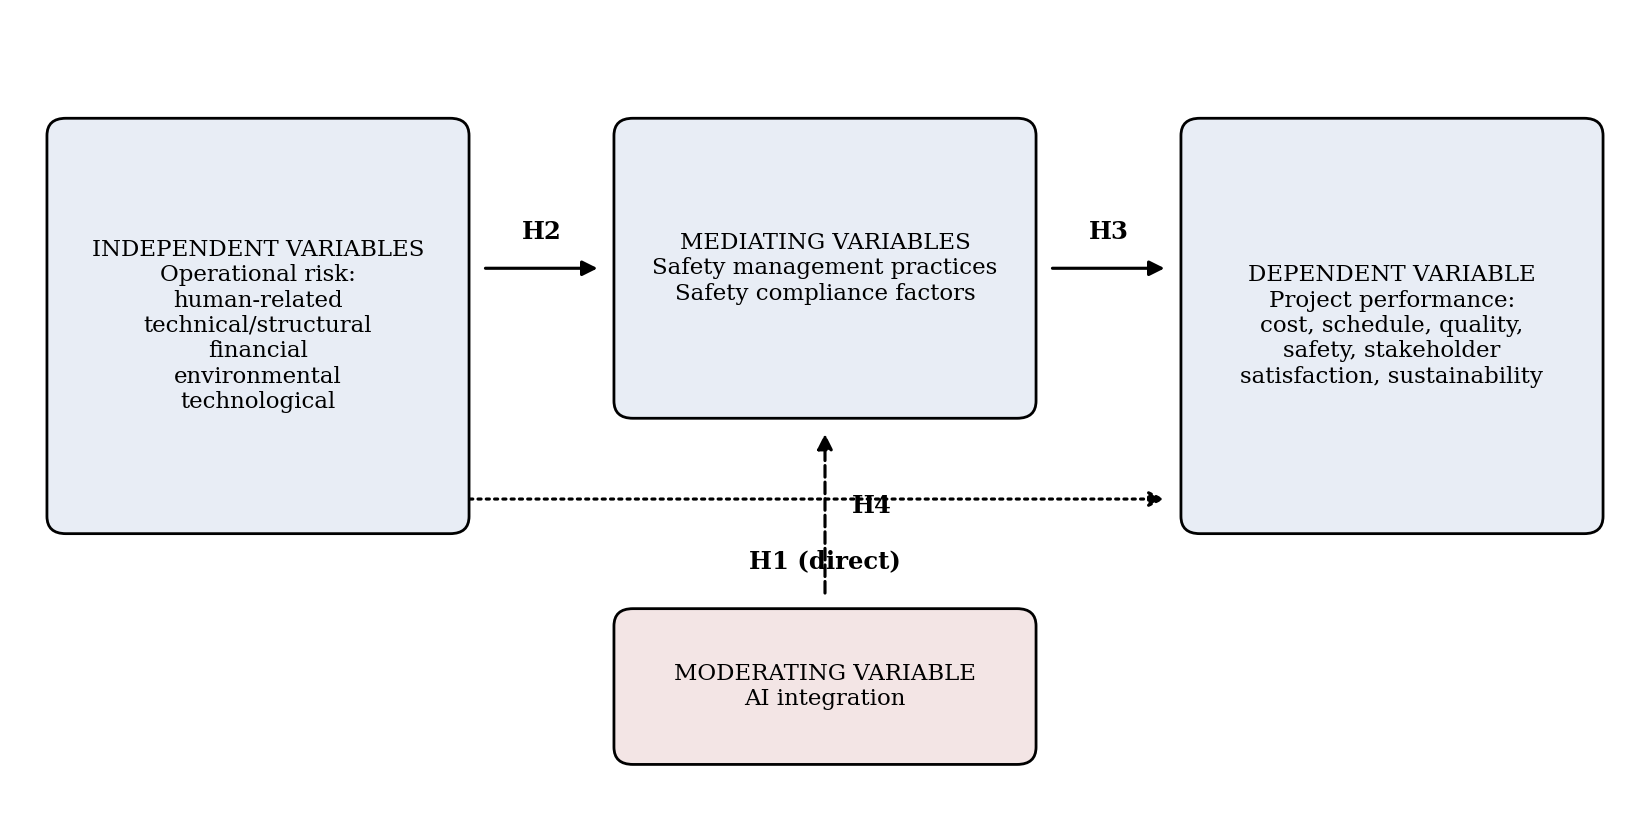
Three theories anchor the study. Risk Management Theory holds that systematic identification, assessment and control of risks improves performance and reduces uncertainty (Aven, 2016). Safety Culture Theory holds that safety performance depends on shared values, beliefs and behaviours as well as technical systems, with management commitment the main driver (Reason, 1997; Cooper, 2000). The Technology Acceptance Model (TAM) explains adoption through perceived usefulness and ease of use (Davis, 1989; Venkatesh and Davis, 2000). The conceptual framework (Figure 1) positions operational risk categories as independent variables, safety management practices and compliance factors as mediators, AI integration as a moderator of the practices-to-performance pathway, and project performance as the outcome, with a direct risk performance path. This article reports descriptive and correlational evidence only; the hypothesized mediating and moderating paths were not tested.
2.6Research gap
Four gaps emerge: few studies address operational risk in Nigerian residential real estate; integrated studies of risk, safety management, compliance and performance are scarce; empirical research on AI adoption in the sector is minimal; and no integrated framework combines traditional risk management, safety management systems and AI. This study addresses the first three empirically for Lagos and Ibadan and presents the fourth conceptually.
3Research methodology
3.1Design, study area and sampling
A cross-sectional quantitative survey was conducted in Lagos and Ibadan, southwestern Nigeria. The target population comprised six categories of stakeholders in residential development: civil/structural engineers, real estate developers, project managers, quantity surveyors, architects with site-supervision responsibilities and construction workers or site operatives. The accessible population was estimated at about 240, derived from COREN, NIOB, NIESV and NIA registration data and a structured mapping of active development firms. Yamane's (1967) formula, n = N / (1 + N(e²)) with N = 240 and e = 0.05, gave a sample of 150, allocated proportionally to Lagos (80) and Ibadan (70); 180 questionnaires were distributed (100 in Lagos, 80 in Ibadan) to allow for non-response, with 150 valid returns set as the benchmark. Stratified random sampling by professional category was planned (Bryman, 2016), with target allocations of 40 engineers, 15 developers, 30 project managers, 20 quantity surveyors, 30 architects and 15 site operatives. In all, 141 valid questionnaires were retrieved (Lagos 77, Ibadan 64), a response rate of 78.3%, below the benchmark.
3.2Instrument, validation and data collection
A structured questionnaire designed by the researcher used a five-point Likert scale (1 = strongly disagree to 5 = strongly agree) and had six sections: (A) demographics; (B) operational risks (16 items and a ranking of five risk categories); (C) safety management practices (16 items); (D) causes of building collapse (not reported here); (E) safety compliance factors and effects of operational risk on project performance (13 items); and (F) AI in risk and safety management (15 items, a ranking of five AI applications and open-ended questions). Content validity was assessed by three specialists in construction management, risk management and occupational safety, with a content validity index of at least 0.80 required for retention (Lynn, 1986), and the instrument was piloted with 10 respondents excluded from the main sample (Saunders et al., 2019). Printed copies were distributed at sites and offices and electronic copies through professional networks and association mailing lists over eight weeks, with weekly reminders and exclusion of incomplete returns (Zikmund et al., 2013).
3.3Data analysis and ethics
Data were analyzed with SPSS version 25. Descriptive statistics (frequencies, percentages, means and standard deviations) were computed and items ranked by mean score, with the Likert scale treated as interval-level (Hair et al., 2014; Fellows and Liu, 2015) and a mean of 3.50 adopted as the threshold for significance. Normality was assessed with the Kolmogorov-Smirnov test and Q-Q plots. Pearson correlation examined associations among operational risk, safety compliance and project performance at p < 0.05 (Field, 2018). The study followed the University of Ibadan Research Ethics Guidelines: participation was voluntary, written consent was obtained, respondents could withdraw, and responses were anonymized by alphanumeric codes.
4Results and discussion
4.1Respondent profile
Table 1 shows that respondents came predominantly from technical and supervisory cadres (civil/structural engineers 31.9%, architects 21.3%, project managers 19.1%), that 81.5% had six or more years of experience, that 74.5% held a bachelor's or master's/postgraduate qualification, and that private development firms and contractors accounted for nearly 70% of affiliations, with Lagos contributing 54.6% and Ibadan 45.4%. The sample is therefore experienced and credentialed, but its professional and private-sector orientation means the findings reflect commercially driven residential development more than publicly administered schemes.
| Variable | Category | Frequency | Percentage |
|---|---|---|---|
| Professional category | Civil/Structural Engineer | 45 | 31.9 |
| Real Estate Developer | 13 | 9.2 | |
| Project Manager | 27 | 19.1 | |
| Quantity Surveyor | 14 | 9.9 | |
| Architect (Site Supervision Role) | 30 | 21.3 | |
| Construction Worker/Site Operative | 12 | 8.5 | |
| Total | 141 | 100.0 | |
| Study location | Lagos | 77 | 54.6 |
| Ibadan | 64 | 45.4 | |
| Total | 141 | 100.0 | |
| Years of experience | Less than 2 years | 10 | 7.1 |
| 2–5 years | 16 | 11.3 | |
| 6–10 years | 44 | 31.2 | |
| 11–15 years | 36 | 25.5 | |
| More than 15 years | 35 | 24.8 | |
| Total | 141 | 100.0 | |
| Highest qualification | OND/HND | 20 | 14.2 |
| BSc/B.Tech/B.Eng | 53 | 37.6 | |
| MSc/PGD | 52 | 36.9 | |
| Professional Certification Only | 13 | 9.2 | |
| Ph.D | 3 | 2.1 | |
| Total | 141 | 100.0 | |
| Type of organisation | Private Real Estate Development Firm | 52 | 36.9 |
| Government/Public Sector Agency | 15 | 10.6 | |
| Construction/Contracting Company | 46 | 32.6 | |
| Consultancy/Professional Practice | 11 | 7.8 | |
| Self-Employed/Independent Contractor | 17 | 12.1 | |
| Total | 141 | 100.0 |
Source: Field survey.
4.2Operational risks and safety management practices
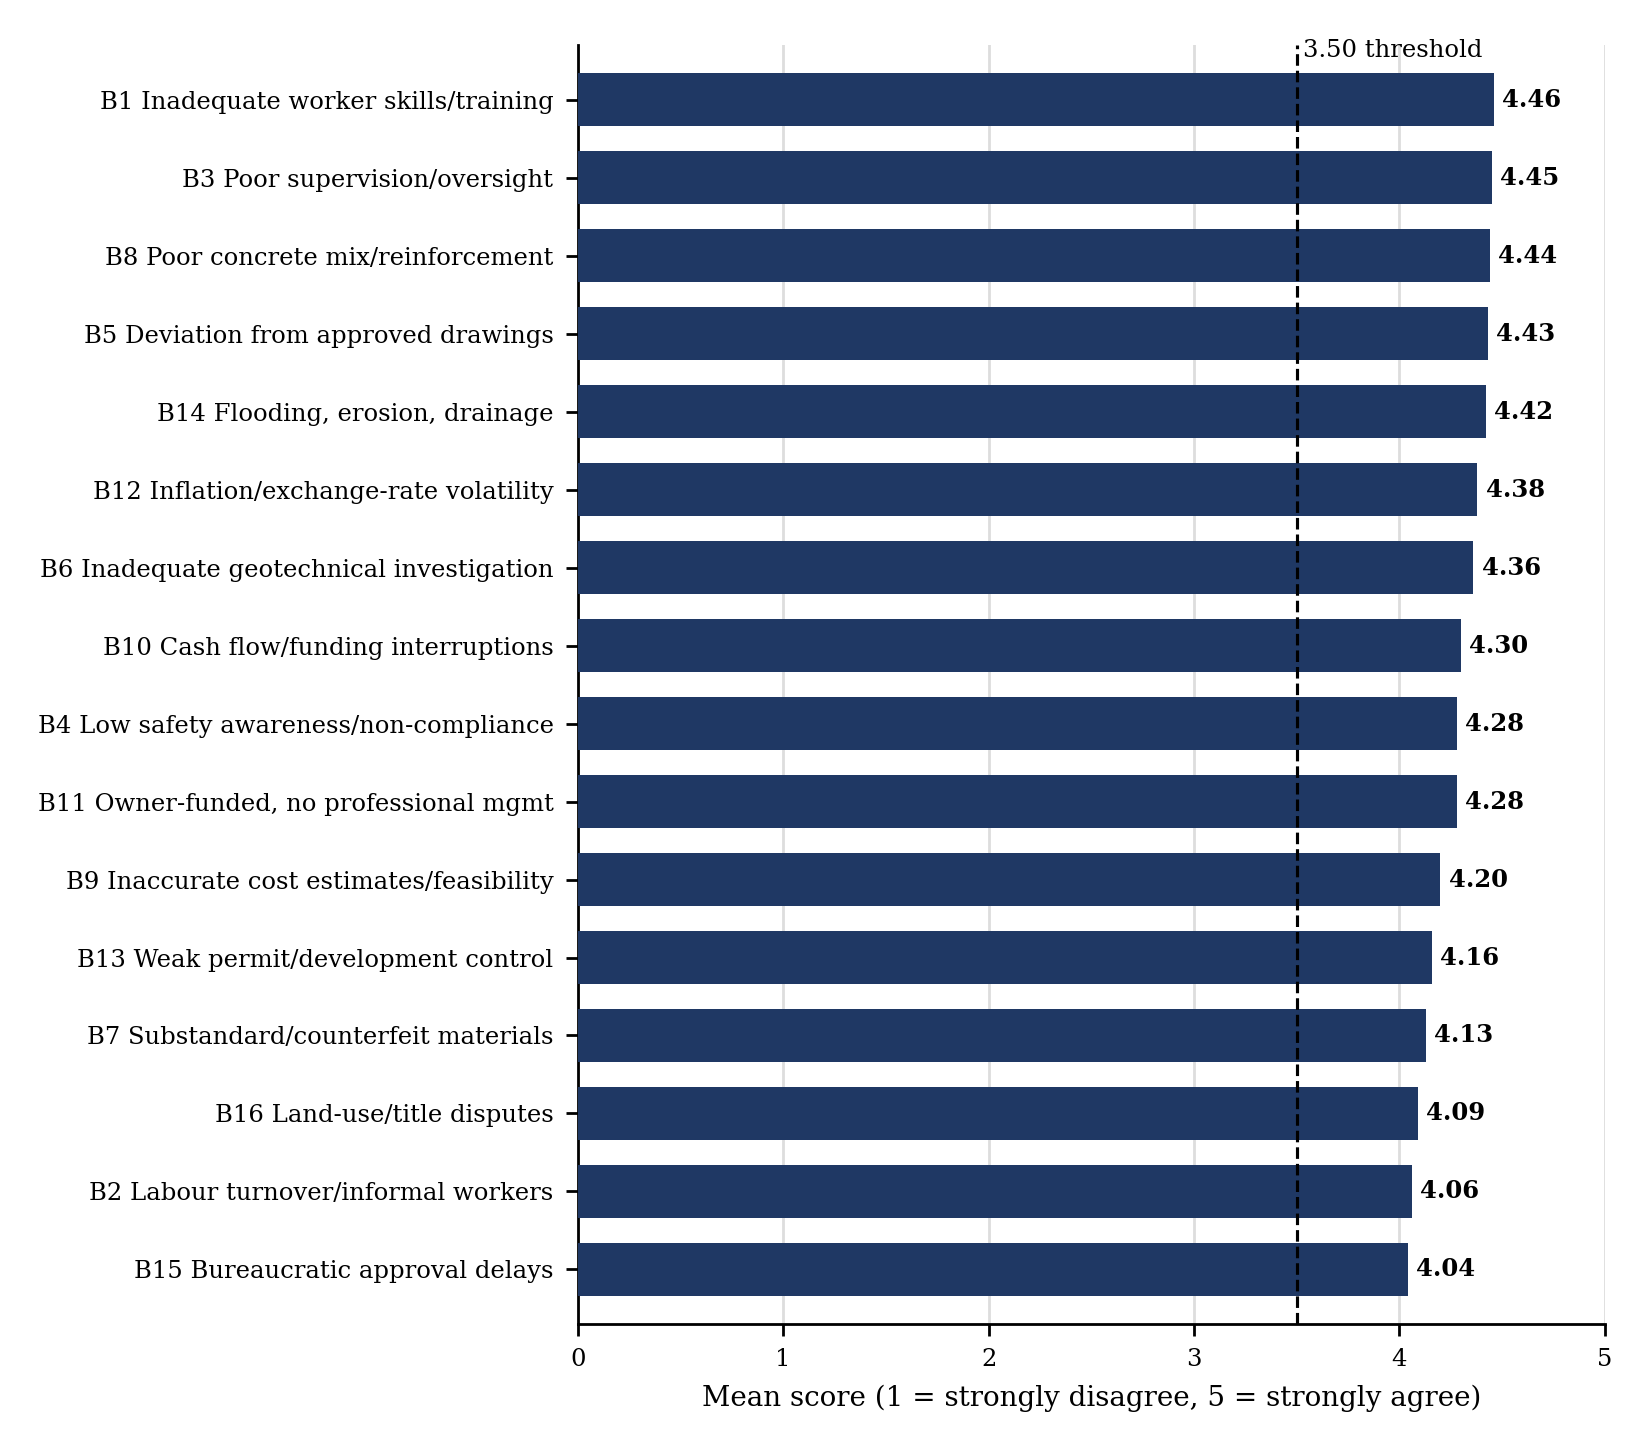
Table 2 and Figure 2 show that all sixteen operational risk items recorded high mean scores, from 4.04 to 4.46. The highest-rated risks were inadequate worker skills and training (B1, 4.46, SD 0.95), poor supervision and inadequate management oversight (B3, 4.45), poor concrete mix ratios and reinforcement detailing (B8, 4.44) and deviations from approved structural drawings (B5, 4.43), followed by flooding and inadequate drainage design (B14, 4.42), inflation and exchange-rate volatility (B12, 4.38) and inadequate geotechnical investigation (B6, 4.36). The lowest, though still above 4.00, were bureaucratic approval delays (B15, 4.04), labour turnover and reliance on informal workers (B2, 4.06) and land-use disputes and title irregularities (B16, 4.09). Standard deviations of 0.81 to 0.99 indicate close agreement. In the ranking of categories (Table 3 and Figure 3), human-related risks were regarded as most significant (mean rank 1.50), followed by technical/structural (1.55), environmental (1.72), financial/project-management (1.77) and regulatory/compliance risks (1.93).
| Code | Operational risk | Mean | SD | Rank |
|---|---|---|---|---|
| B1 | Inadequate worker skills and training | 4.46 | 0.95 | 1st |
| B2 | High labour turnover/reliance on informal workers | 4.06 | 0.91 | 15th |
| B3 | Poor supervision and inadequate management oversight | 4.45 | 0.91 | 2nd |
| B4 | Low safety awareness and non-compliance with procedures | 4.28 | 0.85 | 9th |
| B5 | Deviations from approved structural drawings/specifications | 4.43 | 0.89 | 4th |
| B6 | Inadequate geotechnical site investigations | 4.36 | 0.92 | 7th |
| B7 | Use of substandard/counterfeit construction materials | 4.13 | 0.92 | 13th |
| B8 | Poor concrete mix ratios and improper reinforcement detailing | 4.44 | 0.99 | 3rd |
| B9 | Inaccurate cost estimates and feasibility studies | 4.20 | 0.86 | 11th |
| B10 | Inconsistent cash flow and funding interruptions | 4.30 | 0.96 | 8th |
| B11 | Owner-funded construction without professional management | 4.28 | 0.94 | 9th |
| B12 | Inflation and exchange-rate volatility | 4.38 | 0.88 | 6th |
| B13 | Inadequate enforcement of building permits/development control | 4.16 | 0.89 | 12th |
| B14 | Flooding, erosion and inadequate drainage design | 4.42 | 0.85 | 5th |
| B15 | Bureaucratic delays in obtaining building approvals | 4.04 | 0.81 | 16th |
| B16 | Land-use disputes, encroachment and title irregularities | 4.09 | 0.82 | 14th |
Source: Field survey (N = 141). Scale: 1 = strongly disagree, 5 = strongly agree. Tied items share a rank.
| S/N | Risk category | Mean | SD | Rank |
|---|---|---|---|---|
| 1 | Human-Related Risks (worker incompetence, poor supervision, informal labour) | 1.50 | 0.82 | 1st |
| 2 | Technical/Structural Risks (design defects, substandard materials, poor workmanship) | 1.55 | 0.89 | 2nd |
| 3 | Financial/Project Management Risks (cost overruns, funding gaps, poor planning) | 1.77 | 0.87 | 4th |
| 4 | Regulatory/Compliance Risks (permit delays, weak enforcement, title irregularities) | 1.93 | 0.83 | 5th |
| 5 | Environmental Risks (flooding, poor drainage, soil instability, erosion) | 1.72 | 0.87 | 3rd |
Source: Field survey (N = 141). Respondents ranked categories from 1 (most significant) to 5 (least significant); Mean = mean rank, so a lower value indicates greater significance.
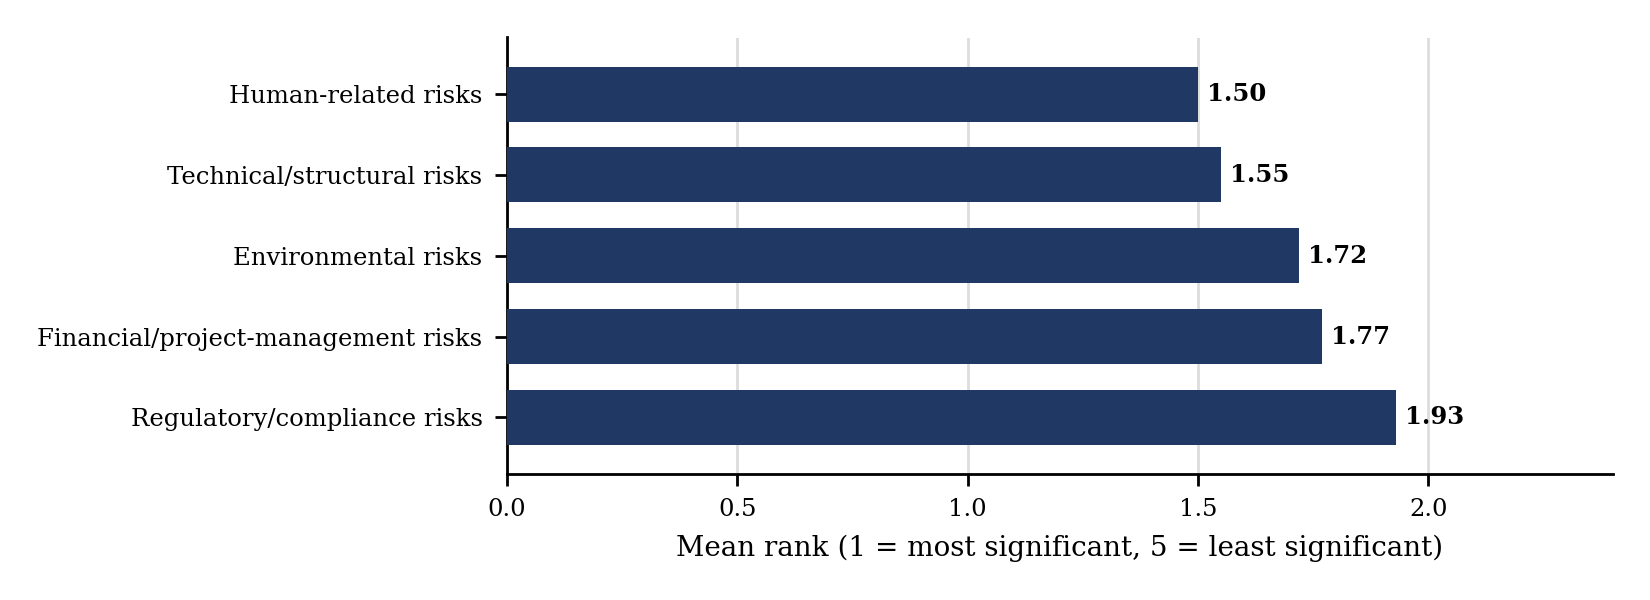
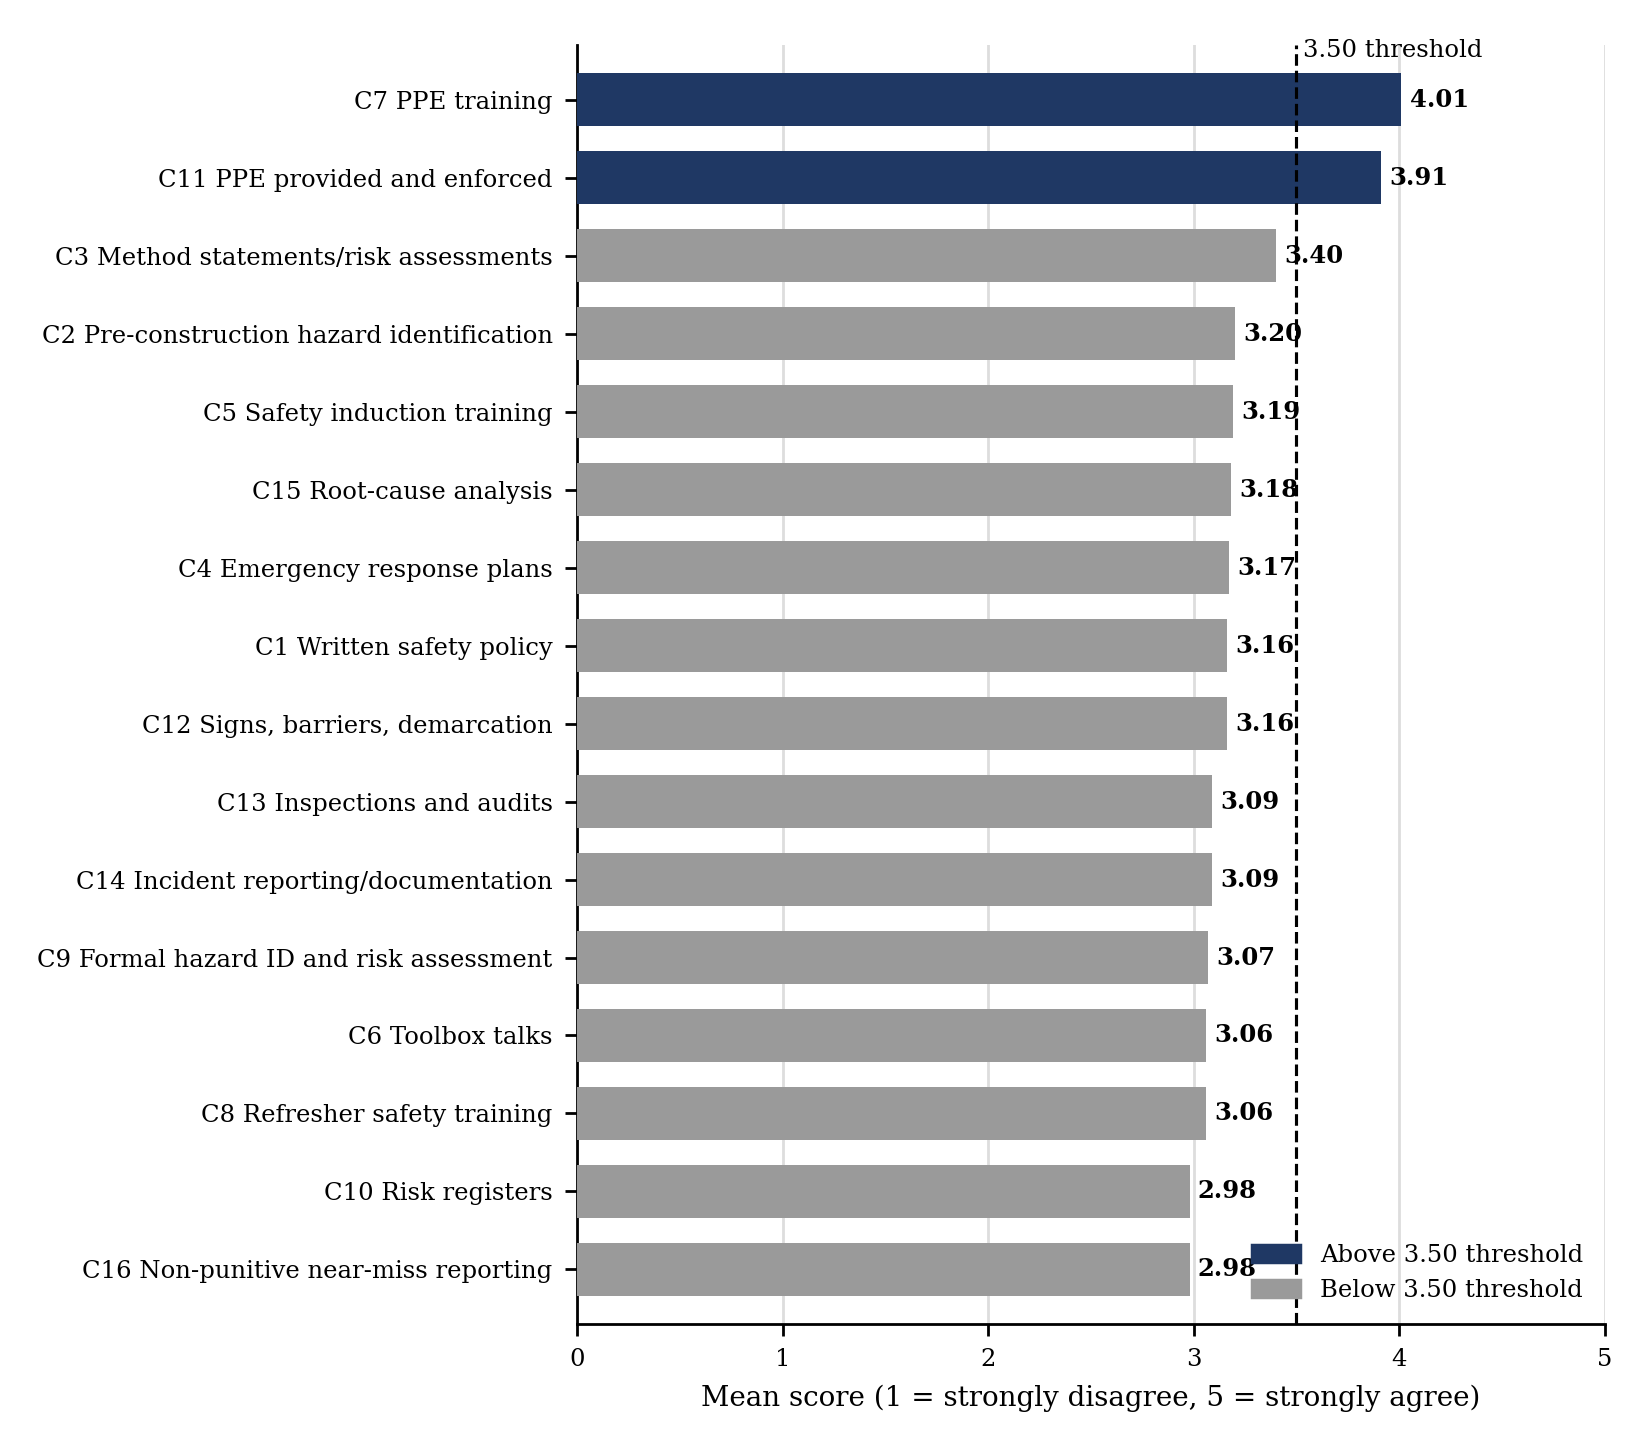
Table 4 and Figure 4 show that safety management practices were rated lower than operational risks, with means from 2.98 to 4.01. PPE training (C7, 4.01, SD 1.10) and PPE provision and enforcement (C11, 3.91) were highest. Method statements and risk assessments (C3, 3.40), pre-construction hazard identification (C2, 3.20) and induction training (C5, 3.19) were moderately rated, and written safety policy (C1) and safety signage and demarcation (C12) each scored 3.16. The lowest were risk registers (C10) and non-punitive near-miss reporting (C16), both 2.98, with refresher training (C8) and toolbox talks (C6) at 3.06. Only C7 and C11 exceeded the 3.50 threshold, and their standard deviations (1.10 and 1.02) were narrower than those of the other fourteen practices (1.34 to 1.48).
| Code | Safety management practice | Mean | SD | Rank |
|---|---|---|---|---|
| C1 | Formal written safety policy communicated to workers | 3.16 | 1.38 | 8th |
| C2 | Pre-construction hazard identification and safety planning | 3.20 | 1.46 | 4th |
| C3 | Method statements and risk assessments for high-risk activities | 3.40 | 1.48 | 3rd |
| C4 | Emergency response plans communicated to site personnel | 3.17 | 1.48 | 7th |
| C5 | Structured safety induction training for new workers | 3.19 | 1.42 | 5th |
| C6 | Regular toolbox talks and safety briefings | 3.06 | 1.42 | 13th |
| C7 | Training on correct use of PPE | 4.01 | 1.10 | 1st |
| C8 | Refresher safety training at appropriate intervals | 3.06 | 1.39 | 13th |
| C9 | Formal hazard identification and risk assessment (HIRA) | 3.07 | 1.41 | 12th |
| C10 | Risk registers maintained and regularly updated | 2.98 | 1.37 | 15th |
| C11 | PPE provided and its use enforced | 3.91 | 1.02 | 2nd |
| C12 | Safety signs, barriers and hazard demarcation maintained | 3.16 | 1.40 | 8th |
| C13 | Regular safety inspections and audits | 3.09 | 1.40 | 10th |
| C14 | Accidents/near misses consistently reported and documented | 3.09 | 1.40 | 10th |
| C15 | Root cause analysis conducted following accidents/near misses | 3.18 | 1.37 | 6th |
| C16 | Non-punitive reporting culture for near misses/unsafe conditions | 2.98 | 1.34 | 15th |
Source: Field survey (N = 141). Scale: 1 = strongly disagree, 5 = strongly agree. Tied items share a rank.
Discussion. The dominance of worker skills, supervision, concrete and reinforcement work, and conformity to drawings confirms that human and technical factors lead the respondents' risk perceptions. This aligns with Hinze (2011), Aigbavboa and Thwala (2016) and Ebekozien (2020) on training, supervision and worker competence, and with Windapo and Rotimi (2012) and Awoyera et al. (2021) on workmanship, design deficiencies and non-compliance with specifications as drivers of Nigerian building failures. It also fits Lagos site-level evidence that owner-supervised sites recorded more near misses and accidents than sites with trained supervisors (Kasim et al., 2020), although that study counted incidents whereas this one records perceptions. The financial and environmental ratings echo Aibinu and Jagboro (2002) and Adelekan (2016). Two cautions apply: all items exceeded 4.00 and the range is only 0.42, so rank differences are small, and the sample's technical and private-sector profile may colour risk perception.
For safety practice, visible measures (PPE training and provision) clearly outpaced systematic preventive ones (risk registers, near-miss reporting, refresher training, toolbox talks, hazard assessment and inspections). This is consistent with reports of weak structured safety management, inspection and incident reporting in Nigerian construction (Aigbavboa and Thwala, 2016; Oke et al., 2021). Because risk registers, hazard assessment, inspections and incident reporting are core elements of a safety management system (ISO, 2018b) and of the monitoring stage of risk management (ISO, 2018a), their low ratings point to a gap between protecting workers visibly and preventing hazards systematically. The study builds on earlier work by examining risk and practice together in residential development in Lagos and Ibadan.
4.3Operational risk, safety compliance and project performance
Table 5 and Figure 5 show that respondents agreed strongly with the statements on factors influencing compliance and on the effects of operational risk failures, with means from 4.13 to 4.50. Management commitment and visible leadership (E1, 4.50, SD 0.87) and a positive safety culture (E2, 4.49) were rated highest, followed by worker participation (E7, 4.42), training and competence (E4, 4.40) and safety communication (E6, 4.40); weak regulatory enforcement (E5, 4.35) and financial pressure (E3, 4.23) were also endorsed. Operational risk failures were linked to cost overruns (E8, 4.34), project delays (E9, 4.14), substandard quality (E10, 4.13), damage to developer reputation (E11, 4.15), reduced investor and client confidence (E12, 4.13) and legal liabilities, penalties and insurance costs (E13, 4.15). Standard deviations of 0.81 to 0.97 indicate close agreement.
| Code | Item | Mean | SD | Rank |
|---|---|---|---|---|
| E1 | Management commitment and visible leadership improve compliance | 4.50 | 0.87 | 1st |
| E2 | Positive organisational safety culture improves compliance | 4.49 | 0.81 | 2nd |
| E3 | Financial pressure/budget constraints compromise safety standards | 4.23 | 0.91 | 8th |
| E4 | Worker training and competence improve safety compliance | 4.40 | 0.92 | 4th |
| E5 | Weak regulatory enforcement reduces incentive for compliance | 4.35 | 0.94 | 6th |
| E6 | Effective safety communication improves compliance | 4.40 | 0.91 | 4th |
| E7 | Worker participation in safety planning improves compliance | 4.42 | 0.92 | 3rd |
| E8 | Operational risk failures cause significant cost overruns | 4.34 | 0.97 | 7th |
| E9 | Accidents/safety incidents cause project delays | 4.14 | 0.84 | 11th |
| E10 | Operational risk failures cause substandard quality outcomes | 4.13 | 0.88 | 12th |
| E11 | Safety incidents/failures damage developer reputation | 4.15 | 0.89 | 9th |
| E12 | Inadequate risk management reduces investor/client confidence | 4.13 | 0.92 | 12th |
| E13 | Failures cause legal liabilities, penalties and insurance costs | 4.15 | 0.95 | 9th |
Source: Field survey (N = 141). Scale: 1 = strongly disagree, 5 = strongly agree. Tied items share a rank.
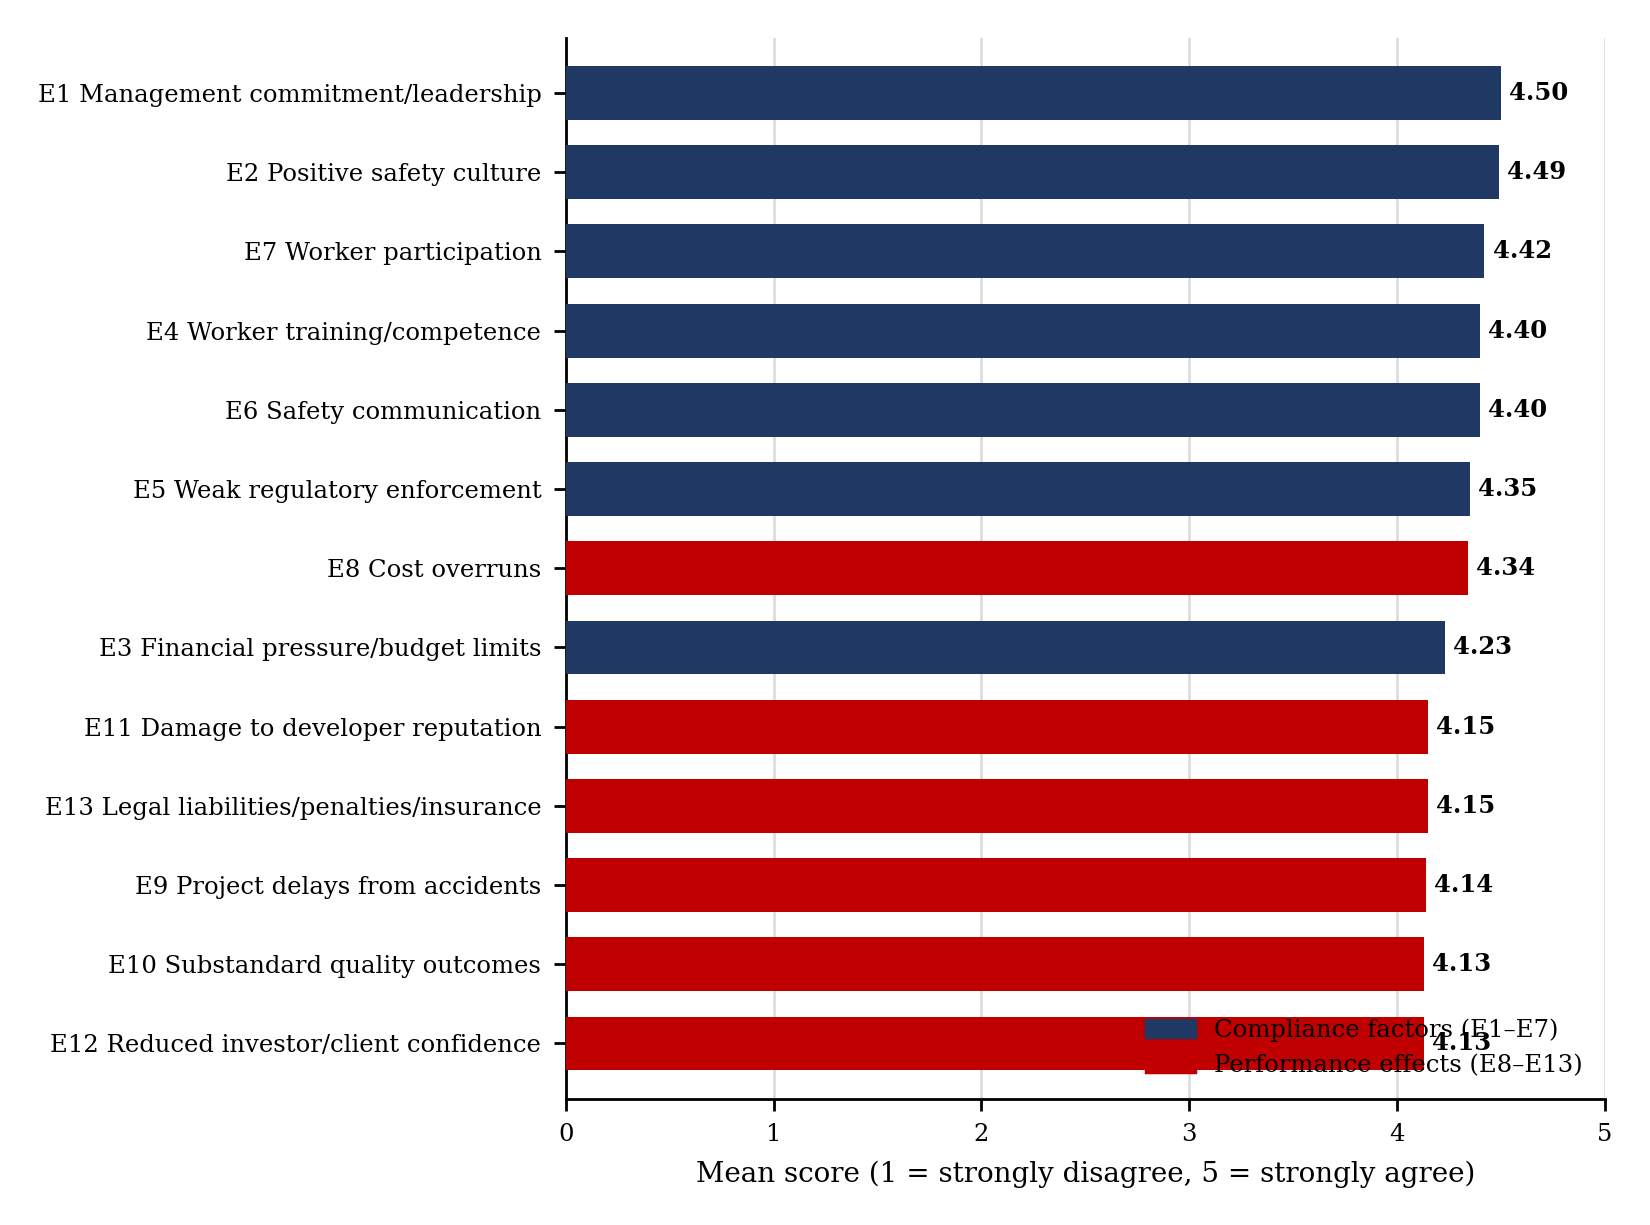
Table 6 confirms strong, positive and statistically significant associations between operational risk and safety compliance (r = 0.879, p < 0.001) and between operational risk and project performance (r = 0.840, p < 0.001).
| Variable | N | Pearson r | Sig. (2-tailed) | Decision |
|---|---|---|---|---|
| Operational risk x Safety compliance | 141 | 0.879 | < 0.001 | Significant |
| Operational risk x Project performance | 141 | 0.840 | < 0.001 | Significant |
Source: Field survey (N = 141).
Discussion. The prominence of management commitment, safety culture, worker participation, competence and communication is consistent with Cooper (2000), Neal and Griffin (2006) and Choudhry et al. (2007), and the endorsement of financial pressure and weak enforcement supports Kheni et al. (2008) and Oke et al. (2021). The linkage of risk failures to cost, delay, quality and reputational outcomes accords with Love et al. (2018), Aibinu and Jagboro (2002) and Windapo and Rotimi (2012), while the present study also records reputation, investor confidence and legal exposure alongside cost and time. These results rest on respondents' agreement with statements, not on measured compliance or performance, and the correlations describe association between ratings, not causation. The positive sign, whereby higher risk ratings accompany higher compliance and performance ratings, is counter-intuitive and may partly reflect a shared tendency to agree across items; it should be interpreted cautiously. The evidence nonetheless supports the view that operational risk management is bound up with compliance and performance in residential development.
4.4Potential of artificial intelligence
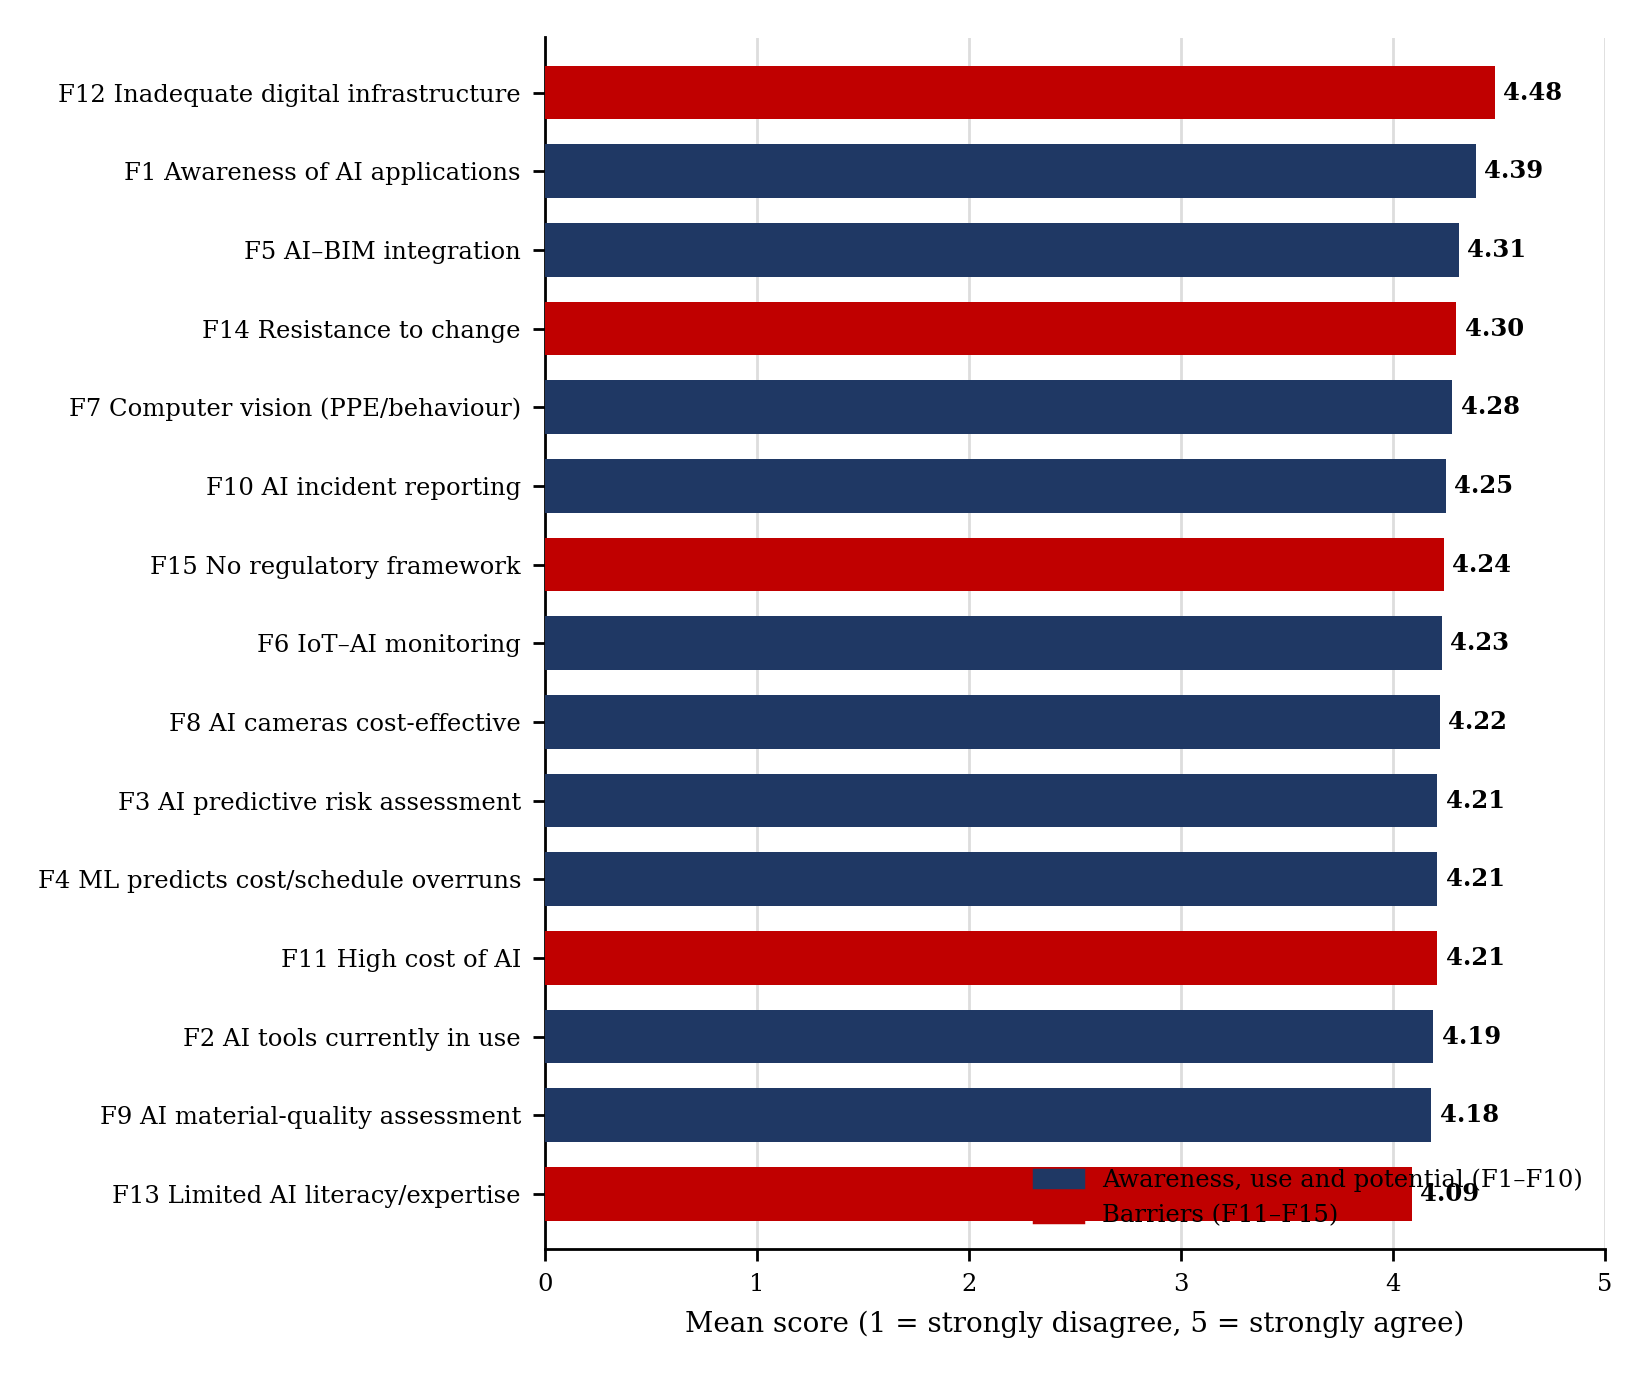
Respondents expressed high agreement with the statements on AI applications, benefits and barriers, with means from 4.09 to 4.48 (Table 7 and Figure 6). Inadequate digital infrastructure (F12, 4.48, SD 0.75) was the most strongly endorsed statement, followed by awareness of AI applications (F1, 4.39), AI-BIM integration for clash detection and structural risk simulation (F5, 4.31), resistance to change (F14, 4.30) and computer vision for PPE and behaviour monitoring (F7, 4.28). AI incident reporting (F10, 4.25), the absence of a regulatory framework (F15, 4.24), IoT-AI monitoring (F6, 4.23) and AI safety cameras (F8, 4.22) also scored highly, and limited AI literacy and expertise (F13, 4.09) was lowest. Awareness (4.39) exceeded reported use of AI tools on residential sites (F2, 4.19). Standard deviations of 0.67 to 0.89 indicate limited variation.
| Code | Item | Mean | SD | Rank |
|---|---|---|---|---|
| F1 | Awareness of AI applications in project management/safety monitoring | 4.39 | 0.73 | 2nd |
| F2 | AI-based tools currently in use on residential sites | 4.19 | 0.89 | 13th |
| F3 | AI-powered predictive risk assessment improves risk management | 4.21 | 0.72 | 10th |
| F4 | Machine learning predicts cost overruns and schedule delays | 4.21 | 0.67 | 10th |
| F5 | AI–BIM integration improves clash detection/risk simulation | 4.31 | 0.74 | 3rd |
| F6 | IoT–AI sensors enhance real-time structural/site monitoring | 4.23 | 0.76 | 8th |
| F7 | Computer vision detects PPE non-compliance/unsafe behavior | 4.28 | 0.79 | 5th |
| F8 | AI safety cameras are cost-effective vs. permanent HSE officers | 4.22 | 0.74 | 9th |
| F9 | AI material-quality assessment reduces substandard material use | 4.18 | 0.73 | 14th |
| F10 | AI incident reporting improves root-cause analysis | 4.25 | 0.72 | 6th |
| F11 | High cost of AI acquisition/implementation is a barrier | 4.21 | 0.80 | 10th |
| F12 | Inadequate digital infrastructure limits AI deployment | 4.48 | 0.75 | 1st |
| F13 | Limited AI literacy/technical expertise impedes adoption | 4.09 | 0.84 | 15th |
| F14 | Resistance to change reduces willingness to adopt AI | 4.30 | 0.69 | 4th |
| F15 | Absence of regulatory/institutional framework discourages adoption | 4.24 | 0.84 | 7th |
Source: Field survey (N = 141). Scale: 1 = strongly disagree, 5 = strongly agree. Tied items share a rank.
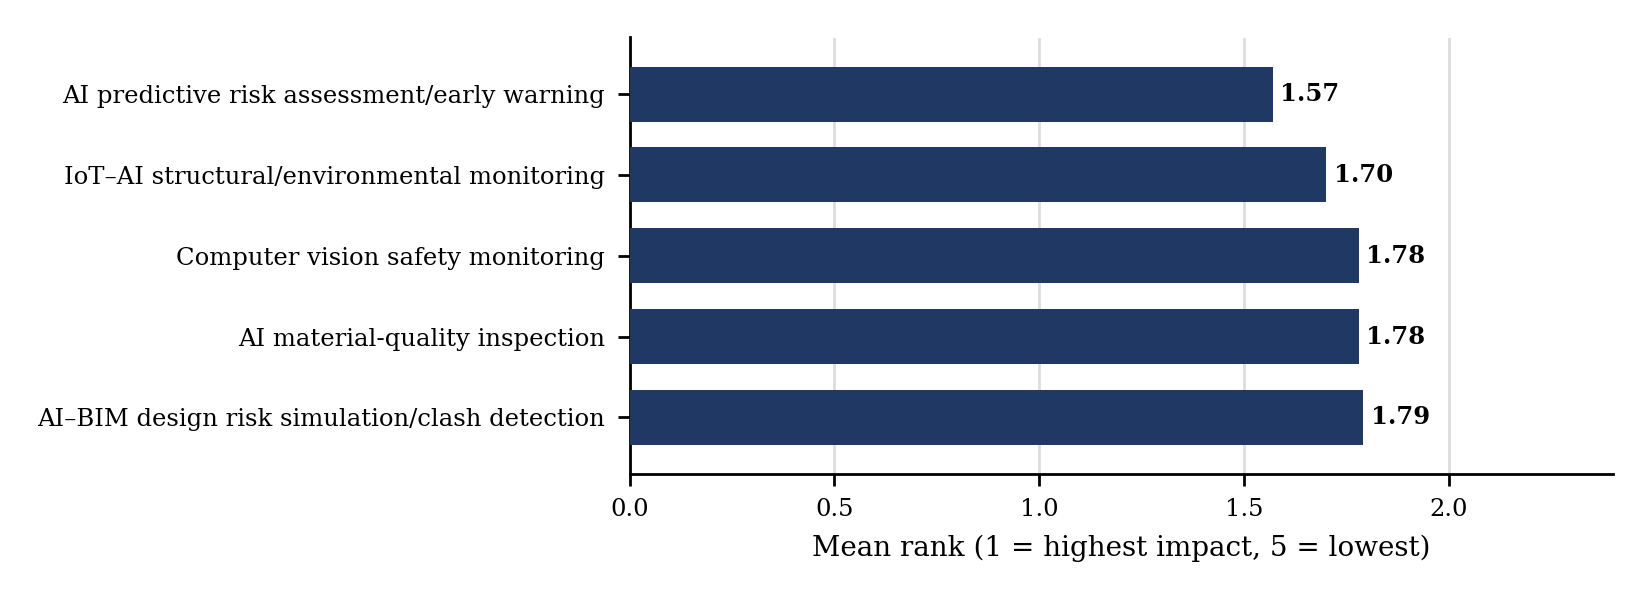
Ranked by potential impact on risk and safety management (Table 8 and Figure 7), AI-powered predictive risk assessment and early-warning systems came first (mean rank 1.57), followed by IoT-AI integration for structural and environmental monitoring (1.70); computer vision safety monitoring and AI-based material-quality inspection were jointly third (1.78), and AI-BIM integration for design risk simulation and clash detection was fifth (1.79).
| S/N | AI application | Mean | SD | Rank |
|---|---|---|---|---|
| 1 | AI-powered predictive risk assessment and early-warning systems | 1.57 | 0.86 | 1st |
| 2 | Computer vision safety monitoring (PPE/unsafe behaviour detection) | 1.78 | 0.75 | 3rd |
| 3 | AI–BIM integration for design risk simulation and clash detection | 1.79 | 0.77 | 5th |
| 4 | IoT–AI integration for structural health/environmental monitoring | 1.70 | 0.74 | 2nd |
| 5 | AI-based material quality inspection and verification systems | 1.78 | 0.89 | 3rd |
Source: Field survey (N = 141). Respondents ranked applications from 1 (highest impact) to 5 (lowest); Mean = mean rank, so a lower value indicates greater perceived impact.
Discussion. Respondents' appreciation of predictive risk assessment, computer-vision monitoring, AI–BIM integration, IoT monitoring and AI incident reporting is consistent with Pan and Zhang (2021) on AI and machine learning in predictive analytics, Fang et al. (2018) on computer vision for safety monitoring and Li et al. (2019) on IoT-based monitoring. The high ratings for perceived usefulness are in line with the emphasis of the Technology Acceptance Model on usefulness (Davis, 1989; Venkatesh and Davis, 2000), although TAM constructs were not measured directly. Infrastructure, resistance to change, regulatory uncertainty, cost and limited expertise were all endorsed as barriers, which accords with Ebekozien (2020). The slightly higher rating for awareness (4.39) than for use (4.19) is a small difference; because both are high, and because the statement on use measures agreement and not extent of adoption, the data do not demonstrate how widely AI tools are actually deployed. The results indicate perceived potential, not demonstrated effectiveness, and suggest that infrastructure, skills and regulatory clarity condition how far that potential can be realised.
5Conclusion
Operational risk in Nigerian residential real estate, as perceived by 141 respondents in Lagos and Ibadan, is high and dominated by human and technical factors: all sixteen risks scored 4.04 to 4.46, led by inadequate worker skills and training (4.46) and poor supervision (4.45), and human-related and technical/structural categories ranked first and second. Safety management is visible but preventively shallow: PPE training (4.01) and provision (3.91) were the only practices above the 3.50 threshold, whereas risk registers and non-punitive near-miss reporting (2.98) were lowest. Management commitment (4.50) and safety culture (4.49) were rated the strongest influences on compliance, and operational risk was strongly associated with safety compliance (r = 0.879) and project performance (r = 0.840), both p < 0.001; these are associations between ratings, not demonstrated effects. Respondents rated AI's potential highly, with predictive risk assessment ranked first for impact, but identified inadequate digital infrastructure (4.48) and related organizational and regulatory conditions as the main constraints. Together, the findings address the aim by showing a sector strong on visible protection but weak on systematic prevention, in which AI is a promising but conditional complement to, not a substitute for, sound risk and safety management. Practically, residential developers and regulators in Lagos and Ibadan should concentrate on supervision, worker competence and preventive routines before technology.
6Recommendations
- 1. Strengthen supervision, worker competence and preventive safety systems. Developers and contractors should place worker training first, since inadequate skills was the highest-rated risk (4.46), followed by supervision quality (4.45) and the weakest preventive practices: risk registers (2.98), hazard identification (3.07) and toolbox talks (3.06). A non-punitive near-miss reporting system (2.98) should be established, underpinned by visible management commitment, the highest-rated influence on compliance (4.50).
- 2. Focus regulatory oversight and professional guidance on the highest-rated risks. Given limited inspection capacity, LASBCA and COREN should target inspection at worker competence, supervision quality and structural and technical compliance, and professional bodies should issue guidance on deviations from approved drawings, geotechnical investigation and reinforcement detailing. Inspection outcomes should be logged digitally for audit, and agencies should begin with voluntary AI governance guidance, since the absence of a framework was endorsed as a barrier (4.24).
- 3. Adopt AI incrementally, beginning with infrastructure and skills. Digital infrastructure should come first, as it was the strongest barrier (4.48); hands-on AI literacy should follow, because awareness (4.39) exceeded reported use (4.19); and AI-powered predictive risk assessment, ranked highest for impact (mean rank 1.57), should be introduced before AI-BIM integration, as a complement to established safety management.
References
- [1]Adelekan IO (2016). Flood risk management in the coastal city of Lagos, Nigeria. International Journal of Urban Sustainable Development, 8(2), 240–248.
- [2]Aibinu AA, Jagboro GO (2002). The effects of construction delays on project delivery in Nigerian construction industry. International Journal of Project Management, 20(8), 593–599. https://doi.org/10.1016/S0263-7863(02)00028-5
- [3]Aigbavboa C, Thwala W (2016). Occupational Health and Safety Implementation Barriers and Safety Performance in the Construction Industry. University of Johannesburg.
- [4]Aven T (2016). Risk assessment and risk management: Review of recent advances on their foundation. European Journal of Operational Research, 253(1), 1–13. https://doi.org/10.1016/j.ejor.2015.12.023
- [5]Awoyera PO, Alfa J, Odetoyan A, Akinwumi II (2021). Building collapse in Nigeria during recent years: Causes, effects and way forward. IOP Conference Series: Materials Science and Engineering, 1036, 012021. https://doi.org/10.1088/1757-899X/1036/1/012021
- [6]Basel Committee on Banking Supervision (2011). Principles for the Sound Management of Operational Risk. Bank for International Settlements.
- [7]Boje C, Guerriero A, Kubicki S, Rezgui Y (2020). Towards a semantic Construction Digital Twin: Directions for future research. Automation in Construction, 114, 103179. https://doi.org/10.1016/j.autcon.2020.103179
- [8]Bryman A (2016). Social Research Methods. 5th ed. Oxford University Press.
- [9]Burke MJ, Sarpy SA, Tesluk PE, Smith-Crowe K (2006). Relative effectiveness of worker safety and health training methods. American Journal of Public Health, 96(2), 315–324. https://doi.org/10.2105/AJPH.2004.059840
- [10]Cheng MY, Kusoemo D, Gosno RA (2020). Text mining-based construction site accident classification using hybrid supervised machine learning. Automation in Construction, 118, 103265. https://doi.org/10.1016/j.autcon.2020.103265
- [11]Choudhry RM, Fang D, Mohamed S (2007). The nature of safety culture: A survey of the state-of-the-art. Safety Science, 45(10), 993–1012. https://doi.org/10.1016/j.ssci.2006.09.003
- [12]Committee of Sponsoring Organizations of the Treadway Commission (COSO) (2017). Enterprise Risk Management: Integrating with Strategy and Performance. COSO.
- [13]Cooper MD (2000). Towards a model of safety culture. Safety Science, 36(2), 111–136. https://doi.org/10.1016/S0925-7535(00)00035-7
- [14]Council for the Regulation of Engineering in Nigeria (COREN) (2021). Regulation of Engineering Practice and Enforcement in Nigeria. COREN.
- [15]Davis FD (1989). Perceived usefulness, perceived ease of use, and user acceptance of information technology. MIS Quarterly, 13(3), 319–340. https://doi.org/10.2307/249008
- [16]Ebekozien A (2020). Corrupt acts in the Nigerian construction industry: Is the ruling party fighting corruption? Journal of Contemporary African Studies, 38(3), 348–365. https://doi.org/10.1080/02589001.2020.1773420
- [17]El-Sayegh SM (2008). Risk assessment and allocation in the UAE construction industry. International Journal of Project Management, 26(4), 431–438. https://doi.org/10.1016/j.ijproman.2007.07.004
- [18]Fadamiro JA, Atolagbe AMO (2006). Urban design and quality of housing delivery in Nigeria. Journal of Environmental Technology, 5(1), 26–35.
- [19]Fang W, Ding L, Zhong B, Love PED, Luo H (2018). Automated detection of workers and heavy equipment on construction sites: A convolutional neural network approach. Advanced Engineering Informatics, 37, 139–149. https://doi.org/10.1016/j.aei.2018.05.003
- [20]Fellows RF, Liu AMM (2015). Research Methods for Construction. 4th ed. Wiley-Blackwell.
- [21]Field A (2018). Discovering Statistics Using IBM SPSS Statistics. 5th ed. Sage.
- [22]Hair JF, Black WC, Babin BJ, Anderson RE (2014). Multivariate Data Analysis. 7th ed. Pearson.
- [23]Hamdan A, Alshibani A (2022). Computer vision-based safety compliance monitoring for construction sites. Journal of Building Engineering, 52, 104468.
- [24]Hillson D (2017). Managing Risk in Projects. 2nd ed. Routledge.
- [25]Hinze JW (2011). Construction Safety. 2nd ed. Pearson Prentice Hall.
- [26]Hughes P, Ferrett E (2020). Introduction to Health and Safety in Construction. 6th ed. Routledge.
- [27]International Labour Organization (2001). Safety and Health in Construction (ILO Code of Practice). ILO.
- [28]International Labour Organization (2020). Global Trends in Occupational Safety and Health in Construction. ILO.
- [29]International Organization for Standardization (ISO) (2018a). Risk Management: Guidelines (ISO 31000:2018).
- [30]International Organization for Standardization (ISO) (2018b). Occupational Health and Safety Management Systems: Requirements with Guidance for Use (ISO 45001:2018).
- [31]Juran JM, Godfrey AB (1999). Juran's Quality Handbook. 5th ed. McGraw-Hill.
- [32]Kasim OF, Alabi AM, Wusu S (2020). Risk assessment for hazard exposure and its consequences on housing construction sites in Lagos, Nigeria. Acta Structilia, 27(1), 59–84. https://doi.org/10.18820/24150487/as27i1.3
- [33]Kheni NA, Dainty ARJ, Gibb AGF (2008). Health and safety management within small- and medium-sized enterprises (SMEs) in developing countries: Study of contextual influences. Journal of Construction Engineering and Management, 134(7), 1104–1115. https://doi.org/10.1061/(ASCE)0733-9364(2008)134:7(1104)
- [34]Lagos State Building Control Agency (LASBCA) (2022). Building Control and Enforcement Report. LASBCA.
- [35]Li CZ, Xue F, Li X, Hong J, Shen GQ (2019). An Internet of Things-enabled BIM platform for on-site assembly services in prefabricated construction. Automation in Construction, 89, 146–161. https://doi.org/10.1016/j.autcon.2018.01.001
- [36]Love PED, Ahiaga-Dagbui DD, Irani Z (2018). Cost overruns in transportation infrastructure projects: Sowing the seeds for a probabilistic theory of causation. Transportation Research Part A: Policy and Practice, 118, 782–795.
- [37]Lynn MR (1986). Determination and quantification of content validity. Nursing Research, 35(6), 382–385.
- [38]Marzouk M, Hisham M (2014). Applications of building information modeling in cost estimation of infrastructure bridges. International Journal of 3-D Information Modeling, 3(3), 1–18.
- [39]National Bureau of Statistics (2023). Nigerian Gross Domestic Product Report. National Bureau of Statistics.
- [40]Neal A, Griffin MA (2006). A study of the lagged relationships among safety climate, safety motivation, safety behavior, and accidents at the individual and group levels. Journal of Applied Psychology, 91(4), 946–953. https://doi.org/10.1037/0021-9010.91.4.946
- [41]Odeh AM, Battaineh HT (2002). Causes of construction delay: Traditional contracts. International Journal of Project Management, 20(1), 67–73. https://doi.org/10.1016/S0263-7863(00)00037-5
- [42]Oke AE, Aigbavboa CO, Semenya K (2021). Regulatory and institutional constraints to construction safety compliance in developing countries. Journal of Engineering, Design and Technology, 19(1), 45–60.
- [43]Oloyede SA (2010). Building collapse in Nigeria: The trend of casualties in the last decade. International Journal of Civil and Environmental Engineering, 10(6), 32–38.
- [44]Pan Y, Zhang L (2021). Roles of artificial intelligence in construction engineering and management: A critical review and future trends. Automation in Construction, 122, 103517. https://doi.org/10.1016/j.autcon.2020.103517
- [45]Project Management Institute (2021). A Guide to the Project Management Body of Knowledge (PMBOK Guide). 7th ed. Project Management Institute.
- [46]Reason J (1997). Managing the Risks of Organizational Accidents. Ashgate.
- [47]Russell S, Norvig P (2021). Artificial Intelligence: A Modern Approach. 4th ed. Pearson.
- [48]Saunders M, Lewis P, Thornhill A (2019). Research Methods for Business Students. 8th ed. Pearson.
- [49]Schein EH (2010). Organizational Culture and Leadership. 4th ed. Jossey-Bass.
- [50]Succar B (2009). Building information modelling framework: A research and delivery foundation for industry stakeholders. Automation in Construction, 18(3), 357–375. https://doi.org/10.1016/j.autcon.2008.10.003
- [51]UN-Habitat (2022). World Cities Report 2022: Envisaging the Future of Cities. United Nations Human Settlements Programme.
- [52]Venkatesh V, Davis FD (2000). A theoretical extension of the technology acceptance model: Four longitudinal field studies. Management Science, 46(2), 186–204. https://doi.org/10.1287/mnsc.46.2.186.11926
- [53]Windapo AO, Rotimi JO (2012). Contemporary issues in building collapse and its implications for sustainable development. Buildings, 2(3), 283–299. https://doi.org/10.3390/buildings2030283
- [54]World Bank (2021). Nigeria Development Update: Rising to the Challenge. World Bank Group.
- [55]Yamane T (1967). Statistics: An Introductory Analysis. 2nd ed. Harper and Row.
- [56]Zikmund WG, Babin BJ, Carr JC, Griffin M (2013). Business Research Methods. 9th ed. Cengage Learning.
- [57]Zou PXW, Zhang G, Wang J (2007). Understanding the key risks in construction projects in China. International Journal of Project Management, 25(6), 601–614. https://doi.org/10.1016/j.ijproman.2007.03.001