Life Cycle Assessment
Beyond the Energy Bill: Direct Emissions, Sludge and the Climate Footprint of Wastewater Reuse Trains in Lebanon
1Lebanese University, Lebanon
2Ernst & Young (EY), *Corresponding author
Published October 2026
Abstract
Water reuse is central to water security in Lebanon, but the climate burden of producing reclaimed water is rarely assessed under the country's conditions of diesel-dependent electricity and uncontrolled sludge disposal. This study compares seven complete treatment trains, from conventional activated sludge (CAS) with UV disinfection to reverse osmosis, each matched to a Lebanese reuse category. The functional unit is 1 m³ of reclaimed water. A streamlined LCA combines a technology inventory with IPCC 2019 methods for direct N₂O and CH₄, dissolved methane and sludge disposal, five improvement scenarios and a 10,000-run Monte Carlo analysis.
Gross climate impacts range from 1.24 kg CO₂ eq/m³ for an anaerobic membrane bioreactor (AnMBR) to 2.34 for a train with reverse osmosis. Direct emissions and sludge disposal account for 50–91% of the impact of every train except reverse osmosis. AnMBR, CAS + UV and a constructed wetland overlap within uncertainty, while reverse osmosis is the highest in 94% of runs. Upgrading from restricted to unrestricted irrigation quality adds only 0.15–0.20 kg CO₂ eq/m³ without reverse osmosis. Recovering 70% of dissolved methane lowers AnMBR to 0.68, a vertical-flow wetland reaches 0.98, and solar power cuts the MBR and reverse osmosis trains by 40–46%. Displacing groundwater pumping roughly halves every train's net footprint.
The results indicate that methane and N₂O control, controlled sludge management and renewable electricity should be core design criteria for wastewater reuse in Lebanon.
Keywords: life cycle assessment; water reuse; wastewater treatment; nitrous oxide; dissolved methane; anaerobic membrane bioreactor; constructed wetland; sludge; Lebanon
1Introduction
Water reuse is increasingly treated as a core part of water supply in water-scarce regions. Treated wastewater can replace freshwater for irrigation, landscaping and industry, easing pressure on depleted aquifers. Producing reclaimed water, however, consumes energy and chemicals, generates sludge, and releases nitrous oxide (N2O) and methane (CH4) directly from treatment. A treatment train that delivers better water quality may therefore carry a larger environmental burden.
Life cycle assessment (LCA) is the standard tool for weighing these trade-offs. Recent reviews show that the field has grown quickly but remains uneven (Mehmeti and Canaj, 2022; Santos et al., 2026). Most studies come from Europe, use narrow system boundaries, and identify electricity as the dominant hotspot. Few account for local conditions in developing countries (Rashid et al., 2023).
The focus on electricity may be misplaced where direct emissions are poorly controlled. Full-scale monitoring shows that N2O emission factors vary from near zero to 1.8% of influent nitrogen (Sieranen et al., 2024). The IPCC 2019 Refinement raised its default to 1.6%. In plant-level carbon footprints, direct emissions can exceed 60% of the total (Zhou et al., 2025). Anaerobic technologies add a further risk: 40–50% of the methane they produce can leave dissolved in the effluent (Velasco et al., 2018). Sludge that is landfilled without stabilisation is another major methane source (Viotti et al., 2024; Tran et al., 2025).
Lebanon illustrates these issues sharply. It faces growing water stress, yet less than 10% of its wastewater is treated and no treatment plant has an effective sludge management system (LEWAP, 2024). Plants rely on diesel generators during frequent grid outages (Lebanon Water Forum, 2021; Farajalla, 2026). Reuse for irrigation has significant potential but lacks a regulatory framework (Eid-Sabbagh et al., 2022). Draft national guidelines define reuse categories but have not been formally adopted (Newman and O'Brien, 2015).
This study asks which treatment train offers the best climate and water performance for each reuse category under Lebanese conditions. It compares seven complete trains, from conventional activated sludge with UV disinfection to reverse osmosis, for a functional unit of 1 m³ of reclaimed water.
The study makes four contributions:
- 1. It compares complete treatment trains matched to defined reuse categories, rather than individual unit processes.
- 2. It models direct N2O and CH4, dissolved methane and sludge disposal with IPCC 2019 methods, alongside electricity and chemicals.
- 3. It reflects Lebanese conditions: a diesel-heavy electricity supply, uncontrolled sludge disposal and displaced groundwater pumping.
- 4. It tests five improvement scenarios and quantifies uncertainty with 10,000 Monte Carlo runs.
The results are intended to guide Lebanon's investment in wastewater reuse and to offer a transferable approach for other water-scarce countries with similar infrastructure.
2Literature review and research gap
Recent studies agree that the environmental case for water reuse depends on energy supply, direct emissions and sludge fate, but they rarely examine all three together for a developing-country setting. This review covers 31 peer-reviewed studies published between 2022 and 2026, plus Lebanese sector reports, in five themes.
2.1LCA of wastewater treatment and reuse
Mehmeti and Canaj (2022) reviewed 59 LCAs of wastewater reuse for irrigation and found that energy supply largely determines a scheme's environmental efficiency. Santos et al. (2026) reviewed 12 recent quantitative studies; electricity contributed up to 66% of total impact in one tertiary-treatment case. Rashid et al. (2023) found that few wastewater LCAs reflect local conditions in developing countries.
Case studies show how reuse performs in practice. Irrigating vineyards in Spain with reclaimed water cut global warming by 16.2% compared with canal water plus fertiliser (Agraso-Otero et al., 2025). Reclaimed water also supported olive irrigation in Sicily with environmental and economic benefits (Vanella et al., 2023). In a hyper-arid setting reliant on desalination, adding UF/RO to tertiary treatment was justified only where the product water could legally substitute desalinated water (Aleisa et al., 2022).
2.2Direct greenhouse gas emissions
Direct emissions often rival or exceed electricity. In an AAO plant in China, direct emissions made up 68% of a 0.573 kg CO2 eq/m³ footprint, with N2O alone contributing 0.333 kg CO2 eq/m³ (Zhou et al., 2025). Across plants in East China, N2O and CH4 accounted for 17.3% and 16% of emissions (Wang et al., 2025). In Tehran, N2O contributed about 35% of the global warming impact (Samsami et al., 2025).
N2O emission factors are highly variable. Sieranen et al. (2024) measured factors from near zero to 1.8% of influent nitrogen at six full-scale plants, with strong seasonality. Effluent N2O also matters: Viotti et al. (2024) and Boiocchi et al. (2023) identified effluent N2O as a leading contributor, and Tang et al. (2024) found elevated N2O downstream of treatment plants.
2.3Membrane and anaerobic technologies
MBRs use 0.4–1.15 kWh/m³ against 0.3–0.64 for conventional activated sludge, and average 1.44 kg CO2 eq/m³ across reviewed studies (Gao et al., 2026). Glover et al. (2022) showed that advanced membrane trains for potable reuse are only favourable when low-carbon energy is available.
AnMBRs can be net energy producers (Jiménez-Benítez et al., 2023), but dissolved methane in the permeate remains the main barrier (Li et al., 2023; Zielińska and Ojo, 2023). Zhang et al. (2022) describe dissolved methane as a barrier to carbon neutrality. Recovery with membrane contactors performed below 20% on real effluent in one study (Visnyei et al., 2024), showing the gap between laboratory and practice.
2.4Nature-based and disinfection options
Constructed wetlands generally have lower impacts than activated sludge because they use little energy and no chemicals (Garfí et al., 2026; Miwornunyuie et al., 2025). Their media choice affects their footprint (Alam et al., 2023), and N2O exported in effluent can add 31–43% to measured emissions (Sun et al., 2026). In Lebanon's West Bekaa, wetlands removed 61% of BOD on average (Harb and Bilal, 2023).
For disinfection, low-pressure UV had the lowest impacts and ozonation among the highest, mainly through electricity (Demir et al., 2024).
2.5Sludge, energy and water-scarcity methods
Sludge treatment routes span roughly −617 to 670 kg CO2 eq per tonne of dry solids, depending on energy recovery (Yu et al., 2023). Reusing sludge as fertiliser instead of landfilling cut a Vietnamese plant's climate impact by 80% (Tran et al., 2025). Solar PV reduced a Turkish plant's carbon footprint by 21%, with 45% possible at full supply (Tözüm Akgül, 2023).
Reclaimed water irrigation can change soil N2O processes (Chi et al., 2025). AWARE2.0 updated water-scarcity factors for over 9,400 basins (Seitfudem et al., 2025), allowing regionalised assessment of reuse benefits.
2.6Summary of key comparative studies
Table 1 compares the scope of the most relevant recent studies with this study.
| Study | Systems compared | Setting | Direct N2O/CH4 | Sludge fate | Reuse category linked |
|---|---|---|---|---|---|
| Viotti et al. (2024) | CAS, MBR, AD + PV | Italy | Yes | Qualitative | No |
| Zhou et al. (2025) | AAO plant | China | Yes | Partial | No |
| Gao et al. (2026) | MBR vs others (review) | Global | Partial | No | No |
| Jiménez-Benítez et al. (2023) | AnMBR | Spain | Dissolved CH4 | Yes | No |
| Aleisa et al. (2022) | Tertiary vs UF/RO | Hyper-arid (Gulf) | Not reported | Not reported | Yes |
| Agraso-Otero et al. (2025) | Reclaimed vs canal water | Spain | Not reported | No | Irrigation use |
| This study | 7 trains: CAS, MBR, AnMBR, CW, UF, RO, UV, ozone | Lebanon | Yes (IPCC 2019) | Yes (landfill/dump) | Yes |
2.7Research gap
Three gaps stand out:
- 1. Most comparisons evaluate single technologies or plants rather than complete trains matched to reuse quality categories.
- 2. Direct N2O, dissolved methane and sludge disposal are rarely modelled together with electricity in the same framework.
- 3. No study has assessed reuse treatment options under Lebanon's conditions of diesel-dependent power, uncontrolled sludge disposal and groundwater depletion.
This study addresses these gaps with a scenario-based, uncertainty-tested comparison of seven trains.
3Life cycle assessment
The study is a streamlined, attributional LCA following the ISO 14040/14044 framework. It combines a technology inventory with IPCC emission methods and Lebanese energy and waste data. The calculations were implemented in a spreadsheet model with live formulas, and the scenario, sensitivity and Monte Carlo analyses in a Python script.
3.1Goal and scope
The goal is to identify which treatment train delivers reclaimed water with the lowest climate impact for each Lebanese reuse category, and which parameters control that result. The audience is Lebanese water authorities, the Ministries of Energy and Water, Environment and Agriculture, utilities, donors and LCA practitioners.
3.2Functional unit and treatment trains
The functional unit is 1 m³ of reclaimed water at the plant outlet that meets the reuse category assigned to its train. Categories follow the FAO-based proposal for Lebanon (Newman and O'Brien, 2015): Category I (unrestricted irrigation) requires secondary treatment, filtration and disinfection, while Category II (restricted irrigation) allows secondary treatment and disinfection. The seven trains and their reuse categories are listed in Table 2.
| Train | Configuration | Reuse category |
|---|---|---|
| T1 | Conventional activated sludge (CAS) + UV | II |
| T2 | CAS + ultrafiltration (UF) + UV | I |
| T3 | Membrane bioreactor (MBR) + UV | I |
| T4 | Anaerobic MBR (AnMBR) + UV | I |
| T5 | Imhoff tank + horizontal subsurface-flow constructed wetland (CW) + UV | II |
| T6 | CAS + UF + reverse osmosis (RO) + UV | I+ (industrial or high-grade) |
| T7 | CAS + UF + ozonation | I |
3.3System boundary
The boundary runs from raw wastewater entering the plant to reclaimed water leaving it. It includes electricity, chemicals, membrane replacement, direct N2O and CH4, sludge transport and disposal, and N2O from nitrogen applied to soil with the reclaimed water. Conveyance to users and construction are excluded, except membranes. The displaced groundwater pumping is reported separately as a credit, because it is equal for every train.
3.4Life cycle inventory
Electricity, chemicals, membranes and effluent quality are taken from the technology inventory compiled for this study, using mid-range values. For the RO train, upstream volumes are scaled by the RO recovery (base 0.85). For the wetland, influent is increased by evapotranspiration losses (base 10%). The main inventory parameters are summarised in Table 3.
| Parameter | Unit | Base (range) | Source |
|---|---|---|---|
| Electricity, CAS | kWh/m³ | 0.60 (0.45–0.80) | This study (inventory) |
| Electricity, MBR | kWh/m³ | 1.10 (0.80–1.50) | This study (inventory) |
| Electricity, AnMBR | kWh/m³ | 0.40 (0.20–0.60) | This study (inventory) |
| Electricity, UF / RO | kWh/m³ | 0.20 / 0.90 | This study (inventory) |
| Electricity, UV / ozone | kWh/m³ | 0.015 / 0.035 | This study (inventory) |
| Grid emission factor | kg CO2 eq/kWh | 0.626 (0.364–0.80) | 40% national generation, 60% diesel generators |
| Influent TN / BOD₅ | g/m³ | 50 / 250 | Typical medium-strength sewage |
| Sludge, CAS / MBR / AnMBR / Imhoff | kg DS/m³ | 0.20 / 0.15 / 0.06 / 0.05 | Textbook yields |
| Effluent TN, CAS / MBR / AnMBR / CW / RO | g/m³ | 20 / 12 / 45 / 25 / 2 | This study (inventory), adjusted |
| Chemical factors | kg CO2 eq/kg | NaOCl 0.92, NaOH 1.12, polymer 2.20 | City of Winnipeg (2012) |
3.5Direct emissions and sludge
- Aerobic treatment (CAS, MBR): N2O = 0.016 kg N2O-N per kg influent N (IPCC 2019; range 0.002–0.045). CH4 uses a methane correction factor of 0.03 applied to influent BOD.
- AnMBR: 0.06 kg CH4/m³ is produced, of which 45% is dissolved in the permeate and emitted (range 30–88%; Velasco et al., 2018). Recovered biogas generates electricity at 35% efficiency, credited against grid power.
- Constructed wetland: CH4 correction factor 0.1 and N2O factor 0.0079 kg N2O-N/kg N for horizontal subsurface flow (IPCC, 2014). The Imhoff pre-treatment tank uses a factor of 0.5.
- Sludge disposal: Lebanon has no controlled sludge route (LEWAP, 2024). Sludge is assumed to follow the national waste split of 57% sanitary landfill and 43% open dump (World Bank, 2025), with IPCC first-order decay parameters and 20% landfill gas capture.
- Reclaimed water use: 0.010 kg N2O-N per kg nitrogen applied to soil with irrigation. RO brine nitrogen is discharged to sea with a factor of 0.005.
3.6Impact assessment
Climate change is assessed as GWP100 with IPCC AR6 factors (27.0 for non-fossil CH4, 273 for N2O). Net electricity demand and nitrogen and phosphorus in the reclaimed water are reported as engineering and nutrient indicators. Water scarcity uses AWARE (Boulay et al., 2018; Seitfudem et al., 2025): reclaimed water displaces 1 m³ of freshwater, minus losses from evapotranspiration or RO brine. The Lebanese factor is a placeholder (50 m³ world-eq/m³) pending the AWARE2.0 country value.
3.7Scenarios, sensitivity and uncertainty
Five scenarios are assessed (Table 4).
| Scenario | Change from base |
|---|---|
| S1 Base (Lebanon today) | As described above |
| S2 Improved sludge management | All sludge to sanitary landfill with 50% gas capture |
| S3 Solar electricity | Emission factor 0.05 kg CO2 eq/kWh |
| S4 Dissolved methane recovery | 70% of AnMBR dissolved CH4 recovered |
| S5 Vertical-flow wetland | CH4 factor 0.01 and N2O factor 0.00023 (IPCC, 2014) |
Each parameter with a range is varied from minimum to maximum in a one-at-a-time sensitivity analysis. The Monte Carlo analysis draws 10,000 parameter sets from triangular distributions, shared across trains so that comparisons are paired.
4Results and discussion
Under Lebanese conditions, direct emissions and sludge disposal account for most of the climate impact of every train except RO, and no single train is clearly best. RO is the most carbon-intensive option. The largest reductions come from controlling methane, not from choosing between aerobic technologies.
4.1Results by train
Base-case results (S1), per m³ of reclaimed water, are given in Table 5.
| Train | Gross GWP (kg CO2 eq) | Net GWP after groundwater credit | Net electricity (kWh) | TN / TP in reclaimed water (g/m³) | AWARE balance (m³ world-eq) |
|---|---|---|---|---|---|
| T1 CAS + UV | 1.39 | 0.76 | 0.62 | 20 / 5.0 | −50.0 |
| T2 CAS + UF + UV | 1.54 | 0.91 | 0.82 | 20 / 4.5 | −50.0 |
| T3 MBR + UV | 1.59 | 0.96 | 1.12 | 12 / 3.0 | −50.0 |
| T4 AnMBR + UV | 1.24 | 0.62 | 0.26 | 45 / 6.0 | −50.0 |
| T5 CW + UV | 1.44 | 0.81 | 0.04 | 25 / 4.0 | −45.0 |
| T6 CAS + UF + RO + UV | 2.34 | 1.71 | 1.86 | 2 / 0.1 | −41.2 |
| T7 CAS + UF + ozone | 1.55 | 0.93 | 0.84 | 20 / 4.5 | −50.0 |
The credit for displaced groundwater pumping (0.63 kg CO2 eq/m³) is identical for all trains. Every train therefore remains a net climate burden, but reuse roughly halves it. All trains deliver a large water-scarcity benefit; RO and the wetland deliver slightly less because of brine and evapotranspiration losses.
The Monte Carlo analysis shows that T4, T1 and T5 overlap strongly. Their medians are 1.53, 1.54 and 1.61 kg CO2 eq/m³, and each is the lowest-impact train in 38%, 31% and 27% of runs respectively. T6 (RO) was the highest in 94% of runs, with a median of 2.43.
4.2Drivers of impacts
Figure 1 shows the share of each emission source in every train. Electricity is the largest single source only for MBR (44%) and RO (50%). For CAS-based trains, it is 28–34%. Direct N2O and CH4 contribute 27–31%, and methane from sludge disposal 31–35%.
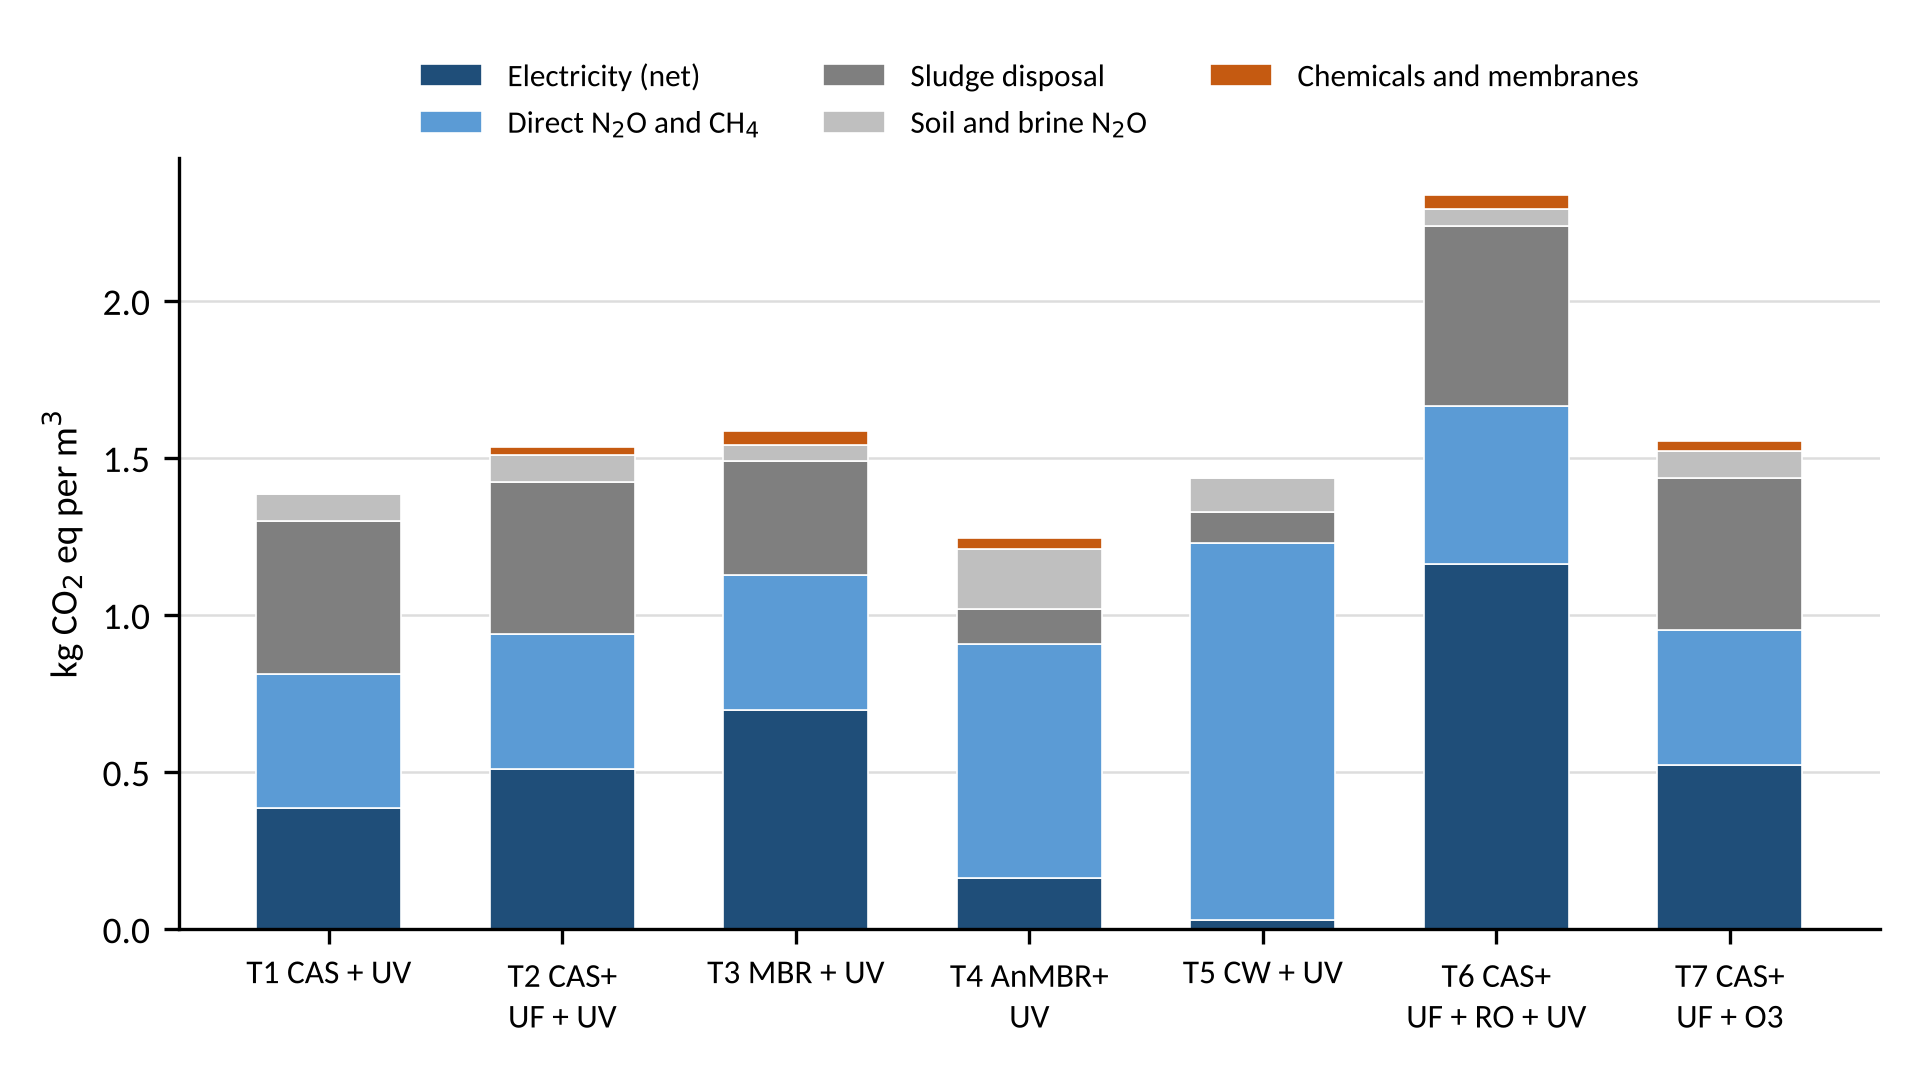
Electricity is the largest single source only for the RO train; for the low-energy AnMBR and wetland, direct methane makes up most of the footprint.
The low-energy trains shift the burden rather than remove it. For AnMBR, direct emissions are 60% of the total, mainly dissolved methane (0.75 kg CO2 eq/m³). For the wetland, direct emissions are 84%, with the Imhoff tank alone emitting about 0.65 kg CO2 eq/m³. Chemicals and membranes contribute under 3% for every train.
The sensitivity analysis confirms these drivers:
- N2O emission factor: varying it across the IPCC range moves aerobic trains by −0.30 to +0.73 kg CO2 eq/m³, the largest swing in the model.
- AnMBR dissolved methane fraction: moves AnMBR between 0.98 and 2.00.
- Wetland influent BOD and methane factors: move the wetland between about 1.0 and 1.9.
- Electricity factor: matters most for RO (1.85–2.66) and MBR (1.29–1.78).
- Sludge yield: moves CAS trains by about ±0.2.
4.3Comparison with the literature
Our aerobic results (1.4–1.6 kg CO2 eq/m³) sit within the MBR range of 0.19–4.65 reported by Gao et al. (2026), and above the 0.57 reported for a Chinese AAO plant (Zhou et al., 2025). The difference arises from uncontrolled sludge disposal and Lebanon's diesel-heavy electricity. The dominance of direct emissions agrees with Zhou et al. (2025) and Samsami et al. (2025), and contrasts with reviews that identify electricity as the main hotspot (Mehmeti and Canaj, 2022; Santos et al., 2026).
The AnMBR finding reflects the dissolved-methane problem highlighted by Li et al. (2023) and Zhang et al. (2022). Jiménez-Benítez et al. (2023) found AnMBR to be a net energy producer and carbon sink, but under recovery conditions closer to our S4. Our result that RO adds about 1 kg CO2 eq/m³ supports Aleisa et al. (2022), who found UF/RO justified only where it replaces more carbon-intensive water. The low impact of UV relative to ozone agrees with Demir et al. (2024).
4.4Trade-offs
- 1. Water quality versus climate. Moving from Category II to Category I costs only 0.15–0.20 kg CO2 eq/m³ with UF, MBR or ozone. RO adds about 0.95 kg CO2 eq/m³ and should be reserved for uses that need it.
- 2. Energy versus methane. The two lowest-energy trains (AnMBR and wetland) carry the highest methane risk. Low energy use is not a reliable proxy for low climate impact.
- 3. Nutrients versus N2O. AnMBR water retains about 45 g N/m³, a fertiliser value for irrigation, but also raises soil N2O (0.19 kg CO2 eq/m³). Fertiliser substitution was not credited and would partly offset this.
- 4. Nutrients versus water bodies. RO removes almost all nitrogen and phosphorus but discharges them in brine.
4.5Improvement opportunities
Table 6 lists the most effective single measures and their effect on gross climate impact.
| Measure | Train(s) | Gross GWP after measure (kg CO2 eq/m³) | Change from base |
|---|---|---|---|
| Recover 70% of dissolved CH4 (S4) | T4 AnMBR | 0.68 | −46% |
| Vertical-flow wetland (S5) | T5 CW | 0.98 | −32% |
| Solar electricity (S3) | T3 MBR | 0.94 | −41% |
| Solar electricity (S3) | T6 RO | 1.27 | −46% |
| Sanitary landfill with 50% gas capture (S2) | T1 CAS | 1.23 | −11% |
Figure 2 compares each train before and after its most effective single measure: every train falls by 25–46%, with solar power the best lever for the aerobic trains and methane control for AnMBR and the wetland. In the Monte Carlo analysis, AnMBR with dissolved-methane recovery was the lowest train in 99% of runs, and the vertical-flow wetland in 85%. With solar power, MBR became the most frequent winner (61% of runs). Recovery performance in practice may be lower than assumed: membrane contactors recovered under 20% of dissolved methane from real effluent in one study (Visnyei et al., 2024). Low-N2O operation, such as aeration control and full denitrification, would benefit every aerobic train.
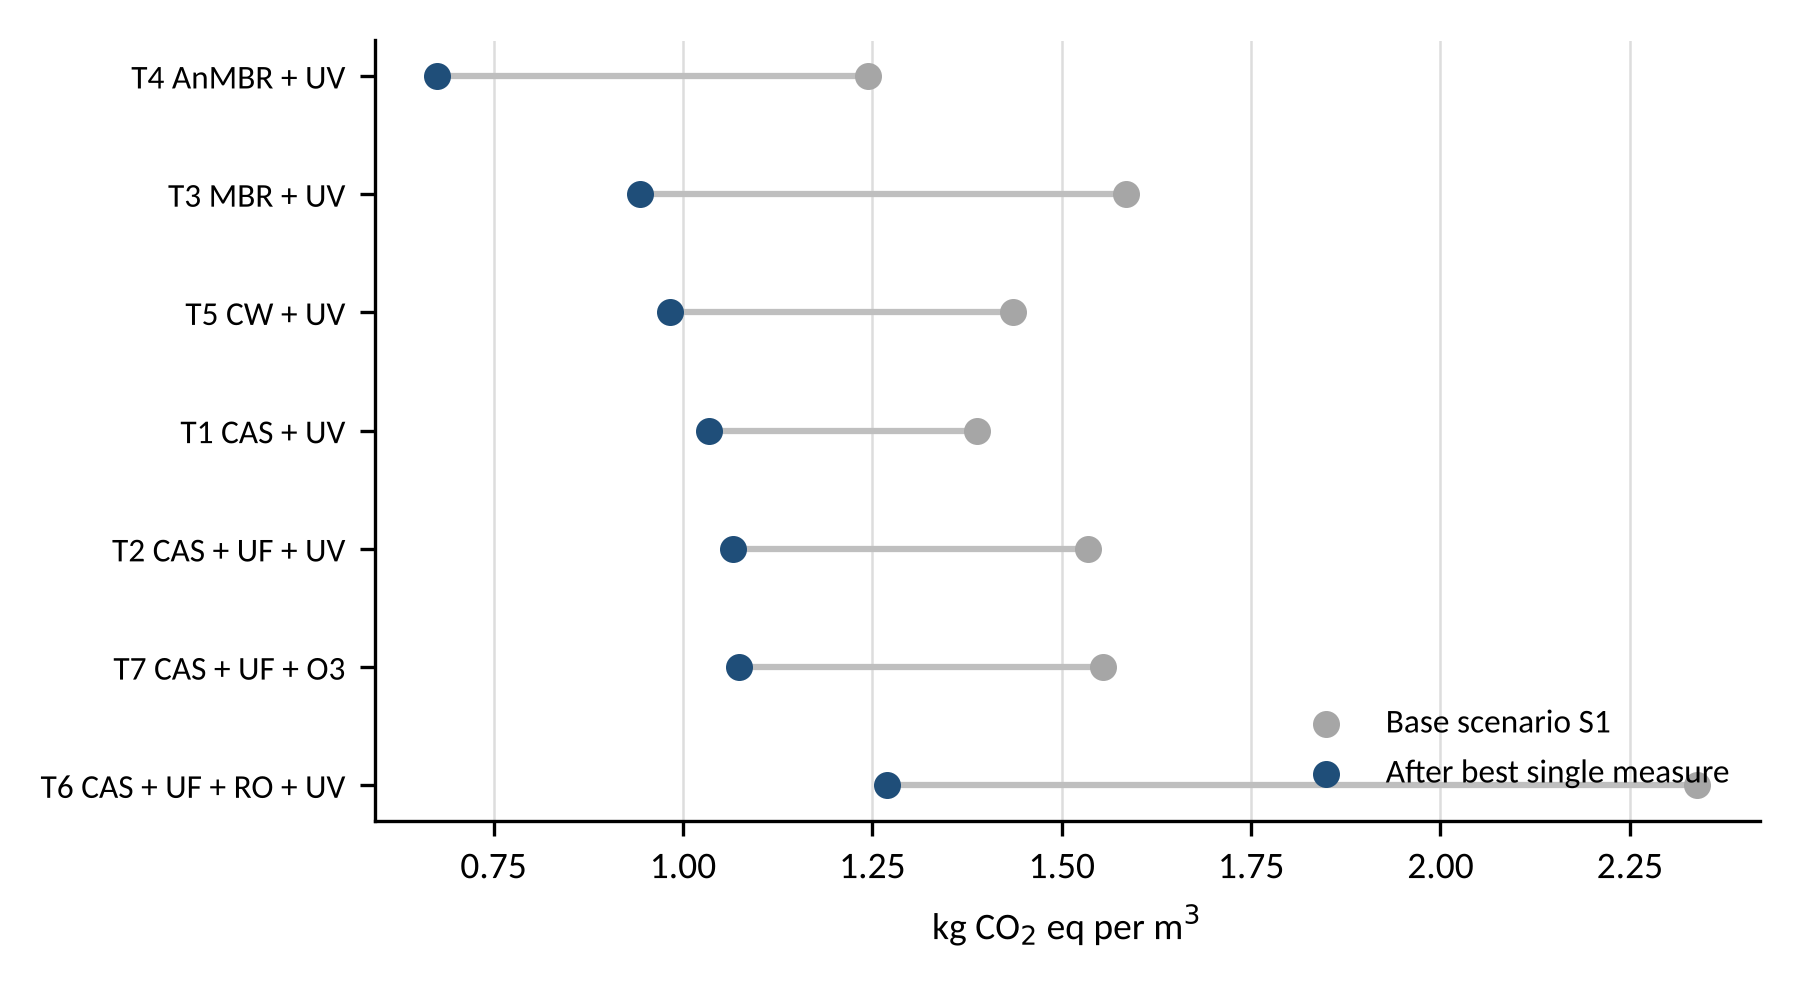
Solar power is the best lever for aerobic trains, while AnMBR and wetlands depend on methane control.
4.6Policy and industry implications
Lebanon's reuse planning should treat methane and N2O control as core design criteria, alongside effluent quality and energy cost. Three priorities follow:
- 1. Sludge. Establish a controlled sludge route, with stabilisation and either gas-capture landfilling or agricultural reuse, before expanding treatment capacity.
- 2. Technology choice. Favour simple Category II trains for restricted irrigation, and add UF, MBR or ozone for Category I only where crops require it. Reserve RO for industrial or high-grade uses that would otherwise use desalinated water.
- 3. Energy. Pair membrane trains with solar power, which also reduces exposure to diesel costs and grid outages.
AnMBR is promising for Lebanon's warm climate only if dissolved methane is recovered. Wetlands for rural communities should use vertical-flow designs with well-managed pre-treatment.
4.7Limitations
- Inventory data are secondary; no Lebanese plant was monitored.
- The IPCC 2019 N2O default may overestimate emissions at well-run plants, and the range is wide.
- Sludge yields, membrane footprints and groundwater pumping energy are assumptions, tested in sensitivity analysis.
- The AWARE factor for Lebanon is a placeholder; it does not affect the climate ranking.
- Construction, conveyance and fertiliser substitution are excluded.
- Toxicity, pathogens and micropollutants are not assessed.
5Conclusions
This study compared seven complete treatment trains producing reclaimed water under Lebanese conditions. Four conclusions follow.
- 1. Methane and N2O, not electricity, dominate most trains. Direct emissions and sludge disposal make up 50–91% of gross impact for every train except RO, where electricity accounts for 50%.
- 2. No train is clearly best today. AnMBR (1.24 kg CO2 eq/m³), CAS + UV (1.39) and the wetland (1.44) overlap within uncertainty. RO is the highest (2.34) in 94% of runs.
- 3. Higher water quality is cheap in carbon terms, except via RO. Upgrading from Category II to Category I adds 0.15–0.20 kg CO2 eq/m³, while RO adds about 0.95.
- 4. Targeted measures change the ranking. Recovering dissolved methane makes AnMBR the lowest option in 99% of runs (0.68). A vertical-flow wetland reaches 0.98, and solar power makes MBR the most frequent winner.
For Lebanon, the priority is to treat methane and N2O control, controlled sludge management and solar power as design requirements. Simple trains suit restricted irrigation, and RO should be reserved for uses that would otherwise rely on desalinated water. Reuse roughly halves each train's net footprint by displacing groundwater pumping.
Future work should use measured data from Lebanese plants, especially N2O and dissolved methane, and include fertiliser substitution, pathogen and micropollutant risk, and life cycle costing.
Declarations
Data availability. The calculation model and the scripts used for the scenario, sensitivity and Monte Carlo analyses are available from the corresponding author on reasonable request. All input data are reported in the paper or taken from the cited sources.
References
- [1]Agraso-Otero A, Vilanova de la Torre M, Malia Molleda M, Rebolledo-Leiva R, González-García S (2025). Life cycle assessment of reclaimed water irrigation in organic vineyards: environmental impacts and water stress implications in La Rioja, Spain. Agriculture, 15(23), 2505. https://doi.org/10.3390/agriculture15232505
- [2]Alam MK, Islam MAS, Saeed T, Rahman SM, Majed N (2023). Life cycle analysis of lab-scale constructed wetlands for the treatment of industrial wastewater and landfill leachate from municipal solid waste: a comparative assessment. Water, 15(5), 909. https://doi.org/10.3390/w15050909
- [3]Aleisa EE, Al-Mutairi AM, Hamoda MF (2022). Reconciling water circularity through reverse osmosis for wastewater treatment for a hyper-arid climate: a life cycle assessment. Sustainable Water Resources Management, 8, 83. https://doi.org/10.1007/s40899-022-00671-8
- [4]Boiocchi R, Viotti P, Lancione D, Stracqualursi N, Torretta V, Ragazzi M, Ionescu G, Rada EC (2023). A study on the carbon footprint contributions from a large wastewater treatment plant. Energy Reports, 9, 274–286. https://doi.org/10.1016/j.egyr.2023.06.002
- [5]Boulay AM, et al. (2018). The WULCA consensus characterization model for water scarcity footprints (AWARE). International Journal of Life Cycle Assessment, 23, 368–378. https://doi.org/10.1007/s11367-017-1333-8
- [6]Chi Y, Wei C, Yang P, Yang L, Fan L, Shi M (2025). Quantifying the influence of 3,4-dimethylpyrazole phosphate on soil nitrous oxide production in multi-year reclaimed water-irrigated soil. Agricultural Water Management, 310, 109375. https://doi.org/10.1016/j.agwat.2025.109375
- [7]City of Winnipeg (2012). South End Plant process selection report, Appendix 7: emission factors for chemicals.
- [8]Corominas L, Byrne DM, Guest JS, Hospido A, Roux P, Shaw A, Short MD (2020). The application of life cycle assessment (LCA) to wastewater treatment: a best practice guide and critical review. Water Research, 184, 116058. https://doi.org/10.1016/j.watres.2020.116058
- [9]Demir MZ, Guven H, Ersahin ME, Ozgun H, Pasaoglu ME, Koyuncu I (2024). Comparative life cycle assessment of four municipal water disinfection methods. Sustainability, 16(14), 6104. https://doi.org/10.3390/su16146104
- [10]Eid-Sabbagh K, Roukoz S, Nassif MH, Velpuri N, Mateo-Sagasta J (2022). Analysis of water reuse potential for irrigation in Lebanon. IWMI Research Report 181. https://doi.org/10.5337/2022.211
- [11]Farajalla N (2026). Lebanon's wastewater sector: a path to development and sustainability. Lebanese Center for Policy Studies.
- [12]Foglia A, et al. (2021). Comparative life cycle environmental and economic assessment of anaerobic membrane bioreactor and disinfection for reclaimed water reuse in agricultural irrigation: a case study in Italy. Journal of Cleaner Production. https://doi.org/10.1016/j.jclepro.2021.126201
- [13]Gao T, Jin Y, Xiao K (2026). Techno-economic and environmental impact assessment of membrane bioreactors for wastewater treatment: a review. Engineering, 59(4), 297–311. https://doi.org/10.1016/j.eng.2025.05.001
- [14]Garfí M, Ziegler-Rodriguez K, Josa I (2026). Life cycle assessment of constructed wetlands for wastewater treatment: environmental, social and economic opportunities and challenges. Current Opinion in Environmental Science & Health, 50, 100713. https://doi.org/10.1016/j.coesh.2026.100713
- [15]Glover CJ, Phillips JA, Marchand EA, Hiibel SR (2022). Modeling and life cycle assessment of a membrane bioreactor–membrane distillation wastewater treatment system for potable reuse. Separations, 9(6), 151. https://doi.org/10.3390/separations9060151
- [16]Harb A, Bilal G (2023). Evaluation of the efficiency of wetlands to treat water pollution in the Litani River (studying the biochemical oxygen demand). Damascus University Journal for Engineering Sciences, 39(3). https://journal.damascusuniversity.edu.sy/index.php/engj/article/view/4178
- [17]IPCC (2014). 2013 Supplement to the 2006 IPCC Guidelines: Wetlands, Chapter 6.
- [18]IPCC (2019). 2019 Refinement to the 2006 IPCC Guidelines, Vol. 4 Ch. 11 and Vol. 5 Chs. 3 and 6.
- [19]IPCC (2021). AR6 Working Group I, Chapter 7, Table 7.15.
- [20]Jiménez-Benítez A, Vázquez JR, Seco A, Serralta J, Rogalla F, Robles A (2023). Life cycle assessment of AnMBR technology for urban wastewater treatment: a case study based on a demo-scale AnMBR system. Journal of Environmental Chemical Engineering, 11(6), 111141. https://doi.org/10.1016/j.jece.2023.111141
- [21]Lebanon Water Forum (2021). Water-Energy Nexus of Water and Wastewater Services in Lebanon.
- [22]LEWAP (2024). Sludge management in Lebanon (synthesis sheet).
- [23]Li Y, Ren Y, Ji J, Li YY, Kobayashi T (2023). Anaerobic membrane bioreactors for municipal wastewater treatment, sewage sludge digestion and biogas upgrading: a review. Sustainability, 15(20), 15129. https://doi.org/10.3390/su152015129
- [24]Mehmeti A, Canaj K (2022). Environmental assessment of wastewater treatment and reuse for irrigation: a mini-review of LCA studies. Resources, 11(10), 94. https://doi.org/10.3390/resources11100094
- [25]Miwornunyuie N, Alamu SO, Mao G, Benani N, Hunter J, Oguntimein G (2025). Comparative life cycle and techno-economic assessment of constructed wetland, microbial fuel cell, and their integration for wastewater treatment. Clean Technologies, 7(3), 57. https://doi.org/10.3390/cleantechnol7030057
- [26]Newman P, O'Brien P (2015). Use of Treated Wastewater for Lebanon (draft). EU Support to Reforms – Environmental Governance / Ministry of Environment.
- [27]Rashid SS, Harun SN, Hanafiah MM, Razman KK, Liu YQ, Tholibon DA (2023). Life cycle assessment and its application in wastewater treatment: a brief overview. Processes, 11(1), 208. https://doi.org/10.3390/pr11010208
- [28]Samsami Z, Jafari AJ, Delnavaz M, et al. (2025). Environmental impact assessment of southern Tehran wastewater treatment plant using life cycle assessment (LCA). Scientific Reports, 15, 294. https://doi.org/10.1038/s41598-024-81380-4
- [29]Santos L, Brás I, Barreto A, Ferreira M, Ferreira A, Ferreira J (2026). Assessing water reuse through life cycle assessment: a systematic review of recent trends, impacts, and sustainability challenges. Processes, 14(2), 330. https://doi.org/10.3390/pr14020330
- [30]Seitfudem G, Berger M, Müller Schmied H, Boulay AM (2025). The updated and improved method for water scarcity impact assessment in LCA, AWARE2.0. Journal of Industrial Ecology, 29(3), 891–907. https://doi.org/10.1111/jiec.70023
- [31]Sieranen M, Hilander H, Haimi H, Larsson T, Kuokkanen A, Mikola A (2024). Seasonality of nitrous oxide emissions at six full-scale wastewater treatment plants. Water Science and Technology, 89(3), 603–612. https://doi.org/10.2166/wst.2023.420
- [32]Sun H, Liu Y, Sun B (2026). Unraveling nitrous oxide emissions in constructed wetlands: microbial mechanisms, driving factors, and mitigation strategies. Water, 18, 1685. https://doi.org/10.3390/w18141685
- [33]Tang W, Talbott J, Jones T, Ward BB (2024). Variable contribution of wastewater treatment plant effluents to downstream nitrous oxide concentrations and emissions. Biogeosciences, 21, 3239–3250. https://doi.org/10.5194/bg-21-3239-2024
- [34]Tözüm Akgül S (2023). Assessment of the role of photovoltaic systems in reducing the carbon footprint of wastewater treatment plants. Global NEST Journal, 25(8), 139–145. https://doi.org/10.30955/gnj.005234
- [35]Tran HV, Phan HA, Bui HM (2025). Life cycle assessment of industry wastewater treatment plant: a case study in Vietnam. RSC Sustainability, 3, 1415–1423. https://doi.org/10.1039/D4SU00511B
- [36]Vanella D, Consoli S, Continella A, et al. (2023). Environmental and agro-economic sustainability of olive orchards irrigated with reclaimed water under deficit irrigation. Sustainability, 15(20), 15101. https://doi.org/10.3390/su152015101
- [37]Velasco P, Jegatheesan V, Othman M (2018). Recovery of dissolved methane from anaerobic membrane bioreactor using degassing membrane contactors. Frontiers in Environmental Science, 6, 151. https://doi.org/10.3389/fenvs.2018.00151
- [38]Viotti P, Tatti F, Bongirolami S, Romano R, Mancini G, Serini F, Azizi M, Croce L (2024). Life cycle assessment methodology applied to a wastewater treatment plant. Water, 16(8), 1177. https://doi.org/10.3390/w16081177
- [39]Visnyei M, Bakonyi P, Rozsenberszki T, Kook L, Komáromy P, Bélafi-Bakó K, Nemestóthy N (2024). Mitigated CH₄ release of anaerobic waste fermentation is enabled through effluent degassing system equipped with a polydimethylsiloxane membrane contactor. Chemical Engineering Journal Advances, 18, 100607. https://doi.org/10.1016/j.ceja.2024.100607
- [40]Wang H, Zhang X, Li L, Lin Z, Tian Y (2025). Carbon emission characteristics and low-carbon operation evaluation of some wastewater treatment plants in East China. Applied Sciences, 15(12), 6716. https://doi.org/10.3390/app15126716
- [41]World Bank (2025). Lebanon Emergency Assistance Project (P509428): Environmental and Social Review Summary.
- [42]Yu S, Deng S, Zhou A, Wang X, Tan H (2023). Life cycle assessment of energy consumption and GHG emission for sewage sludge treatment and disposal: a review. Frontiers in Energy Research, 11, 1123972. https://doi.org/10.3389/fenrg.2023.1123972
- [43]Zhang X, Gu J, Meng S, Liu Y (2022). Dissolved methane in anaerobic effluent: emission or recovery? Frontiers of Environmental Science & Engineering, 16(4), 54. https://doi.org/10.1007/s11783-022-1537-4
- [44]Zhou S, Yu Y, Zheng Z, Zhou L, Wang C, Deng R, Hursthouse A, Deng M (2025). Research on carbon emission accounting of municipal wastewater treatment plants based on carbon footprint. Processes, 13, 3057. https://doi.org/10.3390/pr13103057
- [45]Zielińska M, Ojo A (2023). Anaerobic membrane bioreactors (AnMBRs) for wastewater treatment: recovery of nutrients and energy, and management of fouling. Energies, 16(6), 2829. https://doi.org/10.3390/en16062829