Artificial Intelligence
Explainable Artificial Intelligence for Heart Disease Prediction: A SHAP and LIME-Based Approach — A Review
Department of Information Technology, Siddhant College of Engineering, Sudumbare, Pune, Maharashtra, India
Published October 2026
Abstract
Cardiovascular disease continues to be one of the leading causes of mortality worldwide, making early and accurate risk prediction essential for timely clinical intervention. Machine learning (ML) models such as Random Forest, Support Vector Machine and XGBoost have achieved high predictive accuracy for heart disease, yet their black-box nature limits clinician trust and hinders real-world adoption. This paper reviews recent research on Explainable Artificial Intelligence (XAI) applied to heart disease prediction, with a focus on two widely used model-agnostic interpretability techniques — SHAP (SHapley Additive exPlanations) and LIME (Local Interpretable Model-agnostic Explanations). It presents the theoretical foundations of both techniques, examines recent studies in terms of dataset, classifier, XAI method and reported performance, identifies open research gaps, and proposes an eight-phase methodology and system architecture for an XAI-based Clinical Decision Support System (CDSS) that predicts heart disease risk while generating transparent, feature-level explanations at both the global (population) and local (patient) level. Challenges, limitations and future research directions are also discussed. The review concludes that combining high-performing ensemble classifiers with SHAP and LIME can substantially improve the transparency, accountability and clinical usability of AI-assisted cardiovascular diagnosis.
Keywords: Explainable Artificial Intelligence (XAI); SHAP; LIME; Heart Disease Prediction; Machine Learning; Clinical Decision Support System; Shapley Values; Model Interpretability
1Introduction
Cardiovascular disease remains one of the leading causes of mortality worldwide, making early and accurate diagnosis critical for effective treatment and patient survival. In recent years, machine learning (ML) models have shown strong performance in predicting heart disease risk from clinical and demographic data. However, most high-performing models, such as ensemble methods and deep neural networks, function as “black boxes” — they offer little to no insight into why a particular prediction was made. In a healthcare context, this lack of transparency is a significant barrier to clinical adoption, since physicians and patients need to understand and trust the reasoning behind a diagnosis before acting on it.
Explainable Artificial Intelligence (XAI) has therefore emerged as an active research area that seeks to combine the predictive strength of modern ML models with human-interpretable explanations. Among the many XAI techniques proposed in the literature, SHAP (SHapley Additive exPlanations) and LIME (Local Interpretable Model-agnostic Explanations) have become the two most widely adopted model-agnostic approaches for tabular clinical data, because they can be layered on top of any trained classifier without altering its internal architecture. This paper reviews how SHAP and LIME have been applied to heart disease prediction in recent literature, explains the theoretical basis of both techniques, and proposes a methodology for a combined ML + XAI clinical decision-support framework.
The remainder of this paper is organized as follows. The next section presents the theoretical background of the classifiers, SHAP and LIME. the relevant section reviews recent literature, summarized in a comparative table in the relevant section. the relevant section discusses the research gap identified from the review, followed by the problem statement, objectives and scope in Sections VI–VIII. the relevant section describes the dataset used in the proposed work, and Sections X–XI present the proposed system architecture and methodology. Sections XII–XV discuss tools, expected outcomes, challenges and future scope, before the paper concludes in the relevant section.
2Theoretical background
2.1Machine learning classifiers for heart disease prediction
Logistic Regression (LR) is a linear baseline classifier that models the probability of heart disease as a sigmoid function of a weighted sum of clinical features; it is fast and inherently interpretable but struggles with non-linear feature interactions. Decision Tree (DT) classifiers partition the feature space using a sequence of threshold-based splits, giving a rule-based structure that is easy to visualize but prone to overfitting on small clinical datasets. Random Forest (RF) mitigates this by training an ensemble of decorrelated decision trees and averaging their outputs, typically improving accuracy and robustness at the cost of transparency. Support Vector Machine (SVM) finds an optimal separating hyperplane, or a non-linear boundary via kernel functions, between healthy and at-risk patients, and performs well on moderately sized, well-scaled datasets. Gradient Boosting and XGBoost build trees sequentially, with each new tree correcting the errors of the previous ensemble; they are consistently reported as top performers on the Cleveland and Framingham heart disease datasets, but their layered, additive structure makes them the least transparent of the classifiers considered in this review — which is precisely why post-hoc explainability techniques such as SHAP and LIME are required.
2.2SHAP (SHapley Additive exPlanations)
SHAP is grounded in cooperative game theory, specifically the Shapley value introduced by Shapley in 1953 to fairly distribute a payout among players in a coalition [13]. Lundberg and Lee reformulated this concept for machine learning by treating each input feature as a “player” and the model’s prediction as the “payout” to be distributed [14]. For a given patient record, SHAP computes the average marginal contribution of each clinical feature — e.g., cholesterol, chest pain type, or maximum heart rate — across all possible combinations (coalitions) of the remaining features, producing a Shapley value φᵢ for every feature i. The prediction for that patient can then be expressed as the sum of a baseline value (the average model output over the training set) and the individual Shapley values, so that φ1 + φ2 + ... + φₙ equals exactly the difference between the model’s prediction and the baseline. SHAP is the only additive attribution method that simultaneously satisfies the local accuracy, missingness and consistency properties, which is why it is regarded as the most theoretically sound and widely used interpretability method for tabular clinical data [14, 15]. In practice, efficient estimators such as TreeSHAP — for tree-based ensembles like Random Forest and XGBoost — and KernelSHAP — a model-agnostic approximation — are used to avoid the exponential cost of computing exact Shapley values, and SHAP summary and waterfall plots are commonly used to present both global (population-level) and local (patient-level) feature importance.
2.3LIME (Local Interpretable Model-agnostic Explanations)
LIME, proposed by Ribeiro et al., explains an individual prediction by approximating the original black-box model locally with a simple, interpretable surrogate model such as a sparse linear regression [16]. Given a specific patient instance, LIME generates a set of perturbed samples in the neighbourhood of that instance, obtains the black-box model’s predictions for each perturbed sample, weights the samples by their proximity to the original instance, and fits an interpretable linear model on this weighted neighbourhood. The coefficients of the resulting local surrogate model indicate which clinical features pushed the prediction toward or away from a heart disease diagnosis for that specific patient. Because LIME needs only query access to the underlying model’s predictions, it is fully model-agnostic and can be applied to any classifier; however, its explanations depend on the choice of neighbourhood size, the sampling strategy, and the number of features retained in the surrogate model — a sensitivity that several reviewed studies flag as a limitation and a reason to use SHAP and LIME together rather than in isolation [10, 11].
3Literature review
A closely related conference study evaluated seven baseline classifiers — Decision Tree, Random Forest, Gradient Boosting, XGBoost, Logistic Regression, K-Nearest Neighbors and SVM — on a UCI-derived dataset of 1,026 instances under a combined SHAP and LIME explanation framework, and reported that a Decision Tree classifier achieved the highest accuracy of 99.35% [1].
A growing body of work has combined ensemble classifiers with SHAP and LIME to improve both accuracy and interpretability. Rezk et al. proposed XAI-augmented voting ensemble models that combine LightGBM and XGBoost with SHAP and LIME explanations, showing that hybrid ensemble learning can retain high accuracy while becoming more transparent to clinicians [2]. A related study evaluated SHAP together with feature-importance ranking on a combined dataset drawn from Egyptian and Saudi Arabian patients, reporting an accuracy of 97.57% and highlighting SHAP’s effectiveness at identifying the clinical features that most influenced each prediction [3].
Soft-voting ensembles built from Random Forest, Decision Tree and Support Vector Machine classifiers have also been paired with SHAP and LIME to jointly validate feature relevance on a large heart-disease dataset of 5,110 records with 76 raw attributes, from which 14 clinically relevant features were retained [4]. To address high-dimensional clinical data, an Enhanced Squirrel Search Optimization (ESSO) feature-selection method was combined with a Random Forest classifier and SHAP/LIME explanations for ischemic heart disease prediction, achieving 96.4% accuracy, an F1-score of 0.96 and an AUC of 0.98 while reducing the number of input features needed for a reliable diagnosis [5]. Similarly, a componental framework addressing class imbalance through proximity-weighted sampling and dimensionality reduction integrated SHAP and LIME to interpret an active-stacking ensemble model [6], while the HXAI-ML framework combined SHAP, LIME and permutation importance analysis (PIA) to report 98.78% accuracy on the Cleveland dataset and 99.24% on the Framingham dataset [7].
Beyond static datasets, XAI has also been extended to sensor-driven and multimodal settings. A feature-sensitized Internet-of-Medical-Things (IoMT) framework combined Random Forest classification (accuracy and F1-score of 0.955) with LIME for local surrogate explanations and SHAP for global explanations of continuously monitored patient vitals [8]. An Interpretable Ensemble Learning Framework (IELF) combined Explainable Boosting Machines with XGBoost and evaluated explanation stability across folds using Kendall’s tau, reporting an AUC of 0.899 and 88.5% accuracy on the Cleveland dataset and an AUC of 0.696 and 82.6% accuracy on the larger but noisier Framingham dataset — indicating that consistency of explanations, not just predictive accuracy, is becoming a key evaluation criterion in this field [9].
A smaller but important set of studies directly compares SHAP and LIME on the same underlying classifier. Independent comparative analyses of Random Forest models trained on the UCI heart disease dataset (ROC-AUC ≈ 0.90) found that SHAP and LIME largely agree on the top contributing clinical features, such as chest pain type, maximum heart rate and ST-segment depression, but can diverge for borderline or ambiguous predictions, suggesting that the two methods are complementary rather than interchangeable [10]. Broader surveys of XAI in health monitoring — spanning gait analysis, cancer, stroke and cardiac-arrest detection — report that LIME offers clear instance-level explanations but is sensitive to its sampling and perturbation parameters, an open challenge that motivates cross-validating LIME output against SHAP [11]. Related work applying LIME and SHAP to other high-stakes biomedical domains, such as breast-cancer mass classification using deep neural networks, confirms that the two methods highlight largely overlapping but not identical sets of influential features, reinforcing the value of a dual-method comparison [12].
4Comparative summary of reviewed studies
Table 1 summarizes the dataset, classifier, XAI technique and reported performance of the primary studies reviewed above, providing a consolidated view of the current state of the art in XAI-based heart disease prediction.
| Ref. | Dataset (size) | Best Model(s) | XAI Method | Reported Performance |
|---|---|---|---|---|
| [1] | UCI-derived (1,026) | Decision Tree (best of 7) | SHAP + LIME | 99.35% accuracy |
| [2] | Public heart-disease data | LightGBM + XGBoost (voting) | SHAP + LIME | High accuracy (ensemble) |
| [3] | Combined Egypt/Saudi data | ML pipeline, SF-2 feature set | SHAP | 97.57% accuracy, 98% AUC |
| [4] | 5,110 records, 76 attrib. | RF + DT + SVM (soft-voting) | SHAP + LIME | 14 features validated |
| [5] | Ischemic heart disease data | Random Forest + ESSO | SHAP + LIME | 96.4% acc., F1 0.96, AUC 0.98 |
| [6] | Imbalanced heart-disease data | Active stacking ensemble | SHAP + LIME | Improved minority-class recall |
| [7] | Cleveland / Framingham | HXAI-ML hybrid model | SHAP + LIME + PIA | 98.78% / 99.24% accuracy |
| [8] | IoMT sensor vitals | Random Forest | LIME (local) + SHAP (global) | Acc./F1 = 0.955 |
| [9] | Cleveland / Framingham | EBM + XGBoost (IELF) | SHAP + LIME | AUC 0.899 / 0.696 |
| [10] | UCI heart disease | Random Forest | SHAP vs. LIME comparison | ROC-AUC ≈ 0.90 |
5Research gap
Across the surveyed literature, three consistent gaps emerge. First, most studies rely on a single, comparatively small public dataset — commonly the Cleveland subset (n ≈ 303) — which limits how well reported accuracy and explanation quality generalize to broader patient populations. Second, SHAP and LIME are frequently applied independently rather than compared systematically for agreement or consistency, even though several studies report partial disagreement between the two methods on borderline cases [10, 11]. Third, very few frameworks progress beyond offline, notebook-based explanation generation to a deployable, clinician-facing interface that presents predictions and explanations together in real time. The project proposed in this paper is positioned to address these gaps by explicitly comparing SHAP and LIME outputs for consistency and by including a web-based interface that surfaces both global and local explanations alongside each prediction.
6Problem statement
While ML-based heart disease prediction systems can achieve high accuracy, their lack of interpretability limits their usability in real clinical settings. Doctors are unlikely to trust or act upon a prediction without understanding the contributing factors. There is a need for a system that not only predicts the presence or risk of heart disease accurately but also explains which features (e.g., cholesterol level, blood pressure, chest pain type, age) most influenced a specific prediction, in a way that is understandable to both technical and non-technical stakeholders.
7Objectives
- 1. To collect and preprocess a heart disease dataset (e.g., UCI Heart Disease / Cleveland dataset) for model training.
- 2. To build and train one or more machine learning classification models (e.g., Random Forest, XGBoost, Logistic Regression, or a neural network) to predict the presence of heart disease.
- 3. To evaluate model performance using standard metrics (accuracy, precision, recall, F1-score, ROC-AUC).
- 4. To apply SHAP for global and local feature-importance interpretation of model predictions.
- 5. To apply LIME for instance-level, human-readable explanations of individual predictions.
- 6. To compare the insights provided by SHAP and LIME and assess their consistency and usefulness.
- 7. To (optionally) develop a simple web-based interface where a user can input patient data and view both the prediction and its explanation.
8Scope
The proposed research focuses on developing an Explainable Artificial Intelligence-based Clinical Decision Support System for heart disease prediction using publicly available patient datasets. The system will integrate machine learning algorithms with SHAP and LIME to generate accurate, interpretable predictions. The proposed framework is expected to predict the risk of heart disease based on patient clinical parameters, identify the most influential clinical features contributing to a diagnosis, generate transparent feature-level explanations for every prediction, present both global (population-level) and local (patient-level) interpretability, and assist healthcare professionals in validating and trusting AI-generated predictions.
The system is limited to structured/tabular clinical data (e.g., age, blood pressure, cholesterol, ECG results, chest pain type) and does not extend to image-based diagnostics such as ECG waveform analysis or angiograms. It is intended as a decision-support and research prototype rather than a certified diagnostic tool for direct clinical deployment. The system can be applied in hospitals, diagnostic laboratories, healthcare institutions, and medical research settings, with future enhancements including integration with Electronic Health Records (EHR), wearable healthcare devices, cloud-based deployment, and real-time patient monitoring.
9Dataset description
The proposed work uses the publicly available UCI / Cleveland Heart Disease dataset, which is also the most common benchmark across the studies reviewed above. It contains 14 clinically relevant attributes describing patient demographics, resting measurements, exercise-test results and a binary diagnosis label, summarized in Table II.
| Attribute | Description |
|---|---|
| age | Patient age in years |
| sex | Patient sex (1 = male, 0 = female) |
| cp | Chest pain type (typical angina, atypical angina, non-anginal pain, asymptomatic) |
| trestbps | Resting blood pressure (mm Hg) on admission |
| chol | Serum cholesterol (mg/dl) |
| fbs | Fasting blood sugar > 120 mg/dl (1 = true, 0 = false) |
| restecg | Resting electrocardiographic results |
| thalach | Maximum heart rate achieved during exercise |
| exang | Exercise-induced angina (1 = yes, 0 = no) |
| oldpeak | ST depression induced by exercise relative to rest |
| slope | Slope of the peak exercise ST segment |
| ca | Number of major vessels (0–3) colored by fluoroscopy |
| thal | Thalassemia status (normal, fixed defect, reversible defect) |
| target | Presence of heart disease (1 = disease, 0 = no disease) |
10Proposed system architecture
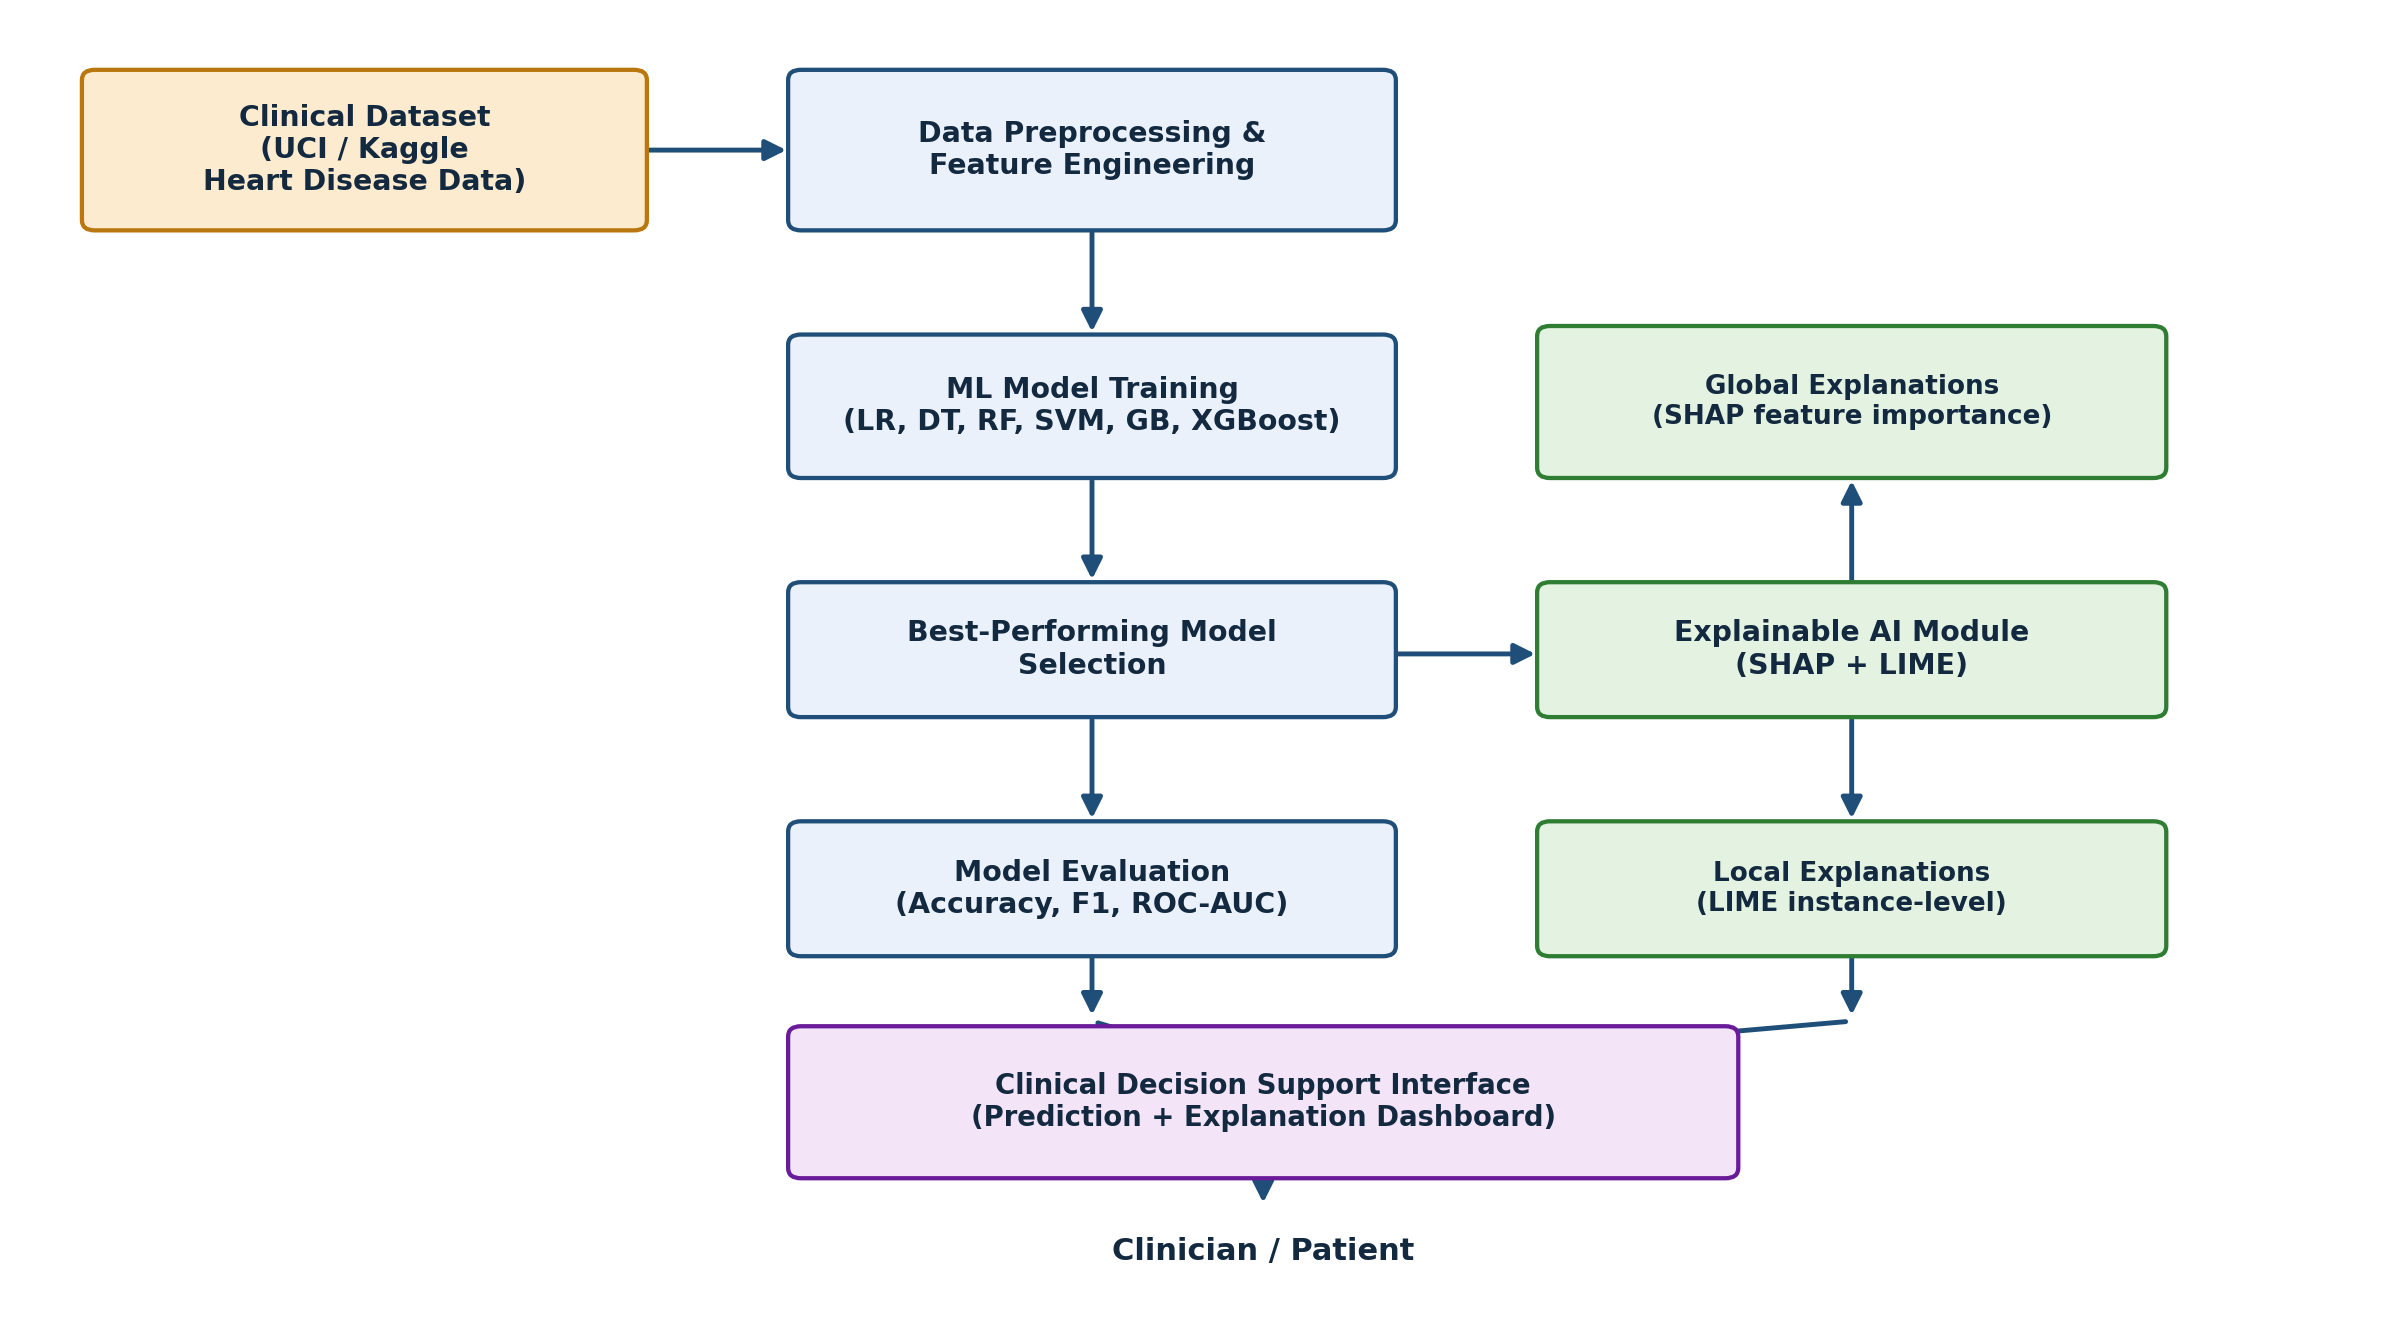
Figure 1 illustrates the end-to-end architecture of the proposed system. Clinical data collected from public repositories is first cleaned and transformed by the preprocessing module. Several candidate classifiers (the relevant section-A) are trained and compared, and the best-performing model is passed to the Explainable AI module, where SHAP generates global feature-importance rankings and LIME generates local, instance-level explanations. Both explanation types, together with the model’s prediction, are surfaced through a Clinical Decision Support interface for use by clinicians and patients.
11Proposed methodology
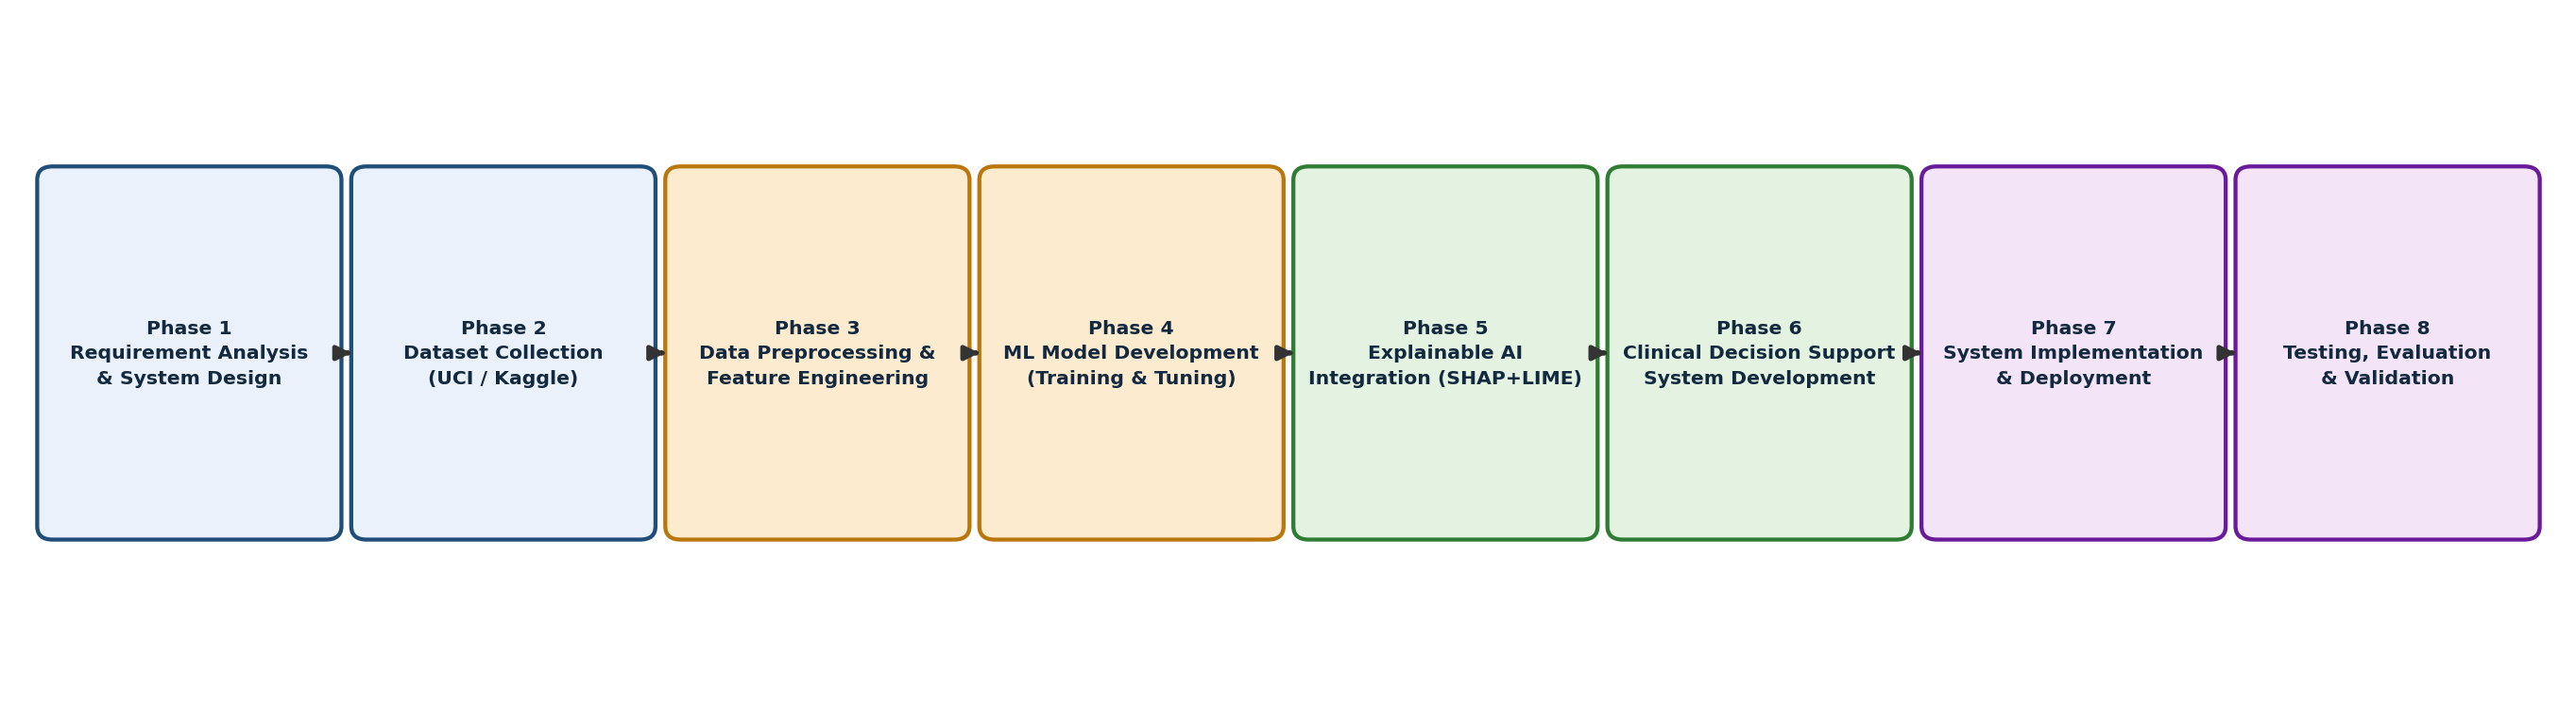
The proposed methodology (Figure 2) is organized into eight phases, moving from requirement analysis through to final validation, and is designed to directly close the research gaps identified in the relevant section.
11.1Phase 1 — requirement analysis and system design
System requirements are identified by studying heart disease diagnosis methods, clinical decision support systems, machine learning techniques, and Explainable AI approaches. A modular architecture consisting of data preprocessing, a prediction engine, an Explainable AI module, a visualization dashboard, and a clinical decision-support interface is designed, allowing each component to be tested and upgraded independently.
11.2Phase 2 — dataset collection
Heart disease datasets are collected from publicly available repositories such as the UCI Machine Learning Repository and Kaggle, including patient clinical parameters such as age, blood pressure, cholesterol, ECG results, heart rate, chest pain type, fasting blood sugar, and other relevant medical attributes described in Table II.
11.3Phase 3 — data preprocessing and feature engineering
The collected dataset is cleaned by handling missing values, removing duplicate records, encoding categorical attributes, and normalizing numerical features. Feature engineering techniques, including correlation analysis and variance-based filtering, are applied to identify the most important clinical parameters affecting heart disease prediction and to reduce redundancy before model training.
11.4Phase 4 — machine learning model development
Multiple algorithms — Logistic Regression, Decision Tree, Random Forest, Support Vector Machine, Gradient Boosting, and XGBoost — are trained and compared, consistent with the classifiers most frequently reported in Table I. Hyperparameter tuning via grid or randomized search and k-fold cross-validation are performed to select the best-performing prediction model while guarding against overfitting on the relatively small Cleveland-style dataset.
11.5Phase 5 — explainable AI integration
The selected model is integrated with SHAP and LIME to generate interpretable explanations. SHAP provides global and local feature importance using TreeSHAP for tree-based ensembles, while LIME explains individual patient predictions through locally fitted surrogate models, improving transparency and clinician trust. Explanation outputs from both methods are logged so their agreement can be assessed in Phase 8.
11.6Phase 6 — clinical decision support system development
A Clinical Decision Support System (CDSS) is developed to present heart disease predictions along with SHAP and LIME visualizations, displaying prediction probability, influential clinical features, and explanation graphs (summary plots, waterfall plots and local feature-weight bar charts) through an intuitive user interface aimed at both technical and non-technical stakeholders.
11.7Phase 7 — system implementation and deployment
The framework is implemented using Python with Flask or Streamlit for the web interface. The preprocessing module, prediction model, explainability engine, and visualization dashboard are integrated into a single web-based application that can be deployed locally or on a cloud platform, with the trained model and explainer objects serialized for fast inference.
11.8Phase 8 — testing, performance evaluation, and validation
The developed system is evaluated using Accuracy, Precision, Recall, F1-Score, ROC-AUC, and the Confusion Matrix. In addition to predictive performance, the agreement between SHAP and LIME explanations is quantified — for example, by measuring the overlap in top-ranked features per patient — to directly address the explanation-consistency gap identified in the relevant section and ensure the framework provides reliable, transparent, and clinically useful predictions.
12Tools and technologies
- 1. Python — main programming language for system development.
- 2. Scikit-learn — building and training machine learning models.
- 3. SHAP (SHapley Additive Explanations) — explaining model predictions and global feature importance.
- 4. LIME (Local Interpretable Model-Agnostic Explanations) — generating local explanations of individual predictions.
- 5. Pandas / NumPy — data preprocessing, cleaning, and numerical computation.
- 6. Matplotlib / Seaborn — visualization of data and explanation results.
- 7. Jupyter Notebook — experimentation and model development.
- 8. Streamlit / Flask — interactive web-based user interface.
- 9. Dataset Repository (Kaggle / UCI) — source of datasets for training and evaluation.
13Expected outcomes
The completed system is expected to deliver a trained classifier that predicts heart disease risk with performance comparable to existing literature (typically 85–99% accuracy on the Cleveland/UCI dataset, as summarized in Table I), together with SHAP-based global feature-importance rankings, LIME-based local explanations for individual patients, a documented, quantified comparison of SHAP and LIME agreement on the same predictions, and an optional web dashboard through which a clinician can enter patient parameters and view both the prediction and its explanation in a single screen.
14Challenges and limitations
- 1. Small, non-diverse benchmark datasets (Cleveland, n ≈ 303) restrict how well reported accuracy and explanations generalize to different populations.
- 2. Class imbalance in larger datasets (e.g., Framingham) can bias both classifiers and their explanations toward the majority class unless explicitly corrected.
- 3. Exact Shapley value computation is exponential in the number of features; approximations such as KernelSHAP and TreeSHAP trade off exactness for tractability.
- 4. LIME explanations are sensitive to neighbourhood size and sampling strategy, which can make repeated explanations of the same instance unstable [10, 11].
- 5. SHAP and LIME can disagree on borderline predictions, which may confuse rather than reassure clinicians if the disagreement is not communicated clearly.
- 6. Most reviewed systems are validated offline; few have been tested in a live clinical workflow with real clinicians using the explanations to make decisions.
- 7. Patient data privacy and regulatory constraints limit the availability of large, multi-center datasets needed for robust external validation.
15Future scope
- 1. Validating the framework on multi-center, multi-population datasets to test generalizability beyond the Cleveland benchmark.
- 2. Integrating Electronic Health Records (EHR) and real-time wearable/IoMT sensor data for continuous risk monitoring, extending the direction shown in [8].
- 3. Exploring federated learning to train models across multiple hospitals without centralizing sensitive patient data.
- 4. Incorporating newer XAI approaches, such as causal or counterfactual SHAP variants, to reduce misattribution among correlated clinical features [17].
- 5. Conducting clinician-in-the-loop studies to measure whether SHAP/LIME explanations actually improve diagnostic trust and decision quality, not just technical interpretability metrics.
- 6. Working toward a regulator-compliant, certified clinical decision-support product suitable for real hospital deployment.
16Conclusion
This review has surveyed the theoretical foundations of SHAP and LIME and recent studies applying them to heart disease prediction, showing that combining high-performing ensemble classifiers with these two explanation techniques consistently improves the transparency and clinical trustworthiness of AI-assisted diagnosis, without a significant loss in predictive accuracy. At the same time, the literature reveals recurring gaps — limited dataset diversity, insufficient systematic comparison between SHAP and LIME, and few deployable clinician-facing tools — that the proposed eight-phase methodology and system architecture are designed to address. By integrating data preprocessing, multiple candidate classifiers, dual explanation methods with an explicit consistency check, and an optional decision-support interface, the proposed Explainable AI framework aims to assist healthcare professionals in understanding, validating, and trusting AI-generated heart disease predictions, thereby improving transparency, accountability, and the practical usability of AI in cardiovascular diagnosis.
References
- [1]Explainable artificial intelligence for heart disease prediction: A SHAP and LIME-based approach. In: IEEE conference publication (IEEE Xplore). 2026.
- [2]Rezk NG, Alshathri S, Sayed A, Hemdan EE, El-Behery H. XAI-Augmented Voting Ensemble Models for Heart Disease Prediction: A SHAP and LIME-Based Approach. Bioengineering. 2024;11(10):1016.
- [3]A proposed technique for predicting heart disease using machine learning algorithms and an explainable AI method. Scientific Reports. 2024;14.
- [4]Explainable soft-voting classifier for heart disease prediction using SHAP and LIME. Discover Computing. 2026.
- [5]An explainable artificial intelligence framework for ischemic heart disease prediction using enhanced squirrel search feature selection. Scientific Reports. 2026.
- [6]Developing a novel framework using optimized active stacking and explainable AI for heart disease prediction. ScienceDirect; 2025.
- [7]HXAI-ML: A hybrid explainable artificial intelligence based machine learning model for cardiovascular heart disease detection. ScienceDirect; 2025.
- [8]Heart disease prediction with a feature-sensitized interpretable framework for the Internet of Medical Things sensors. PMC; 2025.
- [9]Adekoya A, Saeed F, Ghaban W, Qasem SN. Ensemble learning approach with explainable AI for improved heart disease prediction. Frontiers in Pharmacology. 2025.
- [10]Which explanation can you trust? SHAP vs LIME on heart disease prediction [blog post]. Medium; June 2025.
- [11]The role of explainable AI in revolutionizing human health monitoring: A review. arXiv:2409.07347 [Preprint]. 2024.
- [12]Sathyan A, Weinberg AI, Cohen K. Interpretable AI for bio-medical applications. Complex Eng. Syst. 2022.
- [13]Shapley LS. A Value for n-Person Games. In: Contributions to the Theory of Games II, Princeton Univ. Press. 1953. p. 307–317.
- [14]Lundberg SM, Lee SI. A Unified Approach to Interpreting Model Predictions. In: Advances in Neural Information Processing Systems (NeurIPS). 2017.
- [15]Molnar C. SHAP. In: Interpretable machine learning. 2022.
- [16]Ribeiro MT, Singh S, Guestrin C. ‘Why Should I Trust You?’: Explaining the Predictions of Any Classifier. In: Proc. ACM SIGKDD Int. Conf. Knowledge Discovery and Data Mining. 2016. p. 1135–1144.
- [17]Ng WY, Wang LR, Liu S, Fan X. Causal SHAP: Feature attribution with dependency awareness through causal discovery. arXiv:2509.00846 [Preprint]. 2025.
- [18]Heart disease data set. UCI Machine Learning Repository / Kaggle.