Air Transport
An Analysis of Air Transport in India
Presidency College (Autonomous), Chennai, Tamil Nadu, India
Published October 2026
Abstract
India’s air transport sector experienced rapid growth, structural transportation, and policy-driven expansion, positioning the country among the world’s fastest-growing aviation markets. Domestic passenger traffic arose sharply, supported by economic growth, rising middle-class incomes, and liberalisation measures such as the revised National Civil Aviation Policy and regional connectivity schemes. The significant increases in air fleet size, airport infrastructure development, and cargo volumes, alongside challenges including airline profitability, safety oversight, and infrastructural bottlenecks at major hubs.
Enables a comprehensive assessment of how India’s air transport evolved from post-crisis recovery to a high-growth, reform-driven phase in period of air transport.
This study examines the performance and structural dynamics of India’s air transport sector drawing on official statistics from the Ministry of Civil Aviation, Airports Authority of India (AAI), and industry reports. India’s aviation market exhibited robust growth, consolidating its position as one of the fastest-growing civil aviation markets globally. Total passenger traffic at Indian airports reached million, reflecting year-on-year increase, driven by strong domestic demand, expansion of low-cost carriers (LCCs), and rising disposable incomes. Domestic passenger traffic alone grew, continuing a decade-long compound annual growth rate (CAGR).
Aircraft movements, both domestic and international, also arose significantly, with total movements reaching millions. Freight traffic registered steady expansion, with domestic and international cargo growing at CAGRs. The period saw heightened private sector participation, fleet expansions by carriers like IndiGo, SpiceJet, and Air India, and infrastructural upgrades at major airports including Mumbai, Bengaluru, Chennai, and Kolkata.
The analysis further highlights operational metrics such as high average load factors, low cancellation rates, and persistent challenges including customer service complaints, infrastructure bottlenecks, and regulatory constraints. Policy initiatives such as the liberalised foreign direct investment (FDI) regime and regional connectivity schemes (e.g., UDAN, launched in late 2016) began to shape market access and route development.
Overall, marked a pivotal years in India’s air transport evolution-characterised by double-digit growth, increasing competition, and strategic investments-laying the groundwork for the country’s projected emergence as the world’s third-largest aviation market by upcoming year.
Keywords: aviation market; air fleet; freight traffic; aircraft; AAI; CAGR; LCC; air transport; FDI
1Introduction
The word 'transport' has its origin in the Latin word, "transportare" which can be split into 'trans' meaning 'across or to the other side' and 'portare' meaning to carry. Thus, transportation means to carry to the other side or across places (Senguttuvan 2006). However, it may be noted that the term 'Transport' and 'Transportation' have been used to denote the same meaning except the fact that the latter being used more frequently by the American authors. Alfred Marshal also pointed out in "Industry and Trade" (1927) and it was restated by H.P. White M.L. Senior in "Transport Geography" (Longman, 1983) in the following words: "The transport industries, which undertake nothing more than the mere movement of persons and things from one place to another, have constructed one of the most important activities of man in every state of advanced civilization. It is not only a basic human activity but is also a movement in space". Mobility intends and extends to transport of men and materials. It is found that mobility and movement of human beings resulted in course of transport action. Moreover, it has been shaping and creating the means of transport for the fulfilment of the expanding needs of human beings. Ultimately, it serves in creation and attainment of place and time utilities (Gawali 2015).
Human evolution is incalculably shaped, polished and developed by transportation. The world would have come to a halt without transportation.
Therefore, the thrust of economic activity is propelled on the wheels of transport sector. Transportation is defined as the movement of people and goods from one location to another". History reveals that the economic wealth and military power of a nation is closely tried to efficient methods of transportation. It facilitates communication and commerce for efficient trading. It activates the economic factors responsible for localization of industry and technological development (Senguttuvan 2006). It is admitted that the provision for continuous and without interruption of mobility of persons and materials is a basic necessity of society. The continuous Endeavour of the distinct stages of Transport evolution. The first stage begins with the early period when immobility had been there and economic life of people based on local transactions. Canals and turnpikes expanded in the second stage.
The third stage of transport evolution started when the steam engine was invented. And transport mechanism came into force with commencement of railway transport, which helped to curtail the cost, and saved in-transit time and removed the burden on men and animals. The fourth era of transport evolution started with motor age and achieved transport growth through introducing the mobility of road transport the world over. Later, transport sector attained comprehensive growth after the introduction of Air or Aviation transport through Aircraft infrastructure. After all the journey of whole transport sector in the world has been evolutionary to the U.S.A. and the other developed countries while it has been revolutionary to the developing countries (Gawali 2015). In a macro economic sense, transportation activities form a portion of nation's total economic product and help in strengthening national or regional economy (Senguttuvan 2006).
1.1Purpose of transportation
To overcome space, which is shaped by both human and physical constraints, such as distance, political boundaries, time, and topographies.
To specific fulfil a demand for mobility, since it can only exist if it moves something, whether it is people or goods.
Any kind of movement must consider its geographical setting, and then choose an available form of transport based on cost, availability, and space.
1.2Economic importance of transportation
The transport sector is an important component of the economy impacting on development and the welfare of productions. When transport systems are efficient, they provide economic and social opportunities and benefit the economy. Transport also carries an important social and environmental load, which cannot be neglected. Mobility is one of the most fundamental and important characteristics of economic activity as it satisfies the basic need of going from one location to the other, a need shared by passengers, freight and information. The economic importance of the transportation industry can thus be assessed from both macroeconomic as well as microeconomic perspectives. Macroeconomic level, transportation and the mobility conferred to link level of output, employment and income within a national economy. In many developed countries, transportation accounts for between 6.0 per cent and 12.0 per cent of the GDP. Microeconomic level transportation is linked to producer, consumer and production costs. The importance of specific transport activities and infrastructure can thus be assessed for each sector of the economy. On an average, transportation accounts for between 10 per cent and 15 per cent of household expenditures while it accounts for around 4 per cent of the costs of each unit of output in manufacturing. Transportation links together with the factors of production in a complex web of relationships between producers and consumers. The outcome is a more efficient division of production by exploitation of geographical comparative advantages, as well as the means to develop economies of scale and scope. The productivity of space, capital and labour is thus enhanced in step with rise in the efficiency of distribution.
It is an acknowledged fact that economic growth is increasingly linked with transport development.
1.3Transportation and economic development
Development in transportation that have taken place over last two centuries since the beginning of the industrial revolution, have been linked to growing economic opportunities. At each stage of human societal development, a particular transport mode has been developed or adapted. However, it has been observed that throughout history, no single transport has been solely responsible for economic growth. Instead, modes have been linked with the direction and the geographical setting in which the growth was taking place. For instance, major flows of international migration that occurred since the 18th century were linked with the expansion of international and continental transport systems. Transport has played a catalytic role in these migrations, transforming the economic geography of many nations. Concomitantly, transportation has been a tool of territorial control and exploitation; particularly during the colonial era where resource based transport systems supported the extraction of commodities from the developing world for use by the developed countries. While some regions benefit from the development of transport systems, others are often marginalized by a set of conditions in which inadequate transportation plays a role. Transport by itself is not a sufficient condition for development; however, the lack of transport infrastructures can definitely be seen as a factor constraining development. In general, transport technology can be linked to five major waves of economic development:
Seaports- Seaports were closely linked with the early stages of European Expansion from the 16th to 18th centuries.
Rivers and canals - The first stage of the industrial revolution in the late 18th and early 19th centuries was linked to the development of canal systems in the country.
Railways - The second stage of industrial revolution in the 19th century was intimately linked to the development and implementation of rail systems.
Roads - The 20th century saw the development of road transportation systems and automobile manufacturing.
Airways and information -The later part of the 20th century saw the development of global air and telecommunication networks in conjunction with the globalization of economic activities.
Commodity market - Improvement in the efficiency with which firms have access to raw materials and parts as well as to their respective customers.
Labour market - Improvement in the access to labour and a reduction in access costs, mainly by improved commuting (local scale) or the use of lowest cost labour(global scale).
1.4Transport as a factor of production
Transportation is an economic factor of production of goods and services. It provides market accessibility by linking producers and consumers. An efficient transport system with modern infrastructures favours many economic changes, most of them positive (Senguttuvan 2006).
1.5Functions of transport
Transport is the physical means whereby goods are removed from places of production to places of consumption. Besides this function, it performs a number of functions. They are the following:
1.5.1Widening the market
If the means of transport had not been developed, the markets for the goods would have been local, and different regions of the world would not have been in a position to exchange their surplus goods with each other.
1.5.2Specialisation and division of labour
Transport stimulates regional specialisation and division of labour. Not only different regions of a nation but of the whole world take advantage of this specialisation and divisions of labour. However, all such specialisation are ultimately dependent upon the development of the transport.
1.5.3Increase and mobility of labour and capital
Besides increasing the mobility of goods, transport helps a lot in the movement of labour and capital. The mobility of labour and capital from one place to another have played a significant role in the economic development of the world.
1.5.4Creates time and place utilities
Transport creates time and place utilities. It makes the goods available for consumption at the place where they are needed and at the time when they are needed.
1.5.5Creates employment opportunities
The modern means of transport requires a large number of personnel all over the world for their proper functioning. This factor generates new employment opportunities to millions of persons.
1.6Benefits of transport
By performing the various functions cited above, transport renders the following services to all sections of the society:
Reduction in the Cost of Production: Efficient transport system reduces the cost of production in many ways. The raw materials are brought to factory at a cheaper cost and the final product is transported to the place of consumption at a lesser cost.
Facilitates Large Scale Production: By widening the market for consumer and industrial goods, transport helps large scale industries to grow.
Stabilisation of Prices: Lack of efficient transport system always creates apparent inequalities in price level between different regions. Effective transport system helps in stabilising prices by taking goods from the surplus to deficit areas and this leads to equalisation.
Expansion of Trade: The expansion of internal and international trade is another important effect. The development of air and water transport has greatly helped for the expansion of foreign trade.
Increase in the value of land: It increases the value of land adjoining it. Before the construction of road, the land is practically value less but its price shoots up as soon as the road is built.
Transformation of the Economy: Developed means of has a great influence on the agricultural productivity of land. By making available all modern facilities in agricultural areas, the productivity of land has been increased substantially. To conclude, transport has also a social and political impact on migration, urbanisation, political unification and culture (Natarajan 2007).
1.7Various forms of transport
Transport in the modern world, may assume different forms like road transport, railway transport, water transport and air transport. Transport is indispensable for the economic development of country. It occupies a pivot place in the economic development process.
1.8Road transport
It is one of the oldest forms of the transport system. It plays a decisive role in the economic development of a country. Because of its flexibility of operations and the prevalent opportunities to render door-to-door service, road transport is the only means of transport available to a majority of the rural people in India.
1.9Railway transport
The history of economic development of Europe, USA and many other parts of the world shows that their economic development owes a great deal to the development and expansion of railways. The Indian Railways which made a modest beginning in April 1853 has become the second largest rail network in the world. It has been contributing to the industrial and economic landscape of the country for the last several decades the Indian Railways is the principle mode of transport for carrying bulk goods and long distance passenger traffic.
1.10Air transport
Civil aviation is the most modern mode of transport. The phenomenal growth of the global aviation industry can be gauged from the fact that where as in 1945 only nine million passengers travelled on scheduled services in the whole world, in 2003 about 1.66 billion passengers were carried over 180-fold increase. India has not remained insulated from the global trend. Air traffic is growing but at a slightly lower rate than the global rate.
1.11Water transport
The importance of marine trade in world economy is huge. With newer technology and bigger ships the share of cargo movement by sea is on the rise. The sea trade in India dates back centuries and in more recent times it has been growing in importance. With 12 major ports and 187 minor and intermediate ports dotting its coast. It is especially the shipping transport is indispensable for the growth of foreign trade of a country.
1.12Historical view of air transport
Air transport is one of the gift of the 20th century. Thanks to Wright Brothers who made this greatest invention. The year 1919 is remarkable in the history of air transportation, as it was the honest beginning. The two World Wars gave a great impetus to the development of air transport.
Today, air transport has developed in gigantic proportions so as to compete with all forms of transport. Air routes have created a wide network of air transport all over the world. It is no exaggeration to say that the developments in air transport are extremely fast as they place themselves (Nataraj 2007). Air routes are practically unlimited, but they are denser over the countries and inside the countries. Air transport constraints are multidimensional and include the site (a commercial plane needs about 3,300 meters of track for landing and take off), the climate, fog and aerial currents. Air activities are linked to the tertiary and quaternary sectors, notably finance and tourism that require movements of people. More recently, air transportation has been accommodating growing quantities of high value freight (Senguttuvan 2006). At present there are over 300 civil airports in India spread over all the States. During the year 1996-97, 300 civil airports in the country all together operated 36.4 million passengers ( Gawali 2015).
1.13Characteristics of air transport
- 1. Air transport is the most suitable mode of transport for long distance.
- 2. It is not suitable for transporting heavy goods. However, under special conditions the aeroplanes can take army tanks with them.
- 3. Aeroplanes fly according to pre-decided time schedule and through definite corridors while crossing over different countries due to safety reasons.
- 4. Light, costly and perishable goods are transported by aeroplanes.
- 5. It is suitable for relief operations at any place, at the time of calamities and emergencies, such as floods-earthquakes, accidents, etc.
- 6. It is suitable for hilly, desert, inaccessible areas where other means of transport are not favourable.
1.14Airports in India
As of 2012, there are 352 civilian airports in India - 251 with paved runways and 101 with unpaved runways. Of these, 66 are licensed by the DGCA in the public use category while 21 are licensed for private sector use. Most of these managed by the AAl while the rest are owned by State Governments and private entities. There are more than 20 international airports in India (Bimal Dhawan 2015). The following major international airports in India are more than half of the air traffic in South Asia. They are, Mumbais (Chatrapati Shivaji International Airport), Delhi (Indhira Gandhi International Airport), Kolkata (Nataji Subash Chandra Bose International Airport), Chennai (Anna Airport), Thiruvananthapuram Airport, Bangalore (new International Airport at Devanahalli), Hyderabad (new International Airport at Samshabad), Amritsar Airport, etc. India has about 92 airports, principally managed by the Airports Authority of India.
1.15Role and importance of air transport in India
Air transport in India, almost all state capitals are connected, which is a significant stride taken after independence. The tourism sector has benefitted greatly as well. Air transport is mainly used for transporting people. Till recently, the air transport was controlled by the public sector undertakings, namely Indian Airlines and Air India International. At present, several private sector operators like Jet Airways, Spice Jet, Indigo, GoAir, etc., share the air transportation in India.
Aviation in India has 125 airports, including 11 international airports. Indian airports handled 96 million passengers and 1.5 million tonnes of cargo in year 2006-07, an increase of 31.4 per cent for passenger and 10.6 per cent for cargo traffic over previous year. The dramatic increase in air traffic for both passengers and cargo in recent years has placed a heavy strain on the country's major airports. Air passenger traffic is projected to cross 100 million and cargo to cross 3.3 million tonnes by year 2010. Air transport infrastructure in India is better developed in the southern and southwestern parts of the country.
Rapid economic growth in India has made air travel more affordable. Air India, India's flag carrier, presently operates a fleet of 106 aircraft and plays a major role in connecting India with the rest of the world. Several other foreign airlines connect Indian cities with other major cities across the globe. Indigo, Jet Airways and Air India are the most popular brands in domestic air travel in order of their market share. These airlines connect more than 80 cities across India and also operate overseas routes after the liberalisation of Indian aviation.
However, a large section of country's air transport system remains untapped, even though the Mumbai - Delhi air corridor was ranked 10th by Amadeus in 2012 among the world's busiest routes. India's vast unutilised air transport network has attracted several investments in the Indian air industry in the past few years. More than half a dozen low-cost carriers entered the Indian market in 2004-05. Major new entrants included Air Deccan, Kingfisher Airlines, SpiceJet, GoAir, Paramount Airways and IndiGo Airlines. To meet India's rapidly increasing demand for air travel, Air India placed orders for more than 68 jets from Boeing for US$7.5 billion in 2006 while Indian in 2005 placed orders for 43 jets from Airbus for US$2.5 billion.
Jet Airways, India's largest private carrier, has invested millions of dollars to increase its fleet, but this has been put on hold due to the recent economic slowdown. This trend is not restricted to traditional air carriers in India. IndiGo Airlines entered the limelight when it announced orders for 100 Airbus A320s worth US$6 billion during the Paris Air Show; The highest by any Asian domestic carrier. Kingfisher Airlines became the first Indian air carrier on 15 June 2005 to order Airbus A380 aircraft. The total deal with Airbus was worth US$3 billion (Bimal Dhawan 2015).
1.16Significance of the study
Air transport is one of the world's largest and the fastest growing industries and has tremendous impact on the nation's economy. The base of the economic structure of a country, whether developed or developing, can be strengthened by bringing in modernisation in its transport system in which air transport plays a pivotal role in the domestic and International communications.
Air transport helps optimise technological, managerial and administrative skills in a resource short economy of a country. The role played by the air transport in the development of international trade and tourism is becoming increasingly important.
It is in the interest of a nation to possess excellent civil fleets which can serve their commerce and industry during peace time and at the same time remain available for immediate conversion to defence purpose during the time of national.
1.17Problem of the study
Air transport in the country, there is clearly a shortage of trained and skilled manpower in the aviation sector as consequence of which there is a competition for employees which, wages to unsustainable levels. Moreover, the industry is unable to retain talented employees. Ability to provide regional connectivity is hampering the growth in the lack of airports. As fuel prices has climbed, the inverse relationship between fuel prices and airline stock prices has been demonstrated. Moreover, this reflects have led to increase in the air fares. LCCs and other entrants together now command a market share of around 46 per cent in increasing growth has resulted in lower returns for all operators. Airport and air traffic control (ATC) infrastructure is inadequate to support growth. Inability to realize the full potential of the trunk routes is the lack of genuine competition. High input costs in the way of with holding tax on interest, repayments on foreign currency loans for aircraft acquisition these are reflect shortage of technical personnel while due to increasing manpower costs.
In this backdrop this study has been analysed various dimensions of air transport in India.
1.18Objectives of the study
The general of the objective study is to analyse the transport sector in general and air transport in particular. The specific objective of the study are:
- 1. To review the existing literature pertaining to the transport sector;
- 2. To study the trends and perspective of transport sector in general and air transport in particular in India;
- 3. To analyse performance of air transport in India and
- 4. To arrive the conclusion on the basis of analysis.
1.19Methodology of the study
The study is based on the secondary data. The secondary data has been collected from various published source especially from the Government of India Reports. Journals and websites are also used for the collection of research materials and data. Simple statistical were used for the analyse in this study.
1.20Organisation of the paper
The paper is organised as follows.
The introduction covers the conceptual background, the scope of the study in the Indian economy, the statement of the problem, the objectives of the study and the methodology of the study.
The review of literature briefly comments on the existing literature pertaining to the transport sector at the international and national levels.
The overview of transport deals with the transport sector and explains the trends and perspectives of the transport sector in India.
The analysis of air transport in India explains various dimensions of air transport in India, and the final section gives the summary, findings, suggestions and conclusions.
2Review of literature
There are number of reports and articles already published about the transport sector and air transport at global level and national level. This chapter aims to review the existing literature pertaining to the transport sector at international level and national level.
Anfofum et al. (2015), "Air Transportation Development and Economic Growth in Nigeria " analyse suggests a positive influence of air transport on economic growth, a long run equilibrium relationship and casual unidirectional relations from air transport to economic growth. The study used a series of Econometrics models including dynamic ordinary Regression equation, Cointegration error correction model and granger causality techniques to examine the relationship between air transport and economic growth and the diagnostic test for the normality of the model showed that the model functional form is adequate, stable with no serial correlation. Further the study used data collected from Central Bank of Nigeria statistical The bulletin volume 22 are investigated using Argumental Dicky - fuller et al. The study found that the analysis and recommends a proactive and dynamic cohesive transport policy that benefits all the stakeholders and determine the impact of air transport sector on the Nigeria economy. Further the study found that the four section discussed the methodology of the study while the analysis and investigates the influence of air transport sector development on economic growth in Nigerian between 1981 and 2012. And the study examined the contribution of air transport to gross domestic product in Nigerian. The authors found that the rating or status, Nigeria's air safety rating has been enhanced and now puts the country in the premier league of notions that are highly rated in airports. This rating has been sustained International Aviation Safety Assessment in 2014. The study concluded that, the Federal Government should ensure that air transportation is well Managed in lines practices and highly standard accountability and transparency guided by innovative sophisticated expertise in order to achieve results and e with develops the sector to international standards.
Alderighi et al. (2004), "The Entry of low cost Airlines: Price competition in the European Airline Market" analyse the response of full service carriers to the entry of low-cost carriers and their develop a model of airline competition, which accommodates various market structures, Some of which include low cost player. The study used data were collected for selected intra - European, non- stop traffic flows and the monthly data on the air fares of Lufthansa, British Airways, Alitalia and KLM for the top 12 city -pairs from Italy to Europe. Further the study used empirical test of theoretical model. The study found that the presents a concise analysis of the main changes in the sector in order to understand the emergence of low-cost carriers in Europe. The study paper focuses on the response in term of prices by FSC, to the entry of LCCs. The authors found that, when a LCC enters a specific route, the direct incumbent firms react by reducing the fares for all available leisure and business fares. The study concluded that, the over all results suggest new possible streams of research. The theoretical model results can be empirically tested in terms of market shares and low-cost fares and the specific impact the product characteristics, both horizontally and vertically might be the subject of future analyses.
Mukherjee and Sachdeva (2003), " Maritime and Air Transport Services : India's Approach to privatization " analyse on overview of government policies and initiatives that have been taken to promote private participation in the maritime and air transport subsectors and as assessment of the progress made so far. The study found that has identified some issues and concerns and makes some suggestions that would further increase the level of private participation. The study also found that the government all over the world are finding it increasingly difficult to finance the investment required to sustain the growth of transport infrastructure. Further the study analyse critically the policies and developments in these sectors since the 1990's.The study used data and survey from and with the help of Ministry of Civil Aviation brought out a policy on airport infrastructure. The committee in the Ministry of Civil Aviation would examine the private sector proposals and submit them to the government. The authors found that the characterised by lack of clarity and openers, discretion, overt and convert forms of discriminatory treatment towards some categories of investors and lack of strategic planning. And also authors found that the most of other developing countries have used private foreign investments to develop one or two ports as hub ports in India and the investment is scattered across several major and minor ports. The study concluded that in the light of experience gained from the privatization initiatives in the maritime and air transport sub sectors. And the country to achieve the desired objectives of growth capacity -enhancement and efficiency in both the public and private sector.
ASCI Research and Consultancy (2009), " Competition Issues in the Air transport Sector in India " analyse the nature and degree of competition prevailing in the passenger segment of the domestic air transport sector and will provide recommendations for appropriate action that may be taken by the competition commission to preserve and foster a competitive environment.
The study found that the issue of competition at two levels. Air transport and Airports. The two issue will be dealt with separately in the study. The study used Implications of this for competition policy and Law in India, and outline issue for advocacy for India's competition commission. And the data was collected from Directorate General of Civil Aviation on passenger traffic. Route wise, Flight - wise such data was available only for Indian Airlines. The ASCI Research and Consultancy found that the competition issues involved in the grant of concessions to the private sector for up gradation of airport infrastructures. Further this found that the issues such as in the process of grant of concession is compete in such things are there. The study concluded that the provided detailed analysis of the nature and degree of competitive prevailing in the passenger segment of the domestic air transport sector in India. And the study covered competition issues relating to airlines as well as airports.
Brueckner (2002) in his research paper, "Air Congestion when Carriers Have Market Power", analyse airport congestion when carriers are non atomistic, showing how the results of the road - pricing. The study used atomist model and the result of this model is abandoned, the verdict on congestion is softened. While atomistic users of a congested facility ignore their external effects. And the analysis shows that a non amistic airline takes into account a portion of the congestion caused by each of its flights. In particular the airline internalizes the congestion each flight impose on the other flights it operates. The study found that interestingly, Daniel's (1995) simulation results replicated existing Minneapolis traffic patterns better when the dominant hub carriers was assumed to behave automictically ignoring the congestion it imposed on itself, than when it took such congestion into account. The author found that the modified when the economic agents causing congestion have market power. Further the author found that in allocating traffic between the peak and off peak periods, the monopolist fully accounts for the passenger time cost associated with peak congestion, while also taking account of its impact on his own operating costs. The study concluded that, when an airport is dominated by a monopolist, either discrimination or non-discriminating congestion is fully internalized provided that a separability assumption on travel benefits in satisfied. And some congestion pricing will be implemented at U.S airports, awareness of such results may be valuable.
Gibbs (2014), "Top 100 ranking Airports" analyse the airports around the world are using technology to adopt to needs of the mobile connected traveller and the research highlights a significant gap between the use of mobile devices by air travers and the mobile readiness Global MOf airports. The study used data on the top 100 airports by passenger volume and the Global Mobile Readiness Index as a desktop computer and mobile smart port to access. Further the study used Testing if airport Mobile website are " Google Mobile - Friendly " The study found that the analyse mobile ready plat forms by airports over a 12 - month period from November 2014 to November 2015. The author found that, the specializes in researching digital shifts related to the marketing of leisure industries. His research in industry focused and designed to provide marketing leaders with the insight to plan and predict future shifts in digital marketing. The study concluded that, the report has demonstrated that airports are adopting the use mobile friendly technology at a Blower pace than other travel related organizations. Based on the findings of this research and mobile- related research reviewed for this report.
Jin et al. (2004), "Geographic Patterns of Air Passenger Transport in China 1980-1998: Imprints of Economic Growth, Regional Inequality, and Network Development" in their research paper analyse on the three foci: Impacts of economic reforms, regional inequality in air transport development network development. Much of the literature of air transport geography has focused on development countries particularly rich in studies on impacts of air airline deregulation in the U.S and air transport liberalization in Europe in the past two decades. The study found that to obtained from air transport studies in Western countries, such as the relationship between the growth of air transport and GDP, average distance of air travel, distance decay in passengers volume, and formation of a hub-and-spoke system. Further the study found that the objectives, providing an overview of the growth in numbers of the air passengers and the expansion of the air transport system in China, Examining the structural and location change of the air transport system by terminal passengers handled annually, Analysing the spatial patterns of air traffic flows between cities, Studying the formation of China's hub-and-spoke system by the dominant flow method. The study used data from the China Transportation and Communication Year Book. Further study used the method of dominant flow analysis to examine the networks structure of China’s air transport system. Further the author found that of people's Republic of China in 1949, The Civil Aviation Administration Airlines in 1993 with an initial investment of 10 million RMB from the Hainan provincial government, but currently ranked no.4 with asset of 15 billion RMB after the Big three. The study concluded that, plans also include studies of the hub-and-spoke systems in China, particularly air package delivery services and other air freights transports. Their hope to report the results in the near future.
Burghouwt et al. (2003), "The spatial configuration of airline networks in Europe" analyse whether a similar spatial concentration trend can be observed in the European aviation network after deregulation at the airline network level. The study found that the spatial dimension of European airline networks has changed between 1990 and 1999. The study used data from OAG/ ABC database Year from 1990-1991 for all national, regional, low-cost and extra - EU carriers operating at least on intra - EU service a week. And the study also used Network concentration index, derived from the Gini index, Herfindahl index, Theil's entropy measure are used to measure traffic distribution in the network. Further the study found that the limited number of existing empirical studies on European network configurations take the airport as the object of analysis instead of airline. The authors found that the spatial dimension mean the geographical structure of airline networks. And they consider intra European scheduled services. Further the authors found that have applied the NC to answer the question to what extent airlines in Europe operate radial or linear networks and how networks have developed over time. The study concluded that airport forming part of the network of hubbing carriers will be more and more dependent of network decisions of these airlines and their alliances for their future network position.
Huber (2015) "Network structure, capacity Growth and Route Hierarchies: The case of China's Air Traffic System revisited" analyse air traffic patterns among China's scheduled airlines in January 2006 and January 2011. The study used data from OAG's Historical Max Plus database. And the study also used Matrix-Computational approach is highly compatible with a geographic and spatial representation of airline networks and their changes over time. The study found that analysed over two decades empirical analyses on the economic impact of liberlization in aviation not only looked at market competition, consolidation, pricing alliances, but also examined structural aspects of networks, such as connectivity etc. Further study found that trends of Chinese ATS that which contrast with the fully-connected versus single hub-and-spoke dichotomy often advocated in western thinking. The author found that the opinion that this particular way of analysis was best suited for describing ATS. And this are consistent with an evolutionary type of growth of China's ATS that is driven both by individual and collective behaviour of classes of agents. The striking finding by applying the templets is the near in-existence of sub-spokes that are linked to airports solely with HS.4 or HS.5. The study concluded that China's Big Three were able to control the network system while allowing for entry and growth around certain airports.
Huber (2016) in his research article, "India's Air Traffic System Evolution and Role of Network Structure" examining the multidimensional patterns of network characteristics for scheduled Indian airlines between 2006 and 2016. His article goes on discuss their evolutionary paths. The well-known skewed traffic distribution, which spatially concentrates traffic around few airports, serves as the starting point for dividing the system into its constituent route types. The author analyse points to inferences that can be drawn about the development path of the Indian commercial air traffic system. The author discussed aviation networks through in market environment, their formation, development and competitive dynamics. The study reveals there is little literature that the structural evolution of air traffic networks in India's domestic air traffic system. The author search to highlight salient network characteristics of India's ATS and changes between 2006 and 2014. And his observation identified a group of six airports, which were distinctively more concentrated spatially than their lower ranked pears. The study used data from Official Airline Guide's Historical Max Plus data base says that Hub-and-Spoke as Highly Skewed Traffic distribution because of higher order logarithmic or power law appears in the diagram. It shows the domestic flight movements for all Indian airport during the period. The study used table illustration around India's top 10 airports ranked according to the number of flight movements. The study concluded that alternative policies can be growing routes through lesser airports and optimising airline networks around them would be a viable path with substantial benefits to the nation.
Ito (2013), " Incumbent Responses To Lower Cost entry: Evidence from the U.S Airline Industry" analyse the responses of incumbent hub and spoke carriers to low cost carriers entry on routes served to and from their hubs over the past decade. The study found that focuses on two main questions Firstly, how aggressively incumbent carriers responded to low-cast carriers entry over the past decade? Secondly, is there any relationship between the aggressiveness of an incumbent carriers response to new LLC entry and probability that the LLC will subsequently exit the market? The study used data on flight frequency and capacity for the study analysis is taken from the U.S. DOT's domestic T100 data base and the fare and passenger data for the study analysis is taken from the DOT's OD1B data base, a 10% sample of all domestic tickets. Further study used a relatively large sample of LLC entry, events, aggressive of an incumbent carriers response impacts the probability of exit for a new entrant LLC using an probit exit model. Herfindahl index and logarithmic. The author's found that the typical capacity response by incumbent carriers to LCC entry their hubs-measured in terms of the percentage increase in available seats and flights has been surprisingly modest. And that incumbent capacity response LCC entry have varied widely across carriers. While North West and Alaska appear to be the most aggressive to LCC entry. And the little evidence that the response of incumbent carriers has any impact on the likelihood that an LCC's entry proves to be successful. The response of incumbent carriers to LCC entry-both in term of capacity expansion and prices reduction tend to be much smaller than those of entrants find highly aggressive incumbent reaction are more the expansion rather than the rule. The study concluded that the investigates the response of hub-and-spoke network carriers to LCC entry on the it hub routes. Cut-and-dry rule of capacity expansion or price reduction is unlikely to define in any meaningful or economically appropriate way- "predatory or exclusionary" conduct.
Brueckner (2008), " Slot Based Approaches to Airport Congestion Management" analyse slot based approaches to management of airport congestion to assume serves to generate asymmetry between the carriers, a crucial component of ensuing analysis. The study focus solely on the congestion issue, market power is eliminated from the model by assuming that carriers face perfectly elastic demands for air travel. And the analysis focuses on a single congested airport served by two airline denoted 1 and 2, who interact in cournot fashion. It shows that without strategic behaviour, the auction generates the same efficient outcome as the slot-trading regime. The study used Verhoef's model, two carriers serve the same market and asymmetry between them is generated by a difference in costs. If the model's rage and small airlines are replaced by symmetric carriers then the slot sale regime’s common price does not constitute inefficient constraint, and the regime is efficient. The author found that the main simplification is the assumption that carriers face perfectly elastic demands for air travel. And the pricing rule too and further explored portrays a congested airport served by two asymmetric carriers, with peak and off -peak periods collapsed into a single period that is always congested. The study concluded that the presume the absence of manipulative or strategic behaviour on the part of the carriers, a view that may be inaccurate. To welcome given that trading already occurs at slot - constrained U.S airports, although at low volumes. Further work could relax some of the stylized assumption of the model, conceptual clarity regarding the effects of price -based remedies for airport congestion is nevertheless important, and this paper has attempted to provide it.
Jantachalobon and Vanichkobchinda (2013), "A model of airport hub in Southeast Asia 'analyse the research is derived in an effort to identify and alleviate the emerging problem of no official regional air transport hub in Southeast Asia identifying factor influencing the suitability of an airport and the developed model for evaluating and choosing the airport and apply models to airline to set up and optimize its flight schedule. The study used variety of algorithms has been used in mathematical models as a solution method for hub location with limited factors or aspects focused in past works or models. The study found that to investigate develop models and equations for evaluating and selecting the airport most suitable for being a key traffic hub for air transport in Southeast Asia. The author found that the study showed there is an increasing cost for connecting between the numbers of cities and this can increase the competitiveness of of the region as a whole the airlines can subsequently maximize their profits. And there have been a number of previous study on hub location problems in various countries for airline. The study concluded that this paper has provided a motivation and overview of the proposed research background, problem, research objectives and conclusions of the research contributions.
O’Connell and Williams (2006), "Transformation of India's domestic Airlines: A case study of Indian Airlines, Jet airways, Air Sahara and Air Decan " analyse review how the new regulatory road map has transformed the supply of domestic air services. The study found that there is a homogenous set of flight products required by leisure passengers, travelling on both full service and low cost airlines, however there is a considerable dissimilarity overall between the requirements of passengers using full service airline a low cost carrier. Further the study found that considerable world aviation attention is now focussed on India, as evidenced by the 150 air craft order by Indian carriers at the 2005 Paris air show, priced at US $13 Billions, According to the centre for Asia Pacific Aviation (2005). The study used Cross price elasticity analysis and the performances of the passengers from different air carriers is measured using a variant of Pearson's Correlation Coefficient. And the study also used data survey with permission of the Indian Airport Authority (IAA) granted permission for a passenger survey to be carried out at Mumbai Airport. The survey was conducted by small terms of personnel in the check - in and adjoining waiting areas prior to passengers boarding their flights. The authors found that the survey replicated work assessing the features that differentiate travellers of full service airlines from those low cost carriers and investigating which flight product characteristics encourage passengers to select a particular airline. The study concluded that the aviation within India remained stagnant over many decades. The voluminous orders for air craft in 2004/05 reflects the liberalising effects of political change and the government's intent to further develop economic activity by loosening regulatory barriers.
Martín and Voltes-Dorta (2009) in their research paper," A note on how to measure hubbing practices in airline networks" analyse the type of networks that airlines operate hubbing indices and the structure of airline networks in Europe and US. The study used Herfindahl indices, Theilentropy measures, Coefficient Variation and Gini Index. And also used HCI and Ghobrial-Kanafani indices using the Rank Correlation test. And the methodology to measurement of spatial or market concentration in air networks. The research paper found that the use of standard concentration indices analysing the connecting behaviour of passengers should be avoided and develops new methodology to measure the degree of airlines in the US hubbing behaviour of airline taking into the number of alternatives in order to analyse multi-hub-routes. The study found that the empirical findings shows that 0.975 indicating that the connecting share index and the HCI and almost perfectly positively correlated. Further the study found that the present the empirical exercise for US carriers. And if two airlines have the same flight/stage matrices there is not any empirical evidence to be inclined the result of empirical assumptions which needs to be tested. The study concluded that airline decide their network configuration seeking the profit maximization for this reason introduce a new methodology which corrects the problems associated with the use of the previous measures.
Alderighi et al. (2005) " Network competition: the coexistence of hub-and-spoke and point-to- point systems" analyse conditions under which asymmetric equilibria may exist when carriers compete in designing their network configurations in a game theoretical frame work. And the objective of the HS network planning is the maximization of the number of city pairs to cover all traffic segments. The study found that a HS network design focuses on the connectivity within hubs which is typically implemented by concentrating the flights' landing and take off time at the hubs. Further study found that the two carriers are assumed here, which are allowed to play three different strategies: point-to-point, hub-and-spoke or multi-hub. The study used outcomes of the model to describe the observed coexistence of different business models. And also pricing rule, The authors found that Alternative pricing rule, Equilibrium of the game. the two main stable outcomes, which depend on the size of the internal market. First, when the internal markets are small, point-to-point network strategies are played by both carriers, while for a specific subs the internal markets is large, et of parameters a collusive equilibrium in a hub-and-spoke configuration can be derived. Second, when the size of the internal markets is large, asymmetric configurations, where one carrier chooses a hub-and-spoke strategy and the other chooses a point-to-point strategy, are the only stable equilibria. The study concluded that the choice of full service carriers to provide intercontinental flights does reinforce and preserve the hub-and-spoke configurations. And this paper has benefited from suggestions by the referees. And the authors opinion do not reflect necessarily to the official view points.
Mootein (2012), "Open Sky policy for Developing countries with emphasis on the Small Island Developing States " analyse the future of air travel due to the adoption of an open sky policy by some of the developing countries who are some how forced to do so as other airlines become too competitive. The study found that to assess the impacts and benefits of regulation and liberalisation on developing countries with a special consideration for the small island developing states. And to exhibit the benefits of an open sky policy for the government and the consumer. And its aims at explaining the potential threats that a flag carrier. Further the study found that the devise a policy theory that could help airlines of SIDS to develop further strategies within a frame work where deregulation and liberalisation are bound to become a necessity and evitable development to reckon with. The author found that the deregulation is the removable or simplification of government forces and the airline Industry has for many years be characterised by financial instability governments in a number of countries took the view that invention was necessary to avoid 'waste fat' or destructive competition. And the analysis of the effects of market change has inevitably focused on domestic liberalisations, with a particular emphasis on the past 1978 U.S market. The study concluded that has endeavoured to show that the concepts of deregulation, liberalization and globalization in international air transport are phenomena that nations will have to reckon with in the decades to come and the airlines that are still willing to carry them to greater hights.
Reynolds-Feighan (2010), "Characterisation of airline networks : a North American and European Comparison" analyse contrasts the compares North American and European air transport markets. Visualisation of carrier networks are presented to highlight the different network strategies operated by low cost carriers and full service carriers. The study used data from OAG Historical Max Plus data base over the period 1996 to 2008. The study found that the top 10 carriers in both region closely in terms of network structures and the basic geographical characteristics of there networks are highlighted and the carrier network structures attempts to capture aspects of carrier production plans and traffic flow organisation and thus represent measures of airline technology. Further the study found found that the European network structures using a comparative analysis and matrix descriptive statistics approaches and assumptions relating to the structures and motivation of European carriers. The authors found that the presented a preliminary analysis of US and European Union Carriers and highlighted several key differences between the two groups of carriers. Further the authors found that the noted deregulation in the US in the late 1970s had resulted in a sustained contraction in the network of airports receiving jet services. The study concluded that research paper has set out clear illustrations of key geographical aspects of carrier networks and this tool in conjunction with the mapping of top airports highlighted important geographical and spatial aspects of carrier network structures.
Windle and Dresner (1999), " Competitive responses to how cost carriers entry " analyse the impact of route entry by a discount carrier, Valu Jet into an established carrier's hub, Delta, and by examining price changes on routes not entered by the low cost carrier. The study found that the entrance of low cost carrier leads to lower prices on routes it has entered. And the study has suggested that," low cost" or "discount" air carriers have been instrumental in substantially lowering prices on domestic air routes in the United States. Further the study focused on Southwest airlines on short haul routes into underutilised or secondary airports, and as a result often does not directly compete with established carriers entry by low cost carriers have been dominated by the impact. And the study also addressed the conflict between rational economic theory and the findings suggested by the DOT. The study used data from DOT, it provide the evidence support " non -competitive" routes in their system findings of price increases on these type of routes. The author found that the impact of competition by the low - cost carrier Valu Jeton yields by the established carrier. And the author also found that the Delta lowered its fares on competitive routes terminating in Atlanta is response to competition by Valu Jet. The study concluded that the policy implication from this research is that governments should encourage the entry of low cost carrier in order to increase consumer welfare. And the Lower fares were realized both on routes that terminated at a competitive routes that flowed through the hub.
Shaw et al. (2009), "China's airline Consolidation and its effects on domestic airline networks and competition " analyse offers a review of air transportation development in China and compares China's approach with other countries. The study found that the impact of the governmental airline consolidation of 2002n upon domestic network structure and competition. And the study also found that the regarding the effect of airline liberalization have been reported in Europe. And also the changes of geographic patterns of air passenger transport in China from 1980 1998 with respect to its economic growth. The study used data selects 2001 and 2004 as the study years for the geographic coverage. The 2004 database covers 575 city pairs with flights in one direction only. And also used Scheduled flights published in the Time table of Chinese Air Carriers of 2004 and 2001.The authors found that to compute the direct connection index and also compute the shortest path connection index using the Shimbel shortest - path matrix method. And also authors found that to choose the cities to be included in the analysis based on the population size, Economic status, Administrative status, major tourism sites criteria. Further the authors found that there is interested about this consolidation how this changed the spatial structure of airline networks and the extent to which the competition among the airlines. The study concluded that the authors hope this paper will encourage other researchers to pursue these and other interesting and challenging research questions. The study says that China employs a state - led reform approach that is very different from the free -market liberalization approach implemented in the united states.
Thirunavukkarasu and Nedunchezian (2015), "An Analysis on Domestic Airlines Capacity performance in India " analyse compares the Airlines capacity growth and utilisation of Full Service Airlines and Low Cost Airlines. The study found that the indicate that Low Cost Airlines are able to deploy higher capacity growth and utilise the capacity during the last 10 year. The capacity growth and utilisation of capacity of Low Cost Airlines is higher than Full Service Airlines during the study period. Further the study found that the Full Service Airlines have been able to fight the Low Cost Airlines by (a) Competitive Pricing Policy (b) Better Service quality and Loyalty among business traveller. The study used data taken from Director General of Civil Aviation for the last 10 years available which is the compilation of the data received from Airlines operator for the domestic operation service. And the data collected for the period 10 years from 1.4.2005 to 31.3.2015. Further the study used capacity utilisation of Airlines Business Model. The authors found that the contribute to literature on understanding on Airline capacity performance in the Indian domestic market. Barros (2009) found that there was growth trend in operational performance of the European airlines. And Assaf (2012) study found that European Airlines are slightly better performers than U.S Airlines. The study concluded that the data analysis process that capacity growth and utilisation of capacity of Low Cost Airlines are higher than Full Service Airlines and the interest on specific areas of research. There is non-tangible aspect of customers satisfaction involved in the operating capacity performance that can be investigated.
Transportation Research Board (1999), " Entry and Competition in the U.S Airline Industry: Issues Opportunities, National Academy Press, Washington D.C" analyse the reviewing the effect of deregulation on competition, fares and service, the report included reviews of safety experience since deregulation and presented options for reforming the federal Aviation Administration. The study examine according to the 1998 Act, Congress called on Department of Transportation and its proposed guidelines for 6 months before issuing the final version and pertaining study to competitive issues in the airline industry as well as recommendations for changes in the statutory frame work under which airline industry operates and effects on consumer the committee chose to emphasize the trends in pricing and in flight offerings. The study found that, TRB convened an 11 member committee with expertise in economics, airline operations and management, law, and, public policy. The study used Regression analysis by the Office of Aviation and International Economics provided data and analyses on passengers fares and traffic performed through according to instruction given by the committee. The Transportation Research Board found that the report was reviewed by individuals chosen for their diverse perspectives and technical expertise, in accordance with procedures approved by the National Research Councils Report Review Committee and their comments and draft manuscript remain confidential to protest the integrity of the process. The study concluded that the some well understood and recognized opportunities to encourage airline competition, especially in larger markets. Further study suggestion and idea for exploration are offered at the end of this report encouraging and providing opportunities to attract and retain airline services.
Wei and Hansen (2006) in their research paper, "An Aggregate demand model for air passenger traffic in the hub-and-spoke network" analyse on connectivity passengers, number of spokes and flights between the hub and its spokes of airway network in the USA. The study used log-linear demand model. The result of the empirical model depicts that the coefficient of the fare variable reveals the sensitivity of passengers travel demand with respect to passenger 's monetary cost. The study also found that the monetary value of the impact from any change of airlines service variables or change of air capacity on passenger's demand. Further the study found that the direct impact of hub airport capacity on the airlines connecting passengers. The authors found that to connecting passengers in the network, airlines services in the first flight leg seem more important than their services in the second flight segment. The study concluded that hub airport capacity which has a significant impact on service quality in the hub airport and in the whole hub-and-spoke network, is also taken into consideration.
2.1An overview
The existing review has been focused on different dimension of the air transport in India. As pr the knowledge of the researcher, no research work was done in depth on the air transport in India. Hence, this study has made an attempt to analyse the various dimension of the air transport through air ports in India. The next chapter deals with an overview of air transport in India.
3An overview of transport
Transport an important component of the territory sector is of immense significance in a country's economic development. With the advancements, complexities and sophistications of the modern world, a country cannot think of attaining economic prosperity in the absence of a rapid development of the transport sector. Transport is an essential economic infrastructure for the rapid development of any region. The lack of transport facilities retards the process of economic development even if a region is endowed with rich natural resources. Transport has been recognized as an indispensable ingredient of a country's overall development. According to the Encyclopaedia of social sciences "the transport system is the culmination of all technical instruments and organization designed to enable persons, commodities and news to master space". Therefore, the transport can be referred to as a process of moving people and goods from one place to another with some predetermined objectives. Transport in the modern world, may assume different forms like road transport, railway transport, water transport and air transport. Transport is indispensable for the economic development of country. It occupies a pivot place in the economic development process. It has been often remarked " if agriculture and industry are regarded as the body and bones of the economy, transport and communication constitutes its nerves"
3.1Factors governing the choice of the mode of transport
With the advancement of Science and Technology, there are several means of transport. Each market is served by two or three modes of transport. Most of the cities are connected by road, rail, water and air transport. Therefore, the marketers have a wide choice in the selection of a particular mode of transport. Each means of transport has its own merits and demerits. The marketer should work out a proper balance between the merits and demerits of each mode of transport and select a media which is more suitable. The following are the factors to be considered while judging the competitive efficiency of different means of transport:
Suitable: The mode of transport selected should be suitable for the need. If the commodity is bulky, rail or sea transport is preferable. If the commodity is less bulky, road transport is suitable.
Speed: The speed of the vehicle is another important consideration. If the goods are to be delivered to the consumers overnight like vegetables and flowers, air transportation is viable.
Cost Consideration: The marketer should always be cost conscious. The transportation cost should be kept at the minimum. Cheaper transportation shall reduce the production cost and marketing costs and enable the marketer to face the competition effectively.
Safety: Safety is another consideration in transportation decisions. The means of transport should provide necessary safety to the commodities. The marketer should select only that mode of transport which can ensure safety.
Flexibility: Flexibility is another factor which governs transportation decisions. If the regular mode of transport is unsuitable, the marketer should not hesitate to switch over to some other means of transport ignoring all cost considerations.
Regularity and Punctuality: If the goods are to be transported daily to ensure uninterrupted supply in the market, the marketer should consider the regularity and punctuality of the transport. Railways usually provide higher degree of regularity and punctuality and is more reliable than other means of transport.
Availability: Availability, in fact, is the main consideration. In certain areas, only a few means of transport are available. Most of the modern means of transport are not available in all places. The marketer in such cases should make use of the means of transport which is available.
3.2Types of transport
Transportation methods of modes are an essential components of transport systems since they are the means by which by which mobility is supported. Each mode has its own importance and features, to serve the specific demands of freight and passenger traffic. Recently, there is a trend towards integrating the modes through inter-modality and linking the modes ever more closely into production and distribution activities. At the same time, however, passenger and freight activity is becoming increasingly separated across most modes. All of them have their own merits, demerits, suitability and limitations. Accordingly, the modes employed vary with varying situations and requirements. A wide range of modes are grouped under three broad categories: land, water and air.
- 1. Land transport.
- 2. Water transport, and
- 3. Air transport.
Of the three kinds of transport, the land is the oldest medium of transport. The water transport comes next to it. The air transport is the modern development in the system of transport. The air transport made its appearance only in the 20th century and is now making its head way. Each of the mode of transport can be divided and sub-divided into a number of groups.
3.3Land transport
India's Land Transport System has been organised and managed by mixed ownership pattern of public and private sector. The constitutional responsibility for providing transport facilities rests on the shoulders of both Central and State by which the Central Government is accountable for development of the railways, national highways, civil aviation, international shipping and major ports. And the development of all minors ports, coastal shipping, inland water transport and urban transport rests within the domain of the States. The domestic air transport service has been deregulated in early 1990 by allowing private operators. A few private air transport operators have entered and recently are competing with the Government undertaking. Land Transport is the most important and usually adopted means of transport. It is the oldest means of transport. Inspite of the modern developments in the air transport, the land transport still has an undisputed role to play throughout the world. The land transport can also be further sub-divided into four kinds. They are: 1. Pathways, 2. Roadways, 3. Tramways, and 4. Railways.
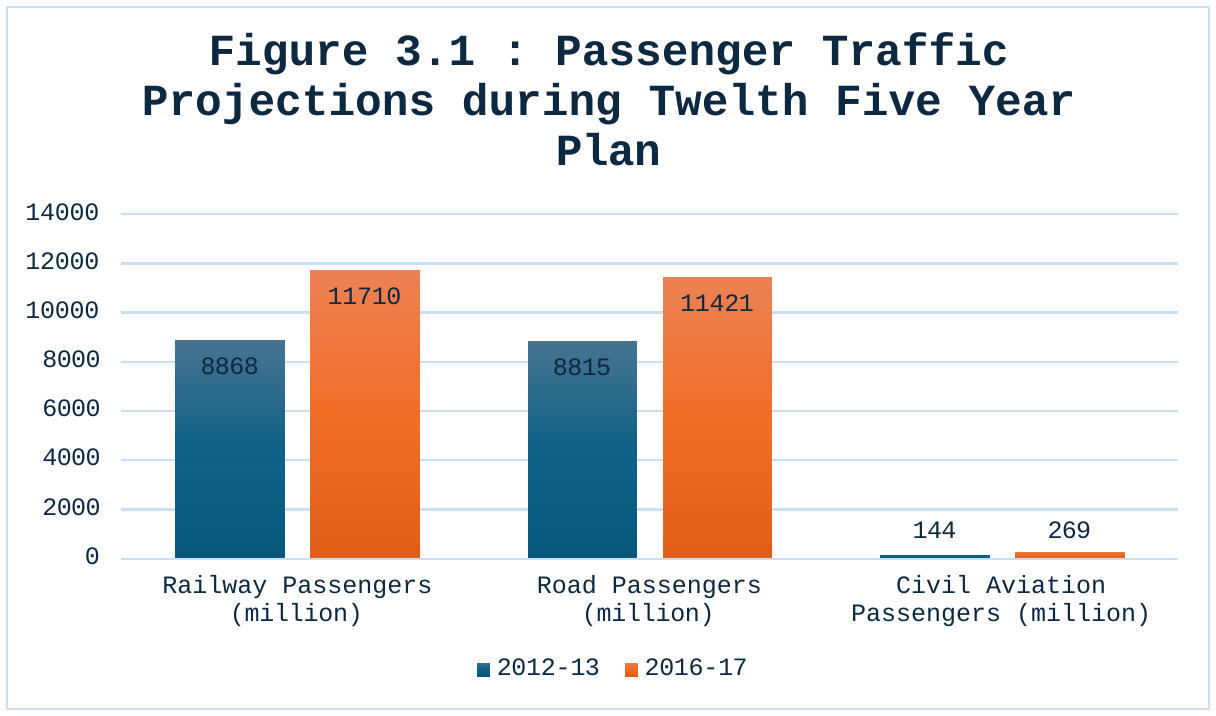
Figure 1 explain the various mode of transport passenger traffic in India. The railway passengers traffic has been increased to 11710 million in 2016-17 from 8868 million in 2012-13 in the twelfth five year plan. Similarly, The road passengers traffic has been increased to 11421 million 2016-17 from 8150 million in 2012-13 in the twelfth five year plan. And the civil aviation passengers traffic has been increased to 269 million in 2016-17 from 144 million in 2012-13 in the twelfth five year plan. It is inferred that irrespective of various modes of transport passengers traffic has been significantly increased over the period.
3.3.1Pathways
Pathways are still useful in remote villages, forests and hilly areas where roads cannot be built. The principal means of pathways transport are
Head Load: This is the only form of transport found in hilly tracts where even animals cannot reach. Even today it is a common practice to use coolies to carry the luggage in the railway stations and bus stands. The cost of this transport is very low.
Pack Animals: Animals like horse, donkey, camel, elephant, etc., are used in those areas where vehicular traffic is not developed or it is impossible. The cost is also low. However, it is better than head loads.
3.3.2Road transport
Road infrastructures have large consumers of space with the lowest level of physical constraints among transportation modes. However environmental constraint are significant in road construction. Road transportation has an average operational flexibility as vehicles can serve several purposes but are rarely able to move off roads. Road transport systems have high maintenance costs, both for the vehicles and infrastructures. They are mainly linked to light industries where rapid movements of freight in small batches are the norms. Road is the oldest, artificial medium of transport. Its beginnings are almost instinctive with man's first attempt in search of food and water. It was the only mode of transport before the other modes of transport made their appearance. The Road Transport is prominent infrastructure which occupies a predominant place in India with an area of 3.29 million sq. kms. stretched over a distance of 3,000 kms. and across 5,92,000 villages spread all over the country.
3.3.3Road connectivity in India
Out of over 5,89,000 villages in India just around 2,74,000 or 47 per cent of the villages have been connected in the last 50 years by permanent all time weather roads. According to the Surface Transport Ministry source, new road length of 12,60,000 kms. would have to be constructed to meet the objective of rural connectivity.
| NHDP component | Total length (km) | Completed length (km) | In progress (km) | Estimated cost (Rs crore) |
|---|---|---|---|---|
| GQ under NHDP Phase I | 5,486 | 5,846 | 0 | 30,300 (Phase I) + 34,339 (Phase II) = 64,639 |
| NS-EW Corridors under Phase I & II | 7,142 | 6,422 | 463 | Included above |
| Port Connectivity under NHAI | 431 | 379 | 52 | |
| Other NHs with NHAI | 1,844 | 1,578 | 266 | |
| NHDP Phase III | 12,608 | 6,734 | 3,402 | 80,626 |
| NHDP Phase IV | 20,000 | 2,877 | 7,483 | 27,800 |
| NHDP Phase V | 6,500 | 2,319 | 1,356 | 41,210 |
| NHDP Phase VI | 1,000 | 0 | 0 | 16,680 |
| NHDP Phase VII | 700 | 22 | 19 | 16,680 |
| Sub Total (NHDP) | 56,071 | 26,177 | 13,041 | 2,47,635 |
Note: Source: Ministry of Road, Transport and Highway.
Table 1 explains the status of national highways in India. The highest completed NHDP length recorded as 6,422 kilo metres as on 31 Dec 2015. The highest componental NHDP length totally recorded 20,000 kilo metres in NHDP Phase IV as on 31 Dec 2015. The highest estimate cost is recorded as 80,626 crores in NHDP Phase III as on 31 Dec 2015. It is inferred that irrespective of the status of national highways movements in India over the period.
3.3.4Importance of road transport
The importance of road transport can hardly be exaggerated in a country like ours. A famous author has rightly remarked as follows - "The road is in every truth, one of the greatest fundamental institutions of mankind. It develops with man's advance, it retrogrades with the breakdown of the social order. A people without roads will be a people without intercourse with the outside world; without the attributes of civilization". Even the development of other means of transport can not reduce the importance of road transport. Roads are heterogeneous in composition. Many kinds of vehicles play on it. It can be used by poor rich alike without any payment.
3.3.5Different means of road transport
Bullock Carts: Bullock carts are the most popular means of transport used for carrying goods from villages to the market. More than 70per cent of the total volume of transport is carried by bullock carts.
Thelas: Thelas are two or four wheeled vehicles driven by human beings. They are commonly used to carry goods from the platforms of the railway stations to the rickshaw or motor cars.
Rickshaws: Rickshaws are three wheeled vehicles driven by human beings. They are commonly used to carry 2 to 3 passengers. They are very convenient form of transport. They working expenditure is also very little.
Tongas: Tongas are driven by horses. They are found both in rural and urban areas. They can cover small distances ranging from 10 to15 kilo meters.
Motor Cars and Trucks: The motor car especially, has gained popularity in the last three decades both in respect of goods traffic and passenger traffic. In fact, it is transforming the internal transport system all over the world. In our country. there were only 2.1 lakhs of motor vehicles in 1947. But their number has increased to 4 lakhs in 1956, and now the total number of motor vehicles on road have crossed even more than a crore.
3.3.6Tramways
The tramways were popular in large cities like Madras, Calcutta and Bombay. They are highly useful for carrying passengers and goods during peak hours. Their carrying capacity is also larger than that of motor vehicles but however is less than railways.
3.3.7Rail transport
Railways are composed of traced paths on which vehicles are bound. They have an average level of physical constraints linked to the types of locomotives and are affected by the gradient. Heavy industries are usually coupled with rail transport systems, although containerization has improved the elasticity of rail transportation by linking it with road and maritime modes. Russia and India have the most extensive rail networks in the world. Rail transport is the principal means of transport throughout the world. It is the pioneer of modern mechanical transport. In spite of the recent developments in other transport systems, the rail transport still occupies a place of pride. In our country, it covers nearly 80 per cent of the goods traffic and 70 per cent of passenger traffic. The Railway has more advantages as compared to other mode of transport. Indian Railway is the second largest railway system in the world. It provides necessary freight traffic to most of the Indian industries and reliable transportation to the common man.
Considering the role of railway, Government of India has been providing considerable amount for transport sector during various plan period.
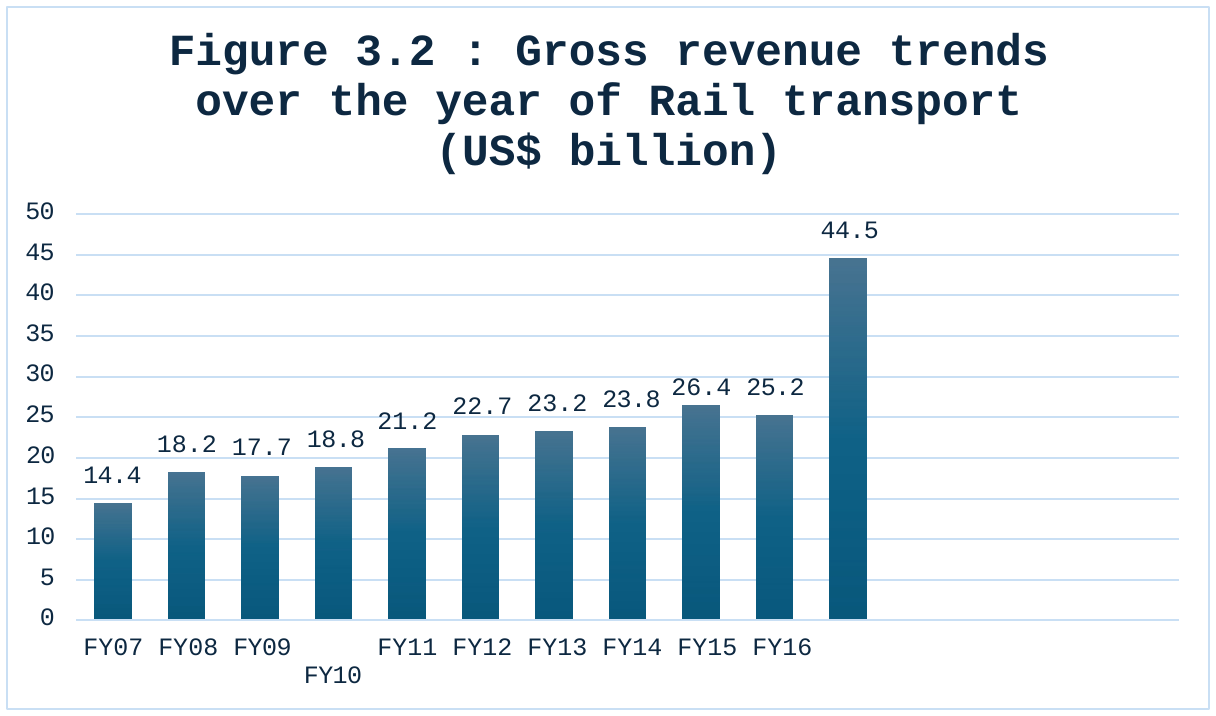
Figure 2 explain Gross revenue trends over the year in India. The expected CAGR is recorded as 9.07 per cent in the financial year 2007-20. The gross revenue of the rail transport increase from $ 14.4. In 2007 to $ 26.4 in 2015. Which has declined to $ 25.2 in 2016. The expected gross revenue of the rail transport is $ 44.5 in 2021.
3.3.8Features
- 1. Construction of Railway Track.
- 2. Safety Regulation.
- 3. Public Utility Service.
- 4. Monopoly in Nature.
- 5. Heavy Capital Investment.
3.4Water transport
Water transport is another primitive mode of transport. It is comparatively cheaper than land transport. The water transport is solely responsible for the development of international trade i.e., trade between countries. Its place in the field of marketing is fully recognised, and most revolutionary changes are taking place in the area of water transport and its routes are over oceans, seas, coasts, lakes, rivers and channels. Maritime transportation has high terminal costs, since port infrastructures are among the most expensive to build, maintain and improve. More than any other mode, maritime transportation is linked to heavy industries, such as steel and petrochemical facilities adjacent to port sites. The Atlantic Ocean accounts for 78per cent of the global trade, 68per cent of its value and for 75per cent of the maritime trade. The construction of channels locks and dredging are attempts to facilitate maritime circulation by reducing discontinuity. Comprehensive inland waterways systems include Western Europe the Volga/ Don System, St. Lawrence/ Great Lakes system, the Mississippi and its tributaries, the Amazon, the Panama/ Paraguay and the interior of China.
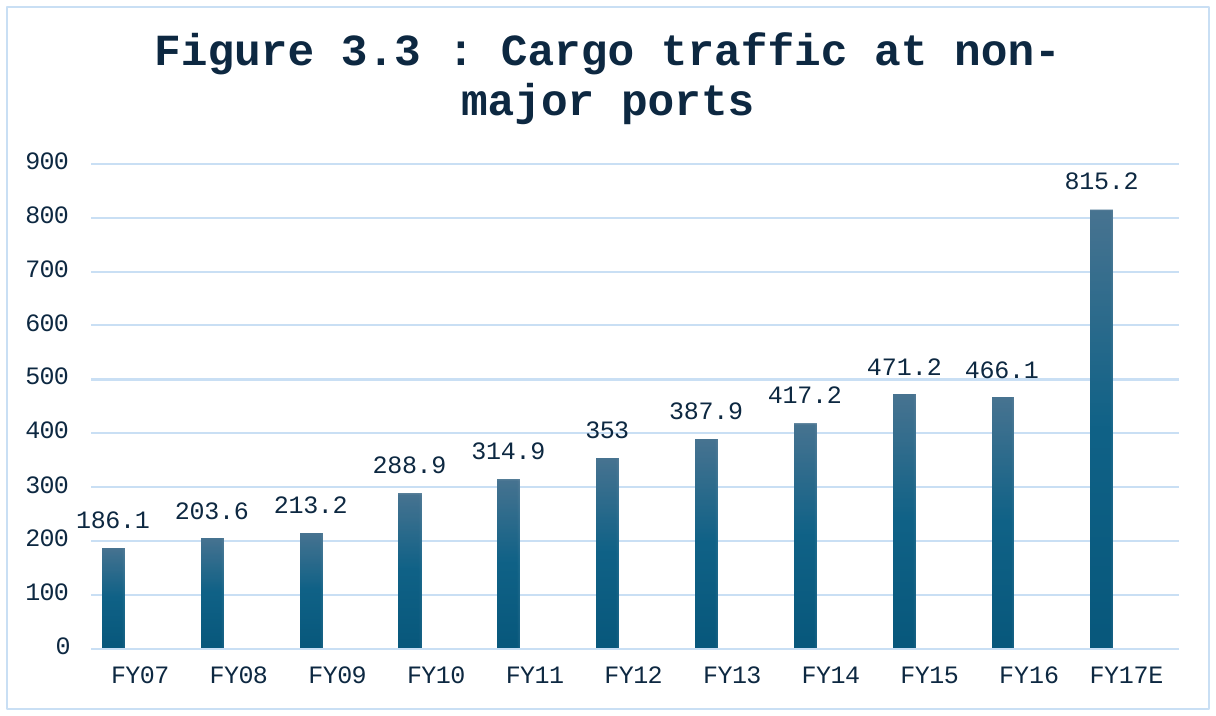
Figure 3 explain cargo traffic of non-major ports in India. The CAGR is recorded as 15.9 per cent in the financial year 2007-17. The highest Cargo traffic is respected to recorded as 815.2 million metric tonnes in the financial year 2017, and also the highest Cargo traffic estimation in the corresponding period. The cargo traffic at non-major ports increased from 186.1 million metric tonnes in 2007 to 466.1 million metric tonnes in 2011.
3.4.1Kinds of water transport
Water transport can be broadly classified into two kinds viz.,
- 1. Inland water Transport, and
- 2. Ocean Transport.
3.4.2Inland waterways
Inland waterways refer to the waterways within the political boundaries of a country. Inland waterways can be sub-divided into two kinds viz., 1. River transport, and 2.Canal transport.
The inland water transport is the cheapest mode of transport for certain kinds of traffic. It covers both long and short distance services. It is an efficient mode of transport in respect of fuel consumption. Although this mode requires very little investment, but it has very little scope in India because there are only a few rivers in the country.
River Transport: Rivers are the natural highways created by nature. Rivers are the ancient means of water transport. Early civilization and trade and commerce developed only through this medium of water transport.
Canal Transport: Canals are the man made waterways which have been designed for the purpose of navigation and irrigation.
3.4.3Ocean transport
Ocean transport has emerged as the most important means of transport between the nations. Our past history also contains references about this mode of transport and our trade with the various countries of the world. Particularly after the discovery of the sea route to India. Kinds of Ocean Transport Ocean transport can be again classified into two categories. They are: 1. Coastal Shipping, and Overseas Shipping.
3.4.4Coastal shipping
Coastal shipping is an important means of transport for all the countries whose borders touch the sea shore. It is cheaper and suitable for carrying bulky goods like iron ore, coal, etc., to distant places. It is useful in the internal trade.
3.4.5Overseas shipping
International trade is encouraged by this overseas shipping as this is the only means to move the goods and passengers. Even though air transport is Fastly improving, nearly 90per cent of the total international trade is carried on by ships.
3.4.6Kinds of overseas shipping
Liners: Liners are those which follow definite route with fixed places as per some schedules declared in advance. Liners can be divided into two categories viz., 1. The Passenger, and 2. The Cargo.
Passenger Liners: Passenger liners mainly carry passengers, postal mail. Express cargo is also carried to some extent.
Cargo Liners: Cargo liners just like passenger liners carry cargo on fixed routes. They are similar to our local transport services provided by companies like T.V.S., A.B.T., etc.
3.4.7Tramps
They are ships having no fixed routes, fixed time table or even fixed rate. The tramps can be compared to a motor car lorry waiting on the street for hire and ready to go to any place as per the instructions of the hirer.
3.4.8Tankers
Tankers are of recent origin. They are exclusively meant for crude oil, petrol and other petroleum products. The tankers are not suitable for transporting other type of goods or commodities.
3.5Air transport
Air transport is one of the gift of the 20th century. Thanks to Wright Brothers who made this greatest invention. The year 1919 is remarkable in the history of air transportation, as it was the honest beginning. The two World Wars gave a great impetus to the development of air transport. Today, air transport has developed in gigantic proportions so as to compete with all forms of transport. Air routes have created a wide network of air transport all over the world. It is no exaggeration to say that the developments in air transport are extremely fast as they place themselves (Nataraj 2007). Air routes are practically unlimited, but they are denser over the countries and inside the countries. Air transport constraints are multidimensional and include the site (a commercial plane needs about 3,300 meters of track for landing and take off), the climate, fog and aerial currents. Air activities are linked to the tertiary and quaternary sectors, notably finance and tourism that require movements of people. More recently, air transportation has been accommodating growing quantities of high value freight (Senguttuvan 2006). At present there are over 300 civil airports in India spread over all the States. During the year 1996-97, 300 civil airports in the country all together operated 36.4 million passengers (Gawali 2015).
3.6Airports in India
Air transport is one of the fastest growing sub-sector of transport. Generally there are two airports maintain by the Airways Authority of India viz. Domestic airports and International airports. There are 352 airports functioning across the country. But only few places both airports are functioning. There are more than 20 international airports in India(Bimal Dhawan 2015). The following major international airports in India are more than half of the air traffic in South Asia. They are, Mumbai (Chatrapati Shivaji International Airport), Delhi (Indhira Gandhi International Airport), Kolkata (Nataji Subash Chandra Bose International Airport), Chennai (Anna Airport), Thiruvananthapuram Airport, Bangalore (new International Airport at Devanahalli), Hyderabad (new International Airport at Samshabad), Amritsar Airport, etc. India has about 92 airports, principally managed by the Airports Authority of India.
3.7Heliports in India
As on 2012, there are 41 heliports in India. India also has the world's highest helipad at the Siachen Glacier a height of 6400 metre (21,000 ft) above mean sea level. Pawan Hans Helicopters Limited is a public sector company that provides helicopter services to ONGC to its off-shore locations, and also to various State Governments in India, particularly in North – East India (Bimal Dhawan 2015).
3.8Role and importance of air transport in India
Air transport in India, almost all state capitals are connected, which is a significant stride taken after independence. The tourism sector has benefitted greatly as well. Air transport is mainly used for transporting people. Till recently, the air transport was controlled by the public sector undertakings, namely Indian Airlines and Air India International. At present, several private sector operators like Jet Airways, Spice Jet, Indigo, GoAir, etc., share the air transportation in India. Aviation in India has 125 airports, including 11 international airport. Indian airports handled 96 million passengers and 1.5 million tonnes of cargo in year 2006-07, an increase of 31.4 per cent for passenger and 10.6 per cent for cargo traffic over previous year. The dramatic increase in air traffic for both passengers and cargo in recent years has placed a heavy strain on the country's major airports. Air passenger traffic is projected to cross 100 million and cargo to cross 3.3 million tonnes by year 2010. Air transport infrastructure in India is better developed in the southern and southwestern parts of the country.
Rapid economic growth in India has made air travel more affordable. Air India, India's flag carrier, presently operates a fleet of 106 aircraft and plays a major role in connecting India with the rest of the world. Several other foreign airlines connect Indian cities with other major cities across the globe. Indigo, Jet Airways and Air India are the most popular brands in domestic air travel in order of their market share. These airlines connect more than 80 cities across India and also operate overseas routes after the liberalization of Indian aviation.
However, a large section of country's air transport system remains untapped, even though the Mumbai - Delhi air corridor was ranked 10th by Amadeus in 2012 among the world's busiest routes. India's vast unutilised air transport network has attracted several investments in the Indian air industry in the past few years. More than half a dozen low - cost carriers entered the Indian market in 2004-05. Major new entrants included Air Deccan, Kingfisher Airlines, SpiceJet, GoAir, Paramount Airways and IndiGo Airlines. To meet India's rapidly increasing demand for air travel, Air India placed orders for more than 68 jets from Boeing for US$7.5 billion in 2006 while Indian in 2005 placed orders for 43 jets from Airbus for US$2.5 billion.
Jet Airways, India's largest private carrier, has invested millions of dollars to increase its fleet, but this has been put on hold due to the recent economic slowdown. This trend is not restricted to traditional air carriers in India. IndiGo Airlines entered the limelight when it announced orders for 100 Airbus A320s worth US$6 billion during the Paris Air Show: The highest by any Asian domestic carrier. Kingfisher Airlines became the first Indian air carrier on 15 June 2005 to order Airbus A380 aircraft. The total deal with Airbus was worth US$3 billion.
3.9Objectives of air transport
Unbroken Journey: Air transport provides unbroken journey over land and sea. It is the fastest and quickest means of transport.
Rapidity: Air transport had the highest speed among all the modes of transport.
Expensive: Air transport is the most expensive means of transport. There is huge investment in purchasing aero planes and constructing of aerodromes.
Special Preparations: Air transport requires special preparations like wheelers links, meteorological stations, flood lights, searchlights etc
3.10Characteristics of air transport
- 1. Air transport is the most suitable mode of transport for long distance.
- 2. It is not suitable for transporting heavy goods. However, under special conditions the aeroplanes can take army tanks with them.
- 3. Aeroplanes fly according to pre-decided time schedule and through definite corridors while crossing over different countries due to safety reasons.
- 4. Light, costly and perishable goods are transported by aeroplanes.
- 5. It is suitable for relief operations at any place, at the time of calamities and emergencies, such as floods-earthquakes, accidents, etc.
- 6. It is suitable for hilly, desert, inaccessible areas where other means of transport are not favourable.
3.11Merits of air transport
Air transport has made many things possible in the international scene which remained impossible since the ages of the cave man. It has the following competitive merits:
Regular and Comfortable: Air transport is regular and punctual than other means of transport. The journey is comfortable, as all the comforts are provided to the passengers. Again there is no jolting or jerks which are common in the road transport.
Speedy and Unbroken Journey: It is the fastest means of transport which provides continuous journey over thousand miles of distances. Jet and Concord planes can cross even continents within two or three hours.
Expansion of Trade: Air transport enabled the busy businessmen to travel extensively over a wide area within a shorter period. This factor enable them to expand the market for their product.
Lesser Costs for Contraction and Operation: The nature provides the way for air traffic. Only the runways is to be constructed and nothing is to be invested as in the constructions of the prepared way in the case of the railway lines or road or canal.
Reliable in times of emergency: Its real importance is felt when the land is submerged by water due to heavy rains and flood and it cannot be reached by other means of transport. The only means then available is aeroplane. It’s one of this common in Northern of and periods
Only means of Perishable Goods: Perishable commodities like vegetables, fruits, flowers are now available even in distant markets only because of the air transport. Thus, air transport has created place and time utilities to a number of products which other means of transport cannot provide.
Powerful War Fare Vehicle: Modern wars are fought mainly by aeroplanes. Its upper hand is destroying the enemy properties and lives within a few minutes. It support other wings of defence to a greater extent.
3.12Demerits of air transport
Less Safety: The climatic conditions and mechanical defects are responsible for the frequent accidents.
Hence, it is considered as dangerous and unsafe.
Cannot Serve all the Areas: Like roadways, it cannot serve all the markets. Barely a few places have airports. Only those places can be served by this media of transport and other places will remain unserved.
More Costly: The cost of maintaining the airports and the runways are comparatively higher. This factor makes the fare for the passenger traffic higher than the railway fare for the first class.
Not suitable for Bulky Goods: It is suitable only for high grade costly goods. It is also a boon to perishable goods. But heavy and bulky goods cannot be transported through this media because its carrying capacity is very much limited.
Political Barriers: Another limitation arises out of international laws is no aeroplane can fly over the territory of any other country without an air agreement with that country.
High Degree of Training for Operation: Very high degree of training, intelligence and carefulness is required for operating air service. Therefore, experts should be employed to operate air traffic smoothly. This factor makes the maintenance costs higher (Nataraj 2007).
3.13An overview
Transport play an important role in the economic development of a country. Air transport is the fastest growing subsector of transport. Indian airport is the largest and fastest growth in terms of passengers and traffic in the recent years. Particularly during the globalization era Indian air transport expand at a large extent.
4An analysis of air transport in India
India has the potential to be among the global top three nations in terms of domestic and international passenger traffic. It has an ideal geographical location between the eastern and western hemisphere, a strong middle class of about 30 crore Indians and a rapidly growing economy. The Government has proposed to promote the growth of Indian aviation sector in a significant manner as the development of this sector has a multiplier effect on the economy. The national Civil Aviation Policy is a step in that direction. The NCAP 2016 has been finalised on the basis of the feedback received from the public, other stakeholders and experts.
4.1Organisation setup
Ministry of Civil Aviation located at Rajiv Gandhi Bhavan at the Safdarjung Airport in New Delhi, it is responsible for formulation of national policies and programmes for the development and regulation of the Civil Aviation Sector in the country. It is responsible for the administration of the Aircraft Act, 1934, Aircraft Rules, 1937 and various other legislations pertaining to the aviation sector in the country. This Ministry exercises administrative control over attached and autonomous organizations like the Directorate General of Civil Aviation, Bureau of Civil Aviation Security and Indira Gandhi Rashtriya Udan Academy and affiliated Public Sector Undertakings like National Aviation Company of India Limited, Airports Authority of India and Pawan Hans Helicopters Limited.
4.2Civil aviation policy in India
Civil Aviation in India traces its origin back to 1911, when the first commercial civil aviation flight took off from Allahabad for Naini. Air India is India's national flag carrier after merging with India in 2011 and plays a major role in connecting India with the rest of the world. Indigo, Jet Airways, Air India, Spicejet and GoAir are the major carriers in order of their market share. These airlines connect more than 80 cities across India and also operate overseas routes after the liberalisation of Indian aviation. Several other foreign airlines connect cities with other major cities across the globe. However, a large section of country's air transport potential remains untapped, even though the Mumbai-Delhi air corridor was ranked 10th by Amadeus in 2012 among the world's busiest routes. In the world having a potential of becoming third largest aviation market by 2020. It recorded an air traffic was Jet Airways which transported over 10 million passengers in and out of India in 2016, followed by Air India and Al Express. In third place was Emirates, which is the large foreign airline operating in India.
4.3History of civil aviation policy in India
Civil Aviation in India traces back to 18 February 1911, when the first commercial civil aviation flight took off from Allahabad for Naini over a distance of 6 miles. During the Allahabad Exhibition, Henri Pequet, a French aviator, carried 6.500 pieces of mail on a Humber biplane from the exhibition to the receiving office at Allahabad. This is the world's first official airmail service. On 15 October 1932, J.R.D. Tata flew a consignment of mail from Karachi to Juhu Airport. His airline later became Air India. In march 1953, the Indian Parliament passed the Air Corporation Act. India's airline me Industry was nationalised and the eight domestic airlines operating independently at that time, Deccan Airways, Airays India, Bharat Airways, Himalayan Aviation, Kalinga Airlines, Indian National Airways, Air India and Air Services of India were merged into two government owned entities. Indian Airlines focused on domestic routes and Air India International on international services. The International Airports Authority of India was constituted in 1972 while the National Airports Authority was constituted in 1986. The Bureau of Civil Aviation Security was established in 1987 following the tragic crash of Air India Flight 182. Pushpaka Aviation operated scheduled international passenger flights from Bombay to Sharjah, as an associate carrier of Air India from 1979 to 1983. East-West Airlines was the first national level private airline to operate in the country after the government de-regularised the civil aviation sector in 1991. The government allowed private airlines to operate charter and non- scheduled services under the 'Air Taxi' Scheme until 1994, when the Air Corporation Act was repealed and private airlines could now operate scheduled services. Private airlines like Jet Airways, Air Sahara, Modiluft, Damania Airways and NEPC Airlines among others commenced domestic operations during this period. Air India placed orders for more than 68 jets from Boeing for US$7.5 billion in 2006 while Indian placed orders for 43 jets from Airbus for US$2.5 billion in 2005. Jet Airways invested million of dollars to increase its fleet, but was later put on hold due to the recent economic slowdown. Indigo announced orders for 100 Airbus A320s worth US$6 billion during the Paris Air Show, the highest by any Asian domestic carriers. Kingfisher Airlines became the first Indian air carrier on 15 June 2005 to order Airbus A380 air craft worth US$3 billion. More than half a dozen low-cost carriers entered the Indian market in 2004-05. Major new entrants included Air Deccan, Air Sahara, Kingfisher Airlines, Spice Jet, Go Air, Paramount Airways and Indigo. But Indian aviation industry struggled due to economic slowdown, rising fuel and operation costs. This led to consolidations, buy outs and discontinuations in the Indian airline Industry. In 2007, Air Sahara and Air Deccan were acquired by Jet Airways and Kingfisher Airlines respectively. Paramount Airways ceased operations in 2010 and Kingfisher shut down in 2012. Etihad Airways agreed to acquire 24per cent stake in Jet in 2013. Air Asia India, a low cost carrier operating as a joint venture between Air Asia and Tata Sons launched in 2014. As of 2013-14, only IndiGo and Go Air were generating profits.
4.4New civil aviation policy 2016
New Civil Aviation policy: Cheaper air travel for passengers, wings for industry to fly higher. It was approved on 15 June, 2016 by Union Cabinet with the aim to make flying more affordable and convenient. The UDAN Scheme which was launched on April 27, 2017 by PM Narendra Modi, is a key component of the National Civil Aviation Policy.
4.4.1Vision
To create an eco-system to make flying affordable for the masses and to enable 30 crore domestic ticketing by 2022 and 50 crore by 2027, and international ticketing to increase to 20 crore by 2027. Similarly, cargo volumes should increase to 10 million tonnes by 2027.
4.4.2Mission
Provide safe, secure, affordable and sustainable air travel for passengers and air transportation of cargo with access to various parts of India and the world.
4.4.3Objectives
- 1. Establish an integrated eco- system which will lead to significant growth of civil aviation sector, which in turn would promote tourism, increase employment and lead to a balanced regional growth.
- 2. Ensure safety, security and sustainability of aviation sector through the use of technology and effective monitoring.
- 3. Enhance regional connectivity through fiscal support and infrastructure development.
- 4. Enhance ease of doing business through deregulation, simplified procedures and e-governance.
- 5. Promote the entire aviation sector chain in a harmonised manner covering cargo, MRO, general aviation, aerospace manufacturing and skill development([PDF]national civil aviation policy 2016- Ministry of Civil Aviation).
4.4.4Key features of the NCAP
- VGF for operation under Regional Connectivity Scheme.
- Revival of un-served or under - served routes under RCS.
- Introduction of a new Category Schedule Computer Operator' under Commercial Air Transport Operations.
- Rationalization of Category -I routes under Route Dispersal Guidelines on the basis of criteria given in NCAP 2016.
- The requirement of 5 years and 20 aircraft for international operation has been modified to 0 years and 20 aircraft or 20per cent of the total capacity whichever is higher for domestic operations.
- Liberalization of domestic code share points in India within the framework of ASA.
4.4.5Policy areas
NCAP 2016 covers the following policy areas:
- Regional connectivity.
- Safety.
- Air Transport Operations.
- Route Dispersal Guidelines.
- 5/20 Requirements for International Operations.
- Bilateral traffic rights.
- Code - share agreements.
- Fiscal Support.
- Airports developed by State Government, Private sector or PPP mode.
- Airports Authority of India.
- Air Navigation Services.
- Aviation security, Immigration and Customs.
- Helicopters.
- Charters.
- Maintenance, Repair and Overhaul.
- Ground handling.
- Air - cargo.
- Aeronautical 'Make in India'.
- Aviation education and skill development.
- Sustainable aviation.
- Miscellaneous.
- Essential Service Maintenance Act, 1968.
4.4.6Safety
The government places top most priority on aviation safety. The focus will be on pre-empting and preventing accidents / incidents. Safety violations will be treated with zero-tolerance.
4.4.7Air transport operations: Commercial
Ministry of Civil Aviation will promote growth of civil air transport operations with a focus on regional connectivity with categorization of the commercial air transport into three main categories. Entry pre-requisites in terms of equity and number of aircraft as well as certification and operating regulations would be graded depending upon the size of aircraft and complexity of operations with greater flexibility being provided to commuter and small aircraft.
4.4.8Airport authority of India
Out of 125 airports of AAI, about 95 are operational of which 71 have scheduled commercial operations as on 1st Jan 2016. AAI will take up development of airports.
4.4.9Air navigation services
AAI is ranked among the top ANS providers in the world. Up gradation and modernisation of ANS in India is in line with global trends. With the launch of GAGAN, India has become the fourth country in the world to use satellite-based navigation system.
4.4.10Air cargo
Promotion of both domestic and international Air cargo and express delivery services is a key objective of the government, given its importance from a 'Make in India', e-Commerce and exports perspective. Revenue from air cargo helps subsidize the cost of passenger tickets and take flying to the masses. Air cargo, particularly domestic has a high employment potential, especially for semi-skilled workers. Currently air cargo volumes in India are very low as compared to other leading countries due to high charges and high turnaround time. Within the air cargo ecosystem, Express Delivery Service has a distinct operational nature and is becoming pivotal especially in the light of double digit growth in e-commerce (national civil aviation policy 2016-Ministry of Civil Aviation).
4.5Passenger traffic
| Passenger | Unit | 2015-16 | 2014-15 |
|---|---|---|---|
| Domestic Passengers | Departing Passengers | 85.20 million (21.58) | 70.08 million (15.51) |
| Domestic Airline Demand | Revenue Passenger Kilo meters (RPK) | 80.96 billion (20.80) | 67.02 billion (13.32) |
| Domestic Airline Capacity | Available Seat Kilo meters (ASK) | 97.71 billion (15.21) | 84.81 billion (5.07) |
| International Passengers | Departing and Passengers | 49.83 million (8.94) | 45.74 million (5.85) |
| Total Passengers (Domestic &International) | Total Passengers (Domestic &International) | 135.03 (16.59) | 115.82 (11.63) |
Note: Figures in parenthesis refer to percentage change over previous year. Source: GOI, (2016): "Hand Book on Civil Aviation Statistics", DGCA, Government of India, New Delhi.
Table 2 explain passenger traffic at a glance in India. Domestic passenger has increased to 85.20 million in 2015-16 from 70.08 million in 2014-15. Similarly domestic airline demand has increased to 80.96 billion from 67.02 billion in the corresponding year. The table also reveals that domestic airline capacity has increased from 84.81 million in 2014-15 to 97.71 million in 2015-16. Under the international airlines, the passenger traffic has been increased from 45.75 million to 49.82 million in the corresponding period. It is also observed that the total passengers traffic has been increased from 115.84 billion in 2014-15 to 135.03 billion in 2015-16. It is inferred that irrespective of airlines (national and international) the passenger traffic has been significantly increased over the period.
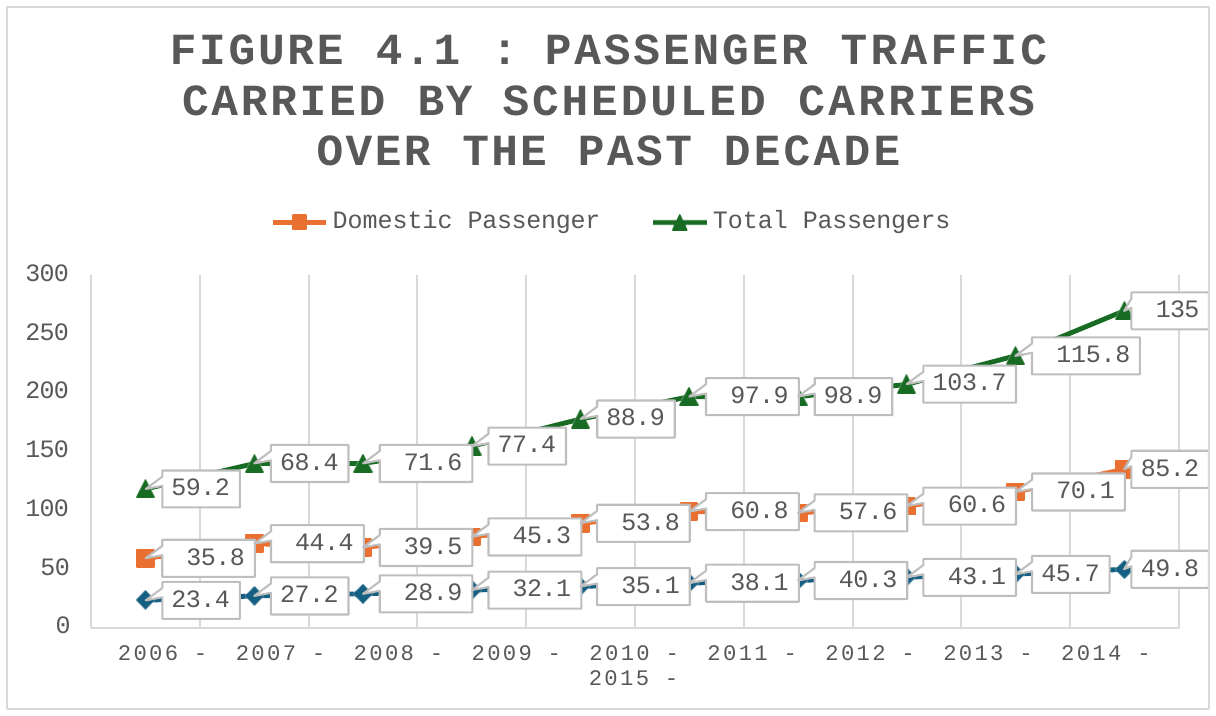
Figure 4 explains the passenger traffic movement over the past decade in India. The domestic passengers traffic rate has increased to 85.2 million in 2015-16 from 35.8 million in 2006-07. The highest domestic passenger traffic rate is recorded as 60.8 million in the year 2011-12. Similarly, the international passenger traffic rate is increased to 49.8 million in 2015-16 from 23.4 million in 2006-07. The total passenger traffic rate has increased to 135 million in 2015-16 from 59.2 million in 2006-07. The highest total passenger traffic rate is recorded as 97.9 million in 2011-12. It is inferred that irrespective of airlines (domestic and International) and both the freight traffic has been significantly increased over the period.
| Name of the airline | Passengers 2014-15 (no.) | Passengers 2015-16 (no.) | YoY growth in passengers (%) | PLF 2014-15 (%) | PLF 2015-16 (%) | YoY growth in PLF (%) |
|---|---|---|---|---|---|---|
| Air India | 11727171 | 12742163 | 8.5 | 77.2 | 79.2 | 2.6 |
| Air India Express | 191095 | 149217 | -21.5 | 73.5 | 80.1 | 9.0 |
| Alliance Air | 310492 | 400340 | 28.9 | 68.3 | 66.5 | -2.6 |
| Spice jet | 10716089 | 10670866 | -0.4 | 81.8 | 92.5 | 12.5 |
| Jet Airways | 12473808 | 15961308 | 28.0 | 78.4 | 80.6 | 2.8 |
| Indigo | 23727080 | 31453451 | 32.6 | 79.4 | 84.1 | 5.9 |
| Go Air | 6529936 | 7160189 | 9.7 | 79.1 | 83.7 | 5.7 |
| Jet lite | 3030638 | 2439721 | -19.5 | 80.1 | 79.3 | -0.9 |
| Air Asia | 553106 | 2439721 | 208.4 | 76.1 | 80.2 | 5.4 |
| Air Costa | 723627 | 1705808 | -1.6 | 74.1 | 80.7 | 9.0 |
| Vistara | 100919 | 1422611 | 1309.7 | 53.7 | 69.4 | 29.1 |
| Tru jet | 0 | 204588 | - | - | 80.1 | - |
| Air Pegasus | 0 | 175577 | - | – | 78.5 | - |
Note: Source: GOI, (2016): "Hand Book on Civil Aviation Statistics", DGCA, Government of India, New Delhi. Note: Vistara Operated For Only Three Months i.e, January-March During The Year 2014-15. Air Pegasus Stared Its Operations In July 2015 And Trujet In May 2015.
Table 3 explain year on year growth in passenger and passenger load factor in India. Indigo is the highest year on year growth in passenger which has increased to 31453451 in 2015-16 from 23727080 in 2014-15, which is recorded 32.6 per cent in the year on year growth in passengers. The year on year growth in passenger load factor has increased to 84.1 per cent in 2015-16 from 79.4 per cent in 2014-15, which is recorded as 5.9 per cent in the year on year growth in passenger load factor. It has followed by Jet Airways, Air India and Spice Jet. It is inferred that irrespective of airlines year on year growth in passenger and passenger load factor in India has significantly increased in the corresponding year.
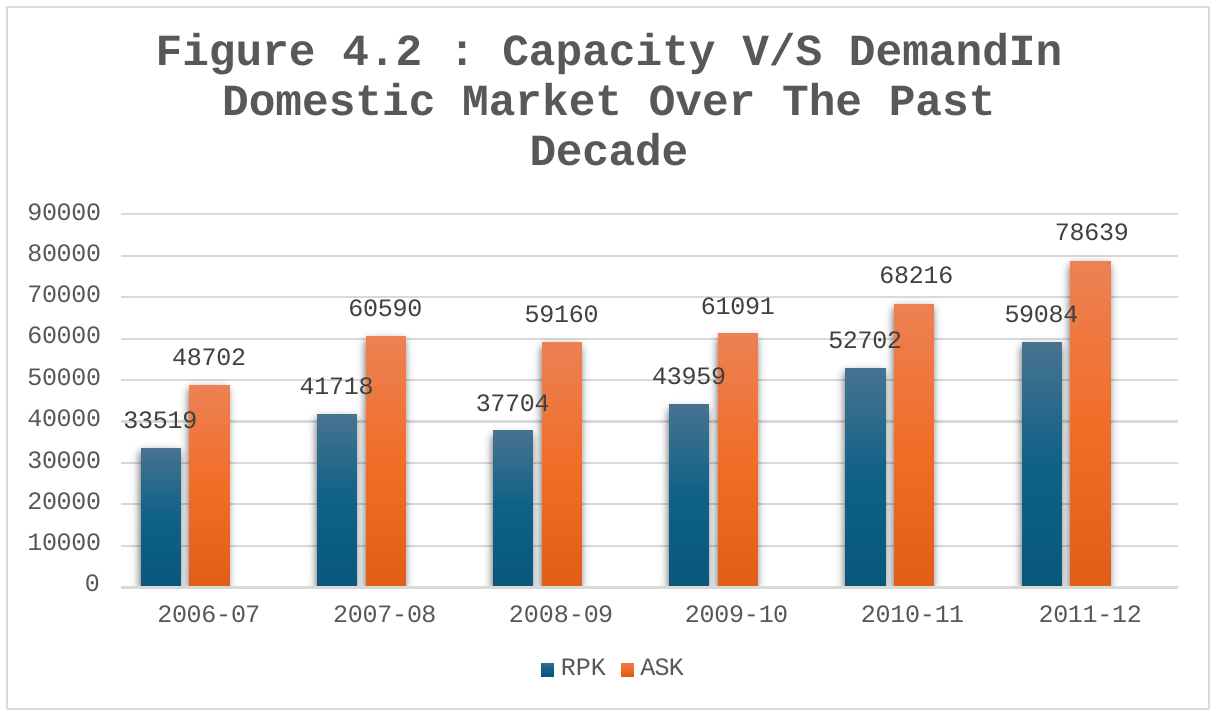
Figure 5 explain capacity v/s demand in domestic market movement in India. The RPK (demand) has increased to 80958 million in 2015-16 from 33519 million in 2006-07. The highest RPK is recorded as 59084 million in 2011-12. The ASK (capacity) has increased to 97713 million in 2015-16 from 48702 million in 2006-07. The highest ASK is recorded as 78639 million in 2011-12. It is inferred that irrespective of demand and capacity in domestic market movement is significantly increased over the period.
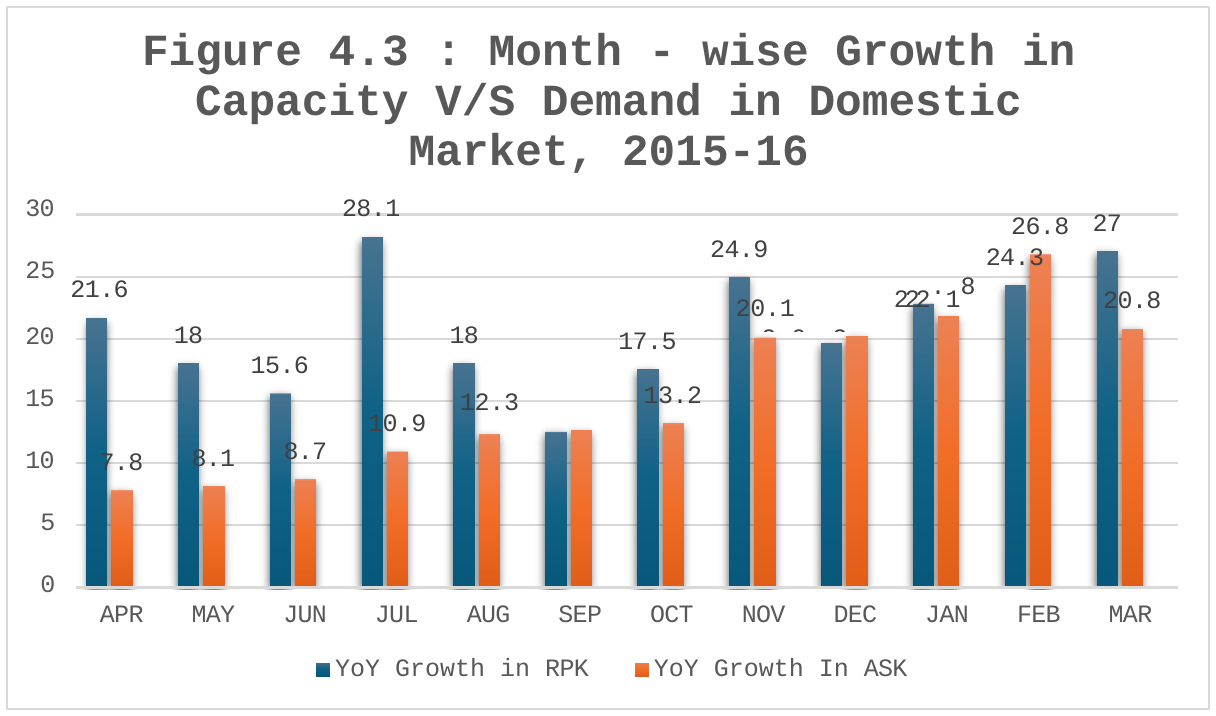
Figure 6 explain month-wise growth in capacity and demand in domestic market in India in the 2015-16. The YoY growth in RPK (demand) of domestic market is recorded as 28.1 per cent in the July.2015. The highest YoY growth in ASK (capacity) of domestic market is recorded as 26.8 per cent in the Feb. 2016. Both RPK(demand) ASK (capacity) of YoY growth is from Apr 2015-March 2016. It is inferred that irrespective of market and capacity in the month-wise growth of the domestic market over the period.
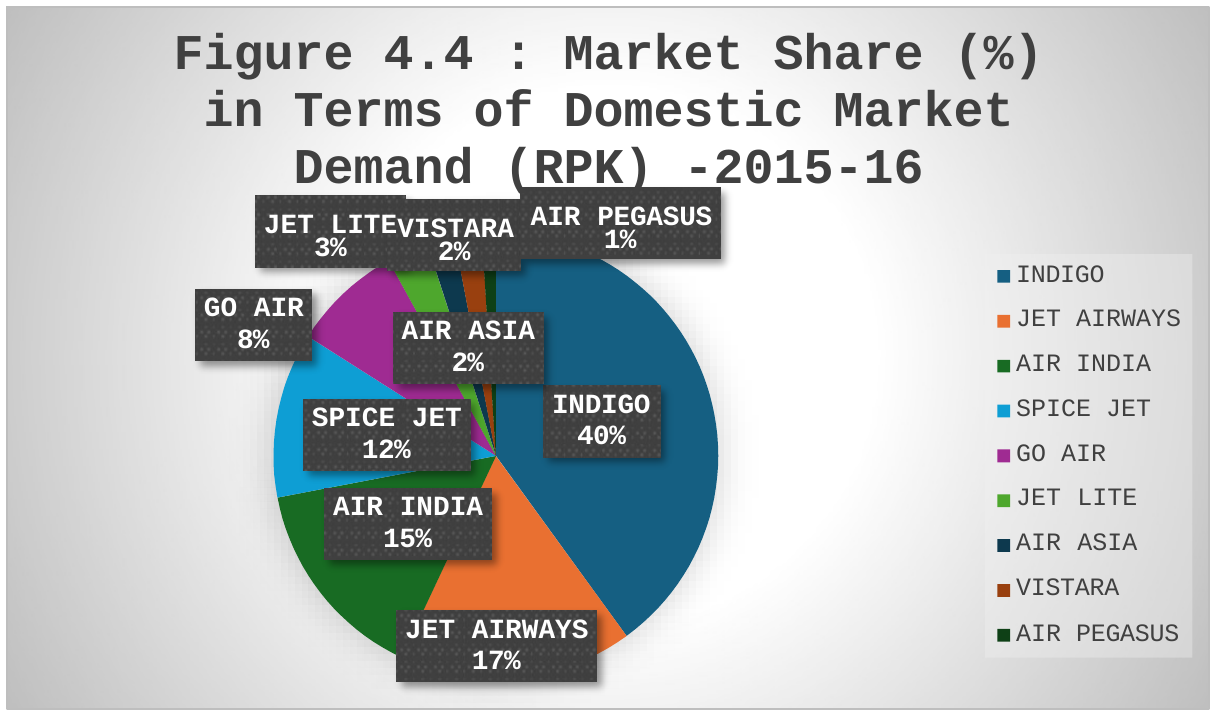
Figure 7 explain the market share per cent in terms of domestic market demand in India in 2015-16. Indigo is the highest market share per cent in terms of domestic demand, which is recorded as 39.9 per cent in the year 2015-16. It is followed by Jet Airways, Air India and Spice Jet; these are the nearer value of Indigo, which are recorded as 17 per cent, 15.1 per cent and 11.5 per cent respectively in the year 2015-16. Air Pegasus is the lowest market share per cent in terms of domestic demand, which is recorded as 1.3 per cent in the year 2015-16. It is inferred that irrespective of airlines market share per cent in terms of domestic market demand in India in the corresponding year.
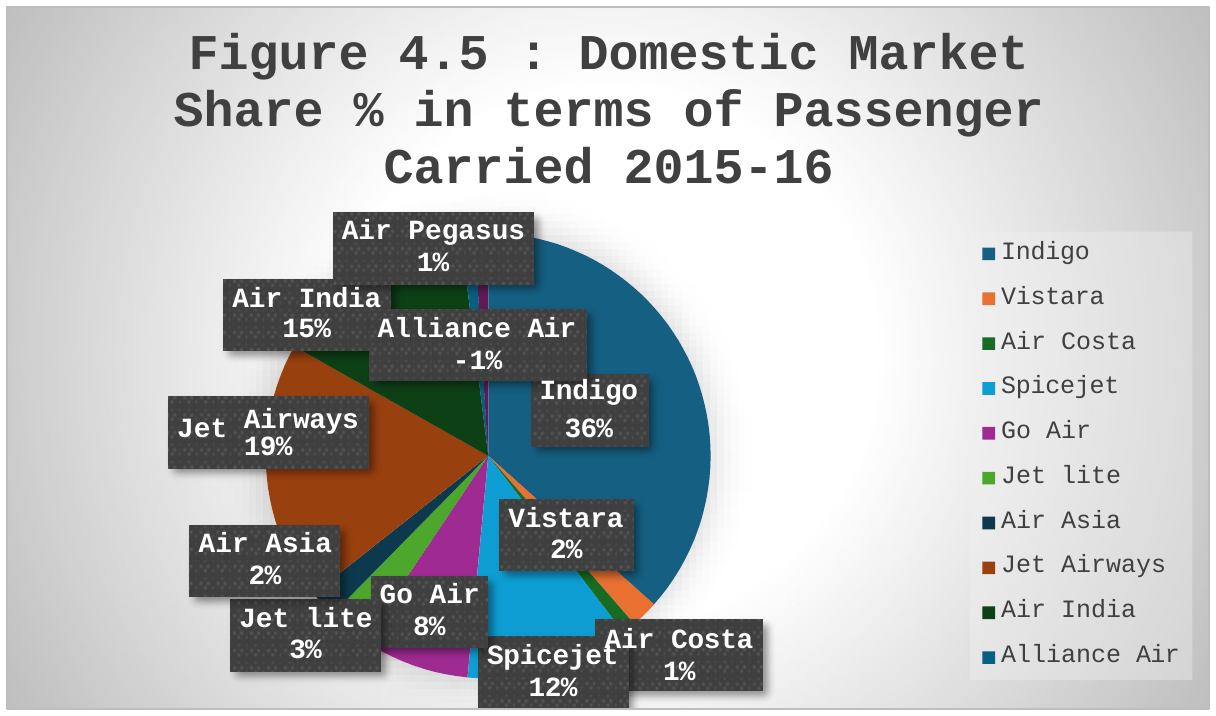
Figure 8 explain the domestic market share per cent in terms of passenger carrier in India in 2015-16. Indigo is the highest domestic market share per cent in terms of passenger carrier, which is recorded as 36.9 per cent in the year 2015-16. It is followed by Jet Airways, Air India and Spice Jet; these are nearer value of Indigo, which are recorded as 18.7 per cent, 15 per cent and 12.5 per cent respectively in the year 2015-16. Alliance Air is the lowest domestic market share per cent in terms of passenger carrier, which is recorded as 0.5 per cent in the year 2015-16. It is inferred that irrespective of airlines domestic market share per cent in terms of passengers carrier in the corresponding year.
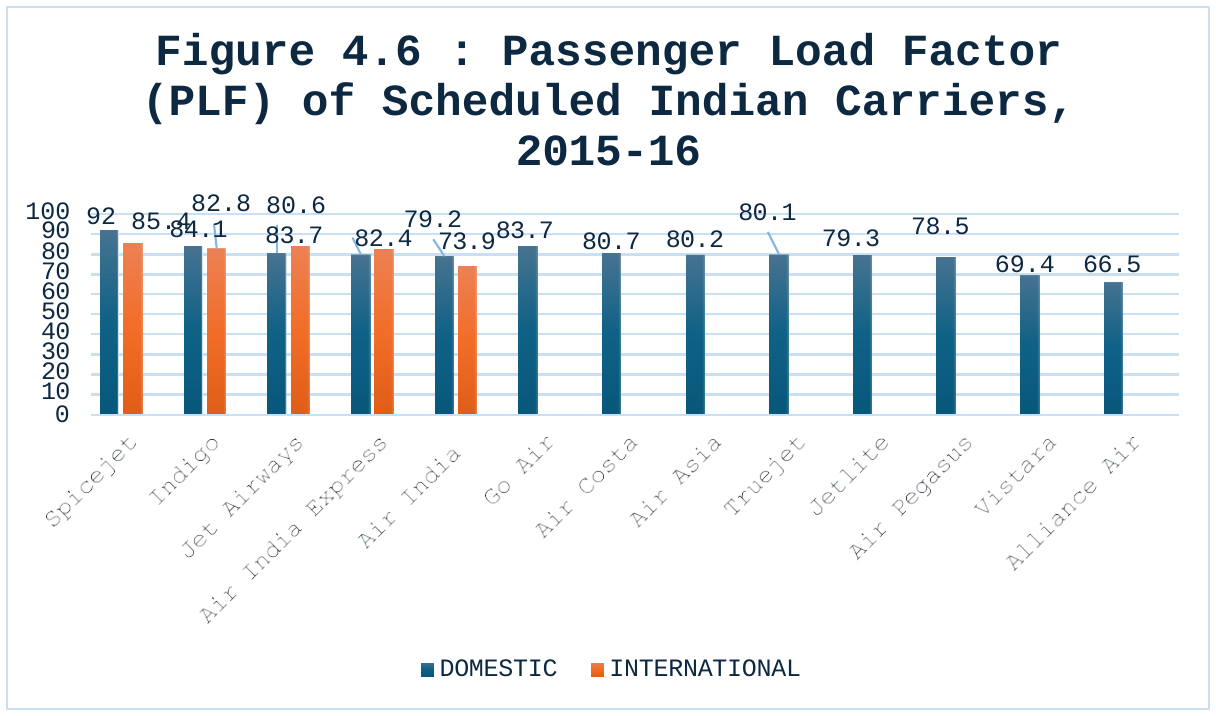
Figure 9 explain passenger load factor of scheduled Indian carriers in 2015-16. The highest domestic PAX load factor of scheduled Indian carrier is Spice jet, which is recorded as 92 per cent. Similarly, the highest International PAX load factor of scheduled Indian carrier is Spice jet, which is recorded as85-4 per cent. The International PAX load factor of scheduled Indian carriers are Spice jet, Indigo, Jet Airways, Air India Express, Air India. It is inferred that irrespective of PAX load factor of scheduled domestic and International in Indian carriers in the corresponding year.
| Year | Foreign | Indian Carriers |
|---|---|---|
| 2004-05 | 71.1 | 28.9 |
| 2010-11 | 65.5 | 34.5 |
| 2011-12 | 63.8 | 36.2 |
| 2012-13 | 64.1 | 35.9 |
| 2013-14 | 66.2 | 33.8 |
| 2014-15 | 61.7 | 38.3 |
| 2015-16 | 63.0 | 37.0 |
Note: Source: GOI, (2016): "Hand Book on Civil Aviation Statistics", DGCA, Government of India, New Delhi.
Table 4 explain market share percentage of International passenger in Indian carriers and foreign carriers. The foreign carriers market share per cent of International passenger is decreased to 63.4 per cent in 2015-16 from 71.1 per cent in 2004-06. The highest increased foreign carriers market per cent of International passenger is recorded as 66.2 per cent in the year 2012-13. The Indian carriers market share per cent of International passenger is increased to 36.6 per cent in 2015-16 from 28.9 per cent in 2004-05. The highest increased Indian carriers market share percentage of International passenger is recorded as 38.3 percentage in the year 2013-14. It is inferred that irrespective market share percentage of International passenger carried by scheduled Indian carriers and foreign carriers over the period.
| Name of the Airline | Share (%) |
|---|---|
| Jet Airways | 14.1 |
| Air India | 11.4 |
| Emirates Airlines | 10.8 |
| Air India Express | 5.3 |
| Etihad Airlines | 4.7 |
| Qatar Airways | 4.0 |
| Air Arabia | 3.6 |
| Indigo | 3.3 |
| Oman Air | 3.0 |
| Saudia | 2.9 |
| Thai Airways | 2.7 |
| Srilankan Airways | 2.6 |
| Spice jet | 2.5 |
| Singapore Airlines | 2.4 |
| Lufthansa | 2.3 |
Note: Source: GOI, (2016): "Hand Book on Civil Aviation Statistics", DGCA, Government of India, New Delhi.
Table 5 explain the market share per cent of top 15 scheduled operators and international operators in India in 2015-16. The total number of scheduled international operators are 86, out of the total 86 scheduled international operators, 6 operators accounted for 50 per cent of international passenger traffic. Jet Airways had the maximum market share, which is recorded as 14.1 per cent in the year 2015-16. It is followed by Air India (11.4) per cent, Emirates Airline (10.8) per cent, Air India Express (5.3) per cent, Etihad Airways (4.7) per cent and Qatar Airways (4) per cent in the year 2015-16. It is inferred that irrespective of airlines market share per cent of top 15 scheduled operators and international operators in India in the corresponding year.
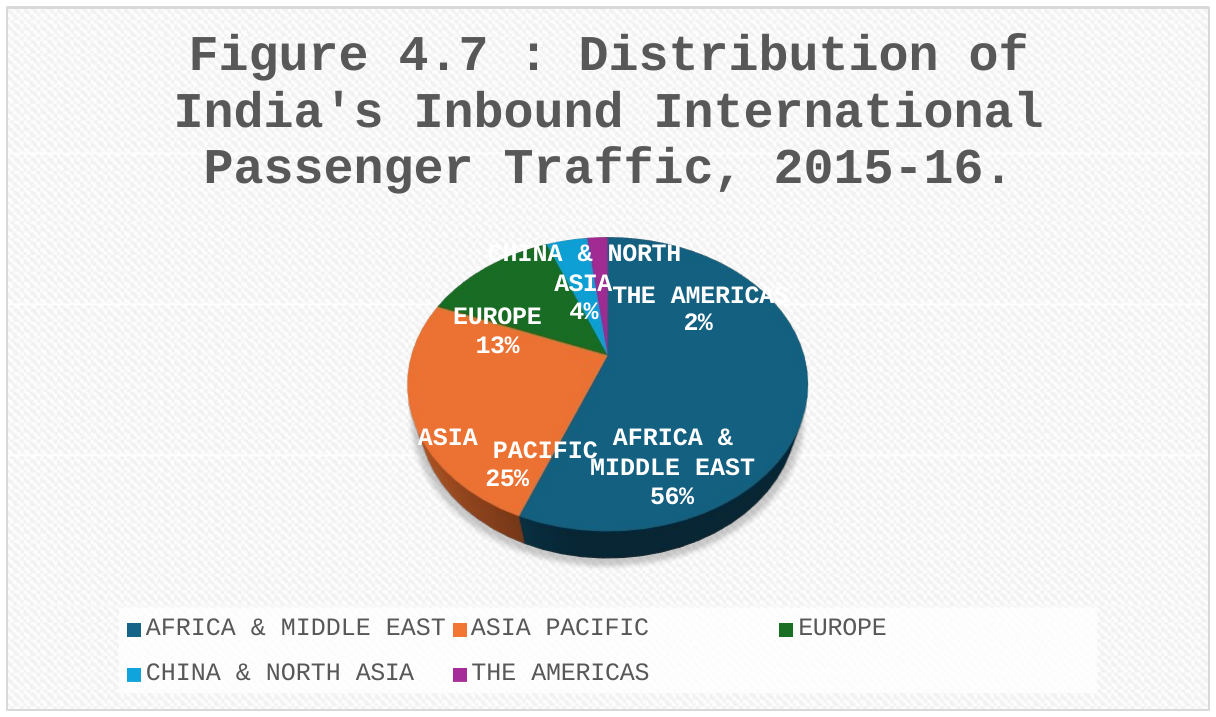
Figure 10 explain the inbound international passenger traffic distribution in India in 2015-16. Africa & Middle East is the highest inbound international passenger traffic distribution in India, which is recorded as 55.9 per cent in the year 2015-16. The Americas is the lowest inbound international passenger traffic distribution in India which is recorded as .2 per cent in the year 2015-16. It is inferred that irrespective of airlines inbound international passenger traffic distribution in India in the corresponding year. 15 scheduled operators and international operators in India in the corresponding year.
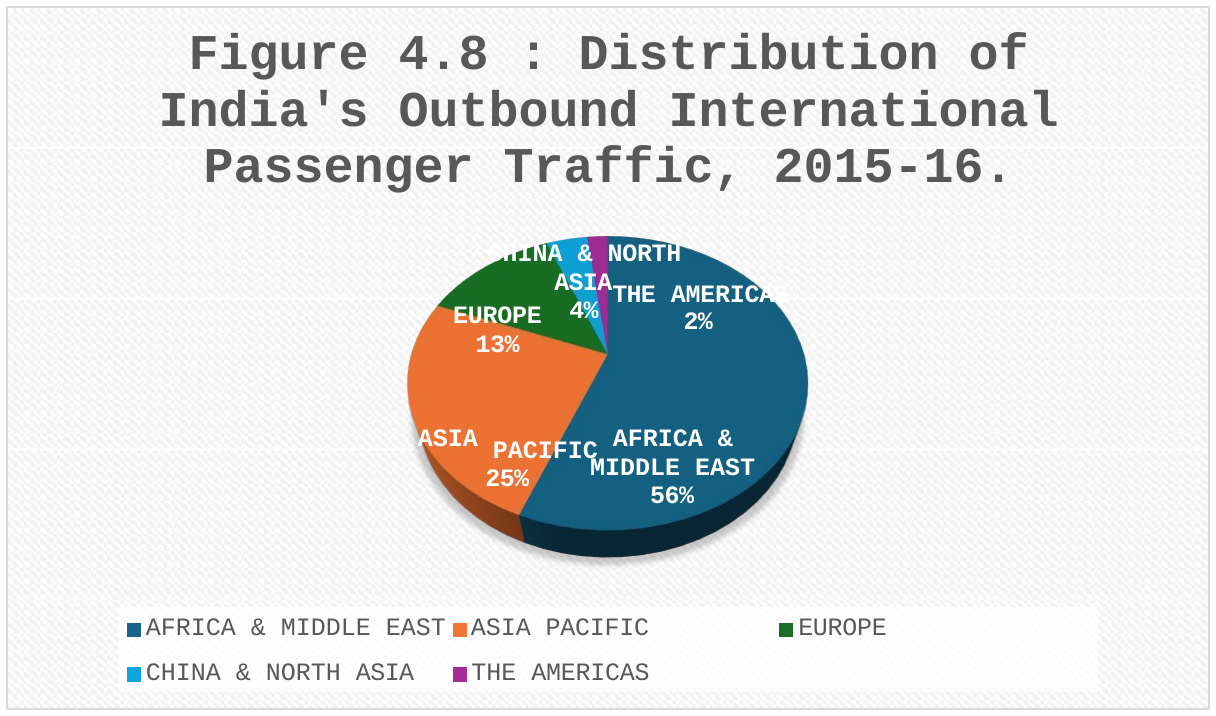
Figure 11 explain the outbound international passenger traffic distribution in India in 2015-16. Africa & Middle East is the highest outbound international passenger traffic distribution in India, which is recorded as 56.1 per cent in the year 2015-16. The Americas is the lowest outbound international passenger traffic distribution in India, which is recorded as 2.3 per cent in the year 2015-16. It is inferred that irrespective of airlines inbound international passenger traffic distribution in India in the corresponding year.
4.6Freight traffic
| Freight Traffic | 2015-16 | 2014-15 |
|---|---|---|
| Domestic | 6.24 Lakh MT (5.41) | 5.91 Lakh MT (16.54) |
| International | 14.04 Lakh MT (2.63) | 13.68 Lakh MT (8.57) |
Note: Figures in parenthesis refer to percentage change over previous year; MT: Metric Tonnes Source: GOI, (2016): "Hand Book on Civil Aviation Statistics", DGCA, Government of India, New Delhi.
Table 6 explains freight traffic in India. Domestic freight has increased to 6.24 lakhs metric tonnes in 2015-16 from 5.91 lakhs metric tonnes in 2014-15. Similarly, the international freight has increased to 14.04 lakhs metric tonnes from 13.68 lakhs metric tonnes in the corresponding year. It is inferred that irrespective of airlines (domestic and international) the freight traffic has been significantly increased over the period.
| Year | Domestic | International |
|---|---|---|
| 2006-07 | 322 | 927 |
| 2007-08 | 368 | 1025 |
| 2008-09 | 342 | 1072 |
| 2009-10 | 394 | 1139 |
| 2010-11 | 465 | 1292 |
| 2011-12 | 453 | 1219 |
| 2012-13 | 452 | 1238 |
| 2013-14 | 508 | 1262 |
| 2014-15 | 591 | 1368 |
| 2015-16 | 624 | 1404 |
Note: Figures in parenthesis refer to percentage change over previous year; MT: Metric Tonnes Source: GOI, (2016): "Hand Book on Civil Aviation Statistics", DGCA, Government of India, New Delhi.
Table 7 explains freight traffic in India. The domestic freight traffic in India increased to 624 metric tonnes in 2015-16 from 322 metric tonnes in 2006-07. Which registered 93.78 percent growth rate in the corresponding year. The highest domestic freight traffic rate is recorded as 465 metric tonnes in 2010-11. Similarly, the International freight traffic in India increased to 1404 metric tonnes in 2015-16 from 927 metric tonnes in 2006-07. Which registered 51.45 per cent growth rate in the corresponding year. The highest International freight traffic is recorded as 1292 metric tonnes in 2011-10. It is inferred that irrespective of airlines (domestic and International) the freight traffic has been significantly increased in the corresponding year.
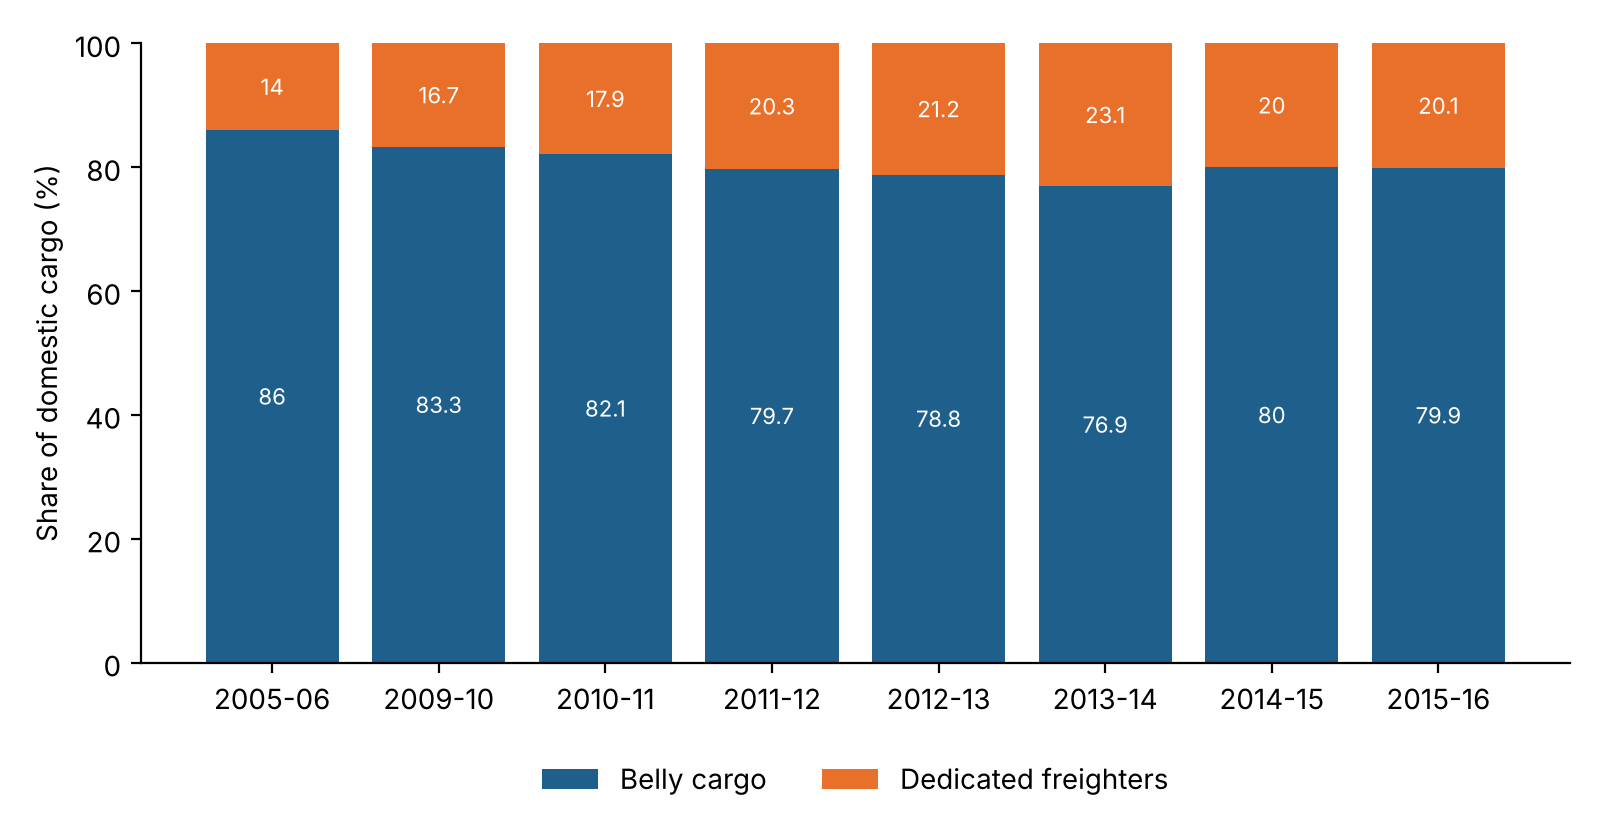
Figure 12 explain proportion of domestic cargo carried as belly cargo and in dedicated freighters in India. The highest dedicated cargo freighter is recorded as 20.3 per cent in the proportion of domestic cargo freighters in the year 2011-12. The proportion of domestic cargo carried as belly cargo has decreased to 79.9 per cent in 2015-16 from 86 per cent in 2005-06. The highest belly cargo freighter is recorded as 86 per cent in the proportion of domestic carried cargo freighters in the year 2005-2006. It is inferred that irrespective of proportion of domestic cargo carried as belly cargo and in dedicated freighters in over the period.
| Year | Indian Carriers (%) | Foreign (%) |
|---|---|---|
| 2004-05 | 13.6 | 86.4 |
| 2009-10 | 16.1 | 83.9 |
| 2010-11 | 20.3 | 79.7 |
| 2011-12 | 21.1 | 78.9 |
| 2012-13 | 17.7 | 82.3 |
| 2013-14 | 18.3 | 81.7 |
| 2014-15 | 17.8 | 82.2 |
| 2015-16 | 16.8 | 83.2 |
Note: Source: GOI, (2016): "Hand Book on Civil Aviation Statistics", DGCA, Government of India, New Delhi.
Table 8 explain proportion of International Cargo movement in India and Foreign carriers. The Indian carriers in the proportion of International cargo movement increased to 16.8 percent in 2015-16 from 13.6 percent in 2004-05. The highest increased Indian carriers in the proportion of International cargo movement is recorded as 21.1 percent in the year 2011-12. The foreign carriers in the proportion of International cargo movement decreased to 83.2 percent in 2015-16 from 86.4 percent in 2004-05. The highest increased foreign carriers in the proportion of International cargo movement is recorded as 83-9 percent in the year 2009-10. It is inferred that irrespective proportion of International cargo carried by Indian and foreign carriers over the period.
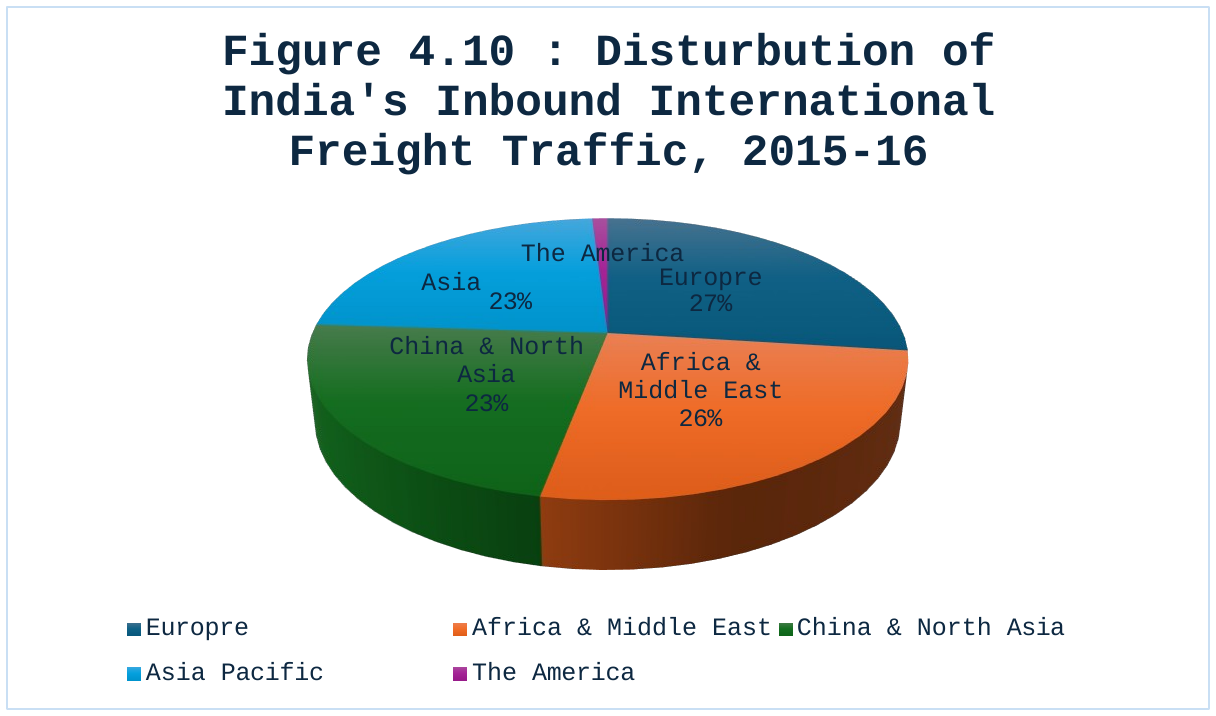
Figure 13 explain the inbound international freight traffic distribution in India in 2015-16. Europe is the highest inbound international freight traffic distribution in India, which is recorded as 27 per cent in the year 2015-16. The Americas is the lowest inbound international freight traffic distribution in India, which is recorded as 1.5 per cent in the year 2015-16. It is inferred that irrespective of airlines inbound international freight traffic distribution in India in the corresponding year.
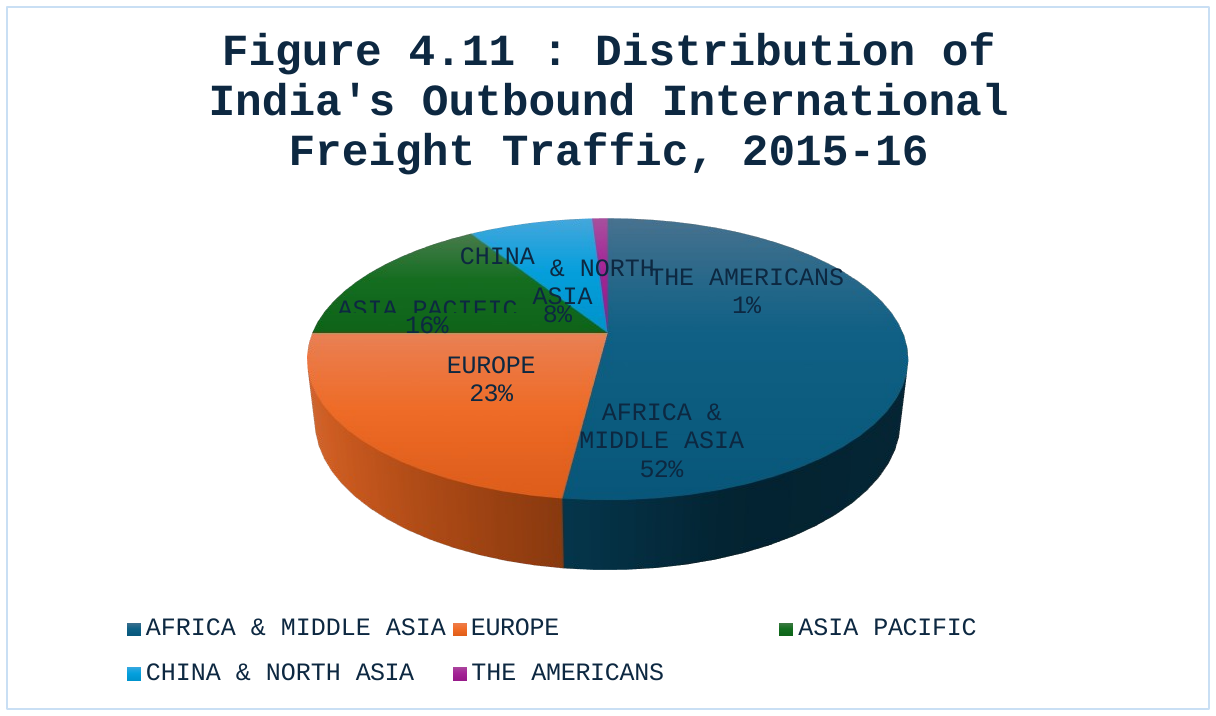
Figure 14 explain the outbound international freight traffic distribution in India. Africa & middle Asia is the highest outbound international freight traffic distribution in India, which is recorded as 51.9 per cent in the year 2015-16. The Americas is the lowest outbound international freight traffic distribution in India, which is recorded as 1 per cent in the yea 2015-16. It is inferred that irrespective of outbound international freight traffic distribution in India in the corresponding year.
4.7Aircraft
| Scheduled Air Movements (In Lakhs) | 2015-16 | 2014-15 |
|---|---|---|
| Domestic | 7.00 (13.45) | 6.17 |
| International | 3.22 (10.65) | 2.91 |
Note: Figures in parenthesis refer to percentage change over previous year. Source: GOI, (2016): "Hand Book on Civil Aviation Statistics", DGCA, Government of India, New Delhi.
Table 9 explains aircraft movements in India. Domestic aircraft has increased to 7 lakhs in 2015-16 from 6.17 lakhs in 2014-2015. Similarly, the international aircraft has increased to 3.22 lakhs in 2015-16 from 2.91 lakhs in 2014-15. It is inferred that irrespective of airlines (domestic and International) the aircrafts movements in India have been significantly increased.
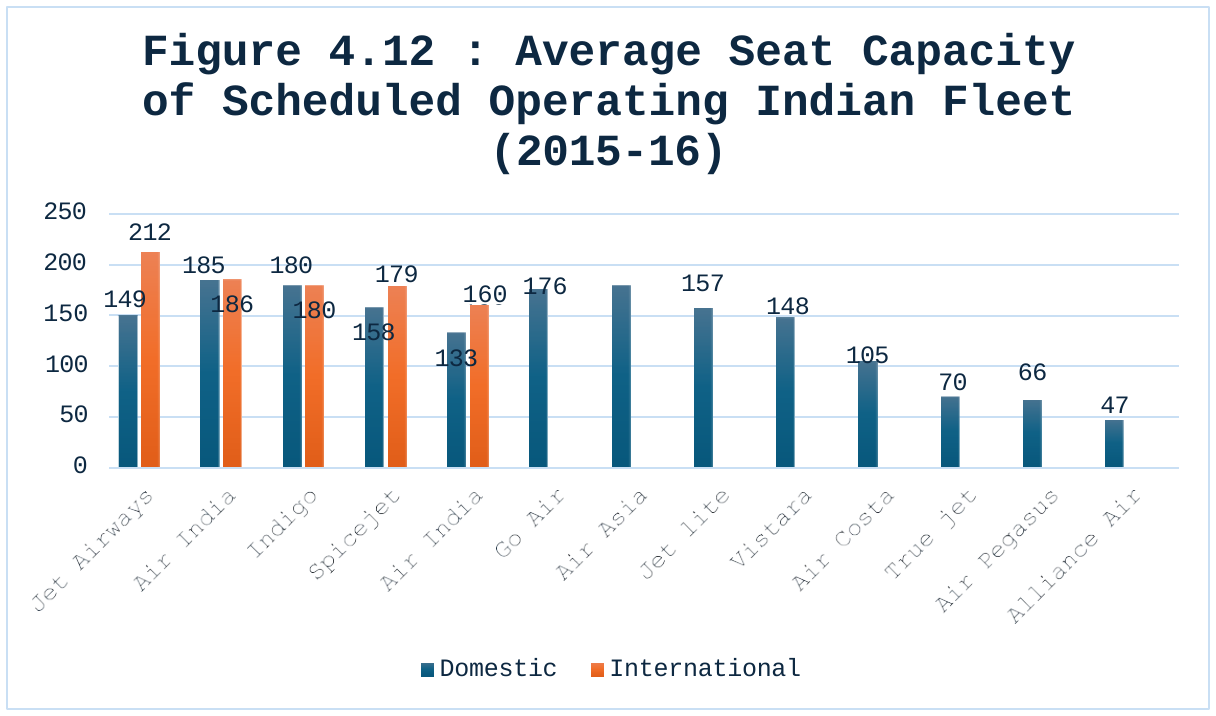
Figure 15 explain average seat capacity of scheduled operating Indian fleet in 2015-16. The highest domestic average seat capacity of scheduled operating Indian fleet is Air India Express and that average seat capacity is 185. The lowest domestic average seat capacity of scheduled operating Indian fleet is Alliance air and that average seat capacity is 47. Similarly, the highest International average seat capacity of scheduled operating Indian fleet is Jet Airways and that average seat capacity is 212. There are only four fleets in international average seat capacity of scheduled operating Indian fleet. It is inferred that irrespective of fleets (domestic and international) freight average seat capacity of scheduled operating Indian Fleet in the corresponding year.
| Name of the Operator | Type of Aircraft | Number of Aircrafts | Seat capacity |
|---|---|---|---|
| Air India | Boeing 747-400 | 5 | 423 |
| Air India | 777-200LR | 3 | 238 |
| Air India | 777-300ER | 12 | 342 |
| Air India | B787 | 19 | 256 |
| Air India | A-319 | 22 | 122/144 |
| Air India | A-320 | 20 | 150/168/180 |
| Air India | Boeing 737-800 | 20 | 182 |
| Air India | Total (All types) | 101 | - |
| Air India Express | Boeing 737-800 | 17 | 186 |
| Alliance Air | ATR-42 -320 | 4 | 48 |
| Alliance Air | CRJ-700 | 4 | 70 |
| Alliance Air | ATR-72 -212 A | 2 | 70 |
| Alliance Air | Total (All types) | 10 | - |
| Indigo | A320-200 | 94 | 180 |
| Spice jet | Boeing 737-800 | 18 | 186 |
| Spice jet | Boeing 737-900 ER | 1 | 212 |
| Spice jet | Q-400 | 15 | 78 |
| Spice jet | Total (All types) | 34 | - |
| Go Air | A320 Leased | 19 | 180 |
| Jet liner | Boeing 737-700 | 13 | 134 |
| Jet liner | Boeing 737-800 | 5 | 168 |
| Jet liner | Boeing 737-900 ER | 1 | 202 |
| Jet liner | Total (All types) | 9 | - |
| Blue Dart | Boeing 757-200 | 5 | Freighter |
| Jet Airways | B-737-700 | 3 | 134 |
| Jet Airways | B-737-800 | 59 | 168 |
| Jet Airways | B-737-900 | 5 | 184 |
| Jet Airways | ATR 72 – 500/600 | 18 | 68 |
| Jet Airways | A 330 – 200/300 | 12 | 293 |
| Jet Airways | B-777 -300 ER | 10 | 346 |
| Jet Airways | Total (All types) | 107 | - |
| Embraer and ERJ 170-100 LR (VT-LSR) | 1 | 67 | |
| Embraer and ERJ 170-100 LR (VT-LNR) | 1 | 67 | |
| Embraer and ERJ 190-100 STD (VT- LBR) | 1 | 112 | |
| Embraer and ERJ 190-100 STD (VT- LVR) | 1 | 112 | |
| Total (All types) | 4 | - | |
| Vasteras | Airbus A320 | 6 | 148 |
| Air Asia | Airbus A320 | 3 | 180 |
| Total all airlines (all types) | 409 | – |
Note: Source: GOI, (2016): "Hand Book on Civil Aviation Statistics", DGCA, Government of India, New Delhi.
Table 10 explains the fleet statistics of scheduled operators in India as on 31st March, 2015. In air India operator A-319 aircraft have 22 aircrafts and that se at capacity is recorded as 122/144, but Boeing 747-400 aircraft have 5 aircrafts, which is recorded as the highest number of 423 seat capacity in the fleet statistics of scheduled operators in India as on 31st march, 2015. In air India express operator Boeing 737-800 aircraft have 17 aircrafts; which is recorded as 186 seat capacity its reflects the same nature in Indigo operator in one more aircrafts with same seat capacity. It is followed by Indigo operator A320-200 aircraft have 94 aircrafts, which is recorded as the highest. Number of aircrafts with 180 seat capacities, Spice Jet operator Boeing 737-800 aircraft has 18 aircrafts with 186 seat capacity and Boeing 737-900ER aircraft have 1 aircraft with212 seat capacity. It is inferred that irrespective of fleet statistics of scheduled operators in India over the period.
4.7.1Stage length
| Name of the Airline | Domestic Operation | International Operation |
|---|---|---|
| Air India | 1117.4 | 6200.2 |
| Indigo | 947.5 | 2219.8 |
| Air India Express | 919.4 | 2374.6 |
| Jet Airways | 748.7 | 2946.9 |
| Spice jet | 739.6 | 1714.0 |
| Air Asia | 1093.2 | – |
| Vistara | 1022.6 | No operation |
| Go Air | 949.9 | No operation |
| Jetliner | 790.1 | No operation |
| Air Costa | 751.6 | No operation |
| Alliance Air | 677.8 | No operation |
| True jet | 437.6 | No operation |
| Air Pegasus | 416.5 | No operation |
Note: Average Stage Length is calculated by dividing the total aircraft km flown by the total number of aircraft departure. Source: GOI, (2016): "Hand Book on Civil Aviation Statistics", DGCA, Government of India, New Delhi.
Table 11 explains the average stage length by scheduled fleet in India in 2015-16. Air India airline is the highest kilo meters of domestic operator in India, which is recorded as 1117.4 kilo meters. It is followed by Air Asia 1093.2 km, Vasteras 1022.6 km and Indigo 947.5 km in the year 2015-16. Similarly, Air India airline is the highest kilo meters of international operator in India, which is recorded as 6200.2 kilo meters. It is followed by Jet airways 2946.9 km, Air India express 2374.6 km Indigo 2219.8 km and Spice Jet 1714 km in the year 2015-16. There is no operation in the international operation of following airlines in India. They are, Air Asia, Vasteras, Go air, Jetliner, Air Costa, Alliance air, Turret, and Air Pegasus. It is inferred that irrespective of airlines average stage length by scheduled fleet in India in the corresponding year.
| Operation Type | Air craft | Helicopter | Balloon | Hang Glider | Glider | Motor Glider | Ultra - Light | Experimental | Total |
|---|---|---|---|---|---|---|---|---|---|
| Scheduled | 468 | 0 | 0 | 0 | 0 | 0 | 0 | 0 | 468 |
| Non-Scheduled | 186 | 213 | 7 | 0 | 0 | 0 | 0 | 0 | 406 |
| Government | 125 | 37 | 0 | 5 | 41 | 0 | 0 | 1 | 209 |
| Private | 164 | 52 | 14 | 15 | 6 | 0 | 6 | 0 | 257 |
| Training | 285 | 1 | 0 | 1 | 16 | 1 | 6 | 1 | 311 |
| Miscellaneous | 6 | 0 | 0 | 3 | 0 | 0 | 28 | 4 | 41 |
| Grand Total | 1234 | 303 | 21 | 24 | 63 | 1 | 40 | 6 | 1692 |
Note: Source: Directorate of Air Worthiness, DGCA.
Table 12 explains the summary of air objects registered with DGCA in India as on 8th April, 2016. The scheduled operator aircraft is registered as 468 in the summary of air objects registered with DGCA in India as on 8th April, 2016. The non-scheduled operator aircraft is registered as 186, Helicopter is registered as 213 and the balloon is registered as 7 in the summary of air objects registered with DGCA in India as on 8th April, 2016. The government operator aircraft is registered as 125, helicopter is registered as 37, hang glider is registered as 5 and the glider is registered as 41 in the summary of air objects registered with DGCA in India as on 8th April, 2016. The private operator aircraft is registered as 164, helicopter is registered as 52, balloon is registered as 14, hang glider is registered as 15, glider is registered as 6 and the ultra-light is registered as 6 in the summary of air objects registered with DGCA in India as on 8th April, 2016. The training operator aircraft is registered as 286, helicopter is registered as 1, hang glider is registered as 1, glider is registered as 16, motor glider is registered as 1, ultra-light is registered as 6 and the experimental is registered as 1 in the summary of air objects registered with DGCA in India as on 8th April 2016. The miscellaneous operator aircraft is registered as 6, hang glider is registered as 3, ultra-light is registered as 28 and the experimental is registered as 4 in the summary of air objects registered with DGCA in India as on 8th April, 2016. It is inferred that irrespective of the summary of air objects registered with DGCA in India over the period.
4.8Non-scheduled operators
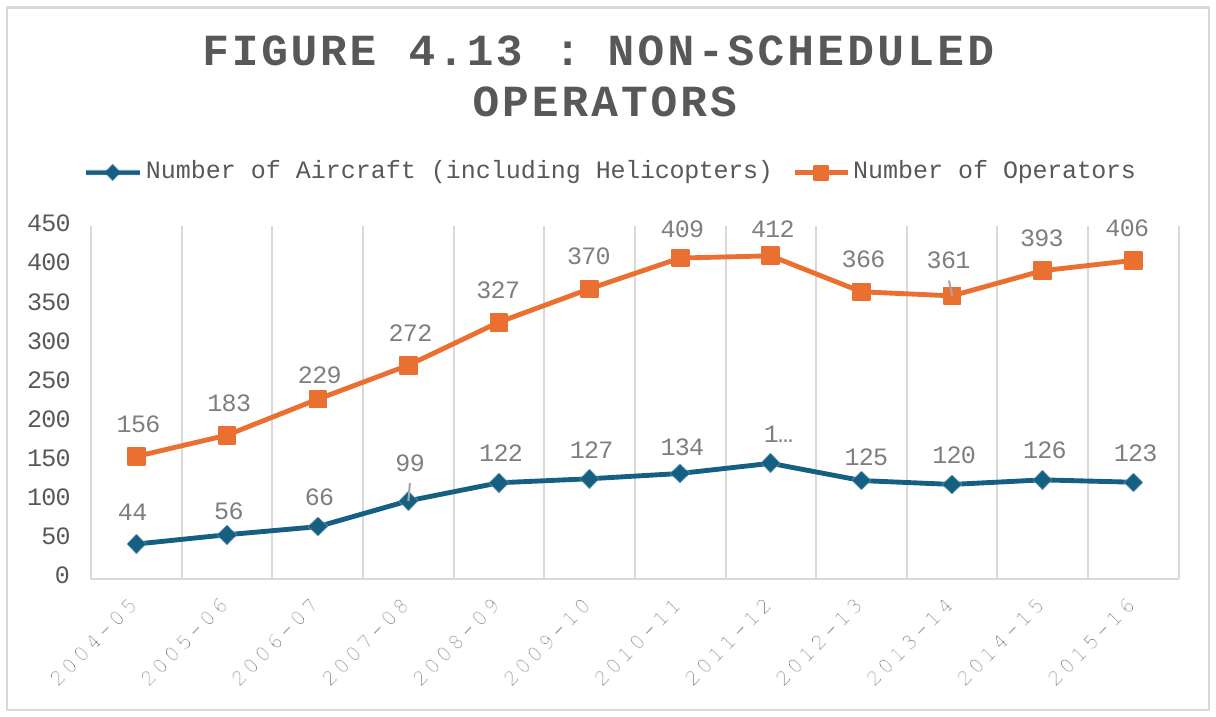
Figure 16 explain non-scheduled operators in India. The number of aircrafts including has increased to 406 in 2015-16 from 156 in 2004-05. The highest number of aircrafts is recorded as 412 in 2011-12. Similarly, the number of operators has increased to 123 in 2015-16 from 44 in 2004-05. The highest number of operators is recorded as 147 in 2011-12. It is inferred that irrespective of aircrafts and operators have been significantly increased over the period.
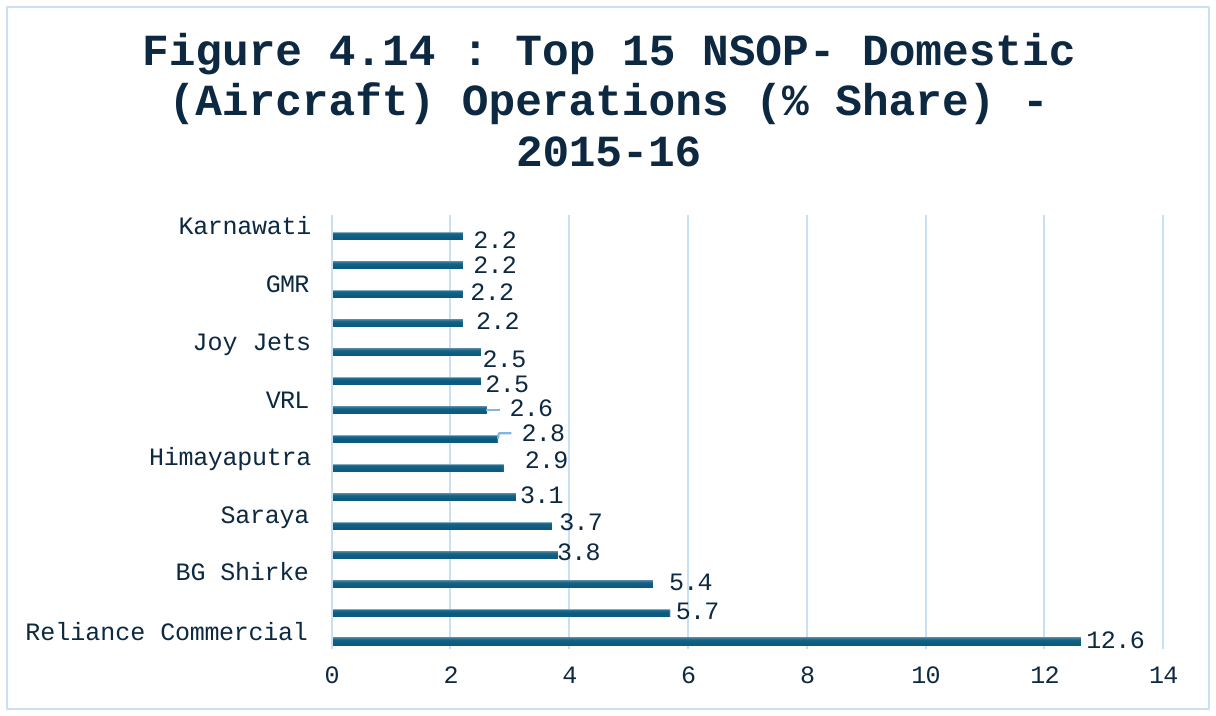
Figure 17 explain top 15 NSOP- domestic (aircraft) operation per cent share in 2015-16 in India. The Reliance Commercial is the highest per cent share of top 15 NSOP- domestic aircrafts operation. Which is recorded as 12.6 per cent share of top 15 NSOP- domestic aircrafts operation in 2015-16. It is followed by A R Airways and B G Shrike is 5.7 and 5.4 in the level per cent share of top 15 NSOP-domestic aircrafts operations. The most equal and lowest per cent share of top 15 NSOP- domestic aircrafts operations are Aimed, GMR, Trans Bharat, Karnawati and their values are 2.2 in the level per cent share of top 15 NSOP- domestic aircrafts operation in 2015-16. It is inferred that irrespective of top 15 NSOP- domestic operation per cent share in the corresponding year.
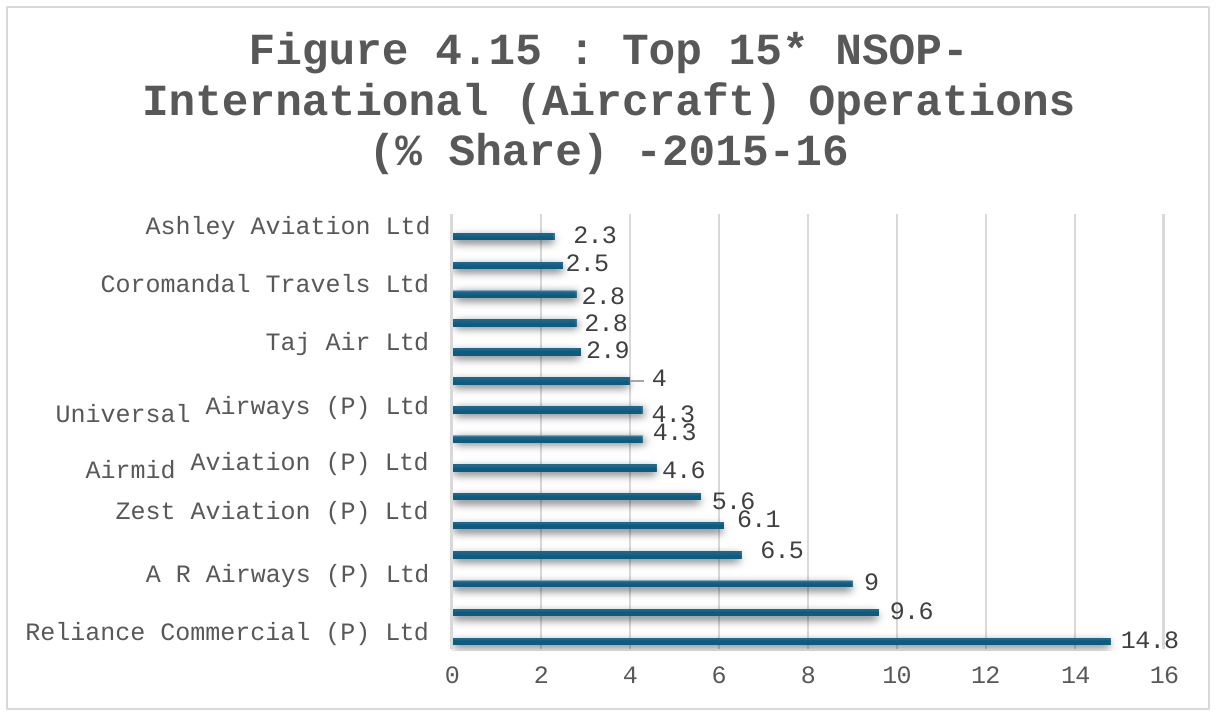
Figure 18 explain the top 15 NSOP-International aircraft operations per cent share in 2015-16 in India. The total number of non-scheduled International aircrafts operators is 32. Only the 15 is the top most NSOF International aircrafts operations per cent share NSOP International aircraft operation is Reliance Commercial Pvt Ltd. Which is recorded as 96 per cent share NSOP International aircraft operation in 2015-16. The lowest per cent share NSOP International aircraft operation is Ashley Aviation Ltd. Which recorded as 2.3 per cent share NSOP International aircraft operation 2015-16. It is inferred that irrespective of NSOP International aircrafts operations per cent share in the corresponding year.
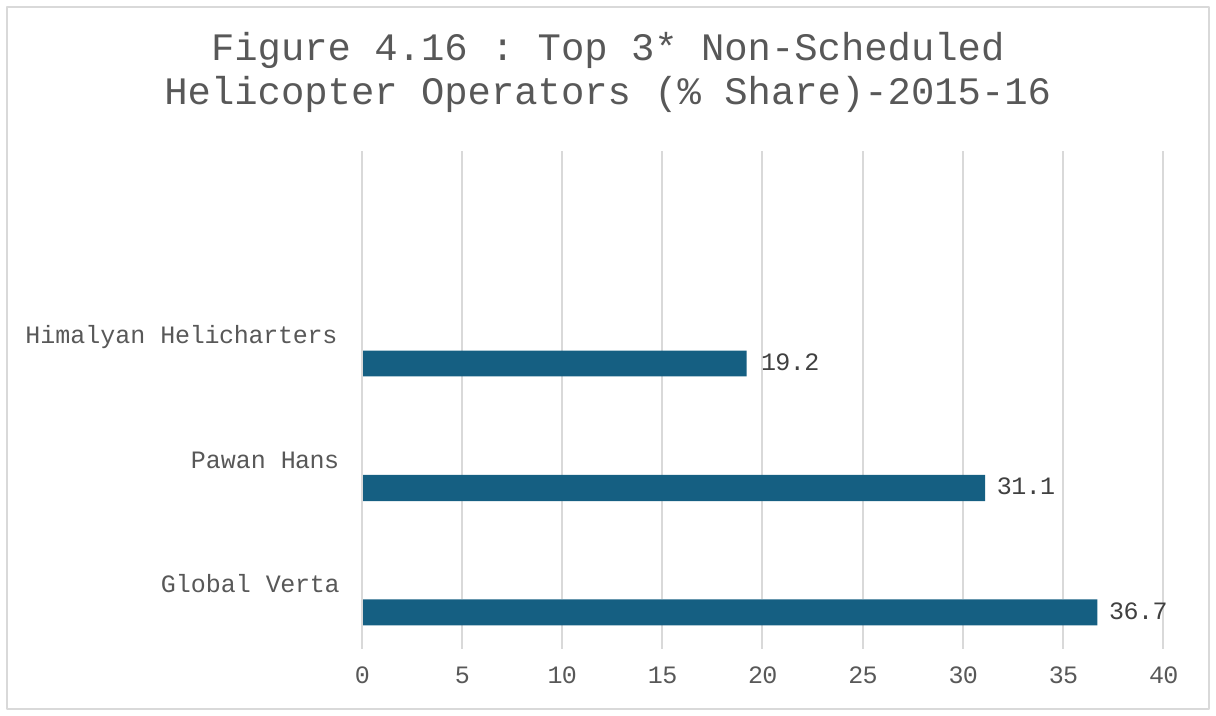
Figure 19 explain top 3 non-scheduled helicopter operation per cent share in 2015-16 in India. The total number of non-scheduled helicopter operation is 54. Out of the 54 non-scheduled helicopter operators only 3 operators are the top most operators in non-scheduled helicopter operator. Global Vectra is the highest per cent share of top 3 non-scheduled helicopter operators, which is recorded as 36.7 per cent share in the year 2015-16. It is followed by Pawan Hans is the level in the nearer highest per cent level non-scheduled helicopter operator, which is recorded as 31.1 per cent in the year 2015-16. It is inferred that irrespective of top 3 non-scheduled helicopter operators in India over the period.
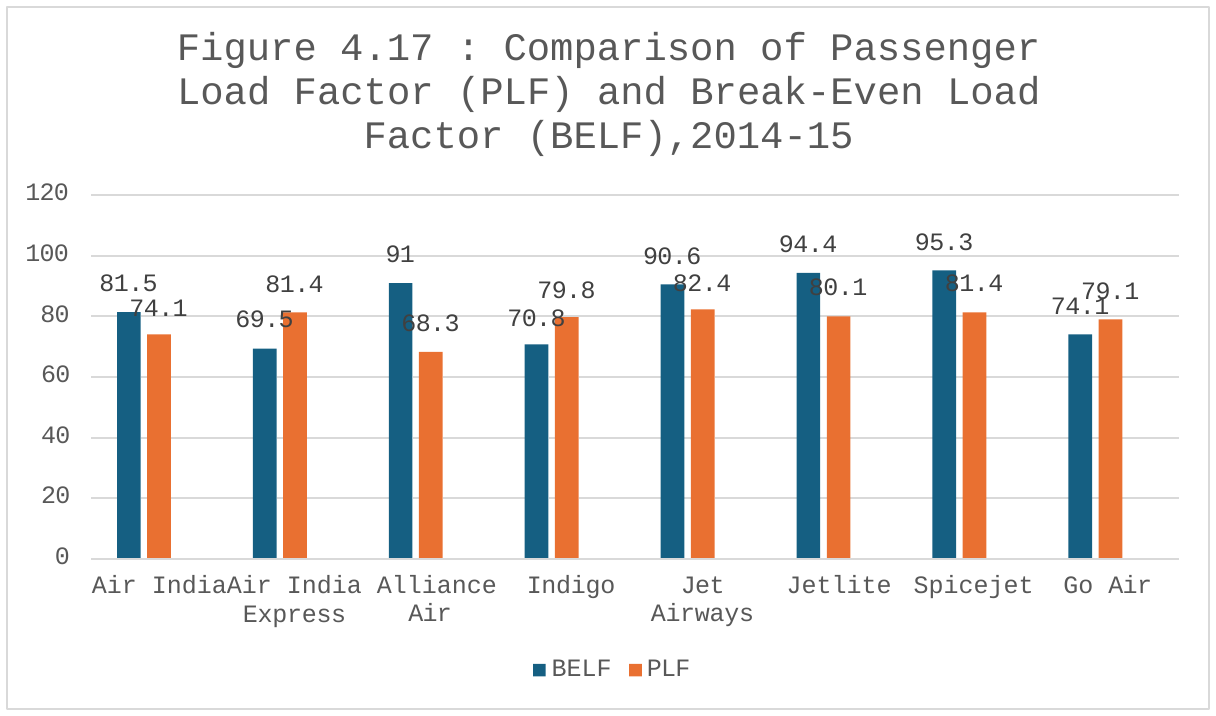
Figure 20 explain the Passenger Load Factor(PLF) and Break-Even Load Factor(BELF) in India in 2014-15. The highest BELF is recorded as 95.3 per cent in Spice jet in the year 2014-15. The highest PLF is recorded as 82.4 per cent in Jet Airways in the year 2014-15; it implies that an airline is successful in selling available seats. However, higher PLF may not result in higher operating profit. When PLF is less than BELF the airline in question is running losses. Which are recorded as BELF>PLF that's Air India, Alliance Air, Jet Airways, Jetliner, Spice jet. Evidently, in the year 2014-15, only Air India Express, Indigo and Go Air were operating at a PLF higher than BELF. It is inferred that irrespective of airlines comparison of PLF and BELF in the corresponding year.
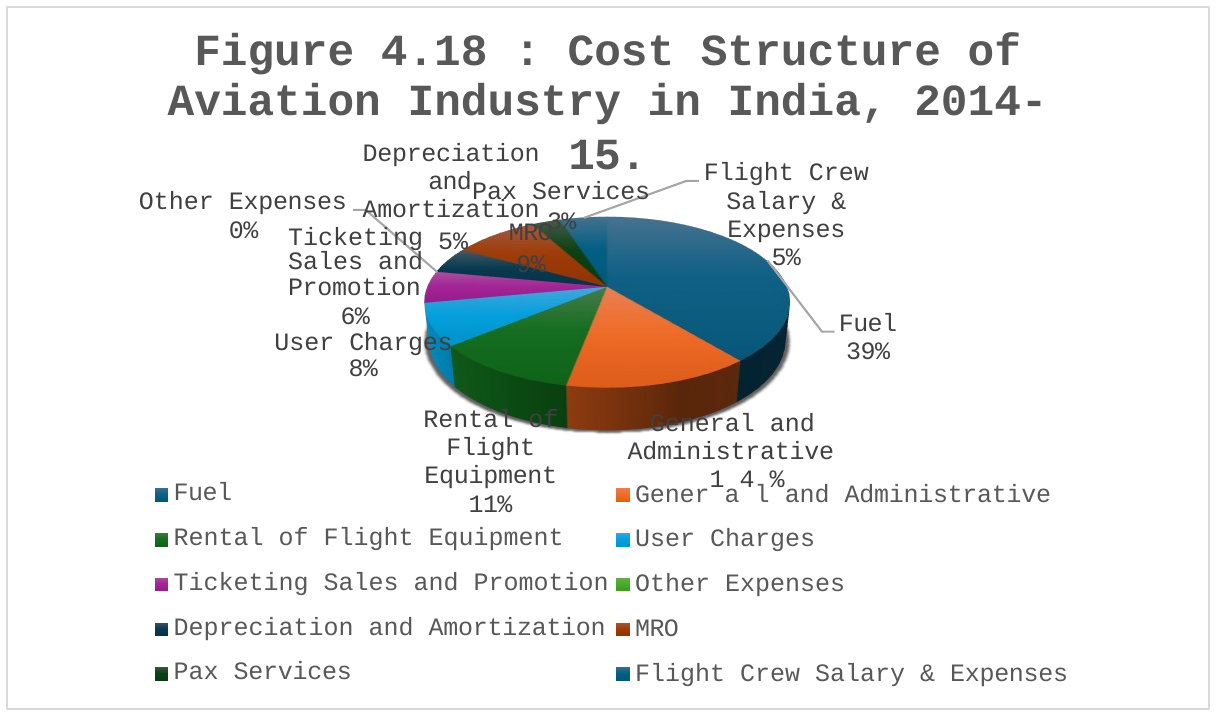
Figure 21 explain the cost structure of aviation industry in India 2015-16. Fuel is the highest cost of aviation industry in India, which is recorded as 38.5 per cent in the year 2015-16. Other expenses are the lowest cost of aviation industry in India in 2014-15. It is inferred that irrespective of airlines cost structure of aviation industry in India in the corresponding year.
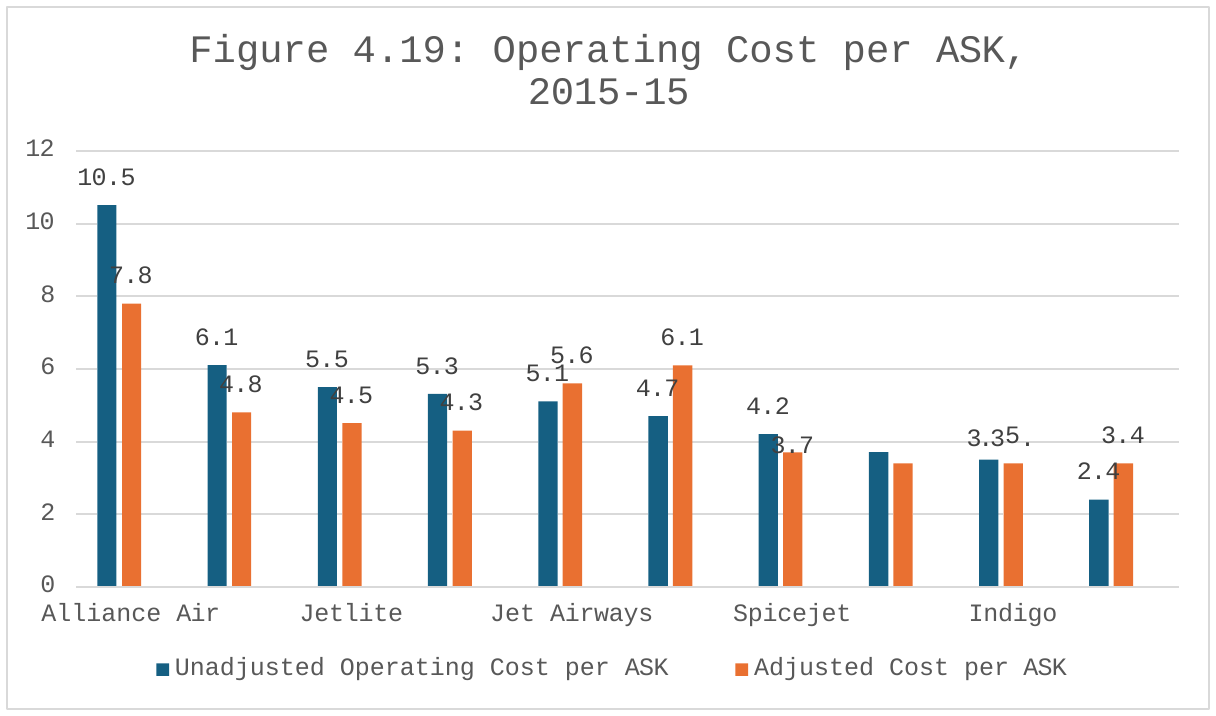
Figure 22 explain operating cost per ASK in India. The highest unadjusted operating cost per ASK is recorded as Rs.10.5 in Alliance Air in the year 2014 and Rs.6.1 in Alliance Air in the year 2015. Similarly, the highest adjusted operating cost per ASK is recorded as Rs.7.8 in Alliance Air in the year 2014 and Rs.6.1 in Jet Airways in the year 2015. It is inferred that irrespective of airlines in the operating cost per ASK In the corresponding year.
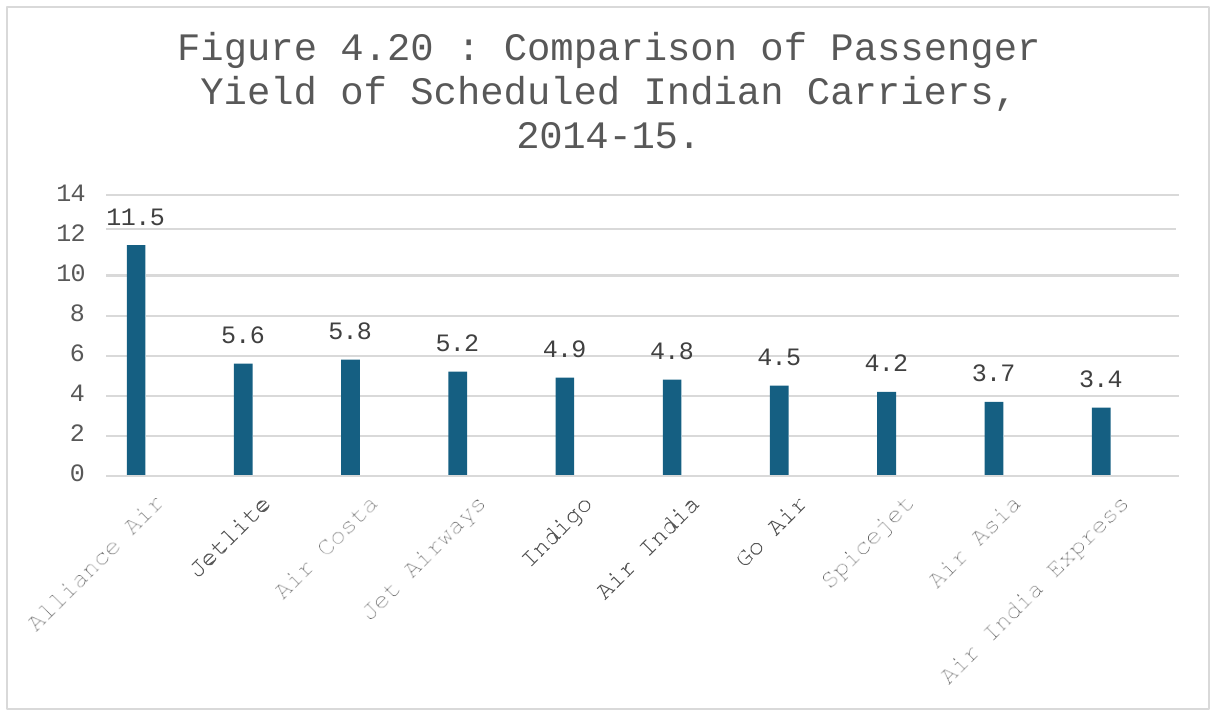
Figure 23 explain the comparison of passenger yield of scheduled Indian carriers in 2014-15. The highest comparison of passenger yield of scheduled Indian carrier is Alliance Air, which is recorded as 11.5 in the year 2014-15. The lowest comparison of passenger yield of scheduled carrier is Air India Express, which is recorded as 3.4 in the year 2014-15. It is inferred that irrespective of the comparison of passenger yield of scheduled Indian carriers in the corresponding year.
| Operating Revenue | Operating Expenses | Operating Result | |
|---|---|---|---|
| Scheduled National Carriers | |||
| Air India | 2,06,131.60 | 2,26,854.40 | -20,722.80 |
| Air India Express | 22,948.20 | 19,597.60 | 3,350.60 |
| Alliance Air | 2,279.50 | 3,034.00 | -754.50 |
| Sub Total (A) | 2,31,359.30 | 2,49,486.00 | -18,126.70 |
| Scheduled Domestic Private Carriers | |||
| Jet Airways | 1,95,605.05 | 2,15,030.10 | -19,424.04 |
| Jet Lite (P) Ltd | 14,229.36 | 16,755.22 | -2,545.86 |
| Go Air | 30,664.24 | 28,715.82 | 1,948.43 |
| Spice Jet | 52,015.25 | 60,884.99 | -8,869.74 |
| Indigo | 1,39,253.36 | 1,23,578.64 | 15,674.72 |
| Air Costa | 3,268.62 | 4,571.57 | -1,302.96 |
| Air Asia | 1,551.87 | 2,885.01 | -1,333.14 |
| Vistara | 691.28 | 2,681.94 | -1,990.66 |
| Sub Total (B) | 4,37,280.03 | 4,55,123.29 | -17,843.26 |
| Grand total (A+B) | 6,68,639.33 | 7,04,609.29 | -35,969.96 |
Note: Source: GOI, (2016): "Hand Book on Civil Aviation Statistics", DGCA, Government of India, New Delhi.
Table 13 explains the financial summary of all scheduled carriers in India in 2014-15. In the scheduled national carriers Air India is the highest operating revenue and expenses registered, which is recorded as 2,06, 131.60 million in operating revenue and 2,26,854.40 million in operating expenses and their operating result is recorded as -20,722.80 million in the financial summary of all scheduled Indian carriers in 2014-15. In the scheduled domestic private carriers Jet airways is the highest operating revenue and expenses registered, which is recorded as 1,95,606.05 million in operating revenue and 2,15,030.10 million in operating expenses and their operating result is recorded as -19,424.04 million in the financial summary of all scheduled Indian carriers in 2014-15. It is followed by Indigo, which is recorded as 1,39,253.36 million in operating revenue and 1,23,578.64 million in operating expenses and their operating result is recorded as 15,674.72. It is the fair operating result in the financial summary of all scheduled Indian carriers in 2014-15. It is inferred that irrespective of airlines financial summary of all scheduled Indian carriers in the corresponding year.
4.9Human resource
| Name of the Airline | Pilots & Co-Pilots | Other Flight Crew | Cabin Crew | Maintenance & overhaul personnel | Ticketing & Sales Personnel | All Other Personnel | Total |
|---|---|---|---|---|---|---|---|
| Air India | 1457 | - | 2321 | 5931 | 4221 | 7383 | 21313 |
| Air India Express | 59 | 37 | 402 | 40 | - | 167 | 705 |
| Jet Airways | 1488 | 318 | 2974 | 2116 | 967 | 5615 | 13478 |
| Jet lite | 164 | 1 | 243 | 322 | - | 79 | 809 |
| Indigo | 1320 | 140 | 2520 | 739 | 69 | 5748 | 10536 |
| Spice jet | 403 | 60 | 718 | 569 | 116 | 2326 | 4192 |
| Go Air | 216 | 71 | 418 | 339 | 397 | 739 | 2180 |
| Air Costa | 47 | 27 | 76 | 105 | 159 | 332 | 746 |
| Air Asia | 63 | 138 | 138 | 169 | - | 178 | 686 |
| Vistara | 62 | 5 | 205 | 17 | 35 | 348 | 672 |
| Total | 5515 | 797 | 10744 | 10480 | 5964 | 23060 | 56560 |
Note: Source: GOI, (2016): "Hand Book on Civil Aviation Statistics", DGCA, Government of India, New Delhi.
Table 14 explains personnel statistics scheduled Indian operators for the 2014-15 in India. The total airline staff is 56560, out of the total airline staff of 56560, (21213) or 37.7 per cent is employed by Air India Ltd followed by Jet Airways (13478) or 23.8 per cent and Indigo(10536) or 18.6 per cent and Spice jet (4192) or 7.4 per cent in the year 2014-15. It is inferred that irrespective of personnel statistics of scheduled Indian operators for the year in the corresponding year.
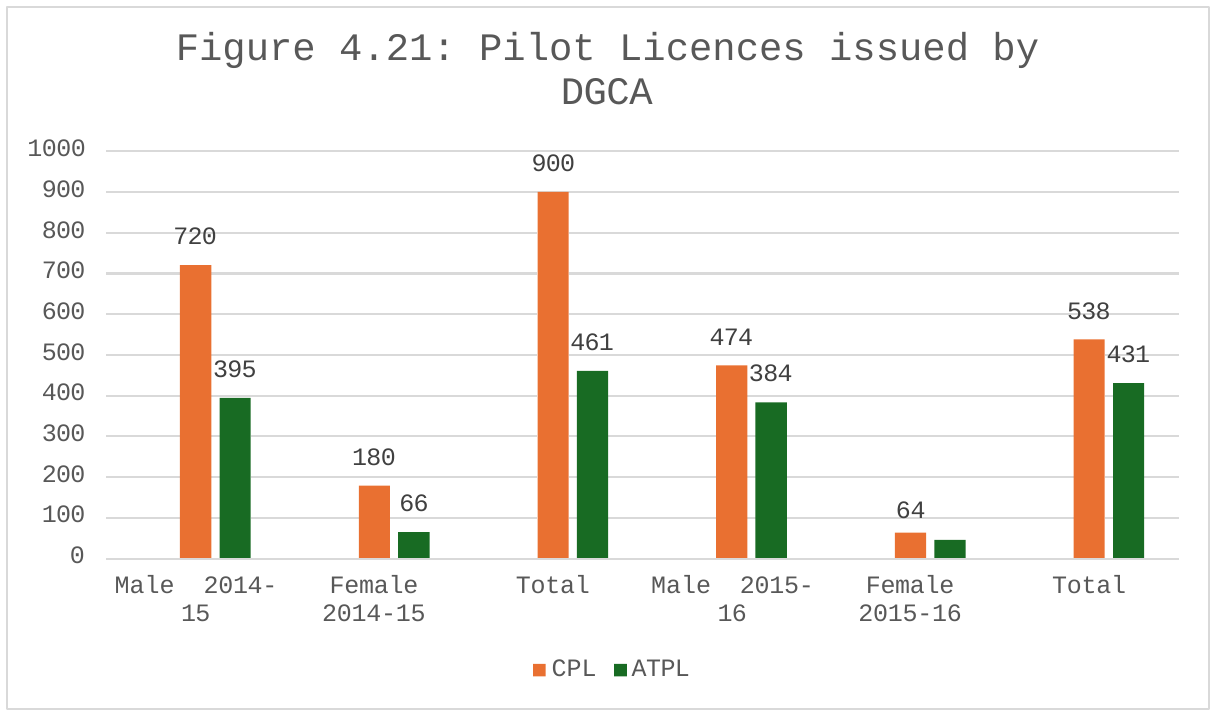
Figure 24 explain pilot's licenses by DGCA in India. The commercial pilot licenses for both male, female has decreased to 538 licenses in 2015-16 from 828 licenses in 2014-15. Similarly, the air transport pilot licenses for both male and female has decreased 431 licenses in 2015-16 from 461 licenses in 2014-15. It is inferred that irrespective of pilot licenses (commercial and air transport) in India has been significantly decreased over the period.
4.9.1ASK per employee
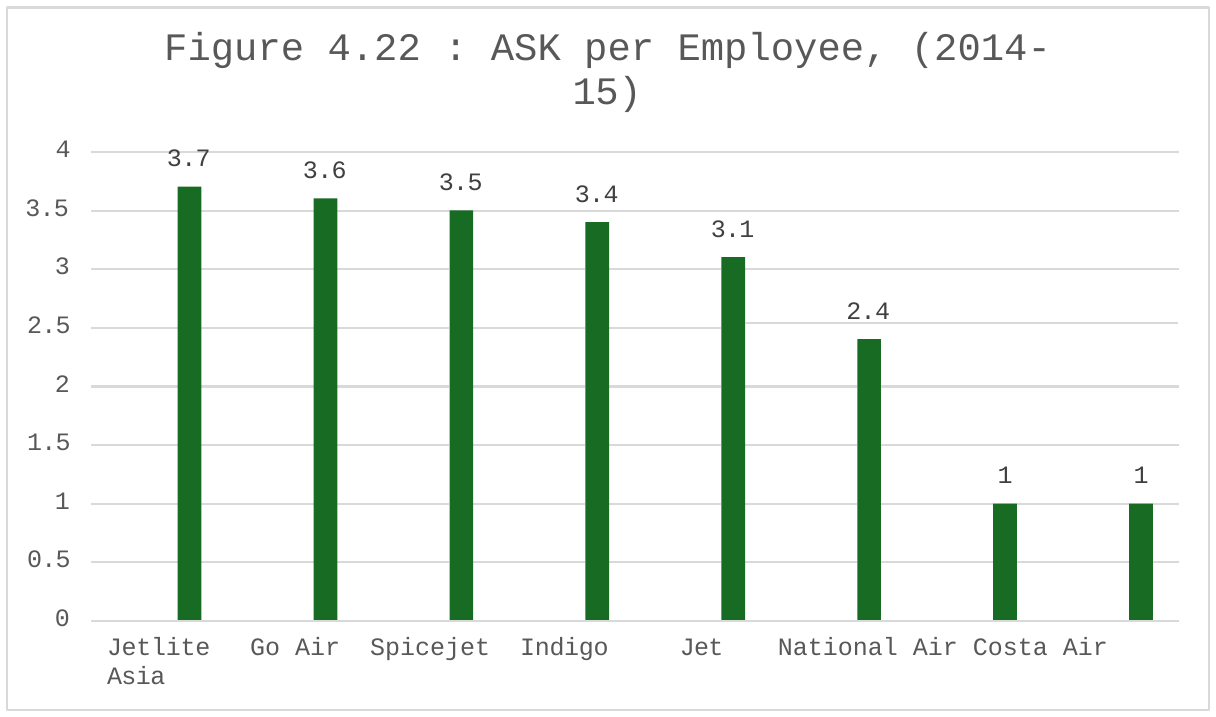
Figure 25 explains ASK per employee in the airline movement in India in the year 2014-15. Jet lite is the most efficient level in the ASK per employee, which is recorded as 3.7 million in the year 2014-15. It is followed by Go Air and Spice jet are the level in the ASK per employees are 3.6 million and 3.5 million in the year 2014-15. Air Costa and Air Asia are the equal and lowest level in the ASK per employee, which is recorded as 1 million in the year 2014-15. It is inferred that irrespective of airlines ASK per employee movements in India in the corresponding year.
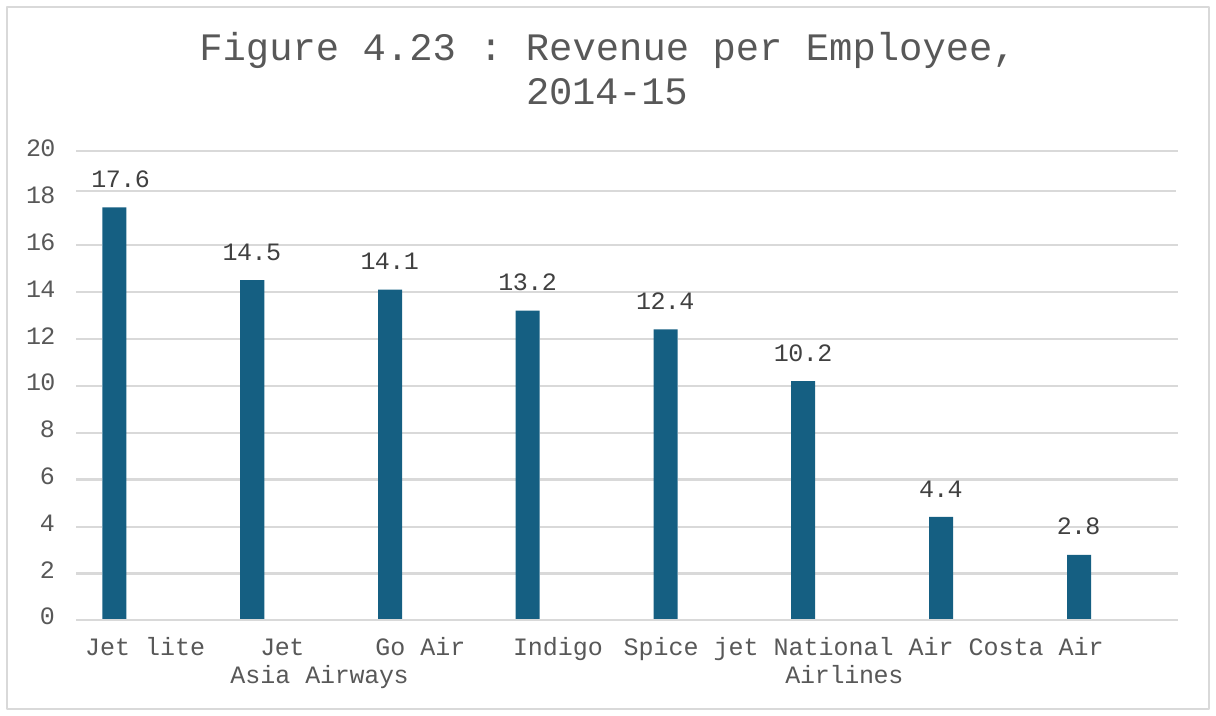
Figure 26 explain Revenue per employee in the airlines movements in India in the year 2014-15. Jet lite is the highest productivity of employee level in the revenue per employee, which is recorded as 17.6 million in the year 2014-15. It is followed by Jet Airways and Go Air is the level of employee productivity in the revenue per employee, which is recorded as 14.5 million and 14.1 million in the year 2014-15. Air Asia is the lowest productivity employee level in the revenue per employee, which is recorded as 2.8 million in the year 2014-15. It is inferred that irrespective of airlines employees' productivity revenue per employee in the corresponding year.
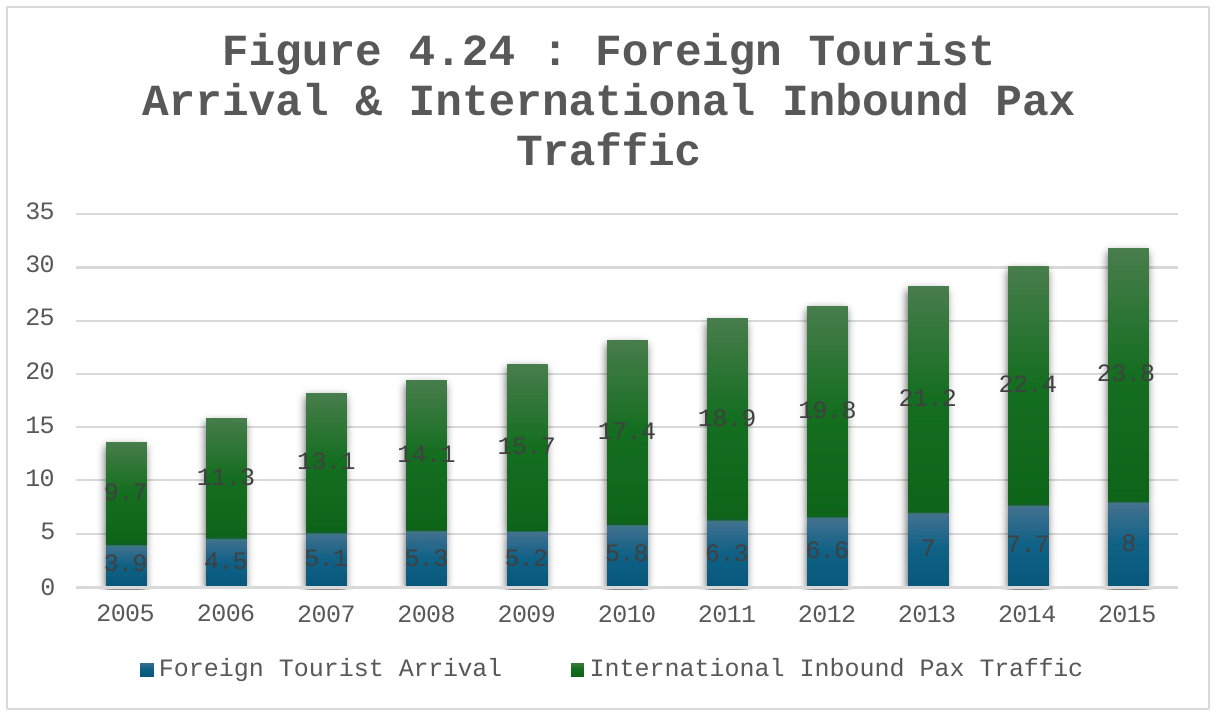
Figure 27 explain foreign tourist arrival and International inbound PAX traffic movement in India. The foreign tourist arrival has increased to 8 million in 2015 from 3.9 million in 2005. The inbound international PAX has increased to 23.8 million in 2015 from 9.7 million in 2005. It is inferred that irrespective of airlines (domestic and international) PAX traffic movement in India has been significantly increase over the period.
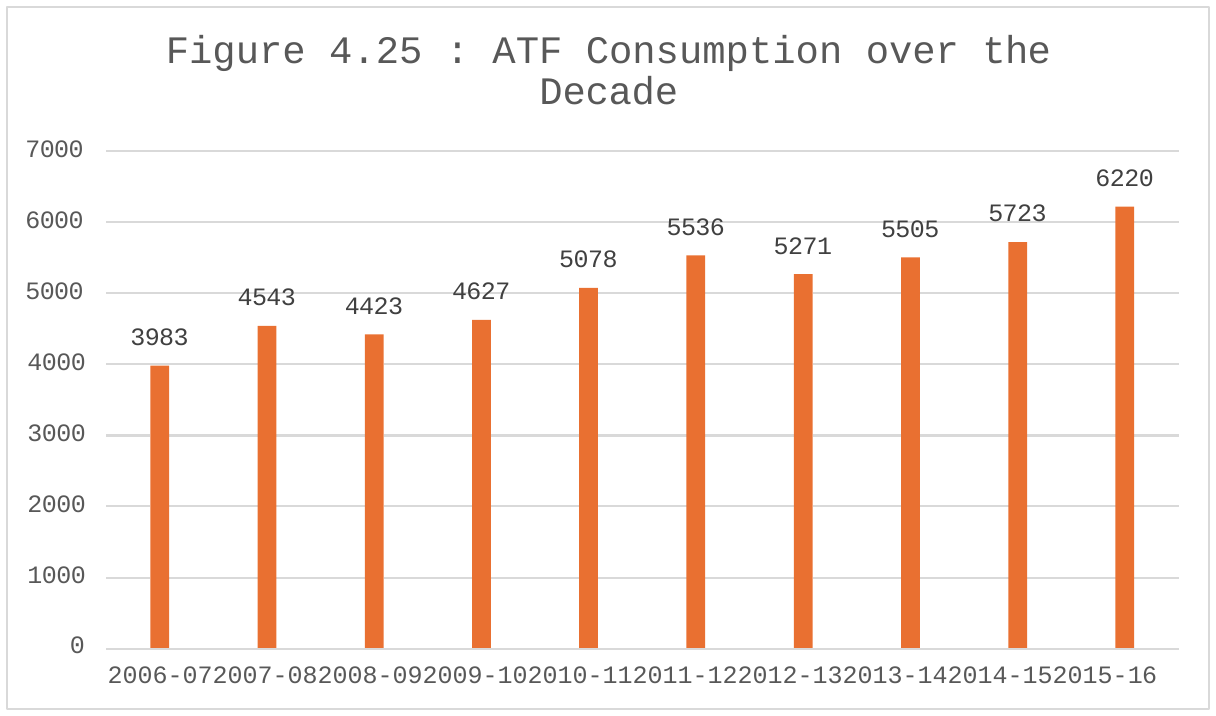
Figure 28 explain ATF consumption over the decade in India. The ATF consumption has increased to 6220 thousand metric tonnes in 2015-16 from 3983 thousand metric tonnes in 2006-07. The highest ATF consumption is recorded as 5536 in 2011-12. The ATF consumption growth in India has been moving it random with the growth of air traffic. In the year 015-16, ATF consumption went up which is consistent with increase in aircraft and air traffic movement in the decade. It is inferred that irrespective of airlines ATF consumption over the corresponding year.
| Total International Airports | 24 |
|---|---|
| A A I Airports | 18 |
| Civil Enclave | 3 |
| Private Airports (JVs) | 3 |
| Total Customs Airports | 8 |
| A A I Airports | 4 |
| Civil Enclave | 4 |
| Total Domestic Airports | 101 |
| A A I Operational Airports | 47 |
| A A I Operational Civil Enclave | 18 |
| A A I Non – Operational | 31 |
| State/Private/Government | 5 |
| Total Airports (All Types) | 133 |
Note: Source: Airport Authority of India.
Table 15 explain airports in India as on 31st march, 2016. The total number of all types of airports are registered as 133 in India as on 31st march, 2016. Out of the total number of all types of airports, the total number of international airports are registered as 24 which are AAI airports are 18, Civil enclave are 3 and the Private airports (JVs) are 3 in the airports in India as on 31st march, 2016. The total number of custom airports are registered as 8, which are AAl airports are 4, civil enclave are 4 in the airports in India as on 31st march, 2016. The total domestic airports are registered as 101, which are AAI operational airports are 47, AAI Operational Civil Enclave are 18, AAI Non-Operational are 31 and the State/Private Government are 5 in the airports in India as on 31st march, 2016. It is inferred that irrespective of airlines in the airports in India over the period.
5Summary and conclusions
This section provides the summary, findings, suggestions and conclusions of the study.
5.1Summary
India as it is inter-linked with other sector in the economy and generates income and employment through global commerce and tourism for a study says an efficient civil aviation sector is important. The National Council of Applied Economic Research (NCAER) undertook the study on the economic impact of Emirates Airlines operations on the Indian economy. According to the study, Emirates contributed $596 million to the Indian economy by way of $274 million in the air transport sector, $76 million in the petroleum and chemicals sector, $62 million in the manufacturing sector, $39 million in the trade, banking and insurance sector and $145 million in other sectors of the economy. Air transport is the fastest mode of transport which has reduced distances and has reduced distances and has led to drastic shrinking of the world. This mode of transport is indispensable when speed and time are the main constraints. One can easily cross and reach remote, inaccessible and hostile areas like lofty mountains, thick forests, marshy areas and sandy deserts by air transport which is almost impossible by other modes of transport.
The study covered fully the air transport movements in India and their important aspects, Air transportation in India made a humble beginning in 1911 when air mail operation commenced over a little distance of 10 km between Allahabad and Naini. Indian National Airways was formed in 1933 ad it introduced air service between Karachi and Lahore. By the end of the World War II, major cities like Karachi, Mumbai, Delhi, Kolkata, Lahore and some other places were provided with air services.
At the time of participation of the country in 1947, there were four companies namely Tata Sons Ltd. Air India, Indian National Airways, Air Services of India and Deccan Airways. By 1951, four more companies viz. Bharat Airways, Himalayan Aviation Ltd., Airways India and the Kalinga Airlines also came up. In 1953, the air transport was nationalised and two corporation were formed: Air India International and the Indian Airlines.
The face of Indian aviation is changing and poised for vibrant growth, India can definitely boast of a boom in air travel. Economic liberalisation has totally changed the outlook of a perspective air passenger.
Air India is responsible for international air services. It operates from international airports Delhi, Mumbai, Kolkata, Chennai, Thiruvananthapuram, Bangalore, Hyderabad, Panaji, Kochi, Amritsar, Guwahati and Ahmedabad. It connects India with almost all the continents of world through its services.
Indian Airlines handles domestic traffic and carries passengers, cargo and mail to different places in the country.
Vayudoot was set up in 1981 to augment the air transport in the country. It provided links with remote and inaccessible areas which were not covered by Indian Airlines.
Pawan Hans Limited was established in 1985. It provides helicopter services to the petroleum sector including ONGC, Oil India Ltd. And Enron Oil and Gas, Mumbai High and connects remote and inaccessible areas. The company has a strong presence in North-East having its helicopters delayed in the states of Arunachal Pradesh, Meghalaya, Sikkim and Tripura.
The private scheduled airlines, such as Jet Airways, Kingfisher, and Spicejet, Indigo, etc. Now operate not only within India, but also too many other countries of the world. These are the details discussed in this chapter.
5.2Findings
- The study was based on the data obtained from Emirates and sources from India's official statistics.
- The study found that Emirates operations had a role in the enhancing air transport and tourism as it connects non-hub airports to a significant number of points in India which would otherwise not be directly linked.
- India's Eleventh Five Year Plan identifies various deficits in transport sector which include aircraft handling capacity, parking space and terminal building at airports.
- The development of two dedicated freight corridors from Mumbai to Delhi and Ludhiana to Dankuni.
- Privatization and expansion of the Mumbai and New Delhi Airports and development of new international airports at Hyderabad and Bangalore.
- It is found that the high growth of 21.58 per cent in the total domestic passengers during 2015-16 is mainly due to the high growth in passengers carried by Alliance Air, Jet Airways, IndiGo and Air Asia.
- It is correlates very closely to movements in the global, regional and local economy.
- Further, it is also related to society and to the political environment, like economics.
- Growth in air traffic has historically been much greater than growth in the economy, yet there is a strong correlation between the two and the demand for air transport is - The study examining the multidimensional patterns of network characteristics for scheduled Indian airlines between 2006-2014 and discussed their evolutionary paths.
- The study used data is taken from OAG's Max Plus database, which has the ex post schedules of airlines, that is, the actual capacity offered by carriers.
- The study considers the roles of airline service variables such as service frequency, air craft size, ticket price, flight distance, and number of spokes in the network.
- The study focus of this case is on the domestic airline industry in India, and the collecting data for this case in the participation of IIM Bangalore.
- The study found that the indicate that Low Cost Airlines are able to deploy higher capacity growth and utilise the capacity during the last 10 year. The capacity growth and utilisation of capacity of Low Cost Airlines is higher than Full Service Airlines during the study period.
- The study found that the Full Service Airlines have been able to fight the Low Cost Airlines by (a) Competitive Pricing Policy (b) Better Service quality and Loyalty among business traveller.
- The study used data taken from Director General of Civil Aviation for the last 10 years available which is the compilation of the data received from Airlines operator for the domestic operation service.
- The study found that there is a homogenous set of flight products required by leisure passengers, travelling on both full service and low cost airlines, however there is a considerable dissimilarity overall between the requirements of passengers using full service airline a low cost carrier.
- The study found that considerable world aviation attention is now focused on India, as evidenced by the 150 air craft order by Indian carriers at the 2005 Paris air show, priced at US $13 Billions According to the centre for Asia Pacific Aviation (2005).
- The study found that has identified some issues and concerns and makes some suggestions that would further increase the level of private participation.
- The study also found that the government all over the world are finding it increasingly difficult to finance the investment required to sustain the growth of transport infrastructure.
- Further the study analyse critically the policies and developments in these sectors since the 1990's.
- The study used data and survey from and with the help of Ministry of Civil Aviation brought out a policy on airport infrastructure. The committee in the Ministry of Civil Aviation would examine the private sector proposals and submit them to the government.
- The study found that the issue of competition at two levels. Air transport and Airports. The two issue will be dealt with separately in the study.
- The study used Implications of this for competition policy and Law in India and outline issue for advocacy for India's competition commission. And the data was collected from Directorate General of Civil Aviation on passenger traffic. Route - wise, Flight - wise such data was available only for Indian Airlines.
- The ASCI Research and Consultancy found that the competition issues involved in the grant of concessions to the private sector for up gradation of airport infrastructures. Further this found that the issues such as in the process of grant of concession is compete in such things are there.
5.3Suggestions
- In 2010-11, 65 per cent of the expenditure were on relatively small airports whereas only 35 per cent of Emirates direct contribution went to three big airports-Mumbai, Delhi and Chennai (in terms of passenger share). This indicates Emirates role in developing economic activities at non-hub points.
- Enhancing safety is the number one priority for aviation. India's record on safety is good, but constant attention and efforts are needed.
- Cost efficient improvement of infrastructure is another priority of aviation. Airport and airspace capacity must be expanded to fully gain the benefits of a vibrant airline sector. Without massive change, infrastructure will not be able to handle growth. In the airport worst with pool service levels and insufficient capacity means a commercial centre needs an efficient airport. Delays due to bottlenecks in the air traffic control system are common. They are costly to airlines and inconvenient to passengers.
- Recently India imposed a 10.2 per cent service tax fee on landing. airport and air navigation fees. The need of this legality and challenging to reduce the competitiveness of India's air transport sector.
- Freedom to do business is the important priority of aviation. Government must let airlines run their business like real businesses. The need of basic commercial freedom to serve markets where they exist, to be able to access global capital markets, and to merge and consolidate where it makes commercial sense.
- Simplifying the business is the major priority of aviation. IATA launched simplifying the business in 2004 to prove passenger convenience and cut costs by using technology more effectively.
- The challenges that face India are enormous. Urgent decisions on infrastructure, liberalization, safety oversight and taxation are critical to move quickly. IATA has strengthened its presence in India to help both its members and the government at this time of great potential. The stakes are high, but the rewards for our efforts will be enormous.
- Governments, airlines and IATA working together will make a very positive contribution to this wonderful country.
5.4Conclusions
- It is found that the high growth of 21.58 per cent in the total domestic passengers during 2015-16 is mainly due to the high growth in passengers carried by Alliance Air, Jet Airways, IndiGo and Air Asia.
- The development of two Dedicated Freight Corridors from Mumbai to Delhi and Ludhiana to Dankuni.
- Privatization and expansion of the Mumbai and New Delhi Airports and development of new international airports at Hyderabad and Bangalore.
- It is inferred that irrespective of airlines (national and international) the passengers traffic movements in India.
- It is found that the passenger traffic movement over the past decade in India. The highest domestic passenger traffic rate is recorded as 60.8 million in the year 2011-12.
- It is inferred that airlines year on year growth in passenger and passenger load factor in India. Indigo is the highest year on year growth in passenger, which is recorded as 32.6 per cent in the year on year growth in passengers.
- It is observed that non-scheduled operators in India. The highest number of aircrafts is recorded as 412 in 2011-12.
- It is inferred that capacity v/s demand in domestic market movement in India. The highest RPK is recorded as 59084 million in 2011-12. And the highest ASK is recorded as 78639 million in 2011-12.
- It reveals that month-wise growth in capacity and demand in domestic market in India in the 2015-16. The highest YoY growth in ASK (capacity) of domestic market is recorded as 26.8 per cent in the Feb. 2016. Both RPK(demand) ASK (capacity) of YoY growth is from Apr 2015-March 2016.
- It is observed that the market share per cent in terms of domestic market demand in India in 2015-16. Indigo is the highest market share per cent in terms of domestic demand, which is recorded as 39.9 per cent in the year 2015-16.
- It is inferred that the passenger load factor of scheduled Indian carriers in 2015-16. The highest domestic PAX load factor of scheduled Indian carrier is Spice jet, which is recorded as 92 per cent.
- It is reveals that the market share percentage of International passenger in Indian carriers and foreign carriers. The highest increased foreign carriers market percentage of International passenger is recorded as 66.2 percentage in the year 2012-13. And the highest increased Indian carriers market share percentage of International passenger is recorded as 38.3 percentage in the year 2013-14.
- It is observed that the market share per cent of top 15 scheduled operators and international operators in India in 2015-16. Jet Airways had the maximum market share, which is recorded as 14.1 per cent in the year 2015-16.
- It is inferred that the inbound international passenger traffic distribution in India in 2015-16. Africa & Middle East is the highest inbound international passenger traffic distribution in India, which is recorded as 55.9 per cent in the year 2015-16.
- It is observed that the outbound international passenger traffic distribution in India in 2015-16. Africa & Middle East is the highest outbound international passenger traffic distribution in India, which is recorded as 56.1 per cent in the year 2015-16.
- It is reveals that explains freight traffic in India. The highest domestic freight traffic rate is recorded as 465 metric tonnes in 2010-11. And the highest International freight traffic is recorded as 1292 metric tonnes in 2011-10.
- It is inferred that the proportion of domestic cargo carried as belly cargo and in dedicated freighters in India. The highest dedicated cargo freighter is recorded as 20.3 per cent in the proportion of domestic cargo freighters in the year 2011-12. And the highest belly cargo freighter is recorded as 86 per cent in the proportion of domestic carried cargo freighters in the year 2005-2006.
- It is observed that the inbound international freight traffic distribution in India in 2015-16. Europe is the highest inbound international freight traffic distribution in India, which is recorded as 27 per cent in the year 2015-16.
- It is reveals that the outbound international freight traffic distribution in India. Africa & middle Asia is the highest outbound international freight traffic distribution in India, which is recorded as 51.9 per cent in the year 2015-16.
- It is inferred average seat capacity of scheduled operating Indian fleet in 2015-16. The highest domestic average seat capacity of scheduled operating Indian fleet is Air India Express and that average seat capacity is 185. And the highest International average seat capacity of scheduled operating Indian fleet is Jet Airways and that average seat capacity is 212.
- It is reveals that the fleet statistics of scheduled operators in India as on 31st March, 2015. In air India operator A-319 aircraft have 22 aircrafts and that seat capacity is recorded as 122/144, but Boeing 747-400 aircraft have 5 aircrafts, which is recorded as the highest number of 423 seat capacity in the fleet statistics of scheduled operators in India as on 31st march, 2015.
- It is observed that the average stage length by scheduled fleet in India in 2015-16. Air India airline is the highest kilo meters of domestic operator in India, which is recorded as 1117.4 kilo meters. Similarly, Air India airline is the highest kilo meters of international operator in India, which is recorded as 6200.2 kilo meters.
- It is inferred that the non-scheduled operators in India. The highest number of aircrafts is recorded as 412 in 2011-12. Similarly, the number of operators has increased to 123 in 2015-16 from 44 in 2004-05. And the highest number of operators is recorded as 147 in 2011-12.
- It is observed that the top 15 NSOP- domestic (aircraft) operation per cent share in 2015-16 in India. The Reliance Commercial is the highest per cent share of top 15 NSOP - domestic aircrafts operation. Which is recorded as12.6 per cent share of top 15 NSOP-domestic aircrafts operation in 2015-16.
- It is reveals that the top 15 NSOP-International aircraft operations per cent share in 2015-16 in India. Reliance Commercial Pvt Ltd is the one of the top 15 NSOP International aircrafts operations per cent share in India. Which is recorded as 96 per cent share NSOP International aircraft operation in 2015-16.
- It is inferred that the top 3 non-scheduled helicopter operation per cent share in 2015-16 in India. Global Vectra is the highest per cent share of top 3 non-scheduled helicopter operators, which is recorded as 36.7 per cent share in the year 2015-16.
- It is observed that the Passenger Load Factor(PLF) and Break-Even Load Factor(BELF) in India in 2014-15. The highest BELF is recorded as 95.3 per cent in Spice jet in the year 2014-15. The highest PLF is recorded as 82.4 per cent in Jet Airways in the year 2014-15; it implies that an airline is successful in selling available seats.
- It is inferred that the cost structure of aviation industry in India 2015-16. Fuel is the highest cost of aviation industry in India, which is recorded as 38.5 per cent in the year 2015-16.
- It is reveals that the cost per ASK in India. The highest unadjusted operating cost per ASK is recorded as Rs.10.5 in Alliance Air in the year 2014 and Rs.6.1 in Alliance Air in the year 2015. Similarly, the highest adjusted operating cost per ASK is recorded as Rs.7.8 in Alliance Air in the year 2014 and Rs.6.1 in Jet Airways in the year 2015.
- It is inferred that the comparison of passenger yield of scheduled Indian carriers in 2014-15. The highest comparison of passenger yield of scheduled Indian carrier is Alliance Air, which is recorded as 11.5 in the year 2014-15.
- It is observed that the ASK per employee in the airline movement in India in the year 2014-15. Jet lite is the most efficient level in the ASK per employee, which is recorded as 3.7 million in the year 2014-15.
- It is reveals that the Revenue per employee in the airlines movements in India in the year 2014-15. Jet lite is the highest productivity of employee level in the revenue per employee, which is recorded as 17.6 million in the year 2014-15.
- It is inferred that the ATF consumption over the decade in India. The ATF consumption has increased to 6220 thousand metric tonnes in 2015-16 from 3983 thousand metric tonnes in 2006-07. And the highest ATF consumption is recorded as 5536 in 2011-12.
- It is observed that the civil aviation passengers traffic has been increased to 269 million in 2016-17 from 144 million in 2012-13 in the twelfth five year plan in India.
References
- [1]Alderighi M, Cento A, Nijkamp P, Rietveld P (2004). The entry of low-cost airlines: Price competition in the European airline market. Tinbergen Institute Discussion Paper No. 04-074/3.
- [2]Alderighi M, Cento A, Nijkamp P, Rietveld P (2005). Network competition – the coexistence of hub-and-spoke and point-to-point systems. Journal of Air Transport Management, 11(5), 328–334.
- [3]Anfofum AA, Saheed ZS, Iluno C (2015). Air transportation development and economic growth in Nigeria. Journal of Economics and Sustainable Development, 6(2).
- [4]ASCI Research and Consultancy (2009). Competition issues in the air transport sector in India. ASCI Research and Consultancy.
- [5]Brueckner JK (2002). Airport congestion when carriers have market power. American Economic Review, 92(5), 1357–1375.
- [6]Brueckner JK (2008). Slot-based approaches to airport congestion management. Working paper.
- [7]Burghouwt G, Hakfoort J, Ritsema van Eck J (2003). The spatial configuration of airline networks in Europe. Journal of Air Transport Management, 9(5), 309–323.
- [8]Dhawan B (2015). Geography of transport and trade. Anmol Publications, pp. 1–159.
- [9]Gawali PM (2015). State transport in India: MSRTC. Himalaya Publishing House, pp. 1–10.
- [10]Gibbs C (2014). Top 100 ranking airports: Global mobile readiness index. Ted Rogers School of Management, Ryerson University.
- [11]Huber H (2015). Network structure, capacity growth and route hierarchies: The case of China’s air traffic system revisited. Working Paper 2015-04-03, Indian Institute of Management, Ahmedabad.
- [12]Huber H (2016). India’s air traffic system evolution and role of network structure. Economic and Political Weekly, 51(40).
- [13]Ito H (2013). Incumbent responses to lower cost entry: Evidence from the U.S. airline industry. Paper presented at the Southern Economic Association Meetings.
- [14]Jantachalobon N, Vanichkobchinda P (2013). A model of airport hub in Southeast Asia. Conference paper, I-SEEC 2013.
- [15]Jin F, Wang F, Liu Y (2004). Geographic patterns of air passenger transport in China 1980–1998: Imprints of economic growth, regional inequality, and network development. The Professional Geographer, 56(4), 471–487.
- [16]Martín JC, Voltes-Dorta A (2009). A note on how to measure hubbing practices in airline networks. Transportation Research Part E, 45(1), 250–254.
- [17]Mootein NP (2012). Open sky policy for developing countries with emphasis on the small island developing states. Global Journal of Human Social Science, 12(4).
- [18]Mukherjee A, Sachdeva R (2003). Maritime and air transport services: India’s approach to privatization. Transport and Communications Bulletin for Asia and the Pacific, 73.
- [19]Natarajan L (2007). Marketing. Margham Publications, pp. 77–96.
- [20]O’Connell JF, Williams G (2006). Transformation of India’s domestic airlines: A case study of Indian Airlines, Jet Airways, Air Sahara and Air Deccan. Journal of Air Transport Management, 12(6), 358–374.
- [21]Reynolds-Feighan A (2010). Characterisation of airline networks: A North American and European comparison. Journal of Air Transport Management, 16(3), 109–120.
- [22]Senguttuvan PS (2006). Fundamentals of air transport management. Excel Books, pp. 1–30.
- [23]Shaw SL, Lu F, Chen J, Zhou C (2009). China’s airline consolidation and its effects on domestic airline networks and competition. Journal of Transport Geography, 17(4), 293–305.
- [24]Thirunavukkarasu A, Nedunchezian VR (2015). An analysis on domestic airlines capacity performance in India. International Journal of Management, 6(12), 38–49.
- [25]Transportation Research Board (1999). Entry and competition in the U.S. airline industry: Issues and opportunities. Special Report 255. National Research Council.
- [26]Wei W, Hansen M (2006). An aggregate demand model for air passenger traffic in the hub-and-spoke network. Transportation Research Part A, 40(10), 841–851.
- [27]Windle R, Dresner M (1999). Competitive responses to low cost carrier entry. Transportation Research Part E, 35(1), 59–75.