Education
Stakeholder Engagement and Organizational Agility on Quality Service: Strategic Governance Program
Cebu Technological University–Main Campus, Cebu City, Cebu, Philippines
Published October 2026
Abstract
This study aims to assess the effect of organizational agility and Stakeholder engagement on the service quality in the Roble Shipping Co, at North Rec., Cebu City during Calendar Year 2026 towards Strategic Governance Program. Descriptive survey was used to gather data about varying subjects. There were 100 respondents in this research composing of ten (10) employees, fifty (50) Passengers and forty (40) shippers and were chosen in random. These client respondents avail the services of the company. Overall, the findings demonstrate a consistent pattern in which all dimensions of quality service delivery significantly affect all dimensions of quality service status. The major gap identified in this study lies in the difference between the company's acceptable customer perceptions and the moderate implementation of its service delivery practices. This finding suggests that existing operational systems may not yet be maximizing their potential to provide excellent customer experiences. In conclusion, the company should strengthen response management systems, establish clearer service standards, enhance schedule monitoring, improve customer communication channels, and provide continuous employee development programs focusing on customer relations and service efficiency. Based on the findings, the null hypothesis is rejected since all p-values (0.00%–0.17%) are lower than the 5.00% level of significance. Therefore, there is a significant relationship between the extent of quality service delivery and the status of quality service of the company. Based on the conclusions reached in the service quality in the Roble Shipping Co, at North Rec., Cebu City during Calendar Year 2026 is highly recommended that Strategic Governance Program be considered for implementation.
Keywords: stakeholder engagement; organizational agility; quality service; strategic governance program; descriptive-quantitative research; Cebu City, Philippines
1Introduction
1.1Rationale of the study
In the rapidly changing environment of public and service organizations, delivering quality service has become a critical measure of institutional effectiveness and public trust. The 21st-century organization is no longer judged solely by its internal processes, but by how it engages its stakeholders and adapts to evolving demands.
Stakeholder Engagement has emerged as a strategic imperative. According to Bryson (2018), organizations that actively involve stakeholders in decision-making gain legitimacy, resources, and social support. In the Philippine context, government agencies and private service institutions that practice transparent and inclusive engagement report higher levels of community trust and service satisfaction (De Leon, 2022). Thus, stakeholder engagement is no longer a peripheral activity but a core governance function.
Parallel to this, Organizational Agility has become essential for survival. Defined as the capacity of an organization to sense and respond to change quickly and effectively, agility enables institutions to innovate services, adopt digital tools, and maintain continuity during disruptions such as the pandemic time by Huang et al. (2023) found that agile organizations were better able to sustain service quality despite external shocks.
However, external engagement and internal agility do not automatically translate into quality service. The missing link lies within the people who deliver the service — the employees. Employee resilience, the capacity to adapt, recover, and thrive amid challenges (Luthans, 2022), has been identified as a key determinant of service performance. Reyes (2023) and Gonzales (2023) in Philippine studies confirmed that resilient employees demonstrate higher commitment, lower burnout, and better service delivery.
This leads to the concept of Strategic Governance for Employee Programs. Strategic governance refers to leadership practices that align organizational policies, programs, and resources to develop human capital as a strategic asset (Osborne, 2021). When governance strategically invests in employee resilience programs — such as wellness, capacity building, and psychosocial support — it creates a workforce capable of translating stakeholder inputs and organizational agility into consistent quality service. Despite growing literature on these constructs, there is limited doctoral research in the Philippine context that examines stakeholder engagement and organizational agility together, with employee resilience as the mechanism, and strategic governance as the framework. This gap underscores the need for this study.
Governance in strategic transformation defines the leadership structures and accountability systems that ensure every action contributes to intended business outcomes. It is the link between executive strategy and tangible results. Strong governance frameworks make transformation measurable, resilient and responsive, supporting continuous oversight and scenario planning rather than reactive control.
Checklist-driven governance often fails because it values compliance over capability. When governance becomes an ongoing discipline in which data, decisions and performance insights move freely across programs, organizations build resilience and can pivot quickly as conditions change. Governance maturity becomes a differentiator in sustaining long-term value creation.
Community relations are a business practice involving the development of mutually beneficial community partnerships within the areas in which a business operates. It focuses on social justice: Community wisdom and science work in tandem to ensure a more balanced set of political, social, economic and cultural priorities, resulting in shared resources and shared power, thus leading to equity and social justice.
This form of customer relations helps build strong relationships and goodwill through time, money, or product donations. It builds credibility and it is essential for all businesses, and it is no different with community relations. A solid strategy helps boost the company’s credibility and create a personal connection with customers as compassionate, trustworthy, and invested in local growth. With community relations, a company takes an active interest in the community/communities it serves. This can be achieved, for example by a business attending grand openings or milestone events for local businesses or through sponsorship/promotional partnerships.
It positions businesses as civically and ethically responsible in their local communities, fosters goodwill among the locals– potential customers, and helps the community thrive as a whole. Businesses that participate in community relations benefit by being able to give back to their communities. Many businesses, from small startups to large companies, have recently opted to outsource processes, as new and innovative services are increasingly available in today's ever-changing, highly competitive business climate.
Jelina Relic, 2024 said that community relations are critical for businesses as they can help build trust, credibility, and loyalty with the local community. By establishing a positive reputation in the community, businesses can enhance their brand image, stand out from the competition, and ultimately increase their bottom line. A solid strategy helps boost the company’s credibility and create a personal connection with customers as compassionate, trustworthy, and invested in local growth. With community relations, a company takes an active interest in the community/communities it serves. This can be achieved, for example by a business attending grand openings or milestone events for local businesses or through sponsorship/promotional partnerships.
This research is important to assist the Philippines develop more effective community relation through adaptation approaches and policies to better respond locally to the needs of public and private sectors. To explore this, a literature review will be undertaken followed by interviews and focus group discussions with local experts and community representatives. Meaningful engagement with stakeholders and across sectors that embraced Filipino community engagement customs and characteristics will be emphasized to strengthen customer relations in both private and public sectors.
The paradigm shows that Stakeholder Engagement and Organizational Agility influence Quality Service. However, this influence is channeled through Employee Resilience. Under the lens of Strategic Governance, organizations that develop employee programs to build resilience will be more effective in converting external engagement and internal adaptability into superior service delivery.
Hence, this research is significant.
1.2Theoretical background
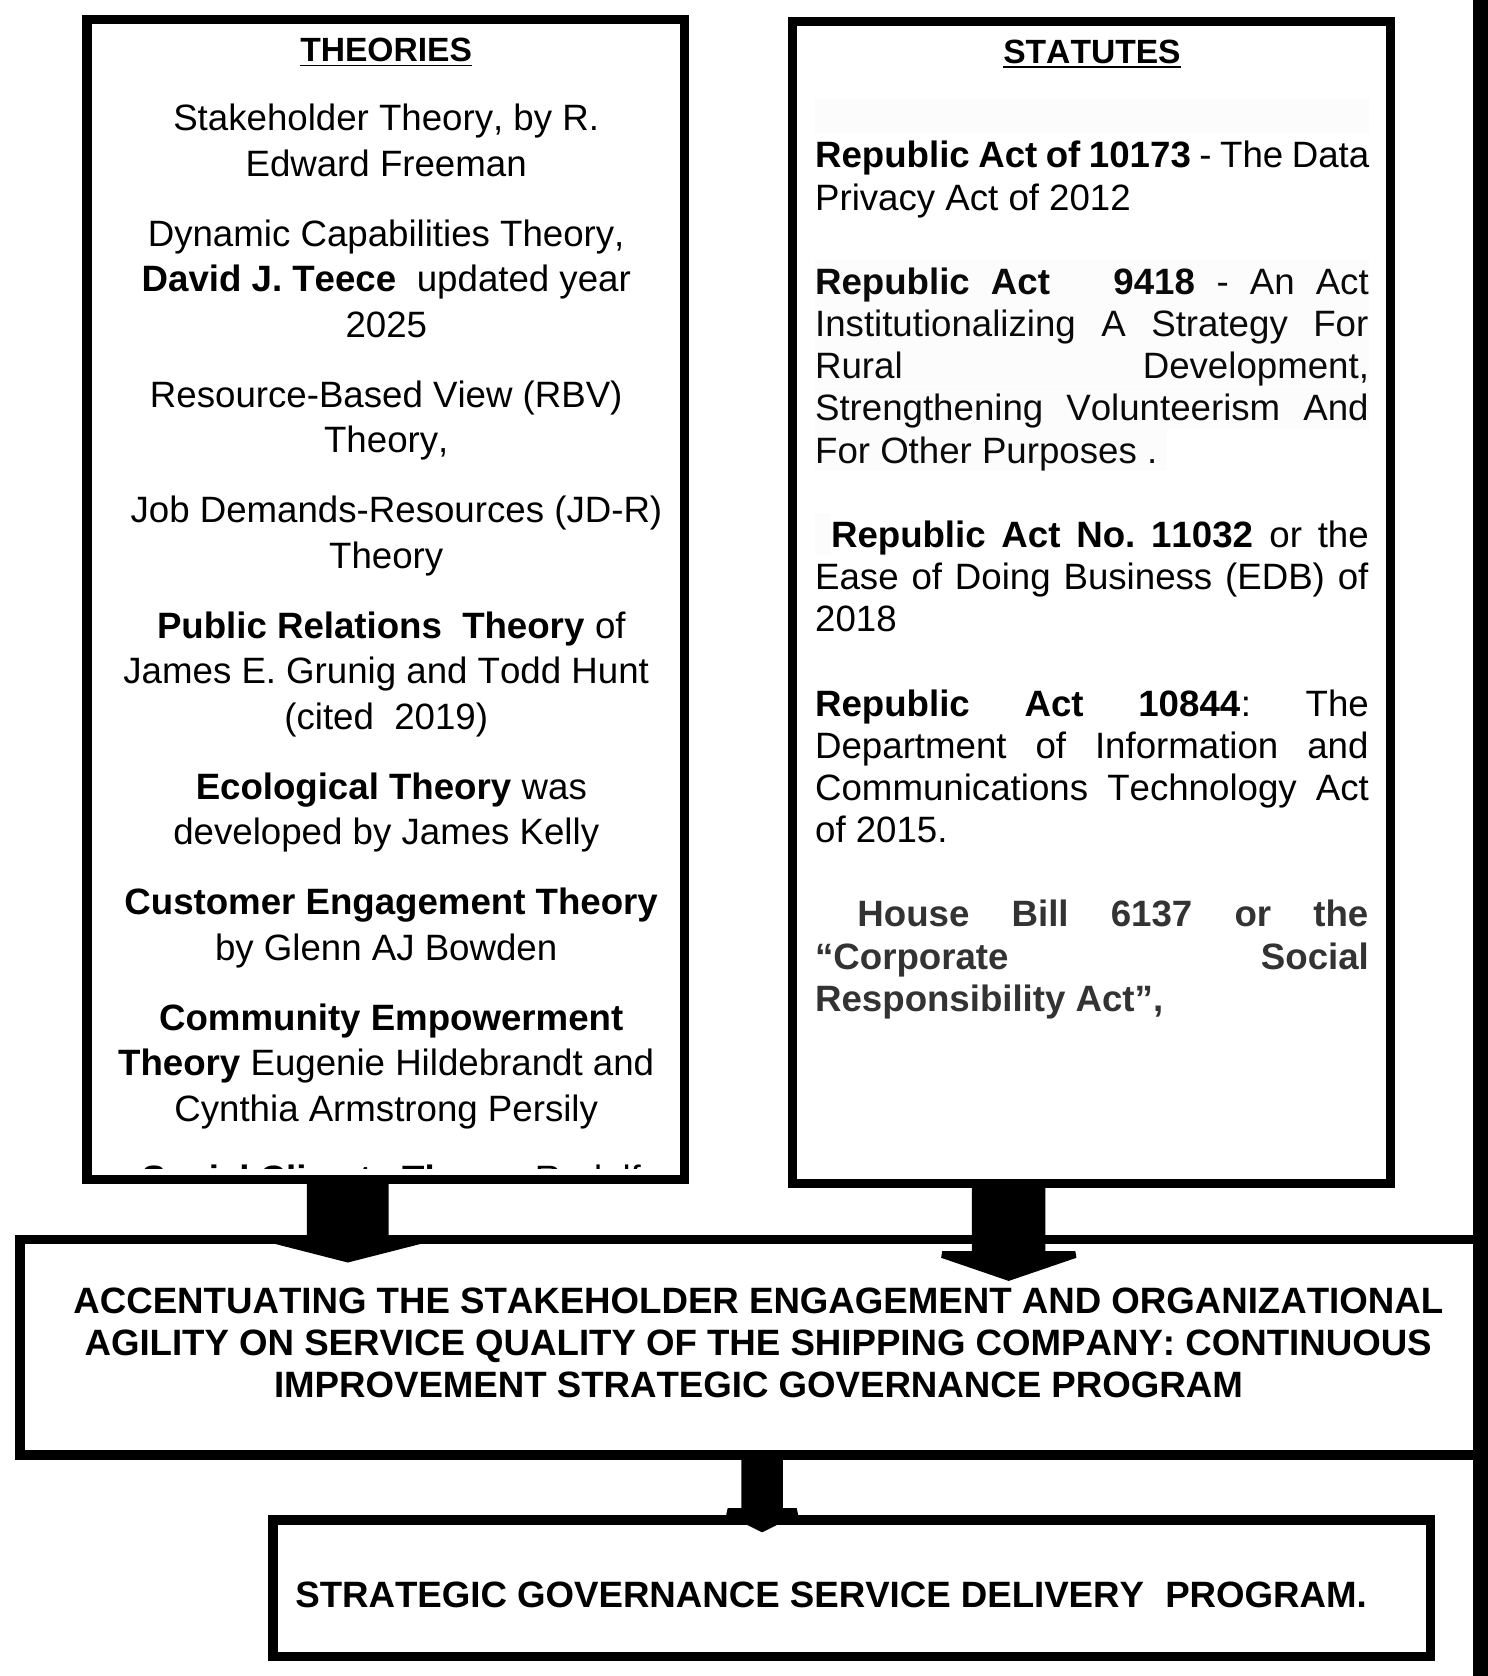
This study anchored on the premise that Strategic governance provides the overarching framework within which organizations operate. The following theories are the Stakeholder Theory, Dynamic Capabilities Theory, Resource-Based View (RBV) Theory, Job Demands-Resources (JD-R) Theory Public Relations Theory of James E. Grunig and Todd Hunt (cited 2019), Ecological Theory was developed by James Kelly, Customer Engagement Theory by Glenn AJ Bowden, Community Empowerment Theory Eugenie Hildebrandt and Cynthia Armstrong Persily and Social Climate Theory Rudolf Moos. For Legal Bases, are Republic Act of 10173 - The Data Privacy Act of 2012 Republic Act 9418 - An Act Institutionalizing A Strategy For Rural Development, Strengthening Volunteerism And For Other Purposes . Republic Act No. 11032 or the Ease of Doing Business (EDB) of 2018 and Republic Act 10844: The Department of Information and Communications Technology Act of 2015.
Stakeholder Theory. Posits that a company should create value for all its stakeholders—including employees, customers, suppliers, local communities, and the environment—rather than solely maximizing profits for its shareholders. It shifts the corporate focus from pure financial returns to long-term sustainability and ethical responsibility. Pioneered by R. Edward Freeman, this approach contrasts sharply with the traditional shareholder primacy model. In practice, it broadens the responsibilities of boards and executives, establishing an accountability framework where business decisions are measured by their impact on everyone who is affected by or has an interest in the organization. Explains how organizations and boards actually behave, interact, and manage relationships with different stakeholder groups in the real world. Examines the connection between stakeholder management and organizational performance. It suggests that addressing stakeholder concerns leads to long-term financial success and competitive advantage. Critics point out that stakeholder governance can be difficult to implement because it forces boards to balance competing interests and manage trade-offs between different groups (e.g., maximizing employee wages versus keeping investor returns high). This has shifted modern governance requirements, as reflected in the rise of ESG (Environmental, Social, and Governance) mandates and "mission-driven" company frameworks.
The theoretical framework of the study is presented in Figure 1.
Dynamic Capabilities Theory. The primary author of Dynamic Capabilities Theory is David J. Teece. His latest and most relevant individual citation on the framework's foundational concepts is his published Elements series book. Teece, D. J. (2025). Dynamic Capabilities: Foundational Concepts [Elements in Business Strategy]. Cambridge University Press. doi.org. As a strategy paradigm, the dynamic capabilities view draws inspiration from various theoretical schools, particularly resource-based and evolutionary views. The operational (or ordinary) capabilities perspective, which was previously focused on procedures and practices aimed at optimising the utilisation of the company’s current resource base, has given way to the dynamic capabilities view (Pfajfar et al., Citation2023). On the other hand, dynamic capabilities are defined as how to use organizational resources and strategic exploration to enable sustained performance and superior performance. Resources and incremental creativity must be valued, imperfectly sustained, and modified over time (Furnivall et al., Citation2019).
Resource-Based View (RBV) Theory. The Resource-Based View (RBV) of the firm posits that sustainable competitive advantage stems from internal resources and capabilities that are Valuable, Rare, Inimitable, and Non-substitutable (VRIN/VRIO). While foundational concepts date back to Edith Penrose in 1959, the formal theory was pioneered by Birger Wernerfelt (1984) and fundamentally shaped into its modern iteration by Jay B. Barney (1991). The resource-based view provides a conceptual framework to assess the strategic fit of resources originating from China in the context of the developing world. Originally proposed by Birger Wernerfelt (1984) and later developed and refined by Jay B. Barney (1991) and other scholars, the resource-based view of the firm has found considerable support in the business literature. A major premise of the resource-based theory is that competitive advantage is a function of the resources and capabilities of the firm (Wernerfelt, 1984; Conner, 1991; Peteraf, 1993). Barney (1991) has listed four attributes of resources that can give rise to a firm's competitive advantage: value, rarity, imperfect imitability, and lack of substitutability.
Valuable resources help a firm exploit opportunities and/or avoid threats in the environment (Barney, 1991) and enable it to develop and/or implement strategies to improve its efficiency and effectiveness (Capron and Hulland, 1999).
Job Demands-Resources (JD-R) Theory. The Job Demands-Resources (JD-R) Theory was originally formulated by Arnold B. Bakker and Evangelia Demerouti. The most definitive and latest foundational citations detailing the current framework of the theory. Bakker, A. B., & Demerouti, E. (2024). Job demands–resources theory: Frequently asked questions. [American Psychological Association]. The theory posits that every job has specific physical, psychological, social, or organizational characteristics, which can be classified broadly into Job Demands (aspects that require sustained effort and energy) and Job Resources (aspects that help achieve goals, reduce demands, and stimulate personal growth).
Public Relations Theory of James E. Grunig and Todd Hunt (cited 2019). Public relations theories provide frameworks to explain how organizations communicate with the public, predict audience behavior, and build mutually beneficial relationships. They help practitioners design persuasive, ethical, and highly targeted messaging strategies. Ecological Theory was developed by James Kelly, edited by prominent communication scholars Carl H. Botan and Erich J. Sommerfeldt
Customer Engagement Theory by Glenn AJ Bowden. Glenn A.J. Bowden’s framework—most notably his 2009 study in the Journal of Marketing Theory and Practice—defines customer engagement as a dynamic psychological process rather than an end state. It models how underlying mechanisms turn first-time users into steadfastly loyal customers and maintain that loyalty over time. Bowden theorizes that satisfaction alone cannot guarantee loyalty. To convert consumers into devoted brand advocates, firms must foster deeper psychological connections across distinct stages of the customer journey.
Community Empowerment Theory Eugenie Hildebrandt and Cynthia Armstrong Persily. Persily, C. A., & Hildebrandt, E. (2018). Theory of community empowerment. Community empowerment theory is a framework describing how individuals and groups gain the power, skills, and resources to control their lives and shape their environments. Rather than receiving top-down assistance, communities build self-reliance and address local inequities through collaborative action and shared problem-solving. In fields like public health, urban planning, and social work, the theory shifts the role of the professional from a "provider" to a "catalyst" or partner who accompanies the community. By facilitating partnerships, the theory addresses the root causes of powerlessness rather than just managing surface-level symptoms.
Social Climate Theory Rudolf Moos., pioneered by Stanford University psychologist Rudolf Moos, frameworkizes how the psychosocial environment—or the "personality" of a setting—influences individual behavior, well-being, and physiological responses. Moos argues that every environment has a unique, collective atmosphere that shapes how human beings adapt and grow. Every residential community has an invisible atmosphere – not defined by temperature or weather, but by the quality of relationships, shared values, and behavioral norms among the people who live there. This is what psychologists call the social climate. It determines whether a home or neighborhood feels warm and supportive or tense and isolating. Understanding social climate is essential because it directly shapes how residents experience their daily lives, affecting everything from mental health to physical well-being. Social climate refers to the shared perceptions of a social environment held by a group of people. In residential settings, it encompasses the collective mood, tone, and quality of interactions that define how people feel about their living space and the people around them. Psychologist Rudolf Moos, who pioneered research in this area, described social climate as the “personality” of a setting – each environment has a distinct character that gives it unity and coherence, much like an individual personality.
Republic Act of 10173 - The Data Privacy Act of 2012. Republic Act No. 10173, known as the Data Privacy Act of 2012, is a Philippine law designed to protect individual personal information in government and private sector information and communications systems. It regulates how organizations collect, store, and process data, and establishes the National Privacy Commission (NPC) to enforce compliance. Violating the law by engaging in unauthorized processing, improper disposal, or accessing data maliciously can result in severe administrative fines and criminal penalties, including imprisonment. It is the policy of the State to protect the fundamental human right of privacy, of communication while ensuring free flow of information to promote innovation and growth. The State recognizes the vital role of information and communications technology in nation-building and its inherent obligation to ensure that personal information in information and communications systems in the government and in the private sector are secured and protected.
Republic Act 9418 - An Act Institutionalizing A Strategy For Rural Development, Strengthening Volunteerism And For Other Purposes. Republic Act 9418 -An Act Institutionalizing A Strategy For Rural development, Strengthening Volunteerism And For Other Purposes. also known as the Volunteer Act of 2007, is to institutionalize volunteerism in the Philippines, establish a national volunteer service program, and promote cooperation between local and international volunteer organizations. The IRR was promulgated on February 5, 2009. National government agencies and LGUs shall establish volunteer programs in their respective offices to promote and encourage volunteering in government programs and projects as well as enjoin government employees to render volunteer service in social, economic and humanitarian development undertakings .
Republic Act No. 11032 or the Ease of Doing Business (EDB) of 2018 Republic Act No. 11032 or the Ease of Doing Business (EDB) of 2018. Ease of Doing Business and Efficient Government Service Delivery Act of 2018. This Act requires all government offices and agencies including LGUs, GOCCs and other government instrumentalities whether located in the Philippines or abroad to provide services covering business and nonbusiness related transactions. Republic Act No. 11032 or the Ease of Doing Business and Efficient Government Service Delivery Act of 2018 is an act that aims to streamline the current systems and procedures of government services. The Anti-Red Tape Authority (ARTA) was established and empowered to implement and oversee a national policy on anti-red tape and ease of doing business and to monitor and evaluate compliance of agencies covered under Sec 3 of RA 11032, and issue notice of warning to erring and/or noncomplying government employees . To eliminate bureaucratic red tape, avert graft and corrupt practices and to promote transparency and sustain ease of doing business, the DICT shall be primarily responsible in establishing, operating and maintaining a CBP or other similar technology, as the DICT may prescribe.
Republic Act 10844: The Department of Information and Communications Technology Act of 2015. May 23, 2016 — Approved on May 23, 2016: An Act Creating the Department of Information and Communications Technology, defining its Powers and Functions . Ensure and protect the rights and welfare of consumers and business users to privacy, security and confidentiality in matters relating to ICT, in coordination with agencies concerned, the private sector and relevant international bodies. Information technology (IT) is the use of computers, storage, networking and other physical devices, infrastructure and processes.
House Bill 6137 or the “Corporate Social Responsibility Act”, seeks to foster sustainable economic development and environmental protection by encouraging corporations to inculcate the value of social responsibility in community development in their organization’s operations and activities. The bill defines corporate social responsibility (CSR) as the commitment of a business corporation to contribute on a voluntary basis to sustainable economic development by working with relevant stakeholders to improve their lives in ways that are good for business and society at large. The bill provides that CSR-related activities include the charitable programs and projects; scientific research, youth and sports development, cultural or education promotion, services to veterans and senior citizens; social welfare; environmental sustainability, health development, disaster relief and assistance, and employee and worker welfare CSR-related activities, among others.
Moreover, through these we can identify ways to improve thus, measure the efficacy of solutions. How in the past certain problems were given a recommendation that improved over time. These were adopted by organizations for the consequent changing policies and behavior of internal and external stakeholders.
Hence, the need to prove these theories.
2The problem
2.1Statement of the problem
This study assessed the effect of organizational agility and stakeholder engagement on the service quality in the Roble Shipping Inc., North Rec., Cebu City during Calendar Year 2026 towards Strategic Governance Service Delivery Program.
Specifically, the research conveyed the answers to the following questions:
- 1. What is the demographic profile of the following stakeholders as to: (1.1) employees’ age and gender, civil status, highest educational attainment, related seminars/trainings attended, number of years in the company, and performance rating; and (1.2) passengers’ and shippers’ age and gender, type of client, and type of services availed?
- 2. What is the extent of the service quality of the shipping company related to: (2.1) stakeholder engagement in terms of community participation, governance and NGO partnership, and customer feedback mechanisms; and (2.2) organizational agility in terms of innovation capability and adaptive capacity?
- 3. What is the extent of quality service delivery in terms of the following key performance indicators (KPIs): level of service, average speed of responses, observance of schedule, and time response?
- 4. As perceived by the respondent groups, what is the level of quality service in terms of reliability, empathy, responsiveness, and customer satisfaction?
- 5. Is there a significant correlation between the extent of quality service delivery and the status of quality service of the company?
- 6. What are the best practices and challenges in the delivery of services by the company?
- 7. Based on the findings, what Strategic Governance Service Delivery Program of the shipping company can be crafted?
2.2Null hypothesis
The given null hypothesis will be tested at.05 level of significance.
Ho. There is no significant effect on the extent of quality service delivery and the status of quality service of the company.
2.3Significance of the study
The findings of this study are extremely useful. This research purposely gives more valid and reliable information to the following individuals and entities
National Maritime Polytechnic (NMP).Collaborates with Roble Shipping through partnerships designed to train and certify maritime crew members.
Philippine Coast Guard (PCG). Responsible for inspecting vessels, ensuring compliance with seaworthiness, and issuing sailing clearances during weather disturbances.
Maritime Industry Authority (MARINA): The regulatory body in the Philippines that governs the licensing, route franchising, and safety standards of Roble's vessels.
Cebu Port Authority (CPA). Manages the ports from which RSI operates, ensuring service efficiency, port infrastructure, and passenger safety
Administration Management. Administrative management refers to the process of maintaining and running an organization or business. The primary objective of this management style is to create a formal structure that encourages success for a particular organization or business.
Customer Relation Management. Customer relationship management (CRM) is a technology for managing all of your company's interactions with current and potential customers. The goal is simple: improve relationships to grow your business. CRM technology helps companies stay connected to customers, streamline processes, and improve profitability.
Clients/Stakeholders. They will be ensured in the delivery of good quality service and satisfaction by promptly addressing the needs of the clientele. This will also enhance good relations while achieving similar direction and goal for community service.
Researcher. This research will help improve planning processes and development of strategies with regards to producing recommendation and solution to problems in customer engagement with both public and private sectors and uphold values in community service, integrity, professionalism, excellence, and teamwork.
Future Researcher. This study serves as a benchmark for future researchers who will be conducting the same study.
3Research methodology
This section contained the research methodology which included the design, flow of the study, environment, respondents, data gathering procedure, instruments, statistical treatment and scoring procedure.
The research methodology explained the methods by which you may proceed with your research. It involved the learning of the various techniques that can be used in the conduct of research and in the conduct of tests, experiments, surveys and critical studies. Basically, these are the procedures by which researchers go about their work of describing, explaining and predicting phenomena. It aimed to give the work plan of research or the implementation of the correct procedures to find out solutions. It involved the techniques regarding how to go about conducting the research, the tools of research, advanced techniques that can be used in the conduct of the experiments and the like. (Farooq, A. 2019)
Based from the study of R. Fernandez that research methodology shown to inform: why a research study has been undertaken, how the research problem has been defined, in what way and why the hypothesis has been formulated, what data have been collected and what particular method has been adopted, why particular technique of analyzing data has been used and a host of similar other questions are usually answered when we talk of research methodology concerning a research problem or study taken from (Indeed Editorial Team, 2022).
3.1Design
The descriptive-survey-quantitative research method was used in this study. The aim of a descriptive research was to identify characteristics, frequencies, trends, correlations, and categories. It focused on answering the how, what, when, and where questions If a research problem, rather than the why. Descriptive survey used surveys to gather data about varying subjects. This data aims to know the extent to which different conditions can be obtained among these subjects (McCombes, S. 2022).
The researcher used a descriptive-quantitative research method by collecting quantifiable information to be used for statistical analysis of the population sample. This is very common when dealing with research in the physical sciences. The quantitative research method was used to: collect quantifiable information to be used for statistical analysis of the population sample, compare how different demographics respond to certain variables, and ascertain the underlying patterns of the research object (Formplus, 2022).
Watkins, 2018, said that the questionnaire will be constructed using measures selected from the extant literature based on how they tapped into the conceptual domain of their respective focal constructs. Pearson's r will be used to determine if there is significant relationship between two groups. The bivariate Pearson Correlation produces a sample correlation coefficient, r, which measures the strength and direction of linear relationships between pairs of continuous variables. By extension, the Pearson Correlation evaluates whether there is statistical evidence for a linear relationship among the same pairs of variables in the population, represented by a population correlation coefficient, ρ (“rho”). The Pearson Correlation is a parametric measure (Kent State University, 2021).
3.2Flow of the study
Input-Process-Output (IPO) model referred to the representation of all the factors that make up a process. In the IPO diagram, included all of the materials and the information that were required in the process, the specific details of the process itself, and the descriptions of all products and by-products anchored on the process that took place.
Furthermore, the IPO model was commonly used approach by researchers in various fields based from the study of Fernandez,2023. It is an approach in system analysis and software engineering for describing the structure of an information processing program or other process (Canonizado, 2021).
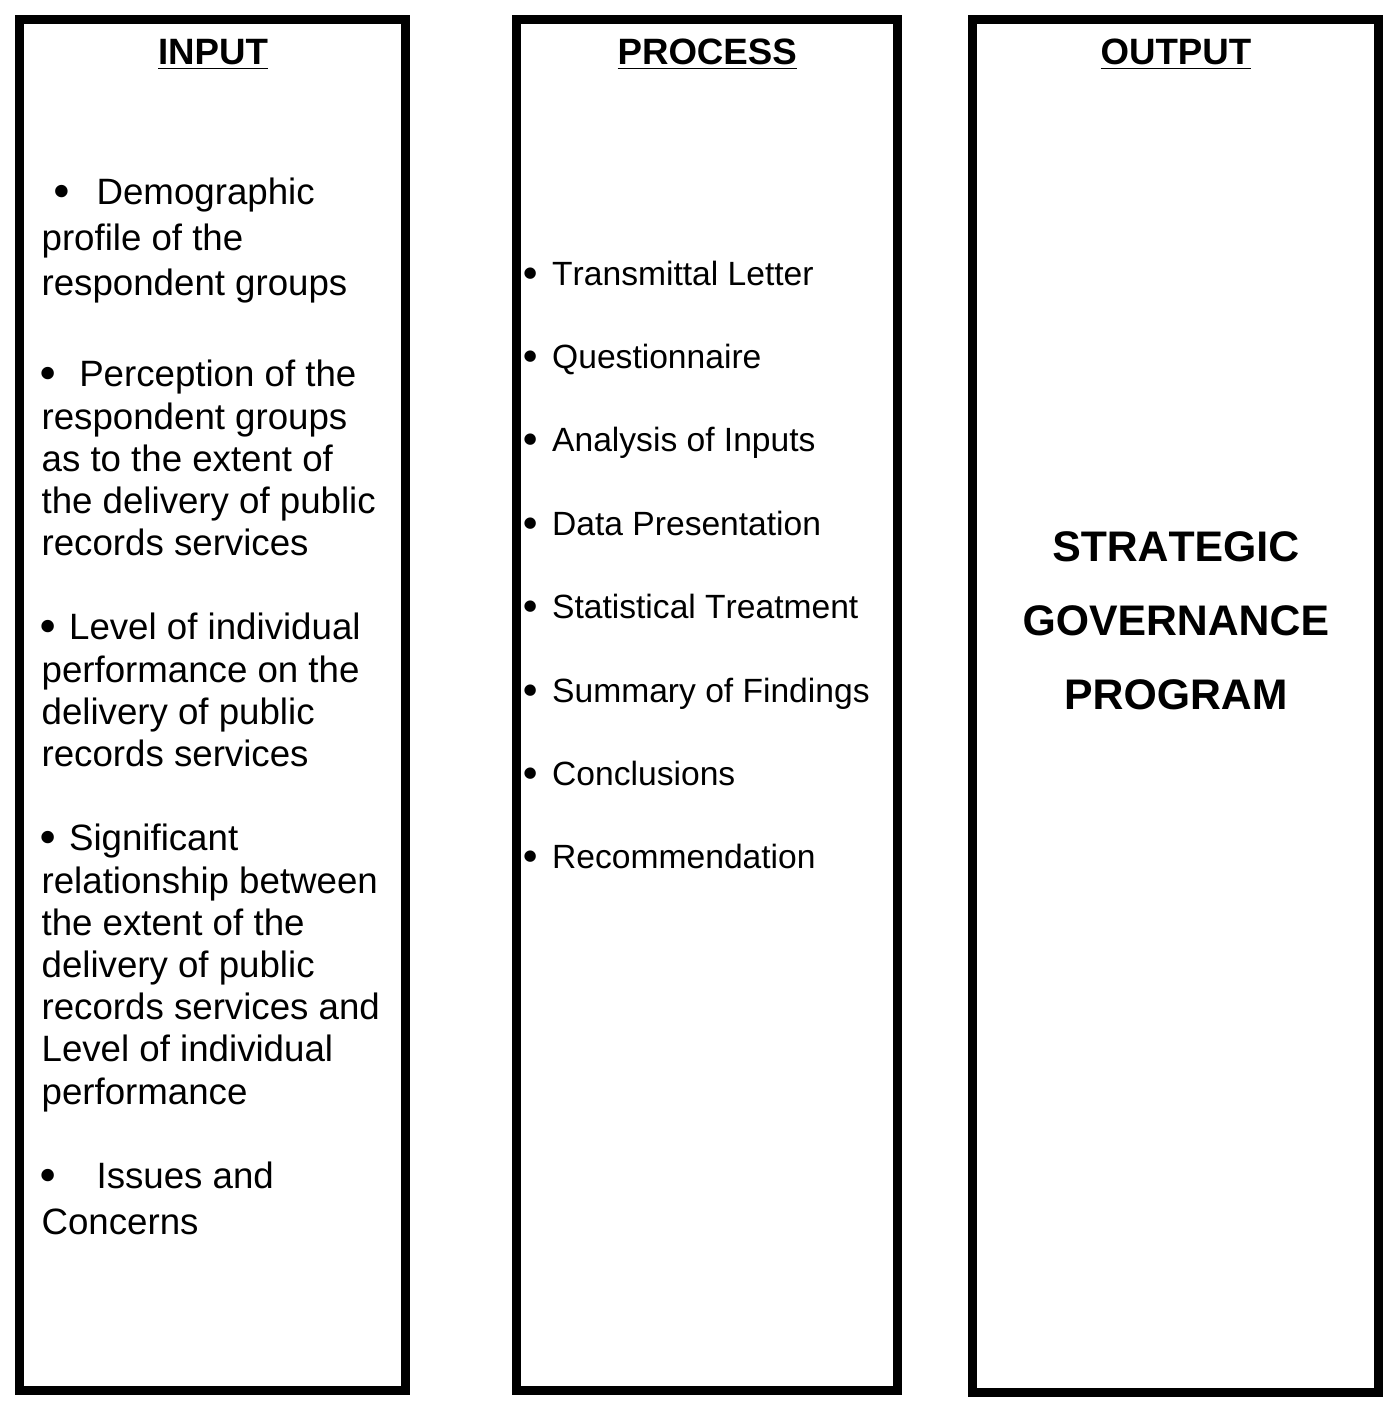
There were three (3) parts in the flow of the study - Input, Process and Output. The information indicated under Input will be the demographic profile of the respondent-groups; perception of the respondent groups as to the extent of quality service delivery and status of customer relations of the different offices in this study, the significant relationship between the extent of quality service delivery and status of customer relations, and the best practices and challenges related to quality service delivery.
The Process included the transmittal letter, survey questionnaires, data gathering, statistical treatment, summary of findings, conclusions and recommendations. The Output is the Strategic Governance Program. The flow of the study is shown in Figure 2.
3.3Environment
The locale of the study is located at E.S. Baclig. T. Padilla Extension, North Reclamation Area, Cebu City. Roble Shipping Inc. is a major Cebu-based maritime transport company headquartered at Pier 7, North Reclamation Area, Cebu City. Established on February 20, 1985, by the late Engr. Jose Luma-ad Roble, Jr., a native of Danao City, Cebu, the company primarily serves passenger and cargo routes across the Visayas and Mindanao regions. The company is a major player in Central and Eastern Visayas, prominently plying the Cebu to Ormoc, Hilongos, and Baybay routes in Leyte. Their fleet of around 21 vessels (including RORO passenger vessels, cargo carriers, barges, and tugboats) also provides tramp and charter services across the broader Philippine archipelago.
Founded with an SEC registration on February 20, 1985, the company started modestly using a single small cargo vessel named M/V Marao, transporting rice and mixed cargo between Cebu and Iloilo. Throughout the late 1990s and 2000s, Roble Shipping built its reputation as a cruiser ferry specialist in Central Visayas with ships like the Ormoc Star. In 1997, they acquired their first large-scale RORO vessel, the Southern Queen. Following the passing of the founder in 2009, his sons and daughters took over the daily operations to steer the company. Today, they manage a modern fleet, with operations supported by key booking offices at Cebu's Pier 3 and various provincial ports like Ormoc, Baybay, and Hilongos.
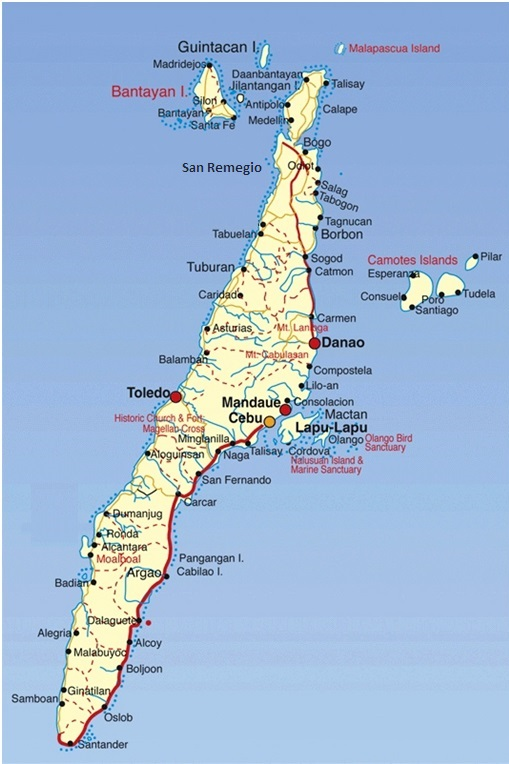
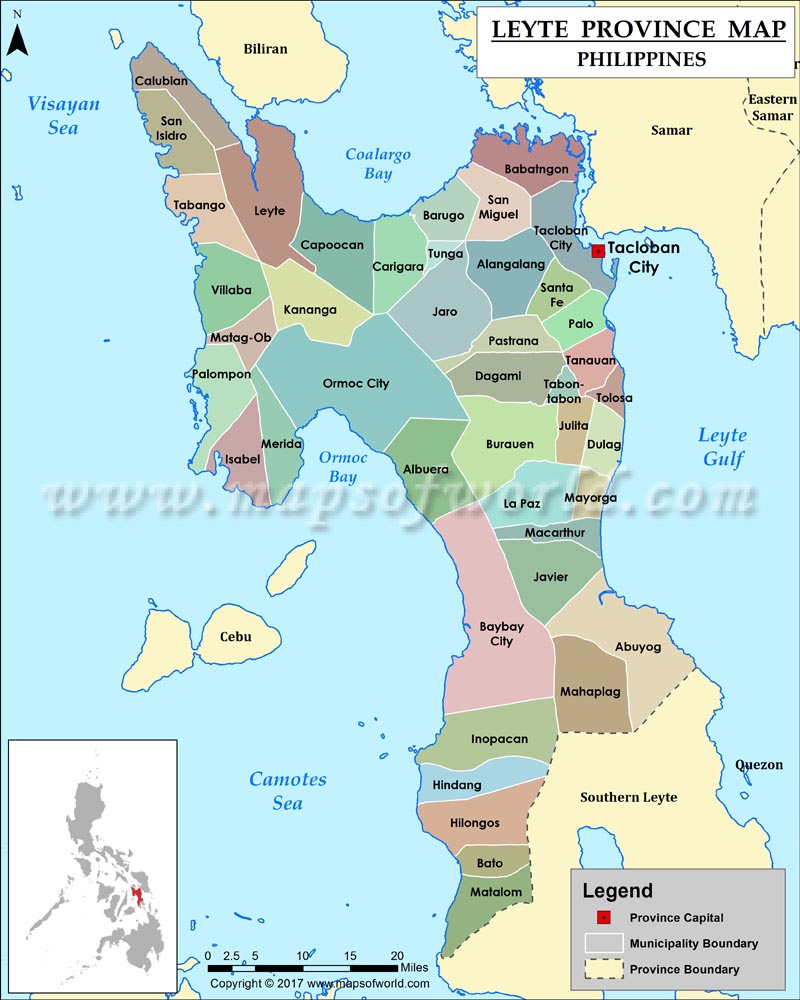
The study area is shown in Figures 3 and 4.
3.4Respondents
There were 100 respondents in this research composing of ten (10) employees, fifty (50) Passengers and forty (40) shippers and were chosen in random. These client respondents avail the services of the company. The population can be characterized in terms of geographical location, age, income, or many other criteria. The 10 employees from the different Roble Shipping offices in Cebu and in Leyte were composed of random staff from every division including administrative division and district offices including the 50 passengers and 40 shippers and they are composed of random stakeholders who transacted in the records office. The client respondents were the people who availed of the public records services that included turnaround time of the releasing and receiving of documents.
Study of Shona McCombes on September 19, 2019 made a revision on June 22, 2023. When you conduct research about a group of people, it’s rarely possible to collect data from every person in that group. Instead, you select a sample. The sample is the group of individuals who will actually participate in the research. To draw valid conclusions from your results, you have to carefully decide how you will select a sample that is representative of the group as a whole. This is called a sampling method which is important to carefully define your target population according to the purpose and practicalities. If the population is very large, demographically mixed, and geographically dispersed, it might be difficult to gain access to a representative sample. A lack of a representative sample affects the validity of your results, and can lead to several research biases, particularly sampling bias. The external client respondents had first-hand knowledge and observe how its employees cater to their needs.
Table 1 indicates the number of respondents in each group.
| Respondents | Personnel | Passengers | Shippers/clients | Total | Percentage |
|---|---|---|---|---|---|
| Cebu | 6 | 30 | 20 | 56 | 56 |
| Hilongos | 2 | 10 | 10 | 22 | 22 |
| Ormoc | 2 | 10 | 10 | 22 | 22 |
| Total | 10 | 50 | 40 | 100 | 100 |
3.5Instruments
The following instruments used to collect data was able to test hypothesis and/or answer proposed research questions under investigation. The instruments were free of bias and appropriate for the context, culture, and diversity of the study site. The research had adapted from recent studies which include some of the mechanisms relevant to the study but was modified to conform to the present research (Collins, J., 2021).
- 1. Questionnaire. This consisted of three (3) parts described as follows:
Part I. This part refers to the demographic profile of respondent-groups.
Part II. This part refers to the extent of the delivery of services at the Roble Shipping and Administrative Records Office, North Reclamation, Cebu City, Ormoc and Hilongos area and client’s level of satisfaction.
Part III. This part refers to the level of individual performance on the delivery of the Company records services.
2. Informal interviews related to this research.
3.6Data gathering procedure
Data Gathering. During the completion of this research, the following procedures are strictly adhered to:
Permission to conduct study. The following procedures will be carefully observe in the conduct of the study.
The researcher meet with the Administration of Roble Shipping and explain the researcher’s findings while catering to the clients' record needs. The researcher discusses about the challenges and even the best practices on how the process will be carried out, as well as the interventions and methods that were employed. Additionally, the benefits and advantages that the agency will gain and earn from this research especially the conformance of anti-red tape act in the office.
After which, the researcher write a letter to the Head of the Administrative Division Office requesting permission to undertake the research. The researcher studied the data and came to the necessary conclusion and recommendation based on the availability of information and how the results would be attained. The respondent-groups will be questioned. The outcome of the research will be based on the respondent’s responses to the questionnaires, or via mobile phones if the first option is not viable.
Data Analysis. When all of the data will be gathered, the researcher examined, analyzed and draw from the outcome, the appropriate conclusions and recommendations.
Informal interviews. The respondents’ answers to the questionnaire will be given a follow-up interview for purposes of clarification.
3.7Statistical treatment
The information will be collected, tallied, and tabulated before being subjected to any statistical analysis.
- 1. To assess the respondent-groups' personal profile, a simple percentage will be used.
- 2. To assess the respondent-groups' extent on the delivery of public records services and level of individual performance, a weighted mean will be used.
- 3. To test the significant relationship between the extent of the delivery of public records services to level of individual performance, the Chi-square will be used.
3.8Scoring procedure
The following categories and numerical values will be used to assess the responses to Part II under the extent in the delivery of records services (Table 2).
| Scale | Weight | Category | Verbal description |
|---|---|---|---|
| 4 | 3.26–4.00 | Very Well Carried-Out (VWCO) | Delivery of public services had been fully served to the clients |
| 3 | 2.51–3.25 | Moderately Carried-Out (MCO) | Delivery of public services had been moderately served to the clients |
| 2 | 1.76–2.50 | Poorly Carried-Out (PCO) | Delivery of housing services had poorly served the clients |
| 1 | 1.00–1.75 | Not Carried-Out (NCO) | Delivery of housing services is not carried out on clients |
Note: Source: Canete, P. (2021).
To measure the responses to Part III under status of customer relation, the following categories and numerical values will be applied (Table 3).
| Scale | Adjectival rating | Description |
|---|---|---|
| 4 | Strongly Agree | The client respondents greatly conform to the statement describing how the company deals with their customers |
| 3 | Agree | The client respondents somewhat conform to the statement describing how the company deals with their customers |
| 2 | Disagree | The client respondents do not conform to the statement describing how the company deals with their customers |
| 1 | Strongly Disagree | The client respondents are greatly not in conformity with the statement describing how the company deals with their customers |
4Review of related literature and studies
This chapter employs the thematic approach where the researcher discusses existing literature based on themes and theoretical concept. It includes the ideas, introduction, methodologies, body, discussion and conclusion and reference list. Those that are included in the chapter helps on familiarizing information that were relevant to the present study. The advantages and disadvantages of past research were reviewed to emphasize the necessity and novelty of this investigation.
4.1Related literature
Sustainability across various domains including business, finance, and governance has received substantial academic attention in recent years. Growing demands for transparency, ethical considerations, and long-term sustainability objectives have encouraged scholars to examine multiple aspects of sustainability reporting, corporate governance, and financial performance (Manning & Reimsbach, 2018; Dewi et al., 2023) Sustainability performance refers to the extent to which a company is able to achieve sustainable development goals by balancing economic, social, and environmental dimensions (Lozano, 2013). It is commonly measured through indicators such as resource-use efficiency, carbon-emission reductions, fair labor practices, community contributions, and long-term profitability. Such evaluations are essential not only for assessing a company’s contribution to global sustainability but also for informing strategic decision-making, strengthening corporate reputation, and creating value for stakeholders (Dyllick & Muff, 2015). Without clear and measurable indicators, sustainability risks becoming a mere slogan with no demonstrable impact.
Local solutions to sustainability challenges, such as climate change and biodiversity loss are often overlooked despite increasing use of the Sustainable Development Goals (SDGs) as a guiding framework (Mcintosh et al., 2023). The SDGs aim to balance economic development, social equity, and environmental preservation to ensure a more sustainable future for coming generations. By committing to the SDGs, companies openly communicate their intention to contribute to sustainable development, thereby reinforcing their responsibilities toward stakeholders (Awuah & Yazdifar, 2024). Within this context, stakeholder engagement plays a crucial role in enhancing corporate sustainability performance (Pasko et al., 2021; Ghassim & Bogers, 2019; Matikainen, 2022).
Sustainability depends not only on internal strategies but also on how effectively a company responds to stakeholder expectations and demands. Meaningful engagement can foster sustainable innovation, improve transparency in reporting, and strengthen the adoption of responsible business practices, ultimately accelerating progress toward SDG achievement and enhancing corporate competitiveness (Pucci et al., 2020).
Stakeholder engagement has increasingly been treated as an end in itself rather than as a means to achieve more meaningful outcomes (Ven, 2024).
Marco Tavanti, 2025 Stakeholder engagement has been central to corporate social responsibility (CSR) and sustainability initiatives, as demonstrated in numerous contemporary studies, which underscores how businesses must move beyond profit maximization and embrace stakeholder-oriented models to enhance long-term sustainability and reputation. Today, stakeholder engagement is recognized to be an essential and transformative concept in sustainable business management. It marks a departure from the traditional shareholder-centric model to a broader, more inclusive approach. Businesses today are no longer focused solely on maximizing shareholder value; they are instead building meaningful relationships with employees, suppliers, investors, local communities, governments, and society at large.
According to N. Sison, et.al, 2025 that this study investigated the relationship between stakeholders' engage-ment and school performance, focusing on elementary schools in the Schools Division of Borongan City. The specific objectives were to de-termine the extent of stakeholder involvement in instructional, physi-cal, and values development; evaluate the performance of respondent schools in terms of student achievement, school awards and recogni-tion, and School-Based Management (SBM) level of practice. Utilizing a descriptive-correlational research design, data were gathered through survey questionnaires adapted and analyzed the prevailing conditions and cause-effect relationships. The study involved elementary school heads and SBM coordinators, who were selected via purposive sam-pling through total enumeration. Findings indicated active stakeholder engagement across instructional, physical, and values development ar-eas. Among the 40 respondent schools, 47.5% were classified as very satisfactory and 52.5% as satisfactory in student achievement. Addi-tionally, 50% of schools excelled in awards and recognition, 45% were moderately performing, and 5% were not performing. At the SBM level of practice, 95% were classified as progressive, with only 5% at the ma-ture level. Statistical analysis revealed that student achievement and SBM level of practice were not significantly related to stakeholder en-gagement, with p-values of.315 and.715, respectively. However, a sig-nificant relationship was found between stakeholder engagement and school awards and recognition, with a p-value of.045. These results underscore the importance of stakeholder engagement in enhancing certain aspects of school performance, particularly in achieving awards and recognition, highlighting areas where further improvements and strategies are needed to link engagement more directly with academic outcomes and SBM practices.
According to F. Muslim et al. (2023), stakeholders are individuals, groups, or organizations that have an interest in influencing or being influenced by the decisions, activities, or outcomes of a project, program, or portfolio. Stakeholders can be defined as parties who have "stakes" or engagement and interests in the project Project stakeholder management will greatly affect the success of the project. Poor stakeholder management strategies, plans, methods, and processes can lead to project failure.
Indonesia, as one of the developing countries, has a high level of infrastructure development because of the rapid increase in population. However, the construction industry already accounts for 40% of total global energy consumption, 40% of global material consumption, 55% of global timber consumption, and 12.2% of global water consumption
Sustainable construction is one of the solutions to social and environmental problems. Sustainable construction is an approach to conducting construction activities that meet current and future economic, social, and environmental needs. Project stakeholders have an important role in the successful implementation of sustainable construction. The level of stakeholder interest in sustainability principles will determine how sustainable construction is applied to the project.
However, stakeholder interest in implementing sustainable construction still tends to be low. The high initial cost of infrastructure investment required is one of the main financial problems faced by project owners. The lack of clarity on the sustainable components that should be applied to projects is one of the barriers to sustainable construction funding. These factors cause low stakeholder motivation in the implementation of sustainable construction, which leads to poor sustainability planning by stakeholders.
Lean construction is one of the alternatives for implementing sustainable construction on infrastructure projects. Lean construction enables quality improvement and cost reduction to be achieved. By increasing stakeholder engagement in sustainable lean construction, stakeholders can develop a continuous improvement procedure to improve construction efficiency and quality for end-users. However, lean construction has not been well implemented. The previous study shows that UK project stakeholders lack positive attitudes, awareness, and knowledge in using lean tools. The same thing is also found in Indonesia, where the readiness level of contractors in implementing lean construction is still quite low, especially in reducing cycle time and reducing variability This can result in low efficiency and effectiveness when using lean construction tools. The lack of positive attitudes can also inhibit the implementation of lean construction by other stakeholders. Such barriers as spreading bad rumors about lean tools and even encouraging rejection of the use of lean tools can occur because they are considered too complicated in the construction industry.
According to Samuel Bangura, et. al, 2024, that this study examines the relationship between organizational agility and performance to determine how agility can improve performance. It will also emphasize organizational agility as a key driver of company performance. In keeping with the previous statement, an integrative review was undertaken using Scopus, EBSCO, and ABI Inform. We also used free web searches to find resources on Science Direct, SABINET, Bing, and Google Scholar for this investigation. This study shows that aligning procedures with agility adoption can boost company performance. Well-planned and implemented agility initiatives improve company processes and efforts. Thus, organizational management can use agility to adapt to the changing business environment when correctly planned and performed. The report offers practical advice on how companies might adopt agility.
Oleiveira, et.al, 2026 that this study explores how organizational agility can be systematically developed through the application of organizational excellence models, particularly in the context of accelerating digital transformation. In an era marked by increasing volatility and uncertainty, agility has emerged as a critical strategic priority, yet many organizations struggle to translate this ambition into tangible outcomes.
4.1.1Agility facets
Today’s industries and markets continuously change by emerging, colliding, splitting, growing, and declining, hence organizations have to contend with perpetual uncertainties. Therefore, regardless of their financial success, they face challenges in creating strategies to deal with such uncertainties. Agility refers to an organization’s ability to sense changes in the environment and to make qualitative/relevant subsequent decisions. This means continuously adjusting strategies, supporting decision-making on challenging projects, effectively responding to ambiguity and uncertainty, and perceiving unanticipated change as opportunities for improvement.
Agility should be a key competence of organizations in today’s dynamic markets. It should be not only seen as a tactic, but rather as a strategic goal by itself. Managers thus need to understand what makes their companies agile, how agile they actually are, and how they can improve agility.
Agility is defined in in terms of three dimensions: Customer responsiveness, operational flexibility, and strategic flexibility. Two dimensions of agility are described in—speed and capabilities of an organization to use resources and respond to changes. According to,it consists of customer agility, partnership agility, and operational agility. In, two facets of agility are discussed: Operational adjustment agility and market capitalizing agility.
Agility should, as such, exist at any organizational level, from strategic/business/organizational level agility down to product or service, tools, and even (employee) personal agility. We focus in this article on the operational level of agility, i.e., the ability of a company to adapt its operations, technology, and information to perpetually changing business requirements to allow managers to achieve the desired competitive advantages.
In service organizations, process quality is usually managed via process KPIs, which rather reflect the performance level of activities, paying less attention to data aspects of business processes.Additionally, the variability they face through either customers, service providers, suppliers, or unexpected events results in less accurate business process models. As such, improving operational business processes may not impact agility.
In this light, management teams in service organizations may face challenges in understanding their agility-related assets and success metrics, and in defining the scopes of work for agility-related improvement initiatives.
4.1.2Operational agility enablers
Agility is seen as a dynamic capability, differing from an operational routine in that it describes how resources can be reconfigured and integrated to respond to contextual changes. To be agile, organizations need a set of enablers, which are capabilities that allow them to promptly respond to changing business environments.
Knowledge management, organization learning, leadership commitment, multidisciplinary teams, organizational culture, decentralized decision-making, or customer and stakeholder involvement are reported as generic agility enablers. Information (including data architecture) is also reported as an enabler of agility. Operational capabilities such as Enterprise Architecture can also enhance agility. There is also a positive link between an organization’s information systems capabilities and its agility. Moreover, operational agility requires building (at least) an information processing network and implementing organizational controls to enhance the right information processing capability.
Business users usually identify business artifacts as the key elements of the process; artifacts can be seen as a kind of vocabulary of the process, similar to the notion of domain ontology. However, business processes and data models (the business artifact models) can evolve independently one from the other. Business artifacts may be modelled ex ante, so that changes in these elements can be consistently measured across organizations, but this means that the same elements are equally central in any organization, which is rarely the case. As such, the third ground idea of this article is that business artifacts can be derived from the particular operational information system of an organization (ideally modelled via a domain ontology). Having such an operational informational system is an enabler for operational IT application orchestration, which is reported to have a positive impact on agility.
To summarize, rather general answers can be found to the question of how to build agility in a particular organization. Managers need, however, to know what capabilities to develop, given different changes in their business environments, and what practices and techniques can be implemented in this respect.
4.2Related studies
From the study of Fulea, et.al., 2023 that Agility, a necessary condition for sustainable performance, should be a key competence of organizations in dynamic markets today. Organizations have to move faster than the market around them, both in terms of decision-making and capability development over time, to maintain a competitive advantage. Agility should therefore not only be seen as a tactic, but rather as a strategic goal by itself.
Organizations doing this invest in underlying assets that allow them to iterate and learn faster, as this de-bottlenecks everything they do. As such, a strategy that includes agility should highlight these underlying assets and align agility-related success metrics so that everybody in the team can make that strategy come alive. Metrics are particularly important, as understanding their relative importance helps to understand what matters to leadership. However, while quick and innovative responses to changes in the business environment (i.e., being agile) impact performance, research on the resources and capabilities that enable organizations to be agile is still nascent.
The present research focuses on operational agility in service organizations, whose processes are usually complex, non-linear, and work with a high volume of information of variable quality. Service systems are inherently subject to variability, whether through customers, service providers, suppliers, or unexpected events. As such, their management teams may face challenges in understanding their agility-related assets and success metrics. They may furthermore face challenges in defining the scope of work for agility-related improvement initiatives.
Among the bottlenecks to (operational) agility reported by practitioners \], two stand out, especially in the aforementioned context of service organizations: Ineffectively managed unstructured work and complex processes. Approximately 60% of today’s work is unstructured, consisting of ad-hoc, one-off tasks that require interpretation, sound judgment, and expertise. This is especially particular to service organizations, whose front-line employees are usually given the flexibility to adapt to “on-the-ground” situations. In addition to that, the more interfaces involved, the more information is lost or interpreted differently.
According to a Forbes Insights and PMI report on agility interviewing more than 500 senior executives across the globe, over 90% of them regard agility as critical to business success. The same source reports that only 27% of the interviewed senior executives consider themselves highly agile. Regarding figures, the global market for operations management services, which are directly correlated with continuous improvement, was estimated around as much as $70 billion USD in 2018. As such, effectively identifying and running improvement initiatives under the pressure of continuous change and uncertainty (an important facet of being agile) leads not only to better agility but also significant cost savings.
Arthur Kwasek et.al, 2025 in the study The Impact of Organizational Agility on the Sustainable Development of the Organization in the Context of Economy 5.0 mentioned that modern organizations operate in turbulent market conditions. In the conditions of Economy 5.0, which emphasizes the integration of technology with the needs of man and the environment, the ability of organizations to flexibly adapt to changing conditions and implement development strategies that take into account economic, social and environmental balance, takes on integral importance. The subject of sustainable development and organizational agility is therefore becoming current and strategically important for ensuring the durability and competitiveness of economic entities.
The literature increasingly emphasizes that achieving sustainable development goals in the context of Economy 5.0 requires implementing technological innovations. It is also important to build internal organizational competencies such as quick decision-making, tolerance of rapid changes, efficient internal communication and development of internal employee motivation. Analysis and understanding of the interrelationships between these factors and the ability of organizations to implement sustainable development strategies can be considered a significant research gap.
The aim of the article is to determine the key factors shaping organizational agility as a determinant of sustainable development in the context of the Economy 5.0 and to propose an original model illustrating these relationships, which offers an integrated approach useful both in scientific research and in practical management, helping organizations strengthen their capacity for flexible, responsible, and sustainable growth in dynamically changing conditions. The empirical part presents the results of quantitative and qualitative research conducted on a sample of 312 respondents. Then, on their basis, an original mathematical model was constructed illustrating the relationships between the analyzed variables. The added value of the article is to provide an integrated approach to the relationships between organizational agility and sustainable development in the context of the Economy 5.0, as well as to propose a research tool that can be used both in further scientific research and in the practice of managing organizations. The original model indicates specific areas of action that can directly contribute to strengthening the organization’s ability to develop flexibly, responsibly and sustainably in conditions of growing uncertainty and pressure to implement the principles of sustainable development.
According to Carlos Gomes, et. al, May 8, 2026 that this study explores how organizational agility can be systematically developed through the application of organizational excellence models, particularly in the context of accelerating digital transformation. In an era marked by increasing volatility and uncertainty, agility has emerged as a critical strategic priority, yet many organizations struggle to translate this ambition into tangible outcomes. The results highlight two key enablers of agility: the internalization of excellence practices and the development of robust digital transformation capabilities. These factors are shown to be necessary prerequisites for achieving agility, rather than merely supportive elements.
M.A. Budiman et al. (2023) said that today's organizations are dealing with a turbulent and unpredictable business environment. In these uncertain times, it is critical that managers at all levels have a deep understanding of discretion as part of the decision-making process. This study investigated the relationship between perceived managerial discretion and project success in the upstream oil and gas sectors. A total of 108 project managers participated in this study. We analyzed data using covariance-based structural equation modelling (CB-SEM) to construct a framework that highlights the importance of dynamic managerial capabilities and organizational agility on perceived managerial discretion. The results confirm and emphasize the direct role of perceived managerial discretion on project success. The study notes the essential roles of strategic management literacy in mediating the relationship between perceived managerial discretion and project success in Indonesia and provides insights for middle managers seeking to foster the success of projects by considering strategic management literacy.
Vaszkun, et.al, 2023 said that their study presents the first comprehensive systematic literature review of articles from the last five years published on enterprise-scaled agility and offers practical insights for organizations looking to become more agile. The management literature on agile structures is still relatively scarce and fragmented, but emerging. Our results highlight the characteristics, advantages and tensions created by agility at the organizational level, and give insight for executives to support their decisions on organizational design. By examining the structural, cultural, and leadership antecedents that are necessary for success, this paper contributes to the ongoing debate about agile organizations. The concept of ‘Agility Forest’ proposed here will contribute to the better understanding of the connections between structure, culture, and leadership. The emergence of agile organizations as a topic in the academic discussion is a reflection of the growing importance of agility in management. Scholars from a variety of disciplines, including management, organizational behavior and information systems, have explored the concept of agility and its implications for organizations ([Batra 2020](https://www.akjournals.com/view/journals/204/45/4/article-p393.xml#B7); Qin – Nembhard 2015; Saputra et al. 2021). Although agility has started as an innovative method for specific functions such as software development or project management, it has recently been scaled up onto the organizational level and increasingly considered as a general management concept for large organizations ([Rigby et al. 2018](https://www.akjournals.com/view/journals/204/45/4/article-p393.xml#B59)). When reviewing the literature of agility, [Sońta-Drączkowska (2018)](https://www.akjournals.com/view/journals/204/45/4/article-p393.xml#B68) identified five major research streams focusing on software development, project management, agility on the organization level, the application of hybrid approaches, and on the agile methods for innovation. She claimed that research on an organizational level was relatively scarce, compared with other focus areas. More than five years later, this paper considers agility at enterprise-level only, without narrowing down to specific functions.
From the study of K. Hutter, et. al, 2023 that the ubiquity of digitalization and disruptive business models is currently reshaping industries and challenging many organizations to pursue large-scale transformations to keep pace in today's volatile, fast-moving business environment (Appelbaum et al., 2017; Parida et al., 2019). Companies' 20th-century models, in which competitive advantage derives from economies of scale, hierarchical structures and complex decision-making processes, are simply no longer fast enough to keep up (Holbeche, 2018). In response, the concept of agility has gained momentum, especially following the emergence of transformational digital technology and its potential to fundamentally change corporations' business models, relationships with customers, competences, products and services and ecosystems (Bharadwaj et al., 2013; Chan et al., 2019; Oliva et al., 2019). According to Doz et al. (2008, p. 65), agility is “a higher-order dynamic capability that is built over time” and thus requires being aware of trends and forces, making bold decisions fast and reconfiguring business systems and rapidly redeploying resources. Such higher-order capabilities include the dynamic capabilities of sensing (i.e. the capacity to identify, develop, co-develop and assess new technological opportunities and threats in relation to customers' needs), seizing (i.e. the capacity to mobilize resources to address opportunities and capture value) and transforming (i.e. the capacity to maintain competitiveness via continuous renewal) that are necessary to addressing new opportunities and threats brought forth by today's new technological environment (Teece et al., 2016).
According to J. Kumasaru, 2025 that as a strategy that a firm can enhance its capability to survive managing the ever-changing market conditions and successfully handling the uncertain and emerging entrepreneurial opportunities is called the Organizational Agility. However, there is still little attention given by scholars on organizational agility in strategic management research. Therefore, this study has been conducted to identify the factors influence on organizational agility. Also, the study synthesized the empirical studies on organizational agility to understand the areas that can be addressed further in future research. The systematic literature review approach was applied in this study based on the guidelines given by the Preferred Reporting Items for Systematic Reviews and Meta-Analyses (PRISMA). Following several predetermined inclusion criteria, 276 articles from the Scopus database were considered for the study. The study was able to identify four main clusters/areas that determine the robustness on organizational agility literature namely, strategic agility and technology, agile capabilities and performance, technology and competitive advantages, and innovation through Knowledge and Learning which have been investigated in last two decades
From the study of Sung Min-Park, 2023 that Responsible Innovation (RI) has increasingly attracted attention in academic research and business practice for UN Sustainable Development Goals (SDGs). Especially, the UN Economic and Social Commission for Asia and the Pacific (UNESCAP) highlights RI as a key concept to address how to institutionalize and organize action programs to solve grand challenges. However, we know little about the determinants of organizing RI in business. By applying agile management and stakeholder theory, this study proposes the critical organizational factors to implement RI, namely: Organizational Agility and Communicative Actions. Based on the large-scale data analysis of 13,234 South Korean manufacturing firms during the period between 1999 and 2019, this paper investigates whether and how organizational factors can affect RI in the Asian context, using the zero-inflated negative binomial regression model. Findings show that well-organized agile management and communicative actions with stakeholders are essential to enhance RI performance in a holistic view. This study contributes to the recently emerging field of RI and offers novel theoretical and practical implications for academics and practitioners regarding the underlying mechanism of organizing RI. The findings offer actionable guidance for leaders aiming to build agile organizations. By emphasizing excellence and digital capabilities as strategic investments, organizations can better prepare for uncertainty and disruption.
5Data presentation, analysis and interpretation
This chapter summarizes the results of the research. The information was organized into tables, analyzed, and interpreted. There were 100 respondents in this research composing of ten (10) employees, fifty (50) Passengers and forty (40) shippers and were chosen in random. These client respondents avail the services of the company. The population can be characterized in terms of geographical location, age, income, or many other criteria. The 10 employees from the different Roble Shipping offices in Cebu and in Leyte were composed of random staff from every division including administrative division and district offices including the 50 passengers and 40 shippers and they are composed of random stakeholders who transacted in the records office. The client respondents were the people who availed of the public records services that included turnaround time of the releasing and receiving of documents. The following survey questionnaires were composed of three (3) parts:
5.1Respondents’ profile
5.1.1Employees
This section presents the demographic and professional profile of the personnel respondents of Roble Shipping Co. in terms of age, gender, civil status, highest educational attainment, relevant trainings or seminars attended, length of service, and performance rating. Examining these characteristics is important because the background of personnel provides a clearer understanding of the workforce responsible for carrying out the company's operations and delivering services to passengers, shippers, and other stakeholders. Their age and length of service may reflect the combination of maturity, experience, and adaptability present within the organization, while educational attainment and participation in relevant trainings provide indications of their preparation and opportunities for professional development. Gender and civil status further describe the composition of the workforce, whereas performance ratings provide an indication of how personnel are assessed in fulfilling their assigned responsibilities. Taken together, these characteristics establish an important context for understanding subsequent findings on stakeholder engagement, organizational agility, and quality service. Since the study ultimately seeks to develop a Strategic Governance Program, identifying both the strengths and areas requiring improvement in the personnel profile can help ensure that the proposed program responds to the actual char
| Age | f | % |
|---|---|---|
| 51 yrs. and up | 1 | 10.00 |
| 41 – 50 yrs. Old | 2 | 20.00 |
| 31 – 40 yrs. Old | 5 | 50.00 |
| 20 – 30 yrs. Old | 2 | 20.00 |
| Total | 10 | 100.00 |
| Average | 36.95 | |
| Std Dev | 8.43 |
The data in Table 4 illustrates that the largest proportion of the personnel respondents belonged to the 31–40 years old age group, with 5 respondents or 50.00 percent of the total. This means that one-half of the personnel respondents were within an age range generally associated with established professional experience while still having considerable opportunities for continued career development. Meanwhile, 2 respondents or 20.00 percent were between 20 and 30 years old, and another 2 respondents or 20.00 percent belonged to the 41–50 years old category. Only 1 respondent or 10.00 percent was 51 years old and above. Overall, 70.00 percent of the respondents were between 20 and 40 years old, while the remaining 30.00 percent were 41 years old and above.
The computed average age of 36.95 years, with a standard deviation of 8.43, further indicates that the personnel respondents were generally in their middle working years, although there was a reasonable variation in their ages. The distribution suggests that the company has a workforce composed primarily of personnel who may already possess meaningful workplace experience while remaining capable of adjusting to changes in organizational procedures, technologies, and customer service requirements. The presence of younger employees may contribute new perspectives and greater familiarity with emerging technologies, while personnel from the older age groups may contribute experience and institutional knowledge. Such a combination can be beneficial to organizational agility when the knowledge and capabilities of employees across age groups are effectively utilized.
However, the relatively small representation of personnel aged 51 years and above at 10.00 percent suggests that the organization may have limited representation from highly senior age groups who could potentially contribute long-term institutional knowledge and mentoring. As part of the proposed Strategic Governance Program, the company may consider strengthening intergenerational knowledge sharing, mentoring, succession planning, and continuous professional development so that experience accumulated by senior personnel can be transferred to younger employees. At the same time, opportunities for younger and middle-aged personnel to participate in decision-making, innovation initiatives, and service improvement activities may further strengthen organizational adaptability and service quality.
| Gender | f | % |
|---|---|---|
| Male | 5 | 50.00 |
| Female | 5 | 50.00 |
| Total | 10 | 100.00 |
Table 5 highlights that the personnel respondents were equally distributed according to gender. Of the 10 personnel respondents, 5 or 50.00 percent were male, while the remaining 5 or 50.00 percent were female. Thus, neither gender constituted a numerical majority among the respondents, resulting in an equal 50.00–50.00 percent representation.
The balanced distribution indicates that the perspectives gathered from the personnel group are not numerically dominated by either male or female respondents. Within the context of stakeholder engagement and organizational governance, such representation can be favorable because personnel experiences and perceptions regarding company operations, communication, responsiveness, innovation, and service delivery are represented by both groups. A gender-balanced personnel composition may also provide opportunities for diverse viewpoints when addressing workplace concerns and customer service requirements.
Nevertheless, numerical equality alone does not necessarily indicate equality in organizational participation, responsibilities, leadership opportunities, or decision-making authority. The company may therefore consider ensuring that both male and female personnel are provided equitable opportunities to participate in training, leadership development, strategic discussions, innovation activities, and service-quality initiatives. This can strengthen inclusive governance by ensuring that balanced representation is also reflected in meaningful organizational participation rather than being limited to numerical composition.
| Civil Status | f | % |
|---|---|---|
| Single | 0 | 0.00 |
| Married | 10 | 100.00 |
| Separated | 0 | 0.00 |
| Widow | 0 | 0.00 |
| Total | 10 | 100.00 |
From the data shown in Table 6, all 10 personnel respondents or 100.00 percent were married. None of the respondents were single, separated, or widowed, with each of these categories accounting for 0 respondent or 0.00 percent. The results therefore indicate complete homogeneity among the respondents in terms of civil status.
The finding shows that the personnel respondents share a common civil-status background, which may provide a relatively similar context in relation to family responsibilities and work-life considerations. While civil status does not directly determine employee performance or service quality, it forms part of the demographic characteristics that may provide context for understanding employees' circumstances and workplace needs. The 100.00 percent representation of married personnel may indicate the relevance of organizational practices that support employees in managing professional obligations alongside family responsibilities.
Since no other civil-status categories were represented, comparisons based on civil status cannot be meaningfully established from this group of respondents. Consequently, the company should avoid making assumptions about personnel capability, commitment, or performance based solely on marital status. Instead, strategic governance initiatives may focus on inclusive employee-support mechanisms such as appropriate scheduling, employee welfare programs, effective workload distribution, and work-life balance measures. These actions may help maintain employee engagement and responsiveness, particularly when personnel are required to meet operational schedules and customer service demands.
| Highest Educational Attainment | f | % |
|---|---|---|
| Doctoral level | 0 | 0.00 |
| Masteral level | 0 | 0.00 |
| College level | 10 | 100.00 |
| Undergraduate level | 0 | 0.00 |
| Total | 10 | 100.00 |
The data in Table 7 illustrates that all 10 personnel respondents or 100.00 percent were classified under the college-level category, while no respondents were recorded under the doctoral, master's, or undergraduate categories, representing 0.00 percent for each of these classifications. The distribution therefore shows that the respondents have a uniform educational profile based on the categories provided in the study.
The 100.00 percent concentration at the college level indicates that the personnel respondents possess tertiary-level educational exposure that may provide them with foundational knowledge and competencies relevant to their assigned responsibilities. This educational background may support their ability to understand organizational procedures, communicate with stakeholders, respond to service requirements, and participate in workplace improvement initiatives. In a service-oriented organization such as a shipping company, personnel capability is important because employees frequently encounter operational concerns and customer needs that require appropriate communication, judgment, and problem-solving.
At the same time, the absence of respondents at the master's and doctoral levels indicates an opportunity to further strengthen advanced professional and managerial competencies, particularly among personnel who may eventually assume supervisory, managerial, or strategic responsibilities. The company may consider supporting continuing education, professional certification, specialized technical courses, and management-development programs. It is also advisable to clarify the classification “college level”, particularly whether this means college graduate or merely having attended college without completing a degree, because these categories represent different levels of educational attainment. A more precise classification would improve the accuracy of the personnel profile and provide a stronger basis for identifying professional-development needs.
| Relevant Trainings/Seminars Attended | f | % |
|---|---|---|
| Communication Skills Training | 10 | 100.00 |
| Process Skills | 10 | 100.00 |
| Leadership Training | 3 | 30.00 |
| Call Center Training | 2 | 20.00 |
| Total | 25 | 250.00 |
Table 8 highlights that training participation was concentrated primarily on communication and process-related competencies. All 10 personnel respondents or 100.00 percent reported having attended Communication Skills Training, while all 10 or 100.00 percent had also attended Process Skills Training. In comparison, only 3 respondents or 30.00 percent had attended Leadership Training, while 2 respondents or 20.00 percent had participated in Call Center Training.
The results indicate a strong organizational emphasis on communication and process competencies, as demonstrated by the 100.00 percent participation in both areas. This is particularly relevant to service quality because effective communication enables personnel to provide accurate information, respond appropriately to passenger and shipper concerns, and maintain positive interactions with different stakeholders. Similarly, process skills can contribute to greater consistency and efficiency in completing organizational procedures. These training experiences may therefore serve as existing strengths that can support reliability and responsiveness in service delivery.
However, a notable gap is evident in leadership development. With only 30.00 percent having attended Leadership Training, approximately 70.00 percent of the personnel respondents had not participated in this type of training based on the reported data. Likewise, only 20.00 percent attended Call Center Training, leaving 80.00 percent without this specific customer-contact training. Although call center training may not be required for every position, customer handling, complaint management, conflict resolution, and service recovery competencies can be useful for personnel who regularly interact with passengers and shippers. The proposed Strategic Governance Program may therefore incorporate broader leadership development, customer relations, complaint handling, digital communication, crisis response, and service recovery training. Expanding these opportunities could strengthen both organizational agility and the company's capacity to respond effectively to stakeholder concerns.
| Length of Service | f | % |
|---|---|---|
| 31 years and above | 0 | 0.00 |
| 21 years to 30 years | 0 | 0.00 |
| 11 years to 20 years | 2 | 20.00 |
| 1 year to 10 years | 8 | 80.00 |
| Below 1 year | 0 | 0.00 |
| Total | 10 | 100.00 |
| Average | 7.50 |
From the data shown in Table 9, the majority of the personnel respondents had been employed by the company for 1 to 10 years, comprising 8 respondents or 80.00 percent of the total. The remaining 2 respondents or 20.00 percent had served for 11 to 20 years. No respondents were recorded under the categories below 1 year, 21 to 30 years, and 31 years and above, with each category representing 0.00 percent. The personnel had an average length of service of 7.50 years, indicating that the respondents generally had several years of organizational experience.
The concentration of 80.00 percent within the 1–10-year category suggests that most respondents are neither newly hired nor extremely long-tenured personnel. Their average service of 7.50 years implies that many may already possess substantial familiarity with company policies, operational procedures, service standards, and recurring passenger and shipper concerns. This experience may contribute positively to service reliability because personnel who have remained with the company for several years are more likely to understand established processes and organizational expectations.
The 20.00 percent who had served for 11–20 years may also represent an important source of institutional knowledge. These employees may have experienced organizational changes and operational challenges over a longer period, making their insights potentially valuable in identifying effective practices and areas requiring improvement. However, the absence of personnel with more than 20 years of service suggests that long-term institutional knowledge may be concentrated among relatively few individuals or may not be represented in the sample. The company may therefore strengthen knowledge-management practices, document critical operational procedures, develop mentoring arrangements, and establish succession plans. These measures can help ensure that valuable organizational knowledge is retained while employees are simultaneously encouraged to adopt new processes and innovations needed for organizational agility.
| Performance rating | f | % |
|---|---|---|
| Outstanding | 0 | 0.00 |
| Very Satisfactory | 10 | 100.00 |
| Satisfactory | 0 | 0.00 |
| Unsatisfactory | 0 | 0.00 |
| Poor | 0 | 0.00 |
| Total | 10 | 100.00 |
The data in Table 10 illustrates that all 10 personnel respondents or 100.00 percent received a Very Satisfactory performance rating. No personnel were classified as Outstanding, Satisfactory, Unsatisfactory, or Poor, with each of these categories accounting for 0 respondent or 0.00 percent. The findings therefore reveal a completely uniform distribution of performance ratings among the personnel included in the study.
The 100.00 percent Very Satisfactory rating indicates that the personnel generally meet organizational performance expectations at a relatively high level. This may reflect their ability to perform assigned responsibilities effectively and consistently, which is particularly important in an organization where service delivery depends on personnel responsiveness, operational coordination, communication, and adherence to procedures. When considered together with the finding that 100.00 percent had attended Communication Skills Training and Process Skills Training, the uniform Very Satisfactory rating may indicate that personnel possess a sound foundation of competencies necessary for maintaining company operations and serving stakeholders.
Nevertheless, the absence of any personnel under the Outstanding category (0.00 percent) presents an opportunity for further improvement. Although a Very Satisfactory rating represents positive performance, the organization may examine the specific performance criteria that prevent personnel from reaching the highest rating. These may involve areas such as innovation, initiative, leadership, responsiveness, customer handling, problem-solving, or achievement of service-related targets. Moreover, because all respondents received exactly the same categorical rating, the company may review whether the existing performance appraisal system is sufficiently sensitive to differences in individual performance.
The Strategic Governance Program may therefore incorporate measurable performance targets connected to service quality indicators, continuous coaching, recognition mechanisms, leadership development, customer-service standards, and innovation-related performance measures. Such initiatives may help personnel progress from consistently Very Satisfactory performance toward Outstanding performance while ensuring that employee evaluation is aligned with the company's broader objectives for stakeholder engagement, organizational agility, and quality service.
5.1.2Passengers
This section presents the demographic and socioeconomic profile of the passenger respondents of Roble Shipping Co. in terms of age, gender, civil status, nature of employment, and type of client. Understanding the characteristics of passengers is important because they constitute one of the primary stakeholder groups directly experiencing the company's services. Their demographic and employment backgrounds may influence their expectations regarding accessibility, reliability, responsiveness, convenience, communication, scheduling, and overall service quality. Since passengers come from different age groups and occupational circumstances, their service requirements may also vary, making it necessary for the company to recognize these differences when developing customer-oriented policies and service improvements.
The profile of the passengers also provides an important context for interpreting their subsequent assessment of the company's quality service. Younger passengers may have different expectations regarding digital communication, online transactions, and rapid responses, while older passengers may place greater importance on accessibility, assistance, clear information, safety, and convenience. Likewise, differences in gender, civil status, employment, and sector affiliation may contribute to variations in travel purposes and service expectations. Examining these characteristics therefore allows the study to establish who the passenger respondents are and provides a stronger basis for understanding their perceptions of the company's service delivery. These findings can further guide the development of a Strategic Governance Program that is inclusive, responsive, and aligned with the needs of diverse passenger groups.
| Age | f | % |
|---|---|---|
| 60 years and up | 5 | 10.00 |
| 51-59 years old | 10 | 20.00 |
| 41-50 years old | 10 | 20.00 |
| 31-40 years old | 10 | 20.00 |
| 20–30 years old | 15 | 30.00 |
| Total | 50 | 100.00 |
| Average | 40.70 | |
| Std Dev | 12.86 |
The data in Table 11 illustrates that the largest group of passenger respondents belonged to the 20–30 years old category, consisting of 15 respondents or 30.00 percent of the total. Meanwhile, the 31–40 years old, 41–50 years old, and 51–59 years old categories each consisted of 10 respondents or 20.00 percent. The smallest group was composed of passengers aged 60 years and above, with 5 respondents or 10.00 percent. Taken together, passengers aged 20–40 years accounted for 50.00 percent of the respondents, while those aged 41 years and above likewise represented 50.00 percent, showing that the passenger sample included both younger and older adult groups.
The passengers had an average age of 40.70 years, with a standard deviation of 12.86, indicating that the typical respondent was a middle-aged adult while the relatively sizeable standard deviation reflects considerable variation in the ages represented. This distribution is noteworthy because no single age group overwhelmingly dominates the passenger population represented in the study. Although the 20–30-year-old category obtained the highest individual percentage at 30.00 percent, the remaining 70.00 percent were distributed across the older age categories. Consequently, the company's passenger services need to accommodate customers across a relatively broad age range.
The age distribution has practical implications for quality service and organizational agility. The 30.00 percent representation of passengers aged 20–30 years may indicate a substantial group that could be more receptive to digital booking, electronic payments, online announcements, mobile communication, and other technology-supported services. At the same time, the 10.00 percent who were 60 years old and above should not be overlooked, as older passengers may require clearer instructions, accessible facilities, additional assistance, and convenient customer-support mechanisms. The company may therefore consider maintaining both technology-enabled and personnel-assisted service channels rather than adopting a purely digital approach. Age-responsive customer assistance, clear travel information, accessible service facilities, and multiple communication platforms may help the company provide more inclusive services while improving responsiveness to the varying needs of its passengers.
| Gender | f | % |
|---|---|---|
| Male | 15 | 30.00 |
| Female | 35 | 70.00 |
| Total | 50 | 100.00 |
Table 12 highlights that the majority of the passenger respondents were female, accounting for 35 respondents or 70.00 percent, while 15 respondents or 30.00 percent were male. This represents a difference of 40 percentage points, indicating that female respondents comprised more than twice the proportion of male respondents in the passenger sample.
The predominance of female respondents suggests that the assessment of service quality from the passenger group reflects a greater numerical representation of women's experiences and perceptions. Nevertheless, the presence of 30.00 percent male respondents also ensures that the study captures perspectives from both groups. The distribution should be considered when interpreting subsequent findings on reliability, empathy, responsiveness, customer satisfaction, and other aspects of service delivery, since the overall passenger assessment will naturally be influenced more heavily by the larger female representation.
From a service-management perspective, the gender distribution also emphasizes the importance of maintaining services that address the safety, comfort, convenience, and accessibility requirements of all passengers. The company may examine whether facilities, waiting areas, sanitation facilities, boarding procedures, customer-assistance mechanisms, and safety measures sufficiently address different passenger needs. However, the 70.00 percent female representation should not be interpreted to mean that females necessarily constitute 70.00 percent of the company's entire passenger population unless the sample was specifically designed to proportionately represent actual passenger demographics. The company may therefore complement these findings with broader passenger records or periodic customer profiling to determine whether similar patterns exist across the wider clientele.
| Civil Status | f | % |
|---|---|---|
| Single | 10 | 20.00 |
| Married | 40 | 80.00 |
| Separated | 0 | 0.00 |
| Widow | 0 | 0.00 |
| Total | 50 | 100.00 |
From the data shown in Table 13, the majority of the passenger respondents were married, comprising 40 respondents or 80.00 percent, while 10 respondents or 20.00 percent were single. No respondents were identified as separated or widowed, with both categories accounting for 0 respondent or 0.00 percent. The findings therefore demonstrate a strong concentration of married passengers within the respondent group.
The 80.00 percent representation of married passengers may indicate that a substantial portion of the respondents have family-related responsibilities that can influence their travel decisions and service expectations. Married passengers may travel individually or with family members and may place considerable importance on schedule reliability, safety, convenience, adequate passenger information, and timely responses to concerns. The 20.00 percent single respondents, although smaller in proportion, also constitute an important passenger segment whose travel purposes and preferences may differ.
The distribution emphasizes that service planning should not rely solely on a uniform understanding of passenger needs. For instance, passengers traveling with spouses, children, or other family members may require different levels of assistance compared with those traveling alone. Reliable schedules and timely communication become especially important when passengers coordinate travel with work, family, accommodation, or connecting transportation arrangements. The company may therefore consider family-friendly facilities, accessible passenger information, efficient ticketing and boarding procedures, and timely notification of schedule changes as part of its service improvement strategies. At the same time, since 20.00 percent were single and other civil-status groups were not represented, service policies should remain inclusive rather than being designed primarily around the majority category.
| Nature of employment | f | % |
|---|---|---|
| Government employee | 10 | 20.00 |
| Self-employed | 15 | 30.00 |
| Private employee | 10 | 20.00 |
| Housewife/Househusband | 15 | 30.00 |
| Total | 50 | 100.00 |
The data in Table 14 illustrates that the passenger respondents came from different employment backgrounds. Self-employed passengers comprised 15 respondents or 30.00 percent, while housewives/househusbands likewise accounted for 15 respondents or 30.00 percent. Meanwhile, government employees consisted of 10 respondents or 20.00 percent, and private employees also represented 10 respondents or 20.00 percent. Thus, the two largest categories were self-employed individuals and housewives/househusbands, collectively representing 60.00 percent of the passenger respondents, while government and private employees jointly constituted the remaining 40.00 percent.
The relatively balanced distribution across the four employment categories indicates that the company's passenger services are experienced by individuals with varied socioeconomic and occupational circumstances. The 30.00 percent self-employed respondents may have travel needs associated with business, trade, personal transactions, or other livelihood activities, making schedule reliability and efficient transportation particularly relevant. Similarly, the 20.00 percent government employees and 20.00 percent private employees may have work-related time constraints that make punctual departures, clear schedules, and timely announcements important components of service quality. The 30.00 percent representation of housewives/househusbands further demonstrates that the company's passengers are not limited to formally employed individuals and may travel for family, household, personal, or other purposes.
This diversity suggests that service delivery should be sufficiently flexible to address different passenger circumstances. Delays, unclear schedules, or slow responses may have different consequences depending on the passenger's employment situation and reason for travel. A self-employed passenger, for example, may experience business-related consequences from travel disruptions, while employed passengers may have work schedules to meet. The company may therefore strengthen real-time schedule announcements, accessible customer-support channels, convenient booking mechanisms, and prompt notification systems. These measures can help improve organizational responsiveness and allow passengers from different employment backgrounds to make informed travel decisions.
| Type of Client | f | % |
|---|---|---|
| Government sector | 15 | 30.00 |
| Private sector | 35 | 70.00 |
| Total | 50 | 100.00 |
Table 15 highlights that the majority of the passenger respondents were classified under the private sector, consisting of 35 respondents or 70.00 percent, while 15 respondents or 30.00 percent belonged to the government sector. Thus, private-sector clients exceeded government-sector clients by 40 percentage points and accounted for more than two-thirds of the passenger respondents.
The predominance of private-sector passengers indicates that the company's passenger services are largely assessed in this study from the perspective of individuals associated with the private sector. Nevertheless, the 30.00 percent representation of government-sector clients demonstrates that the company also serves a meaningful proportion of passengers associated with government institutions. The presence of both groups suggests that Roble Shipping Co. caters to clients with potentially different travel requirements, schedules, documentation needs, and expectations regarding efficiency and reliability.
The 70.00 percent private-sector representation may encourage the company to continuously strengthen customer-oriented and competitive service practices, particularly in areas such as convenience, responsiveness, booking efficiency, customer communication, and schedule reliability. At the same time, the 30.00 percent government-sector representation may require attention to official travel requirements, documentation, receipts, billing procedures, and timely service. Maintaining consistent standards across both groups is essential because quality service should not depend on sector affiliation.
5.1.3Clients/shippers
This section presents the demographic and socioeconomic profile of the client respondents in terms of age, gender, civil status, nature of employment, and type of client. These characteristics are important in understanding the composition of the clients who transact with or avail themselves of the services of Roble Shipping Co. Since clients may differ in their personal circumstances, employment status, and sector affiliation, their expectations regarding service reliability, communication, responsiveness, convenience, documentation, and customer assistance may likewise vary. Describing their profile therefore provides an important background for interpreting their subsequent assessment of stakeholder engagement, organizational agility, and quality service.
The profile also helps determine whether the company is serving a relatively homogeneous or diverse client base. A diverse clientele may require more flexible service procedures, multiple communication channels, efficient customer-support mechanisms, and service strategies that respond to different expectations and transaction requirements. In the context of the present study, understanding the characteristics of the clients is particularly relevant because their perceptions can provide direct indications of how well the company performs in meeting stakeholder needs. These findings may consequently serve as a useful basis for identifying appropriate interventions that can be incorporated into the proposed Strategic Governance Program.
| Age | f | % |
|---|---|---|
| 60 years and up | 5 | 12.50 |
| 51-59 years old | 5 | 12.50 |
| 41-50 years old | 10 | 25.00 |
| 31-40 years old | 10 | 25.00 |
| 20–30 years old | 10 | 25.00 |
| Total | 40 | 100.00 |
| Average | 40.88 | |
| Std Dev | 12.25 |
The data in Table 16 illustrates that the client respondents were distributed across several age groups, with the categories 20–30 years old, 31–40 years old, and 41–50 years old each consisting of 10 respondents or 25.00 percent. Meanwhile, 5 respondents or 12.50 percent belonged to the 51–59 years old group, while another 5 respondents or 12.50 percent were 60 years old and above. Thus, respondents aged 20–50 years collectively represented 75.00 percent of the total clientele, while those aged 51 years and above comprised the remaining 25.00 percent.
The clients had an average age of 40.88 years, with a standard deviation of 12.25, indicating that the typical respondent was within the middle-adult age range while the relatively wide standard deviation reflects considerable diversity in age. The equal representation of the three younger and middle-age groups at 25.00 percent each suggests that no single age category overwhelmingly dominates the clientele. This distribution is advantageous for the study because the assessment of service quality reflects the experiences of clients belonging to different stages of adulthood.
The concentration of 75.00 percent of clients within the 20–50-year-old range may indicate a large proportion of economically active individuals who may value efficient transactions, prompt responses, convenient schedules, clear communication, and technology-supported services. At the same time, the combined 25.00 percent of clients aged 51 years and above demonstrates that the company also serves older customers whose needs may include additional assistance, clearer instructions, easier access to information, and more personalized service encounters. These differences highlight the importance of maintaining flexible service mechanisms that can accommodate varying levels of digital familiarity and customer preferences.
For the proposed Strategic Governance Program, the company may consider strengthening age-responsive customer-service strategies, such as maintaining both online and face-to-face transaction channels, providing clear and accessible service information, and ensuring that personnel are trained to assist clients with differing communication and service needs. Regular feedback may also be gathered across age groups so that emerging concerns can be identified and addressed promptly.
| Gender | f | % |
|---|---|---|
| Male | 15 | 37.50 |
| Female | 25 | 62.50 |
| Total | 40 | 100.00 |
Table 17 highlights that the majority of the client respondents were female, comprising 25 respondents or 62.50 percent, while 15 respondents or 37.50 percent were male. Female respondents therefore exceeded male respondents by 25 percentage points, indicating a moderately greater representation of women among the clients included in the study.
The predominance of female respondents suggests that the overall assessment of company services from the client group is influenced more heavily by female perceptions and experiences. However, the 37.50 percent male representation remains substantial and provides the study with perspectives from both groups. This distribution is important when examining service-related dimensions such as responsiveness, empathy, communication, reliability, and customer satisfaction because these perceptions are drawn from clients with different demographic backgrounds.
The finding also underscores the importance of ensuring that company services remain gender-responsive and inclusive. While numerical representation alone does not indicate different service requirements, the company may assess whether its facilities, communication practices, customer-assistance procedures, transaction processes, and safety measures are equally accessible and appropriate for all clients. In the context of strategic governance, service policies should be based on equitable treatment and should avoid assumptions that one gender has uniform expectations or needs.
An action that may be considered is the inclusion of gender-sensitive customer-feedback mechanisms so that the company can determine whether particular concerns are experienced more frequently by certain groups. Such information may help management improve service policies and ensure that customer-service initiatives are inclusive, fair, and responsive.
| Civil Status | f | % |
|---|---|---|
| Single | 10 | 25.00 |
| Married | 30 | 75.00 |
| Separated | 0 | 0.00 |
| Widow | 0 | 0.00 |
| Total | 40 | 100.00 |
From the data shown in Table 18, the majority of client respondents were married, comprising 30 respondents or 75.00 percent, while 10 respondents or 25.00 percent were single. No respondents were recorded under the separated and widowed categories, with each accounting for 0 respondent or 0.00 percent. The findings therefore indicate that three-fourths of the clients included in the study were married.
The 75.00 percent representation of married clients suggests that a considerable portion of the clientele may have family-related responsibilities that could influence their service preferences, transaction schedules, travel arrangements, and expectations regarding convenience and reliability. Married clients may place particular importance on timely communication, efficient processing, predictable schedules, and dependable service because delays or service disruptions may affect family obligations and coordinated activities. Meanwhile, the 25.00 percent single respondents represent another relevant segment whose travel and transaction patterns may differ.
The absence of separated and widowed respondents means that the findings cannot be generalized to these civil-status groups based on the current sample. Consequently, civil status should primarily be treated as a descriptive characteristic rather than a direct indicator of service expectations or satisfaction. The company should continue to design services based on actual customer requirements rather than presumed needs associated with marital status.
In terms of practical application, the company may enhance customer convenience through clear scheduling information, efficient transaction processes, timely notifications, and responsive support mechanisms. These initiatives can benefit clients regardless of civil status and can contribute to stronger perceptions of reliability and customer satisfaction.
| Nature of employment | f | % |
|---|---|---|
| Government employee | 10 | 25.00 |
| Self-employed | 10 | 25.00 |
| Private employee | 10 | 25.00 |
| Housewife/Househusband | 10 | 25.00 |
| Total | 40 | 100.00 |
The data in Table 19 illustrates that the client respondents were evenly distributed across the four identified employment categories. Government employees, self-employed individuals, private employees, and housewives/househusbands each accounted for 10 respondents or 25.00 percent. The distribution therefore reflects a perfectly balanced representation, with each occupational category comprising one-fourth of the total respondents.
The equal 25.00 percent representation across employment groups indicates that the client sample captures a broad range of socioeconomic and occupational circumstances rather than being dominated by a single type of employment. This diversity is important because employment circumstances may influence the urgency, frequency, and nature of transactions with the company. Government and private employees may have work schedules and official obligations that make punctual and efficient service important, while self-employed clients may have business or livelihood-related concerns that require reliable service and timely transactions. Housewives or househusbands may likewise have household and family-related responsibilities that can influence the importance of convenience and accessibility.
This balanced employment profile suggests that Roble Shipping Co. needs service systems that are sufficiently flexible to accommodate clients with different time constraints and transaction priorities. A uniform service model may not always respond equally well to the needs of all groups. Strengthening appointment or booking systems, customer-support channels, digital transactions, and timely announcements may therefore improve accessibility and convenience across employment categories.
The company may also consider gathering feedback according to employment group to determine whether particular service concerns are more pronounced among certain clients. Such information can help identify specific areas for improvement and may support the development of targeted strategies under the Strategic Governance Program.
| Type of Client | f | % |
|---|---|---|
| Government sector | 15 | 37.50 |
| Private sector | 25 | 62.50 |
| Total | 40 | 100.00 |
Table 20 highlights that the majority of the client respondents belonged to the private sector, consisting of 25 respondents or 62.50 percent, while 15 respondents or 37.50 percent were associated with the government sector. The private-sector group therefore exceeded the government-sector group by 25 percentage points.
The predominance of private-sector clients suggests that a larger share of the company's clientele represented in the study comes from the private sector. This may reflect the company's role in serving private individuals, businesses, or organizations that require transportation and related services. At the same time, the 37.50 percent government-sector representation is sufficiently substantial to indicate that government-affiliated clients also constitute an important stakeholder group.
The difference between these groups may have implications for service requirements. Private-sector clients may prioritize efficiency, flexibility, convenience, and competitiveness, while government-sector clients may also require complete documentation, official receipts, compliance with procedural requirements, and adherence to predetermined schedules. The company therefore needs to ensure that its service systems are capable of responding consistently to both groups while maintaining uniform standards of reliability and responsiveness.
5.2Level of stakeholder engagement and organizational agility
This section presents the respondents’ assessment of the level of stakeholder engagement and organizational agility of Roble Shipping Co. Stakeholder engagement is examined in terms of community participation, governance and NGO partnership, and customer feedback mechanisms, while organizational agility is assessed through innovation capability and adaptive capacity. These dimensions are important because they reflect how the company interacts with stakeholders, incorporates external and internal concerns into organizational processes, responds to changing conditions, and adjusts its resources and practices to sustain quality service.
Stakeholder engagement provides an indication of the extent to which the company encourages participation, listens to the concerns of affected groups, promotes transparency, establishes partnerships, and makes use of customer feedback. Strong engagement can help improve trust, accountability, and responsiveness because stakeholders are given opportunities to contribute information that may influence company decisions and service improvements. Organizational agility, on the other hand, reflects the company’s capacity to recognize changing customer expectations, market conditions, operational demands, and emerging technologies and then respond through innovation, flexibility, learning, and timely reallocation of resources. In a shipping organization, these capabilities are particularly relevant because service delivery can be affected by changing schedules, customer demands, operational disruptions, technological developments, and other external conditions. The findings presented in the succeeding tables therefore provide an important basis for determining existing organizational strengths and areas that may be strengthened through the proposed Strategic Governance Program.
| Indicator | Mean | SD | Description |
|---|---|---|---|
| 1. Ensures that people who are affected by a project or policy have a real voice in shaping decisions, | 3.20 | 0.8165 | Supported |
| 2. building trust, and creating shared long-term benefits | 3.20 | 0.7521 | Supported |
| 3. Share clear and honest information | 2.88 | 0.9021 | Supported |
| 4. Listen actively instead of just broadcasting messages | 2.96 | 0.6951 | Supported |
| 5. Reach out to vulnerable or under-represented groups | 3.15 | 0.5752 | Supported |
| Average weighted mean | 3.08 | Supported |
Note: Legend: 3.26 – 4.00 Highly supported, 2.51 – 3.25 Supported, 1.76 – 2.50 Slightly supported, 1.00 – 1.75 Not supported
The data in Table 21 illustrates that the respondents generally assessed community participation as Supported, obtaining an Average Weighted Mean of 3.08. All five indicators were likewise described as Supported, which indicates that the company demonstrates community participation practices to a noticeable extent, although the overall rating remains below the range classified as Highly Supported.
The highest mean of 3.20 was obtained by two indicators: ensuring that people affected by a project or policy have a real voice in shaping decisions, with a standard deviation of 0.8165, and building trust and creating shared long-term benefits, with a standard deviation of 0.7521. These findings suggest that respondents recognize the company’s efforts to involve relevant stakeholders in decision-related processes and to establish relationships grounded in trust and mutual benefit. The relatively moderate standard deviations indicate that while respondents generally agreed with these assessments, there was still some variation in their experiences or perceptions.
The indicator reaching out to vulnerable or under-represented groups obtained a mean of 3.15 and a standard deviation of 0.5752, also interpreted as Supported. This comparatively lower standard deviation shows greater consistency among respondents in recognizing the company’s efforts to include groups that may otherwise have limited participation. Meanwhile, the statement regarding active listening instead of merely broadcasting messages recorded a mean of 2.96 with a standard deviation of 0.6951, while sharing clear and honest information obtained the lowest mean of 2.88 and the highest standard deviation of 0.9021.
The lowest rating for clear and honest information points to an important area for attention. Although the indicator is still classified as Supported, its mean of 2.88 is notably below the highest score of 3.20, suggesting that transparency and consistency of information may not always be experienced equally by stakeholders. The relatively high standard deviation of 0.9021 further indicates differing perceptions among respondents. Some may have experienced effective communication, while others may have encountered incomplete, delayed, or unclear information.
The overall Average Weighted Mean of 3.08 therefore reflects a positive but not yet highly established level of community participation. The company appears to have a foundation for stakeholder involvement, particularly in providing opportunities for participation and building trust, but there remains room to improve transparency, active listening, and inclusive consultation. As an action to consider, Roble Shipping Co. may institutionalize regular stakeholder consultations, public or customer information updates, feedback forums, and documented mechanisms for showing how stakeholder inputs are incorporated into decisions. Strengthening these practices can help elevate community participation from merely Supported toward Highly Supported and can reinforce the credibility and inclusiveness of the proposed Strategic Governance Program.
| Indicator | Mean | SD | Description |
|---|---|---|---|
| 1. Collaborative process where state bodies and civil society work together to shape policies | 3.18 | 0.7437 | Supported |
| 2. design programs, and share accountability | 3.09 | 0.6211 | Supported |
| 3. moves relationships from basic public consultation to active co-creation and shared decision-making | 3.04 | 0.5847 | Supported |
| 4. Involve marginalized and local groups early so all voices are heard | 2.96 | 0.5847 | Supported |
| 5. Share clear data and project goals openly to build trust | 3.11 | 0.6340 | Supported |
| Average weighted mean | 3.08 | Supported |
Note: Legend: 3.26 – 4.00 Highly supported, 2.51 – 3.25 Supported, 1.76 – 2.50 Slightly supported, 1.00 – 1.75 Not supported
Table 22 highlights that governance and NGO partnership obtained an Average Weighted Mean of 3.08, interpreted as Supported. All five indicators fell within the Supported range, demonstrating that respondents generally acknowledge the presence of collaborative and participatory governance practices, although none of the indicators reached the Highly Supported classification.
The highest mean of 3.18, with a standard deviation of 0.7437, was recorded for the statement describing a collaborative process where state bodies and civil society work together to shape policies. This indicates that respondents perceive meaningful potential or existing practice for cooperative engagement among the company, government institutions, and civil society organizations. Such partnerships can contribute to more responsive governance by allowing various sectors to contribute knowledge, perspectives, and resources in addressing organizational and community concerns.
The indicator on sharing clear data and project goals openly to build trust followed with a mean of 3.11 and a standard deviation of 0.6340, while designing programs and sharing accountability obtained a mean of 3.09 and a standard deviation of 0.6211. These findings indicate that respondents recognize collaborative practices related to information sharing and shared responsibility. Similarly, the movement from basic consultation toward active co-creation and shared decision-making obtained a mean of 3.04, with a standard deviation of 0.5847, showing a generally consistent perception that more participatory forms of engagement are present to some extent.
The lowest mean of 2.96, with a standard deviation of 0.5847, was recorded for involving marginalized and local groups early so that all voices are heard. Although still interpreted as Supported, this finding suggests that early inclusion of local and underrepresented groups is comparatively less established than the other governance-related practices. This can become a concern because stakeholder participation is more meaningful when affected groups are involved before major decisions are finalized rather than only after programs or policies have already been developed.
With an overall mean of 3.08, governance and NGO partnership can be characterized as present but still capable of further development. The gap between the current Supported level and the Highly Supported category implies the need for more institutionalized partnerships, clearer coordination mechanisms, and broader stakeholder representation. The company may consider establishing formal partnership protocols, regular coordination meetings, joint community or service initiatives, and mechanisms for involving local organizations and marginalized groups during the planning stage. These actions can strengthen transparency, shared accountability, and collaborative governance and may ultimately improve the company’s responsiveness to broader stakeholder concerns.
| Indicator | Mean | SD | Description |
|---|---|---|---|
| 1. Blends active listening with responsive action | 2.88 | 0.9021 | Supported |
| 2. Turns one-way data collection into a two-way dialogue | 2.95 | 0.6723 | Supported |
| 3. To build trust, refine products, and improve overall satisfaction | 3.07 | 0.5904 | Supported |
| 4. Partner with loyal users for long-term product planning and strategic insight | 3.16 | 0.6470 | Supported |
| 5. Meet users where they prefer to talk, whether via email, in-app prompts, or support chats | 3.11 | 0.6340 | Supported |
| Average weighted mean | 3.03 | Supported |
Note: Legend: 3.26 – 4.00 Highly supported, 2.51 – 3.25 Supported, 1.76 – 2.50 Slightly supported, 1.00 – 1.75 Not supported
From the data shown in Table 23, customer feedback mechanisms obtained an Average Weighted Mean of 3.03, interpreted as Supported. Although all five indicators were rated within the Supported range, this dimension obtained the lowest overall mean among the three stakeholder engagement components, suggesting that customer feedback practices may require comparatively greater strengthening.
The highest-rated indicator was partnering with loyal users for long-term product planning and strategic insight, with a mean of 3.16 and a standard deviation of 0.6470. This finding indicates that respondents recognize the value or presence of sustained engagement with customers who have established experience with the company. Such customers may provide useful information regarding recurring service concerns, emerging expectations, and possible improvements.
The statement meeting users where they prefer to communicate, whether through email, in-app prompts, or support chats, obtained a mean of 3.11 and a standard deviation of 0.6340, while the use of feedback to build trust, refine products, and improve overall satisfaction received a mean of 3.07 and a standard deviation of 0.5904. These ratings suggest that respondents generally perceive the company as recognizing the importance of multiple communication channels and the use of feedback for service improvement.
However, the indicator turning one-way data collection into a two-way dialogue obtained a comparatively lower mean of 2.95, with a standard deviation of 0.6723, while blending active listening with responsive action recorded the lowest mean of 2.88 and the highest standard deviation of 0.9021. The latter finding is particularly important because feedback mechanisms become more meaningful when customer comments lead to observable action. A system that merely collects complaints or suggestions without visibly responding to them may weaken customer confidence in the feedback process.
The overall mean of 3.03 shows that customer feedback mechanisms are functioning at a Supported level but are not yet strongly embedded as a highly responsive two-way communication system. The relatively low score for active listening and responsive action suggests a gap between receiving customer feedback and demonstrating how that feedback influences decisions or service improvements. The company may therefore establish more structured feedback loops, define response timelines, assign personnel responsible for handling customer concerns, monitor recurring complaints, and inform customers about actions taken in response to their suggestions. These measures can transform feedback from a passive information-gathering activity into an active governance mechanism that strengthens trust and customer satisfaction.
| Indicator | Mean | SD | Description |
|---|---|---|---|
| 1. Allows a company to rapidly sense market shifts, reconfigure resources, and execute creative ideas | 3.10 | 0.6749 | Supported |
| 2. replacing rigid bureaucracy with cross-functional collaboration | 3.20 | 0.6228 | Supported |
| 3. continuous learning, and fast, value-driven decision-making | 3.24 | 0.5964 | Supported |
| 4. Proactively scanning market data, customer needs, and tech trends to catch early signals | 3.30 | 0.5496 | Highly supported |
| 5. Treating product discovery and project iteration as ongoing habits rather than one-time phases | 3.10 | 0.6443 | Supported |
| Average weighted mean | 3.19 | Supported |
Note: Legend: 3.26 – 4.00 Highly supported, 2.51 – 3.25 Supported, 1.76 – 2.50 Slightly supported, 1.00 – 1.75 Not supported
The data in Table 24 illustrates that the respondents assessed innovation capability as Supported, with an Average Weighted Mean of 3.19. Among all dimensions presented in this section, innovation capability obtained the highest overall mean, indicating that it represents a comparatively stronger aspect of the company’s organizational agility.
The highest-rated indicator was proactively scanning market data, customer needs, and technological trends to identify early signals, which obtained a mean of 3.30 and a standard deviation of 0.5496 and was the only indicator classified as Highly Supported. This finding suggests that respondents recognize the company’s capacity to monitor changes in its environment and identify emerging developments that may affect operations or customer expectations. The relatively low standard deviation further indicates that respondents were generally consistent in this assessment.
The next highest indicator was continuous learning and fast, value-driven decision-making, with a mean of 3.24 and a standard deviation of 0.5964, narrowly below the Highly Supported range. This suggests that learning and timely decision-making are already relatively strong practices but may still require further reinforcement to become more consistently embedded across the organization.
The statement regarding replacing rigid bureaucracy with cross-functional collaboration obtained a mean of 3.20 and a standard deviation of 0.6228, indicating support for collaborative structures that can facilitate faster responses and reduce unnecessary procedural delays. Meanwhile, the indicators on rapidly sensing market shifts, reconfiguring resources, and executing creative ideas, and treating product discovery and project iteration as ongoing habits, each obtained a mean of 3.10, with standard deviations of 0.6749 and 0.6443, respectively.
The overall mean of 3.19 places innovation capability close to the Highly Supported threshold of 3.26. This suggests that Roble Shipping Co. already possesses several favorable innovation-related practices, especially environmental scanning and continuous learning. However, the lower means associated with executing creative ideas and maintaining continuous project iteration imply that the organization may be stronger at identifying changes than at consistently converting observations into sustained innovation initiatives.
As an action to consider, the company may strengthen innovation by creating cross-functional improvement teams, encouraging employees to propose and test service innovations, establishing regular review of customer and market trends, and allocating resources for pilot projects and digital service improvements. These measures can help transform environmental awareness into actual operational innovation and may raise the company’s innovation capability from Supported to Highly Supported.
| Indicator | Mean | SD | Description |
|---|---|---|---|
| 1. Provides the speed, flexibility, and resource reconfiguration needed to turn environmental awareness into swift, effective structural responses during market shifts or crises | 3.03 | 0.6584 | Supported |
| 2. Represents the deep, long-term systemic ability to survive, learn, and fundamentally transform when unexpected disruptions challenge core boundaries | 2.88 | 0.9021 | Supported |
| 3. Empowering local teams to act without waiting for top-down approval. | 2.96 | 0.6182 | Supported |
| 4. Moving talent, money, and tech quickly to new priorities | 3.11 | 0.5486 | Supported |
| 5. Building a culture that values quick experimentation over rigid planning | 3.16 | 0.6470 | Supported |
| Average weighted mean | 3.03 | Supported |
Note: Legend: 3.26 – 4.00 Highly supported, 2.51 – 3.25 Supported, 1.76 – 2.50 Slightly supported, 1.00 – 1.75 Not supported
Table 25 highlights that adaptive capacity obtained an Average Weighted Mean of 3.03, interpreted as Supported. All five indicators were classified as Supported, suggesting that the company demonstrates flexibility and responsiveness to changing conditions, although the overall level indicates that adaptive practices are not yet consistently strong enough to fall within the Highly Supported category.
The highest mean of 3.16, with a standard deviation of 0.6470, was obtained by building a culture that values quick experimentation over rigid planning. This finding suggests that respondents generally perceive some openness toward trying new approaches when existing methods may no longer be sufficient. Such a culture can be important in a shipping organization where disruptions, customer expectations, technological developments, and operational demands may require timely adjustments.
The indicator moving talent, money, and technology quickly to new priorities obtained a mean of 3.11 and a relatively low standard deviation of 0.5486, indicating a fairly consistent perception that the company is capable of reallocating resources when necessary. Meanwhile, the ability to provide speed, flexibility, and resource reconfiguration needed to respond to market shifts or crises obtained a mean of 3.03 with a standard deviation of 0.6584.
The statement on empowering local teams to act without waiting for top-down approval received a lower mean of 2.96 and a standard deviation of 0.6182. This finding indicates that although some decision-making flexibility exists, there may still be dependence on centralized approval structures. Such dependence can slow organizational responses, particularly in situations that require immediate operational decisions.
The lowest-rated indicator was the organization’s deep, long-term ability to survive, learn, and fundamentally transform when unexpected disruptions challenge core boundaries, which obtained a mean of 2.88 and the highest standard deviation of 0.9021. Although the rating remains Supported, it points to a potentially important gap in long-term resilience and transformative capacity. The relatively large standard deviation suggests that respondents do not experience this capability uniformly across the organization.
The overall mean of 3.03 indicates that adaptive capacity is present but requires further strengthening. Particular attention may be given to decentralizing appropriate operational decisions, strengthening crisis-response protocols, conducting scenario planning, cross-training personnel, maintaining contingency resources, and regularly evaluating lessons learned from disruptions. These measures can help the organization move beyond short-term adjustment toward a more sustained capacity to learn, recover, and transform when confronted with significant changes.
| Dimension | TWM | Description |
|---|---|---|
| Stakeholder engagement | ||
| Community participation | 3.08 | Supported |
| Governance and NGO partnership | 3.08 | Supported |
| Customer feedback mechanisms | 3.03 | Supported |
| Organizational agility | ||
| Innovation capability | 3.19 | Supported |
| Adaptive capacity | 3.03 | Supported |
| Average TWM | 3.08 | Supported |
Table 26 presents the summary on stakeholder engagement and organizational agility. Strong engagement can help improve trust, accountability, and responsiveness because stakeholders are given opportunities to contribute information that may influence company decisions and service improvements. In a shipping organization, these capabilities are particularly relevant because service delivery can be affected by changing schedules, customer demands, operational disruptions, technological developments, and other external conditions. The findings presented in the succeeding tables therefore provide an important basis for determining existing organizational strengths and areas that may be strengthened through the proposed Strategic Governance Program.
5.3Quality service delivery in terms of key performance indicators (KPIs)
This section presents the respondents’ assessment of the quality of service delivery of Roble Shipping Co. based on selected Key Performance Indicators (KPIs), specifically the level of service, average speed of responses, observance of schedule, and response time. These indicators are important because they provide a practical view of how effectively the company delivers services, responds to customer concerns, follows established timelines, and manages service-related transactions. In a shipping company, service quality is not limited to the completion of transportation activities; it also involves the manner and speed by which customer inquiries are addressed, concerns are resolved, schedules are observed, and service commitments are fulfilled.
The findings in this section are particularly significant because they show whether service-related practices are consistently carried out at a level that satisfies stakeholder expectations. High performance in these areas may contribute to greater trust, customer satisfaction, operational efficiency, and organizational credibility. Conversely, moderate or low ratings may indicate areas where processes, staffing, communication systems, or monitoring mechanisms need to be improved. The succeeding tables therefore provide a detailed picture of the present condition of service delivery and may serve as a basis for identifying specific actions to be incorporated into the proposed Strategic Governance Program.
| Indicator | Mean | SD | Description |
|---|---|---|---|
| 1. the team answers a customer call, chat, or email | 2.69 | 0.4655 | Moderately Carried-Out |
| 2. The time it takes to completely fix a customer issue | 2.74 | 0.6458 | Moderately Carried-Out |
| 3. Satisfaction they are with the service. | 2.72 | 0.5615 | Moderately Carried-Out |
| 4. Percentage of problems solved on the very first try without extra follow-ups. | 2.69 | 0.5929 | Moderately Carried-Out |
| 5. Comfort or satisfaction the customer to get help. | 2.59 | 0.4948 | Moderately Carried-Out |
| Average weighted mean | 2.69 | Moderately Carried-Out |
Note: Legend: 3.26 – 4.00 Very Well Carried-Out, 2.51 – 3.25 Moderately Carried-Out, 1.76 – 2.50 Poorly Carried-Out, 1.00 – 1.75 Not Carried-Out
The data in Table 27 illustrates that the level of service obtained an Average Weighted Mean of 2.69, interpreted as Moderately Carried-Out. All five indicators likewise fell within the Moderately Carried-Out category, indicating that the company demonstrates the identified service practices to a reasonable extent, although these practices are not yet consistently implemented at the Very Well Carried-Out level.
The highest mean of 2.74, with a standard deviation of 0.6458, was recorded for the indicator referring to the time it takes to completely resolve a customer issue. This suggests that respondents generally recognize the company’s efforts to address customer concerns and bring service-related issues to completion. However, because the mean remains within the moderate range, there is still room to improve the speed, consistency, and completeness of issue resolution.
The indicator on customer satisfaction with the service obtained a mean of 2.72 and a standard deviation of 0.5615, showing that respondents generally perceive satisfaction-related service outcomes as moderately carried out. Meanwhile, both answering customer calls, chats, or emails and the percentage of problems solved on the first attempt without additional follow-up obtained a mean of 2.69. Their standard deviations of 0.4655 and 0.5929, respectively, indicate a relatively consistent but not uniform experience among respondents.
The lowest mean of 2.59, with a standard deviation of 0.4948, was recorded for the indicator concerning the comfort or satisfaction of customers when seeking help. Although this remains within the Moderately Carried-Out classification, it suggests that customer assistance may not always be experienced as convenient, comfortable, or sufficiently supportive. Since customer encounters often shape perceptions of service quality, even small difficulties in obtaining assistance may affect overall satisfaction.
The overall mean of 2.69 indicates that the level of service is functioning at an acceptable but not yet highly effective level. The gap between the present rating and the Very Well Carried-Out range suggests a need for the company to strengthen customer assistance, first-contact resolution, follow-up procedures, and issue-resolution timelines. As an action to consider, the company may establish clearer service standards, customer-handling protocols, response monitoring, and escalation procedures for unresolved concerns. These measures can help improve consistency and move the level of service from moderately carried out toward a more highly developed level of performance.
| Indicator | Mean | SD | Description |
|---|---|---|---|
| 1. answering within 20 to 30 seconds | 2.72 | 0.5615 | Moderately Carried-Out |
| 2. For live chat, aim for under 30 seconds | 2.70 | 0.6611 | Moderately Carried-Out |
| 3. for emails, target a 24-hour maximum | 2.72 | 0.5615 | Moderately Carried-Out |
| 4. often tracked as the 80/20 rule: 80% of calls answered | 2.69 | 0.5929 | Moderately Carried-Out |
| 5. Track live dashboards to move staff when wait times go up | 2.56 | 0.4997 | Moderately Carried-Out |
| Average weighted mean | 2.68 | Moderately Carried-Out |
Note: Legend: 3.26 – 4.00 Very Well Carried-Out, 2.51 – 3.25 Moderately Carried-Out, 1.76 – 2.50 Poorly Carried-Out, 1.00 – 1.75 Not Carried-Out
Table 28 highlights that the average speed of responses obtained an Average Weighted Mean of 2.68, interpreted as Moderately Carried-Out. All indicators remained within the same descriptive category, suggesting that the company demonstrates reasonable response practices but still has considerable room for improvement in ensuring faster and more consistent communication.
Two indicators obtained the highest mean of 2.72: answering within 20 to 30 seconds and responding to emails within a maximum of 24 hours. Both recorded a standard deviation of 0.5615, indicating moderately consistent perceptions among the respondents. These findings suggest that the company has some capacity to respond within expected time frames, although the ratings do not indicate that these response targets are being achieved at a very high level.
The indicator on live chat responses within 30 seconds obtained a mean of 2.70 and a standard deviation of 0.6611, while the 80/20 rule, in which 80 percent of calls are answered within a specified time, obtained a mean of 2.69 and a standard deviation of 0.5929. These results indicate that response speed is being observed to some extent but may not always be consistent across channels or situations.
The lowest mean of 2.56, with a standard deviation of 0.4997, was recorded for tracking live dashboards to redeploy staff when waiting times increase. This finding points to a more specific operational gap. While basic response practices appear to be present, real-time monitoring and dynamic staff allocation may not yet be fully utilized. In a service environment where customer demand can fluctuate, the absence of effective live monitoring may contribute to longer waiting times and slower responses during peak periods.
The overall mean of 2.68 suggests that response speed is moderately practiced but not yet optimized. The company may therefore consider using real-time monitoring tools, queue-management systems, automated alerts, and staffing adjustments during peak demand periods. Establishing measurable response-time targets and regularly reviewing actual performance against these targets may also help management identify recurring delays. Strengthening these practices can improve customer confidence and enhance perceptions of responsiveness and efficiency.
| Indicator | Mean | SD | Description |
|---|---|---|---|
| 1. Percentage of services or orders completed on or before the agreed date. | 2.77 | 0.5816 | Moderately Carried-Out |
| 2. The degree to which staff or operations follow the exact planned timeline and shift blocks. | 2.70 | 0.6611 | Moderately Carried-Out |
| 3. Average total time required to execute a service request from start to finish. | 2.68 | 0.5772 | Moderately Carried-Out |
| 4. Frequency of meeting or beating contractual time milestones | 2.71 | 0.5853 | Moderately Carried-Out |
| 5. Percentage of tasks completed correctly or issues resolved on the very first attempt without rework | 2.89 | 0.5697 | Moderately Carried-Out |
| Average weighted mean | 2.75 | Moderately Carried-Out |
Note: Legend: 3.26 – 4.00 Very Well Carried-Out, 2.51 – 3.25 Moderately Carried-Out, 1.76 – 2.50 Poorly Carried-Out, 1.00 – 1.75 Not Carried-Out
From the data shown in Table 29, observance of schedule obtained an Average Weighted Mean of 2.75, interpreted as Moderately Carried-Out. Among the four KPI dimensions, this obtained the highest overall mean, suggesting that schedule-related practices are relatively stronger compared with the other areas of service delivery, although they have not yet reached the Very Well Carried-Out level.
The highest-rated indicator was the percentage of tasks completed correctly or issues resolved on the first attempt without rework, which obtained a mean of 2.89 and a standard deviation of 0.5697. This suggests that respondents generally perceive a reasonable degree of accuracy and task completion within the expected process. Reducing rework is important because repeated corrections or unresolved concerns can cause delays and affect service reliability.
The percentage of services or orders completed on or before the agreed date obtained a mean of 2.77 with a standard deviation of 0.5816, while the frequency of meeting or exceeding contractual time milestones obtained a mean of 2.71 and a standard deviation of 0.5853. These findings indicate that schedule adherence is generally present but not consistently achieved at an optimal level.
The indicator describing the extent to which staff or operations follow the exact planned timeline and shift blocks recorded a mean of 2.70 and a standard deviation of 0.6611. The lowest mean of 2.68, with a standard deviation of 0.5772, was obtained for the average total time required to execute a service request from start to finish. Although all indicators remain within the moderate range, the relatively lower rating for total service execution time suggests that some processes may still experience delays or inefficiencies.
The overall mean of 2.75 indicates that observance of schedule is one of the stronger service areas, but the moderate rating also shows that schedule compliance is not yet consistently excellent. The company may consider strengthening timetable monitoring, coordination among operational units, early identification of potential delays, and contingency planning. Regular review of delayed transactions and the reasons behind missed timelines can also help management identify recurring bottlenecks. Improving schedule observance is particularly important in shipping operations because delays can affect passenger plans, cargo movement, customer trust, and the company’s overall reputation for reliability.
| Indicator | Mean | SD | Description |
|---|---|---|---|
| 1. total time from when a customer sends a message until an agent sends the very first reply | 2.70 | 0.6080 | Moderately Carried-Out |
| 2. total duration from the initial customer ticket creation | 2.72 | 0.5615 | Moderately Carried-Out |
| 3. Help agents learn the software and product details well to work faster. | 2.78 | 0.5564 | Moderately Carried-Out |
| 4. Send instant messages to let users know you received their request. | 2.61 | 0.4902 | Moderately Carried-Out |
| 5. percentage of support tickets answered within the agreed target time limits | 2.69 | 0.5929 | Moderately Carried-Out |
| Average weighted mean | 2.70 | Moderately Carried-Out |
Note: Legend: 3.26 – 4.00 Very Well Carried-Out, 2.51 – 3.25 Moderately Carried-Out, 1.76 – 2.50 Poorly Carried-Out, 1.00 – 1.75 Not Carried-Out
The data in Table 30 illustrates that response time obtained an Average Weighted Mean of 2.70, interpreted as Moderately Carried-Out. All five indicators also fell within the Moderately Carried-Out range, indicating that the company has established response-related practices but may not yet implement them with sufficient speed and consistency to achieve a higher performance classification.
The highest mean of 2.78, with a standard deviation of 0.5564, was obtained for the indicator on helping agents learn the software and product details well enough to work faster. This suggests that respondents recognize the importance of employee knowledge and system familiarity in improving response efficiency. Well-trained personnel are generally better able to answer questions accurately and complete transactions without unnecessary delays.
The total duration from the initial creation of a customer ticket obtained a mean of 2.72 and a standard deviation of 0.5615, while the total time from when a customer sends a message until an agent provides the first response obtained a mean of 2.70 and a standard deviation of 0.6080. These findings suggest that initial-response and ticket-handling processes are moderately functioning but could still be improved through stronger workflow management and more responsive customer-support systems.
The percentage of support tickets answered within agreed target time limits obtained a mean of 2.69 and a standard deviation of 0.5929. The lowest mean of 2.61, with a standard deviation of 0.4902, was recorded for sending instant messages to acknowledge that a customer request has been received. This relatively low score suggests that customers may not always receive immediate confirmation after submitting a concern. Even when full resolution requires more time, a prompt acknowledgment can help reassure customers that their request has been received and is being processed.
The overall mean of 2.70 indicates that response time is moderately carried out but requires further improvement. The company may consider introducing automated acknowledgment messages, ticket-number systems, response-time targets, priority classification of concerns, and monitoring dashboards. Training personnel on service software and product knowledge should also be continued because the highest-rated indicator suggests that knowledge and system familiarity are recognized as important contributors to faster service. These actions may help reduce waiting time and improve customer confidence in the company’s responsiveness.
| Indicator | TWM | Description |
|---|---|---|
| Level of service | 2.69 | Moderately Carried-Out |
| Average speed of responses | 2.68 | Moderately Carried-Out |
| Observance of schedule | 2.75 | Moderately Carried-Out |
| Time response | 2.70 | Moderately Carried-Out |
| Average TWM | 2.71 | Moderately Carried-Out |
Table 31 presents the summary on quality service delivery in terms of KPIs. The findings in this section are particularly significant because they show whether service-related practices are consistently carried out at a level that satisfies stakeholder expectations. High performance in these areas may contribute to greater trust, customer satisfaction, operational efficiency, and organizational credibility. Conversely, moderate or low ratings may indicate areas where processes, staffing, communication systems, or monitoring mechanisms need to be improved. The succeeding tables therefore provide a detailed picture of the present condition of service delivery and may serve as a basis for identifying specific actions to be incorporated into the proposed Strategic Governance Program.
5.4Status of quality service
This section presents the respondents’ assessment of the status of quality service of Roble Shipping Co. in terms of reliability, empathy, responsiveness, and customer satisfaction. These dimensions provide a broader view of how customers experience the company's services beyond operational measures alone. Reliability reflects the extent to which the company consistently fulfills its commitments and resolves concerns dependably; empathy focuses on the ability of personnel to understand customer feelings, circumstances, and individual needs; responsiveness refers to the promptness and willingness of employees to attend to customer concerns; while customer satisfaction reflects the overall degree to which service experiences meet customer expectations.
Assessing these dimensions is important because quality service is shaped not only by whether a service is completed but also by how customers are treated throughout the process. A company may deliver its core service, yet customers can still form unfavorable perceptions if communication is delayed, concerns are not acknowledged, or personnel appear indifferent. Conversely, dependable service, attentive interaction, timely assistance, and a sense of safety can strengthen trust and encourage repeat patronage. The findings in the succeeding tables therefore provide an important basis for identifying areas where the company is performing favorably and aspects that require further attention under the proposed Strategic Governance Program.
| Indicator | Mean | SD | Description |
|---|---|---|---|
| 1. Customers feel safe and secure when a brand keeps its word | 2.88 | 0.9021 | Agree |
| 2. People return to companies they know they can count on | 2.95 | 0.6723 | Agree |
| 3. less time spent on fixes and refunds | 3.07 | 0.5904 | Agree |
| 4. Delivering the same high standard of work over and over | 3.16 | 0.6470 | Agree |
| 5. Fixing mistakes fast and with genuine care when things go wrong | 3.11 | 0.6340 | Agree |
| Average weighted mean | 3.03 | Agree |
Note: Legend: 3.26 – 4.00 Strongly Agree, 2.51 – 3.25 Agree, 1.76 – 2.50 Disagree, 1.00 – 1.75 Strongly Disagree
The data in Table 32 illustrates that the respondents generally Agreed that reliability is evident in the quality of service provided by the company, as reflected in an Average Weighted Mean of 3.03. All five indicators were likewise interpreted as Agree, suggesting that respondents recognize the company as reasonably dependable in fulfilling service commitments, maintaining standards, and addressing service problems.
The highest-rated indicator was delivering the same high standard of work consistently, with a mean of 3.16 and a standard deviation of 0.6470. This suggests that respondents perceive a reasonable level of consistency in how the company performs its services. Consistency is an important component of reliability because customers tend to develop greater trust when they can expect similar levels of service across different transactions or service encounters.
The indicator fixing mistakes quickly and with genuine care when problems occur followed with a mean of 3.11 and a standard deviation of 0.6340. This indicates that respondents generally acknowledge the company’s efforts to respond constructively when service failures arise. Similarly, less time spent on fixes and refunds obtained a mean of 3.07 and a standard deviation of 0.5904, suggesting that the company has some capability to reduce the burden associated with service corrections.
The indicator people return to companies they know they can count on obtained a mean of 2.95 and a standard deviation of 0.6723, while the lowest mean of 2.88, with the highest standard deviation of 0.9021, was recorded for customers feeling safe and secure when a brand keeps its word. Although both indicators remain within the Agree range, the comparatively lower ratings suggest that confidence in service promises and the sense of security derived from dependable performance may not yet be uniformly strong across all respondents.
The overall mean of 3.03 indicates that reliability is positively perceived but remains below the Strongly Agree level. The comparatively low score for keeping promises and fostering a sense of security points to a need for more consistent fulfillment of commitments, clearer communication of service expectations, and stronger follow-through when delays or disruptions occur. The company may therefore consider strengthening service guarantees, communication protocols, tracking of unresolved concerns, and corrective-action procedures. Doing so may help reinforce customer trust and move reliability from an agreed level toward a more strongly established perception of dependable service.
| Indicator | Mean | SD | Description |
|---|---|---|---|
| 1. Sensing and acknowledging the emotional weight or frustration behind a customer's words. | 3.20 | 0.6816 | Agree |
| 2. Understanding the customer's point of view, logic, and situational context | 3.16 | 0.5812 | Agree |
| 3. Letting the customer speak fully without interruption, reducing distractions, | 3.25 | 0.5925 | Agree |
| 4. Recognizing unique customer preferences and specific | 3.21 | 0.5183 | Agree |
| 5. Calms upset clients quickly, making them more receptive to practical solutions. | 3.17 | 0.6522 | Agree |
| Average weighted mean | 3.20 | Agree |
Note: Legend: 3.26 – 4.00 Strongly Agree, 2.51 – 3.25 Agree, 1.76 – 2.50 Disagree, 1.00 – 1.75 Strongly Disagree
Table 33 highlights that empathy obtained an Average Weighted Mean of 3.20, interpreted as Agree. Among the four dimensions of quality service, empathy obtained the highest overall mean, indicating that respondents generally perceive personnel as considerate, attentive, and responsive to customer feelings and individual circumstances.
The highest-rated indicator was allowing the customer to speak fully without interruption and reducing distractions, with a mean of 3.25 and a standard deviation of 0.5925. This result is particularly notable because the mean is only slightly below the Strongly Agree threshold of 3.26. It suggests that attentive listening is one of the stronger aspects of the company’s customer-service interaction.
The indicator recognizing unique customer preferences and specific needs obtained a mean of 3.21 with a standard deviation of 0.5183, reflecting relatively consistent agreement among respondents. Likewise, sensing and acknowledging the emotional weight or frustration behind a customer’s words received a mean of 3.20 and a standard deviation of 0.6816. These findings suggest that personnel generally demonstrate sensitivity to the emotional and situational concerns of customers.
The statement on calming upset clients quickly and making them more receptive to practical solutions obtained a mean of 3.17 and a standard deviation of 0.6522, while understanding the customer’s point of view, logic, and situational context received the lowest mean of 3.16 with a standard deviation of 0.5812. Despite being the lowest, the rating remains relatively high and reinforces the overall positive assessment of empathy.
The overall mean of 3.20 demonstrates that empathy is one of the company’s more favorable service-quality characteristics. However, since the rating still falls within Agree rather than Strongly Agree, there remains room to make customer-centered interaction more consistent. The company may strengthen empathy through continuous training in active listening, emotional intelligence, conflict management, personalized communication, and service recovery. Reinforcing these competencies can help ensure that customers not only receive solutions but also feel heard, respected, and understood throughout the service process.
| Indicator | Mean | SD | Description |
|---|---|---|---|
| 1. Answering emails, chats, or calls in a short time | 3.04 | 0.6655 | Agree |
| 2. Giving realistic wait times or delivery windows | 2.96 | 0.9526 | Agree |
| 3. Starting work on a request right away instead of putting it off | 2.97 | 0.6269 | Agree |
| 4. Informing customers about the status of an ongoing issue | 3.10 | 0.5412 | Agree |
| 5. Give workers the power to fix problems on the spot | 3.11 | 0.6178 | Agree |
| Average weighted mean | 3.04 | Agree |
Note: Legend: 3.26 – 4.00 Strongly Agree, 2.51 – 3.25 Agree, 1.76 – 2.50 Disagree, 1.00 – 1.75 Strongly Disagree
From the data shown in Table 34, responsiveness obtained an Average Weighted Mean of 3.04, interpreted as Agree. All indicators were also rated within the Agree category, indicating that respondents generally perceive the company as willing and reasonably able to respond to customer requests and concerns, although responsiveness is not yet consistently experienced at the strongest possible level.
The highest mean of 3.11, with a standard deviation of 0.6178, was recorded for giving workers the authority to fix problems on the spot. This suggests that respondents recognize the value or presence of some level of employee empowerment in resolving customer concerns. Immediate problem-solving can reduce delays and prevent customers from being passed unnecessarily between personnel or departments.
The indicator informing customers about the status of an ongoing issue obtained a mean of 3.10 and a standard deviation of 0.5412, demonstrating relatively consistent agreement that customers are kept updated to some extent. Meanwhile, answering emails, chats, or calls within a short period obtained a mean of 3.04 and a standard deviation of 0.6655.
The indicator starting work on a request immediately instead of postponing it obtained a mean of 2.97 and a standard deviation of 0.6269. The lowest mean of 2.96, accompanied by the highest standard deviation of 0.9526, was recorded for giving realistic waiting times or delivery windows. The relatively high standard deviation indicates that respondents had more varied experiences regarding the accuracy and realism of expected service times. Some customers may have received clear and realistic estimates, while others may have experienced uncertainty or delays that were not communicated effectively.
The overall mean of 3.04 shows that responsiveness is positively assessed but remains an area where improvements can be made. The lower scores related to realistic waiting times and immediate action suggest a need for stronger communication of service timelines and more efficient initiation of customer requests. The company may therefore consider establishing standard turnaround times, empowering front-line personnel, providing status notifications, and using tracking systems that allow customers to monitor the progress of concerns. These measures can strengthen responsiveness and reduce uncertainty during service encounters.
| Indicator | Mean | SD | Description |
|---|---|---|---|
| 1. Helping customers fast and without long waits | 2.98 | 0.9638 | Agree |
| 2. Treating each person with care and listening to their specific needs | 3.01 | 0.7177 | Agree |
| 3. Keeping the physical space, tools, and staff clean and neat. | 3.19 | 0.6620 | Agree |
| 4. Making customers feel safe and sure | 3.12 | 0.6241 | Agree |
| 5. Fixing problems fast keeps | 3.16 | 0.6624 | Agree |
| Average weighted mean | 3.09 | Agree |
Note: Legend: 3.26 – 4.00 Strongly Agree, 2.51 – 3.25 Agree, 1.76 – 2.50 Disagree, 1.00 – 1.75 Strongly Disagree
The data in Table 35 illustrates that customer satisfaction obtained an Average Weighted Mean of 3.09, interpreted as Agree. All five indicators were rated within the Agree range, indicating that customers generally express favorable perceptions of the company’s service experience, although the overall level has not yet reached Strongly Agree.
The highest-rated indicator was keeping the physical space, tools, and staff clean and neat, with a mean of 3.19 and a standard deviation of 0.6620. This suggests that customers positively recognize the physical and visible aspects of service delivery. Cleanliness, orderliness, and professional appearance can contribute to positive impressions because they communicate discipline, preparedness, and attention to customer welfare.
The indicator related to fixing problems quickly obtained a mean of 3.16 and a standard deviation of 0.6624, while making customers feel safe and secure received a mean of 3.12 with a standard deviation of 0.6241. These findings suggest that prompt problem resolution and perceived safety contribute positively to customer satisfaction.
The statement treating each person with care and listening to specific needs obtained a mean of 3.01 and a standard deviation of 0.7177. The lowest-rated indicator was helping customers quickly and without long waits, with a mean of 2.98 and the highest standard deviation of 0.9638. Although this remains within the Agree category, the comparatively lower mean and wider variation suggest that waiting time is one of the more inconsistent aspects of the customer experience.
The overall mean of 3.09 indicates that customer satisfaction is generally positive, but the results also show that improvements in waiting time, speed of assistance, and personalized attention could further enhance customer experience. The company may consider improving queue management, expanding customer-support channels during peak periods, providing estimated waiting times, and strengthening personalized service. These actions may help reduce service delays and improve consistency across different customer encounters.
| Indicator | TWM | Description |
|---|---|---|
| Reliability | 3.03 | Agree |
| Empathy | 3.20 | Agree |
| Responsiveness | 3.04 | Agree |
| Customer satisfaction | 3.09 | Agree |
| Average TWM | 3.09 | Agree |
Table 36 presents the summary on the status of quality service. A company may deliver its core service, yet customers can still form unfavorable perceptions if communication is delayed, concerns are not acknowledged, or personnel appear indifferent. Conversely, dependable service, attentive interaction, timely assistance, and a sense of safety can strengthen trust and encourage repeat patronage. The findings in the succeeding tables therefore provide an important basis for identifying areas where the company is performing favorably and aspects that require further attention under the proposed Strategic Governance Program.
5.5Relationship between the extent of quality service delivery and the status of quality service
This section presents the relationship between the extent of quality service delivery and the status of quality service of the company. The extent of quality service delivery was measured in terms of level of service, average speed of responses, observance of schedule, and time response, while the status of quality service was evaluated through reliability, empathy, responsiveness, and customer satisfaction. Examining the relationship between these variables is essential because the quality of service experienced by customers is often influenced by how effectively the organization delivers its services. Service quality is not only determined by operational efficiency but also by customers' perceptions and experiences throughout the service process. Therefore, identifying whether a significant relationship exists between these variables provides valuable information for developing a more effective and responsive strategic governance program.
| Status of quality service | Level of service | Average speed of responses | Observance of schedule | Time response | |
|---|---|---|---|---|---|
| Reliability | Computed value | 21.08 | 20.67 | 15.15 | 20.49 |
| p-value | 0.0001 | 0.0001 | 0.0017 | 0.0001 | |
| Empathy | Computed value | 30.76 | 30.68 | 23.80 | 29.92 |
| p-value | 0.0000 | 0.0000 | 0.0000 | 0.0000 | |
| Responsiveness | Computed value | 22.98 | 22.85 | 17.06 | 22.28 |
| p-value | 0.0000 | 0.0000 | 0.0007 | 0.0001 | |
| Customer satisfaction | Computed value | 26.59 | 25.64 | 19.92 | 26.11 |
| p-value | 0.0000 | 0.0000 | 0.0002 | 0.0000 |
Table 37 illustrates the significant relationship between the extent of quality service delivery and the status of quality service of the company. The findings reveal that all computed p-values ranged from 0.0000 to 0.0017, or 0.00% to 0.17%, which are all significantly lower than the 5.00% level of significance. This indicates that 100.00% (16 out of 16) of the relationships examined were statistically significant, while 0.00% showed no significant relationship. These findings provide sufficient evidence to reject the null hypothesis and confirm that the extent of quality service delivery significantly influences the status of quality service within the company.
From the data shown in Table 37, the relationship between reliability and the four dimensions of quality service delivery was found to be statistically significant. The level of service obtained a computed value of 21.08 with a p-value of 0.0001 (0.01%), while the average speed of responses recorded 20.67 with a p-value of 0.0001 (0.01%). Similarly, observance of schedule generated a computed value of 15.15 with a p-value of 0.0017 (0.17%), and time response obtained 20.49 with a p-value of 0.0001 (0.01%). These findings suggest that customers' perception of reliability is strongly associated with the organization's ability to provide timely and dependable services. Customers tend to perceive the company as more trustworthy when employees consistently fulfill commitments, maintain schedules, and respond efficiently to service concerns. Although observance of schedule produced the lowest computed value among the reliability indicators, it remained statistically significant, indicating that schedule management continues to play a vital role in establishing customer trust.
Table 37 further highlights that empathy demonstrated the strongest relationships among all the dimensions of quality service. The level of service recorded the highest computed value of 30.76 with a p-value of 0.0000 (0.00%), followed closely by the average speed of responses with 30.68, observance of schedule with 23.80, and time response with 29.92, all of which produced p-values of 0.0000 (0.00%). These results imply that empathy extends beyond interpersonal communication and is closely associated with operational performance. Customers are more likely to feel valued and understood when services are delivered efficiently, concerns are addressed promptly, and employees demonstrate genuine consideration through both their actions and their communication. The findings emphasize that improving operational procedures may also strengthen customers' emotional experiences and perceptions of individualized service.
The data in Table 37 also reveal that responsiveness was significantly associated with all dimensions of quality service delivery. The level of service obtained a computed value of 22.98 with a p-value of 0.0000 (0.00%), while the average speed of responses generated 22.85 with a p-value of 0.0000 (0.00%). Observance of schedule recorded 17.06 with a p-value of 0.0007 (0.07%), whereas time response obtained 22.28 with a p-value of 0.0001 (0.01%). These findings indicate that customers evaluate responsiveness not only through the speed at which services are delivered but also through the company's ability to communicate effectively, provide timely updates, and immediately address concerns. The consistently significant results demonstrate that operational responsiveness directly contributes to customers' perceptions of the organization's willingness and readiness to provide assistance.
Similarly, customer satisfaction was found to have significant relationships with all dimensions of quality service delivery. The level of service recorded a computed value of 26.59 with a p-value of 0.0000 (0.00%), while the average speed of responses obtained 25.64 with a p-value of 0.0000 (0.00%). Observance of schedule generated 19.92 with a p-value of 0.0002 (0.02%), and time response recorded 26.11 with a p-value of 0.0000 (0.00%). These results suggest that customer satisfaction is significantly influenced by how efficiently services are performed. Customers who receive prompt assistance, experience fewer delays, and encounter more organized service processes are more likely to report higher levels of satisfaction. The findings further indicate that customer satisfaction is not solely dependent on the final service outcome but also on the overall quality of the service experience.
Overall, the findings demonstrate a consistent pattern in which all dimensions of quality service delivery significantly affect all dimensions of quality service status. The statistical evidence confirms that improving operational service practices has the potential to positively influence customers' perceptions of reliability, empathy, responsiveness, and satisfaction. These findings are particularly important because previous results revealed that quality service delivery was only moderately carried out, suggesting that there is still considerable room for improvement despite customers already expressing positive perceptions regarding service quality.
The major gap identified in this study lies in the difference between the company's acceptable customer perceptions and the moderate implementation of its service delivery practices. This finding suggests that existing operational systems may not yet be maximizing their potential to provide excellent customer experiences. Therefore, the company should strengthen response management systems, establish clearer service standards, enhance schedule monitoring, improve customer communication channels, and provide continuous employee development programs focusing on customer relations and service efficiency. These initiatives may serve as the foundation for the proposed Strategic Governance Program, which aims to strengthen both operational performance and customer-centered service delivery.
Based on the findings, the null hypothesis is rejected since all p-values (0.00%–0.17%) are lower than the 5.00% level of significance. Therefore, there is a significant relationship between the extent of quality service delivery and the status of quality service of the company.
5.6Best practices in the delivery of services by the company
Roble Shipping Inc is a prominent Cebu-based shipping company that primarily serves routes between Cebu, Leyte, and Samar in the Philippines. Established on February 20, 1985, it has grown from a single cargo vessel into a major roll-on/roll-off (Ro-Ro) passenger and cargo fleet. Operates a diverse fleet of Ro-Ro passenger ships, cargo vessels, and fast crafts. Launched its largest and first brand-new Ro-Ro vessel, the M/V Mother Immaculate Stars, in mid-2026. Main Office: Roble Building, E.S. Baclig, T. Padilla Extension, North Reclamation Area, Cebu City. The following best practices are :
Roble Shipping Inc. focuses on operational efficiency, fleet expansion, and customer comfort to deliver maritime passenger and cargo transport in the Visayas region. Key service delivery practices emphasize safety compliance, transparent passenger advisories, and versatile Roll-on/Roll-off (RORO) cargo handling.
Operational and safety standards:
- Routine upkeep of a diverse fleet to ensure reliable travel times across routes like Cebu, Ormoc, Hilongos, and Baybay.
- Real-time public announcements regarding temporary operational changes or surcharges via the Roble Shipping News Portal.
- Safety protocols: adherence to maritime rules, Coast Guard documentation requirements, and weather-related shelter advisories.
Customer service and ticketing:
- Digital and physical access: use of physical ticketing outlets alongside location-based digital tools found through the Roble Shipping Outlets Locator.
- Flexible accommodations: tiered seating and cabin options (Economy, Tourist, Cabin) to match different passenger needs and budgets.
- Cargo versatility: RORO and freight services handling everything from small perishable goods to heavy machinery and vehicles.
The challenges identified in the delivery of services by the company are summarised in Table 38.
| Challenge | Description | Reference/source | Findings |
|---|---|---|---|
| Rising customer demands | To explore the role of customer involvement in service production and its possible effects on the quality of service delivery as well as customer satisfaction. Focusses on customer involvement in the context of service production and delivery system in service organization rather than in the context of customer organization. | Customer involvement in service production, delivery and quality: the challenges and opportunities, 2013 | The study reveals that even though co‐production of the customers with the service provider is a must, however, it has different effects on the quality of service produced depending on the situation and the nature of services offered. In the cases of the complex engineering services – general contractor and chemical engineering – that service requirements and technical specifications were provided by the customers, and service providers were chosen by open bidding process |
| High operational costs | High operational costs in service delivery stem from inefficient workflows, manual processes, and poor resource allocation. Addressing these financial drains requires a focus on core drivers like labor, tech tools, and process optimization to protect profit margins. | Operational Cost Control in Food and Beverage Establishments: Awareness, Practices, and Challenges in Southern Oriental Mindoro, Philippines, 2025 by Melchor,et.al | Findings revealed that, though there is a high level of awareness in areas like food cost control methods, menu design, inventory management, and portion control with high adherence to best practices, there were still challenges related to adjusting menu prices in response to fluctuating costs of ingredients, maintaining portion consistency, and a prominent motivation among staff to minimize waste. The adaptation of technology and staff training was recommended. The output of the study was the proposed cost control strategies that consisted of activities and programs for the implementation of the different food and beverage establishments. |
| Slow technology adoption | Slow technology adoption in company service delivery causes delays, high operational costs, and poor customer satisfaction. Companies often struggle to upgrade legacy systems due to employee resistance, high costs, and a lack of digital skills | Challenges of New Technology Adoption in Improving Company Growth and Competitiveness By Tajuddin, 2025 | The findings also emphasize the role of advanced technologies like Artificial Intelligence (AI), the Internet of Things (IoT), and cloud computing in driving operational efficiency, innovation, and market competitiveness. Implications: The research contributes to academic discourse by offering a holistic framework for understanding technology adoption challenges. |
| Tight Margins | Tight margins in service delivery happen when high operational expenses—like labor, fuel, and software—consume most of the revenue, leaving little to no profit. Rising customer demands and unexpected delays make it hard to stay profitable. The concepts are important for companies to gain long-term competitive advantage and retain customers. | Service Quality And Its Impact On Customer Satisfaction by T.Vu, 2021 | Key findings will be based on the conceptual framework and five dimensions: assurance, tangibles, responsiveness, reliability, and empathy. According to research, customers are not satisfied with unprofessional service providers, unorganized schedule, and pricing that do not meet expectations. Results of the research will be backed up with statistical evidence and discussed comprehensively. |
| Resource Allocation | Resource allocation is the process of assigning available assets—like staff, time, and money—to specific tasks. In service delivery, poor allocation leads to delayed projects, staff burnout, and unhappy clients. Companies often struggle with balancing these finite capabilities against shifting customer demands | Allocating human resources to projects and services in dynamic project environments, by Martinsuo, et.al, 2018 | The study reveals that in dynamic project settings such as service organisations, top-down mechanisms of resource allocation need to be accompanied by other, more flexible approaches to ensure the sufficient resourcing of projects and related services in dynamic environments. Companies need to establish practices for resource allocation changes that are caused by re-prioritising tasks and accommodating changes and delays in their project and service activities. |
| Inaccurate addresses or absent recipients lead to wasted trips | Inaccurate addresses and absent recipients create major hurdles in last-mile service delivery. They cause failed drop-offs, extra fuel expenses, and delayed schedules. Companies combat these issues by using address checks, live driver tracking, and advance text alerts | The impact of missing or incorrect addresses by P. Pudney, et.al, 2016 | Addresses are critical for finding locations. They are used by emergency services, by utilities, for delivery of mail and parcels, and for our daily navigation. The inability to find a location because an address is missing from a database or points to the wrong location incurs an economic cost, and these costs can be significant. |
| Outdated internal tools slow down response times and project tracking. | Outdated internal tools slow down service delivery by creating bottlenecks, increasing manual work, and preventing real-time tracking. These legacy systems lead to communication gaps between teams and delayed project updates for clients | Challenges of New Technology Adoption in Improving Company Growth and Competitiveness Tajuddin, 2025 | The findings also emphasize the role of advanced technologies like Artificial Intelligence (AI), the Internet of Things (IoT), and cloud computing in driving operational efficiency, innovation, and market competitiveness. Implications: The research contributes to academic discourse by offering a holistic framework for understanding technology adoption challenges. |
| Recruiting skilled professionals affects execution capacity | Recruiting skilled professionals directly impacts execution capacity by creating bottlenecks or capability gaps when qualified talent is scarce. Service delivery slows down, project timelines slip, and quality suffers if the workforce lacks the specific expertise needed to meet operational demands. | EFFECTS OF RECRUITMENT AND SELECTION PROCESS ON PERFORMANCE IN ORGANISATIONS By M. Ishaq, et.al 2023 | The study concluded that there is positively significance effect of recruitment and selection process on organization performance. The study recommended among others that management of organisations should consider merit in recruitment instead of primordial factors of friendship and relationship |
| Customers expect real-time updates and fast turnaround times. | Meeting the modern demand for real-time updates and fast turnarounds strains legacy workflows, often causing operational bottlenecks, data synchronization errors, and high stress on frontline staff trying to maintain service transparency | Customer satisfaction with goods delivery services: the role of couriers, delivery locations, delivery time, and complaint service availability in online shopping applications. By Sibarani,et.al, 2026 | The results show that all four factors have a significant and positive impact on customer satisfaction, with delivery time showing the strongest influence. On the other hand, the existence of an easily accessible and responsive complaint system strengthens consumers' trust in e-commerce platforms. |
| Misalignment between teams results in errors and delayed resolutions | Misalignment between teams causes communication breakdowns, finger-pointing, and redundant efforts, leading to service delivery bottlenecks, missed deadlines, and unresolved client issues. When departments operate in silos, critical information gets lost in handoffs. | Communication and Conflict Resolution in the Workplace: Overcoming Barriers in Matrix Coating by: M. Salvation, 2019 | The study found that the staff of Matrix often experience communication issues and this leads to disagreements and misunderstanding among the workforce. |
6Summary of findings, conclusions, and recommendations
The chapter summarizes the research’s findings, conclusions, and recommendations entitled, Stakeholder Engagement and Organizational agility on quality service: Strategic Governance Program. Descriptive research aimed to identify characteristics, frequencies, trends, correlations, and categories. It focused on answering the how, what, when, and where questions If a research problem, rather than the why. Descriptive survey was used to gather data about varying subjects. There were 100 respondents in this research composing of ten (10) employees, fifty (50) Passengers and forty (40) shippers and were chosen in random. These client respondents avail the services of the company. The population can be characterized in terms of geographical location, age, income, or many other criteria. The 10 employees from the different Roble Shipping offices in Cebu and in Leyte were composed of random staff from every division including administrative division and district offices including the 50 passengers and 40 shippers and they are composed of random stakeholders who transacted in the records office. The client respondents were the people who availed of the public records services that included turnaround time of the releasing and receiving of documents.
6.1Summary of findings
This section presents the profile of the respondents involved in the study, particularly the employees’, and Passengers & Shippers’ of the company. This study aims to assess the effect of organizational agility and stakeholder engagement on the service quality in the Roble Shipping Co, at North Rec., Cebu City during Calendar Year 2026 towards Strategic Governance Program.
6.1.1Employees
Taken together, these characteristics establish an important context for understanding subsequent findings on stakeholder engagement, organizational agility, and quality service. Since the study ultimately seeks to develop a Strategic Governance Program, identifying both the strengths and areas requiring improvement in the personnel profile can help ensure that the proposed program responds.
6.1.2Passengers
Differences in gender, civil status, employment, and sector affiliation may contribute to variations in travel purposes and service expectations. Examining these characteristics therefore allows the study to establish who the passenger respondents are and provides a stronger basis for understanding their perceptions of the company's service delivery. These findings can further guide the development of a Strategic Governance Program that is inclusive, responsive, and aligned with the needs of diverse passenger groups.
6.1.3Clients/shippers
In the context of the present study, understanding the characteristics of the clients is particularly relevant because their perceptions can provide direct indications of how well the company performs in meeting stakeholder needs. These findings may consequently serve as a useful basis for identifying appropriate interventions that can be incorporated into the proposed Strategic Governance Program.
6.1.4Level of stakeholder engagement and organizational agility
Organizational agility, on the other hand, reflects the company’s capacity to recognize changing customer expectations, market conditions, operational demands, and emerging technologies and then respond through innovation, flexibility, learning, and timely reallocation of resources. In a shipping organization, these capabilities are particularly relevant because service delivery can be affected by changing schedules, customer demands, operational disruptions, technological developments, and other external conditions. The findings presented in the succeeding tables therefore provide an important basis for determining existing organizational strengths and areas that may be strengthened through the proposed Strategic Governance Program.
6.1.5Extent of quality service delivery in terms of KPIs
The findings in this section are particularly significant because they show whether service-related practices are consistently carried out at a level that satisfies stakeholder expectations. High performance in these areas may contribute to greater trust, customer satisfaction, operational efficiency, and organizational credibility. Conversely, moderate or low ratings may indicate areas where processes, staffing, communication systems, or monitoring mechanisms need to be improved. The succeeding tables therefore provide a detailed picture of the present condition of service delivery and may serve as a basis for identifying specific actions to be incorporated into the proposed Strategic Governance Program.
6.1.6Status of quality service
Assessing these dimensions is important because quality service is shaped not only by whether a service is completed but also by how customers are treated throughout the process. A company may deliver its core service, yet customers can still form unfavorable perceptions if communication is delayed, concerns are not acknowledged, or personnel appear indifferent. Conversely, dependable service, attentive interaction, timely assistance, and a sense of safety can strengthen trust and encourage repeat patronage. The findings in the succeeding tables therefore provide an important basis for identifying areas where the company is performing favorably and aspects that require further attention under the proposed Strategic Governance Program.
6.1.7Relationship between the extent of quality service delivery and the status of quality service
This section presents the relationship between the extent of quality service delivery and the status of quality service of the company. Overall, the findings demonstrate a consistent pattern in which all dimensions of quality service delivery significantly affect all dimensions of quality service status. The statistical evidence confirms that improving operational service practices has the potential to positively influence customers' perceptions of reliability, empathy, responsiveness, and satisfaction. These findings are particularly important because previous results revealed that quality service delivery was only moderately carried out, suggesting that there is still considerable room for improvement despite customers already expressing positive perceptions regarding service quality. The major gap identified in this study lies in the difference between the company's acceptable customer perceptions and the moderate implementation of its service delivery practices. This finding suggests that existing operational systems may not yet be maximizing their potential to provide excellent customer experiences.
6.2Conclusions
In conclusion, the company should strengthen response management systems, establish clearer service standards, enhance schedule monitoring, improve customer communication channels, and provide continuous employee development programs focusing on customer relations and service efficiency. These initiatives may serve as the foundation for the proposed Strategic Governance Program, which aims to strengthen both operational performance and customer-centered service delivery. Based on the findings, the null hypothesis is rejected since all p-values (0.00%–0.17%) are lower than the 5.00% level of significance. Therefore, there is a significant relationship between the extent of quality service delivery and the status of quality service of the company.
6.3Recommendations
Based on the conclusions reached in the service quality in the Roble Shipping Inc., at North Rec., Cebu City during Calendar Year 2026 is highly recommended that Strategic Governance Program be considered for implementation.
References
- [1]Australian Journal of Emergency Management (2019). Resilience in the Philippines through effective community engagement. Australian Journal of Emergency Management, 34(1). https://knowledge.aidr.org.au/resources/ajem-jan-2019-resilience-in-the-philippines-through-effective-community-engagement/
- [2]Balcazar FE, Keys CB, Vryhof JA (2019). Empowerment. In: Jason LA, Glantsman O, O’Brien JF, Ramian KN (Eds.), Introduction to community psychology: Becoming an agent of change. https://press.rebus.community/introductiontocommunitypsychology/chapter/empowerment/
- [3]Business Bliss Consultants FZE (2021). Community empowerment theory. https://ukdiss.com/examples/community-empowerment-theory.php
- [4]Caballero MMA (2018). Factors affecting tenured BPO employees. International Journal of Management and Commerce Innovations, 6(1), 2151–2155.
- [5]Hoffman AJ (2019). Creating a culture of transformation in Guatemala: One fruit tree at a time. Electronic Green Journal, 1(40). https://escholarship.org/uc/item/3p03s4gk
- [6]Jason LA, Glantsman O, O’Brien JF, Ramian KN (2019). Introduction to the field of community psychology. In: Jason LA, Glantsman O, O’Brien JF, Ramian KN (Eds.), Introduction to community psychology: Becoming an agent of change. https://press.rebus.community/introductiontocommunitypsychology/chapter/intro-to-community-psychology/
- [7]Jason LA, Stevens E, Ram D, Miller SA, Beasley CR, Gleason K (2016). Theories in the field of community psychology. Global Journal of Community Psychology Practice, 7(2), 1–27.
- [8]Leipoldt JD, Kayed NS, Harder AT, Grietens H, Rimehaug T (2017). Refining the COPES to measure social climate in therapeutic residential youth care. Child & Youth Care Forum, 47(2), 173–197. https://doi.org/10.1007/s10566-017-9424-z
- [9]Maya-Jariego I, De La Peña-Leiva A, et al. (2019). Personal networks, social media, and community cohesion in the strategies of peace-building agents in Colombia to counteract the segregation of displaced populations. Journal of Community Psychology, 1–13. https://doi.org/10.1002/jcop.22173
- [10]Mukucha P, et al. (2020). The effects of business process outsourcing on the quality of catering services in tertiary education industry in Zimbabwe. Cogent Business & Management, 7(1). https://doi.org/10.1080/23311975.2020.1741314
- [11]Olson BD, O’Brien JF, Mingo E (2019). Social and political change. In: Jason LA, Glantsman O, O’Brien JF, Ramian KN (Eds.), Introduction to community psychology: Becoming an agent of change. https://press.rebus.community/introductiontocommunitypsychology/chapter/social-and-political-change/
- [12]Palmer GL, Fernández JS, Lee G, Masud H, Hilson S, Tang C, et al. (2019). Oppression and power. In: Jason LA, Glantsman O, O’Brien JF, Ramian KN (Eds.), Introduction to community psychology: Becoming an agent of change. https://press.rebus.community/introductiontocommunitypsychology/chapter/oppression-and-power/
- [13]Reich SM, Bishop B, et al. (2017). Catalysts and connections: The (brief) history of community psychology throughout the world. In: Bond MA, Serrano-Garcia I, Keys CB (Eds.), APA handbook of community psychology: Theoretical foundations, core concepts, and emerging challenges (Vol. 1, pp. 22–66). American Psychological Association.
- [14]Rodela J (2019). Effects of BPO on the global economy and what they mean for your business. https://selectvoicecom.com.au/blog/effects-of-bpo-on-the-global-economy-and-what-they-mean-for-your-business/
- [15]Watkins MW (2018). Exploratory factor analysis: A guide to best practice. Journal of Black Psychology, 44(3), 219–246. https://doi.org/10.1177/0095798418771807
- [16]House Bill No. 6137 (n.d.). An Act providing for Corporate Social Responsibility (proposed “Corporate Social Responsibility Act”). House of Representatives, Philippines.
- [17]Republic Act No. 9418 (2007). An Act Institutionalizing a Strategy for Rural Development, Strengthening Volunteerism and for Other Purposes (Volunteer Act of 2007). Philippines.
- [18]Republic Act No. 10173 (2012). Data Privacy Act of 2012. Philippines.
- [19]Republic Act No. 10844 (2016). Department of Information and Communications Technology Act of 2015. Philippines.
- [20]Republic Act No. 11032 (2018). Ease of Doing Business and Efficient Government Service Delivery Act of 2018. Philippines.
- [21]Assert Pro (n.d.). Availability of talent. https://www.assert.pro/research/talent-availability/
- [22]Bloomenthal A (2022). What is business process outsourcing (BPO), and how does it work? Investopedia. https://www.investopedia.com/terms/b/business-process-outsourcing.asp
- [23]CGS BPO Team (2021). Using BPO metrics to create stronger BPO partnerships. https://www.cgsinc.com/blog/using-bpo-metrics-to-create-stronger-bpo-partnerships
- [24]Indeed Editorial Team (2023). Common positions in a company (and what they do). Indeed.