Education
Institutional Management Capacities of Supply Chain of the Essential Household Commodity: Validated Capacity Building Framework
Cebu Technological University – Main Campus, Cebu City, Philippines
Published October 2026
Abstract
The study assessed the management for supply chain of the essential household commodity–cooking fuel at Palo, Leyte during CY 2025. Cooking fuel stands as an essential household commodity directly linked to food security, public health, and livelihood stability. Yet in disaster-prone municipalities such as Palo, Leyte, supply chains remain vulnerable to typhoons, price volatility, transport disruptions, and institutional fragmentation. This study assessed cooking fuel supply chain management and institutional resilience capacities in Palo, Leyte, with the ultimate goal of developing a context-specific institutional resilience framework. Guided by a tri-focal theoretical matrix socio-ecological systems theory, dynamic capabilities theory, and collaborative governance framework the research employed a descriptive quantitative design supplemented by qualitative insights. Data were gathered from 110 respondents (35 business owners and 75 households) using structured questionnaires, interviews, and focus group discussions. Frequency, percentage, weighted mean, Pearson correlation, and chi-square were used for statistical treatment. Key findings reveal that supply chain performance is marginally acceptable under normal conditions but fragile during disruptions. Affordability and institutional coordination rank lowest, with fuel costs consuming 15–25% of household income. A critical capacity gap emerged: 53.3% of business owners and 82.0% of households have never attended relevant training. A strong, statistically significant relationship (r = 0.71, p < 0.001) confirms that institutional resilience capacities directly determine supply chain continuity. Demographic characteristics do not significantly alter perceptions, indicating systemic rather than individual level challenges. Based on these findings, the Palo Institutional Resilience Framework (PIRF) is proposed operationalizing the capacities of sensing, seizing, and transforming through institutionalized monitoring, buffer stocks, multi-stakeholder governance, capacity-building, and dedicated funding. The study concludes that cooking fuel supply continuity is fundamentally an institutional governance challenge, not merely a logistics problem Local Governance Resilience Framework is required to ensure availability, affordability, and equitable access especially during crises.
Keywords: public administration; institutional management capacities; essential household commodity; cooking fuel supply chain; dynamic capabilities; collaborative governance; Palo, Leyte
1Introduction
1.1Rationale of the study
In the contemporary discourse of public administration, the traditional paradigm of New Public Management (NPM) is increasingly supplanted by the principles of public value governance and institutional resilience. Local government units (LGUs) are no longer viewed merely as regulatory or bureaucratic entities; they are the primary guarantors of socioeconomic stability during periods of acute systemic shocks. The sub-national state’s capacity to maintain the uninterrupted flow of essential commodities defined under Philippine Republic Act no. 7581 (The Price Act) as basic necessities and prime commodities (e.g., rice, canned goods, potable water, medicines, fuel) is a baseline metric of its local governance efficacy.
The municipality of Palo, Leyte, occupying a strategic geographical position within the eastern Visayas region (Region VIII), serves as a critical administrative and historical nexus. However, its exposure to severe hydro meteorological hazards most notably documented during the catastrophic landfall of Super Typhoon Haiyan (Yolanda) in 2013, and subsequent recurring typhoons renders its local supply chains perpetually vulnerable.
When a crisis strikes, standard market mechanisms frequently collapse due to infrastructure damage, hoarding, and information asymmetry. In these instances, the responsibility shifts squarely onto the LGU to activate contingency logistics, enforce price caps, manage relief distribution, and coordinate with private distributors.
However, many municipal and Barangay-level governance frameworks in the Philippines operate on reactive disaster risk reduction paradigms rather than proactive institutional resilience systems. This structural gap manifests as bureaucratic bottlenecks, maldistribution of goods, political favoritism in relief operations, and a lack of real-time supply chain visibility. However, recent crises and recurring local disruptions show that mandates alone do not guarantee delivery. Many LGUs still face shortages and delayed services, sudden price spikes, over reliance on distant suppliers, poor coordination between agencies, transporters and local producers, lack of pre-planned continuity systems. Most existing supply chain guidelines focus on national level response or private sector logistics. There is no locally tailored framework that links institutional capacity such as planning, coordination, funding, and decision making directly to sustained supply chain operations at the LGU level.
Moreover, essential commodities, including food, water, medicine, fuel and basic house hold goods are fundamental to public welfare and survival. LGUs are legally mandated under Local Government Code (RA 7160) and Philippine Disaster Risk Reduction and Management Act (RA 10121) to guarantee continuous access to these goods, especially during typhoons, price shocks, transport disruptions, and public emergencies.
This study addresses these vulnerabilities. By critically assessing the structural, administrative, and behavioral dimensions of the businesses in Palo Leyte, this research constructs an empirical framework for essential commodity supply chain continuity. It ensures that local governance structures can absorb, adapt to, and recover from disruptive events without compromising the biological and economic survival of their constituents.
1.2Theoretical/conceptual background
The conceptual architecture of this study is anchored upon a tri-focal theoretical matrix that bridges classical organizational sociology with contemporary public supply chain management networks. Socio-Ecological Systems (SES) Theory, Holling (1973); Folke (2006); Berkes (2006); Ostrom (2009): LGUs are not static administrative units but adaptive, complex socio-ecological organisms embedded in interdependent social-ecological systems, governed by resilience, non-linear change, and co-evolution with local ecosystems.
1987 Philippine Constitution (Art. II, Sec. 16): Right to a balanced and healthful ecology; Art. X: Local autonomy and LGU corporate personality recognizing LGUs as legitimate stewards of coupled human nature systems.
Local Government Code of 1991 (RA 7160): Sec. 3 mandates dynamic organizational structure and adaptability to local needs; Sec. 16 (General Welfare Clause) links social welfare and ecological preservation; Sec. 17 devolves ecological balance management, municipal waters, and resource governance to LGUs; Secs. 26–27 require multi-stakeholder participation in planning.
Climate Change Act of 2009 (RA 9729): Designates LGUs as frontline agencies for adaptation; requires Local Climate Change Action Plans (LCCAPs)—institutionalizing forward looking, adaptive stewardship.
Philippine DRRM Act of 2010 (RA 10121): Embodies “Build Back Better” and flexible response aligning with Holling’s adaptive cycle of release, reorganization, and renewal.
Supporting Laws: RA 8550/10654 (Fisheries Code: co-management of shared resources); RA 8371 (Indigenous Peoples’ Rights Act: integrates traditional ecological knowledge). Dynamic Capabilities Theory (DCT) Teece, Pisano, & Shuen (1997); Teece (2007); Eisenhardt & Martin (2000); Helfat et al. (2007). LGU logistics and supply chain performance depend on three sequential capacities: Sensing detecting risks and opportunities; Seizing mobilizing resources; Transforming Reconfiguring Systems amid volatility.
Local Government Code of 1991 (RA 7160) Sec. 17: devolves authority over local infrastructure, procurement, and service delivery granting LGUs power to sense local needs and reconfigure resources; Sec. 33: allows inter-LGU joint ventures and resource pooling. New Government Procurement Act (RA 12009): Mandates efficiency, flexibility, sustainability, and modernization in procurement/supply enabling adaptive seizing and operational adjustment.
RA 10121 & RA 9729: Require LGUs to develop responsive logistics, prepositioning, and contingency systems legally mandating sensing of hazards and transformative planning.
Supporting Issuances: DA Food Chain Logistics Master Plan (2023–2033); DSWD Buong Bansa Handa guidelines formalize adaptive logistics and supply chain reconfiguration. Collaborative Governance Framework Ansell & Gash (2008); Emerson et al. (2012); Bryson et al. (2006); Klijn (2008). Effective public logistics rely on public-private-plural collaboration formal networks of LGUs, private operators, civil society, and communities co-creating public value beyond single-sector capacity. Local Government Code of 1991 (RA 7160) Sec. 26–27: mandates local development councils with private/civil society representation; sec. 34: explicitly authorizes LGUs to enter into moas, joint ventures, and service contracts with private and plural stakeholders for service delivery.
RA 10121 & RA 9729 require multi-sectoral DRRM and climate bodies formalizing inclusive decision-making for logistics and resource management.
Supporting rules DENR Administrative Order 2005–23: (Collaborative, ecosystem-based management across sectors); DTI/DA logistics guidelines encourage (public-private partnerships in hubs, cold chains, and last-mile delivery).
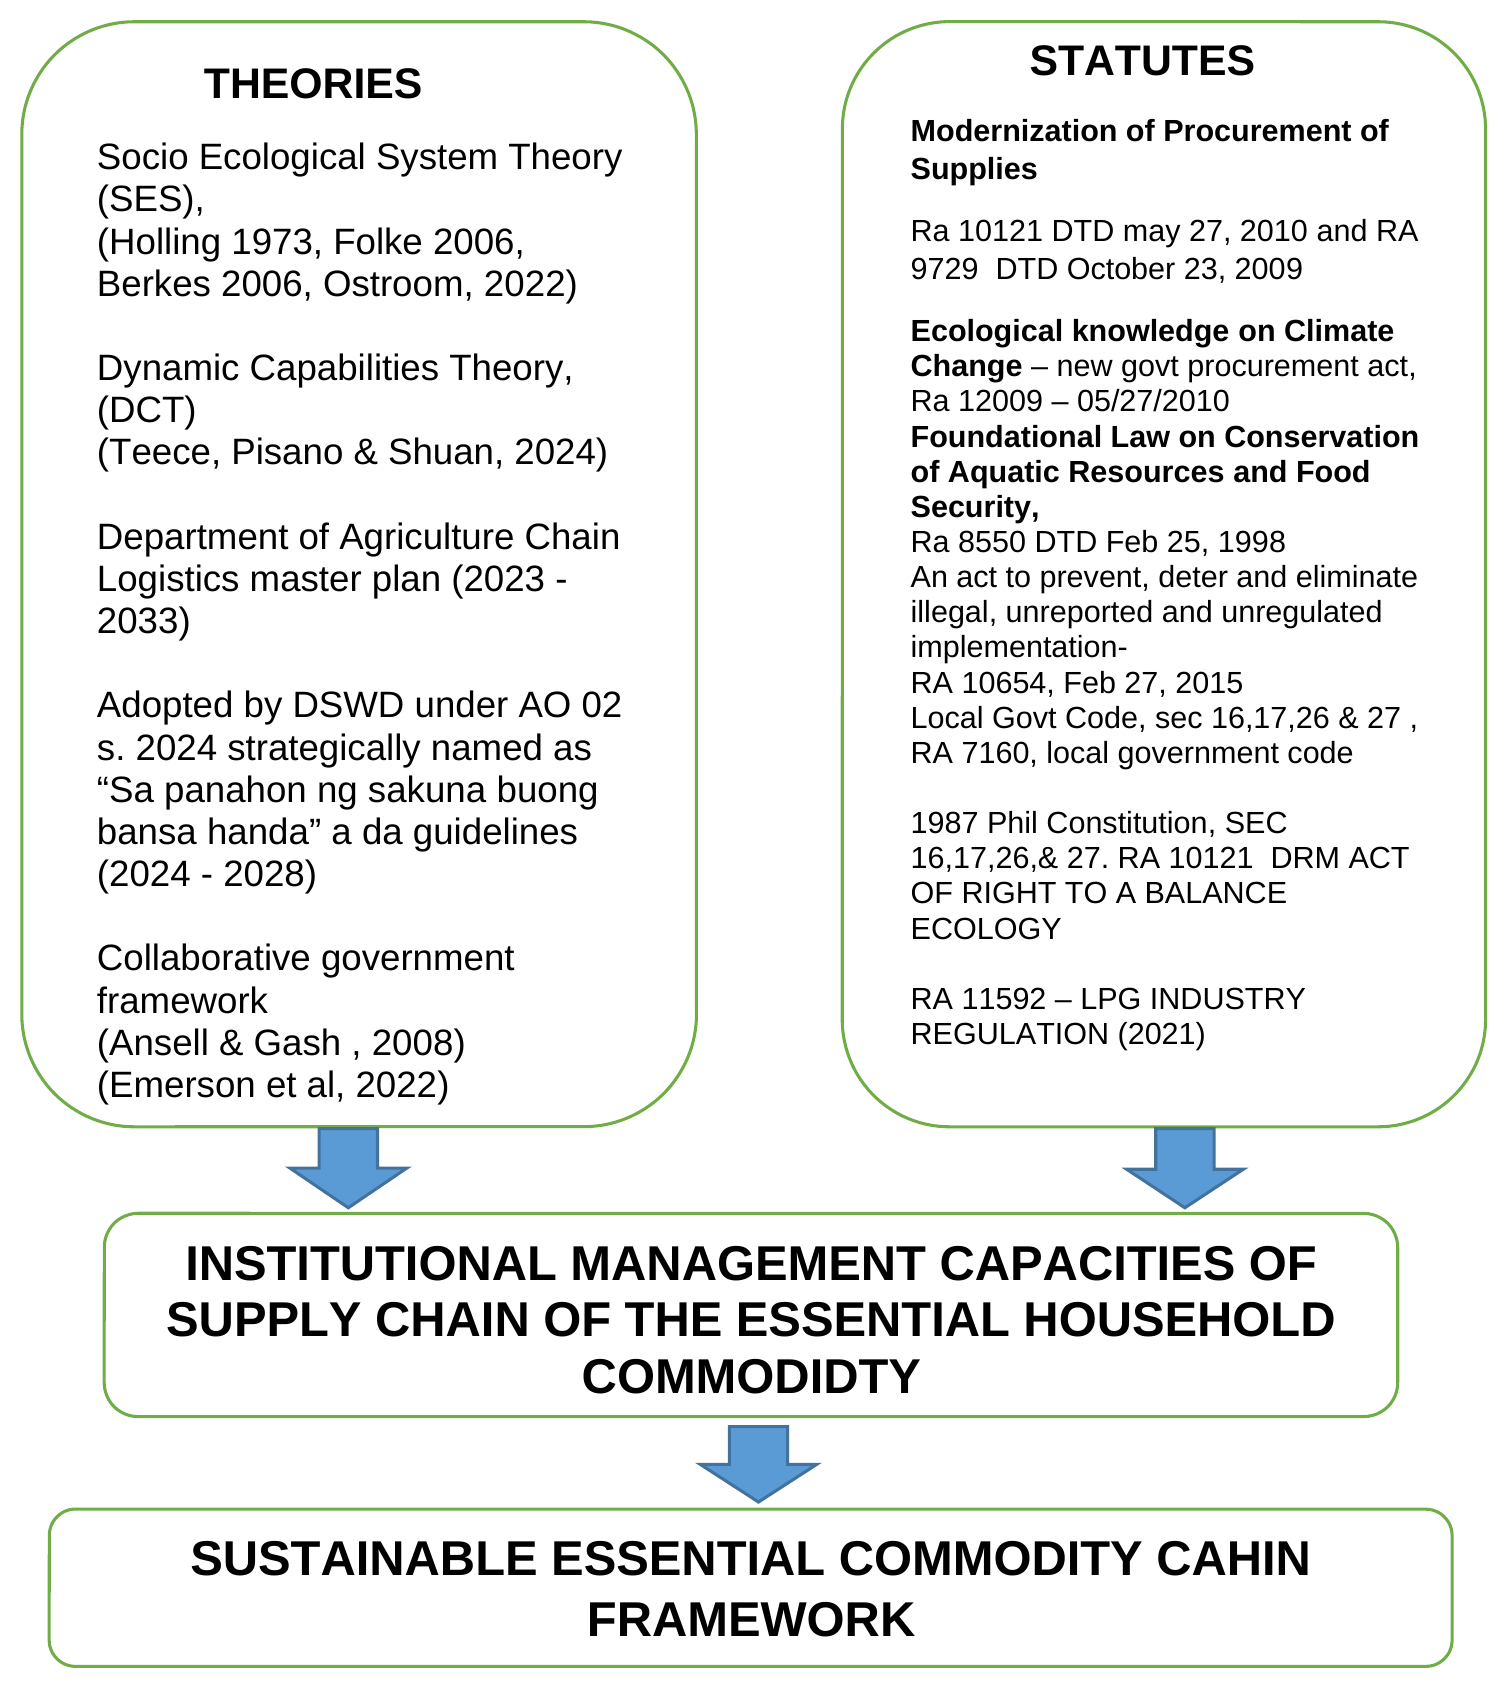
Integration of the tri-focal matrix. SES theory defines the LGU as an adaptive organism embedded in its territory; it anchors logistics in ecological constraints, resilience, and long-term sustainability. Dynamic capabilities explain how the LGU renews skills and processes; they drive sensing of supply risks, seizing of delivery options, and reconfiguration of resources so that the system can absorb future shocks in the market. The theoretical/conceptual framework of the study is shown in Figure 1.
2The problem
2.1Statement of the problem
This research assessed the status of the Essential Household Commodity – Cooking Fuel Supply Chain at Palo, Leyte during Calendar Year 2025, Sustainable Essential Commodity Chain Framework
Specifically, it seeks to answer the following objectives:
- 1. What is the demographic profile of the respondents, classified as business owners (wholesalers, retailers, distributors) and households (agriculturists, fisheries, mixed-income), as to age and gender, civil status, highest educational attainment, and relevant trainings and seminars attended?
- 2. What is the extent of the respondents’ perception of the supply chain management of the essential household commodity (cooking fuel) as to the service core dimensions of reliability, assurance, empathy, responsiveness, and tangibles?
- 3. What is the level of satisfaction of the respondent groups in terms of availability and continuity of supply, delivery and distribution efficiency, product quality and safety, and reliability and consistency?
- 4. Is there a significant association between the institutional resilience capacities of the respondents and the continuity of the cooking fuel supply chain?
- 5. Based on the findings, what sustainable essential commodity chain framework can be proposed to sustain the essential cooking fuel supply chain amid future disruptions?
2.2Null hypothesis
To guide the statistical inferences of this study, the following null hypotheses will be tested at 0.05 level of significance:
H01: There is no significant relationship between the demographic profile of the respondents (both households and business owners) and their perception of institutional resilience.
2.3Significance of the study
This research provides fundamental, actionable insights across multiple tiers of public administration.
Academe – this may serve as a source of encouragement and livelihood for the families of student who are engaged on this study leading towards more elaborated and expanded scope of life in order to generate more comprehensive and sensitive projects for betterment of rural and urban lives.
Academic and Research Communities - fills a critical knowledge gap: most existing studies focus on food or agricultural supply chains, with limited research dedicated to cooking fuel as an essential commodity, particularly in the Philippine rural setting. Offers a context-specific institutional resilience framework that enriches theories on supply chain resilience, institutional capacity, and essential service delivery in disaster prone areas. Serves as a reference for future graduate and doctoral research on energy security, essential commodity management, and local governance in the Philippines and similar developing contexts. Contributes empirical, localized data to the growing literature on sub-national institutional resilience within developing country paradigms.
Barangay Councils (BLGUs): empowers grassroots officials with formalized operational frameworks, converting localized barangay halls into reliable secondary logistics nodes.
Cooking Fuel Industry Stakeholders - fuel suppliers, distributors, and retailers: helps identify supply chain bottlenecks, financial risks, and coordination gaps, enabling them to adopt more resilient operational practices, adjust business models, and establish stronger partnerships with government and communities. Industry associations: provides evidence to advocate for targeted policy support, capacity-building programs, and shared risk-mitigation mechanisms that benefit small and medium-scale fuel enterprises.
Disaster Risk Reduction and Management Office (DRRMO) - addresses the growing threat of overlapping shocks including extreme weather events, global fuel price volatility, logistics disruptions, and public health emergencies by providing a tested, actionable framework to prevent or minimize supply chain collapse for a basic household necessity.
Households and Vulnerable Communities - ensures sustained access to affordable cooking fuel an essential need for food preparation, health, and livelihood especially for low-income families, rural households, and groups disproportionately affected by price hikes or supply shortages. Reduces reliance on unsafe or environmentally harmful alternative fuels during shortages, protecting household well-being and public health.
Local Government Units - local government unit (LGU) of palo, Leyte: serves as a baseline reference for updating the local energy plan, disaster risk reduction and management plan (DRRMP), and essential commodities supply continuity plan. The proposed framework will provide a structured guide for coordinating pre-disaster preparedness, emergency response, and post-disaster recovery for cooking fuel services. Regional development council (RDC) region 8: contributes to regional strategies for food and energy security, ensuring that Leyte’s context is integrated into broader Visayas-wide essential commodity resilience policies.
Local Chief Executives and Policy Makers (Palo, Leyte): offers data-driven mechanisms to redesign local disaster risk reduction and management (DRRM) plans, shifting from generic response strategies to highly specific commodity-security frameworks.
LGU Department Heads (MDRRMO, MSWDO, BPPLO): provides standardized metrics to evaluate supply chain vulnerabilities, optimize emergency buffer stock calculations, and clean up public procurement blockages.
National government agencies - department of energy (DOE), department of trade and industry (DTI), and department of social welfare and development (DSWD): findings will inform policy formulation, regulatory adjustments, and priority programming for cooking fuel supply security, price control, and social protection for vulnerable households.
Private sector and local merchants: solidifies public-private collaboration protocols, protecting local economies from price volatility and black-market distortions during disasters.
3Research methodology
3.1Design
This study employs a descriptive quantitative research design, supplemented by qualitative insights from interviews and focus group discussions. The quantitative phase takes precedence, using structured instruments to collect measurable data across respondent groups. As Landman, Breuer, & Foweraker (2024) observe, descriptive inquiry is particularly suited to analyzing institutional adaptation to shocks including how LGUs adjust operations amid uncertainty. This design describes the nature, conditions, and extent of supply chain continuity in Palo, Leyte, with precision and empirical rigor.
The study analyzes data on respondent profiles, perceptions of supply chain performance, and levels of satisfaction across key operational dimensions. Formal and informal interviews supplement survey data, clarifying challenges and contextual realities that structured questionnaires may not fully capture. Collective evidence from peer-reviewed studies (2024–2026) informs the analytical framework: institutional capacities, rules, and partnerships determine whether cooking fuel LPG, charcoal, firewood, kerosene flows reliably, affordably, and accessibly, even amid typhoons, price spikes, and transport disruptions.
Data are gathered through structured survey questionnaires and personal interviews; secondary data are obtained from LGU records and relevant agencies. Analysis employs percentage, weighted mean, and ranking to interpret responses. The study culminates in a proposed institutional resilience framework for essential commodity supply chain continuity.
3.2Flow of the study
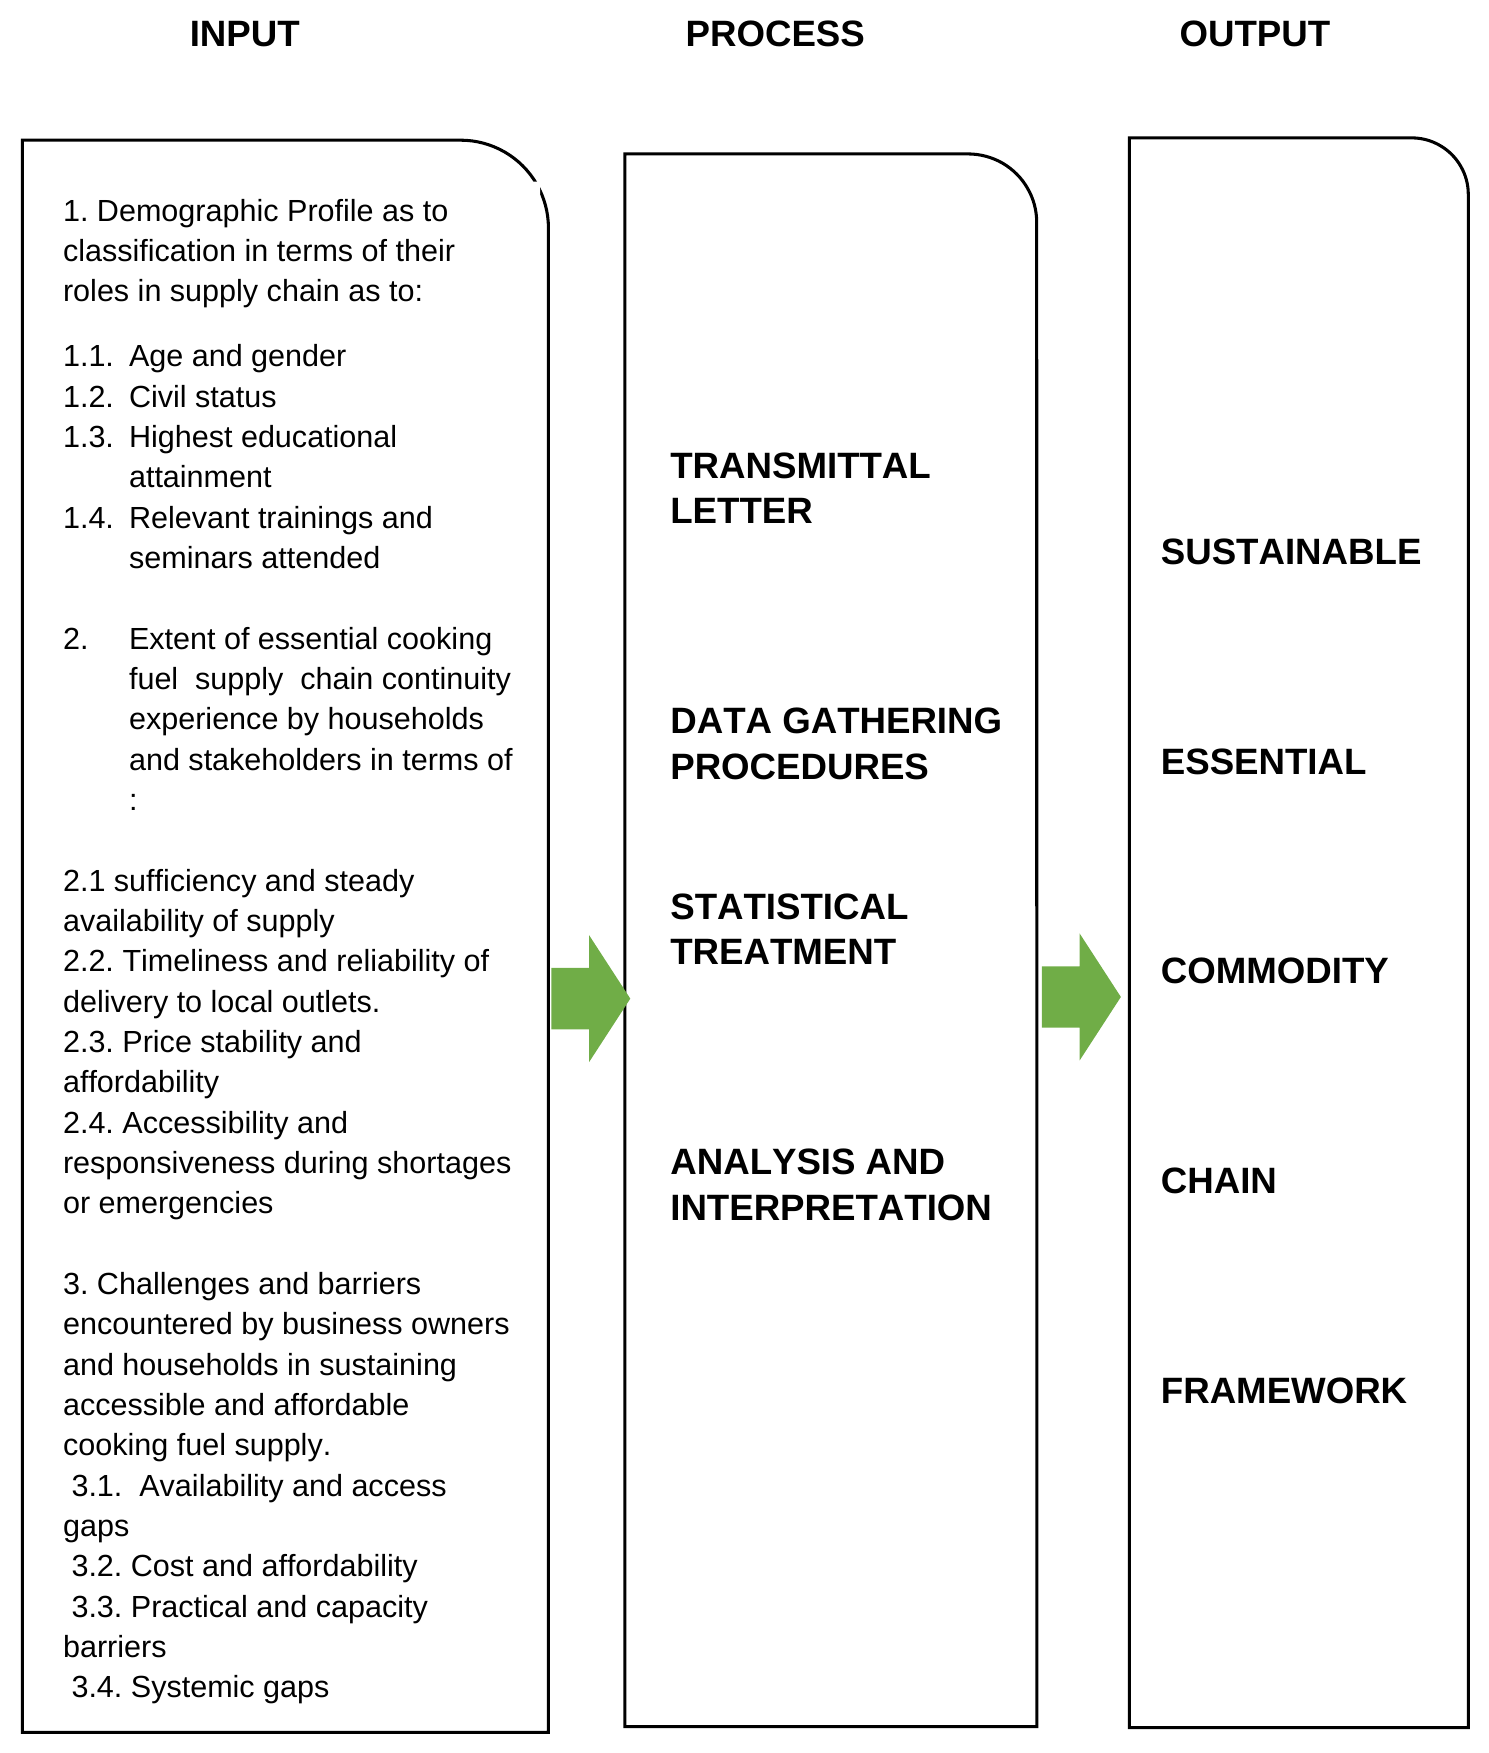
This research includes input – process – output approach. The input includes the demographic profiles of the respondents 1.1. Business owners such as: wholesalers, retailers and distributors. 1.2. Households such as: agricultural, fishery, and mix income. Extent of essential cooking fuel supply chain continuity experience by households and business owners in terms of the extent of essential cooking fuel supply chain continuity experienced by households and business owners. The flow of the study is shown in Figure 2.
3.3Environment
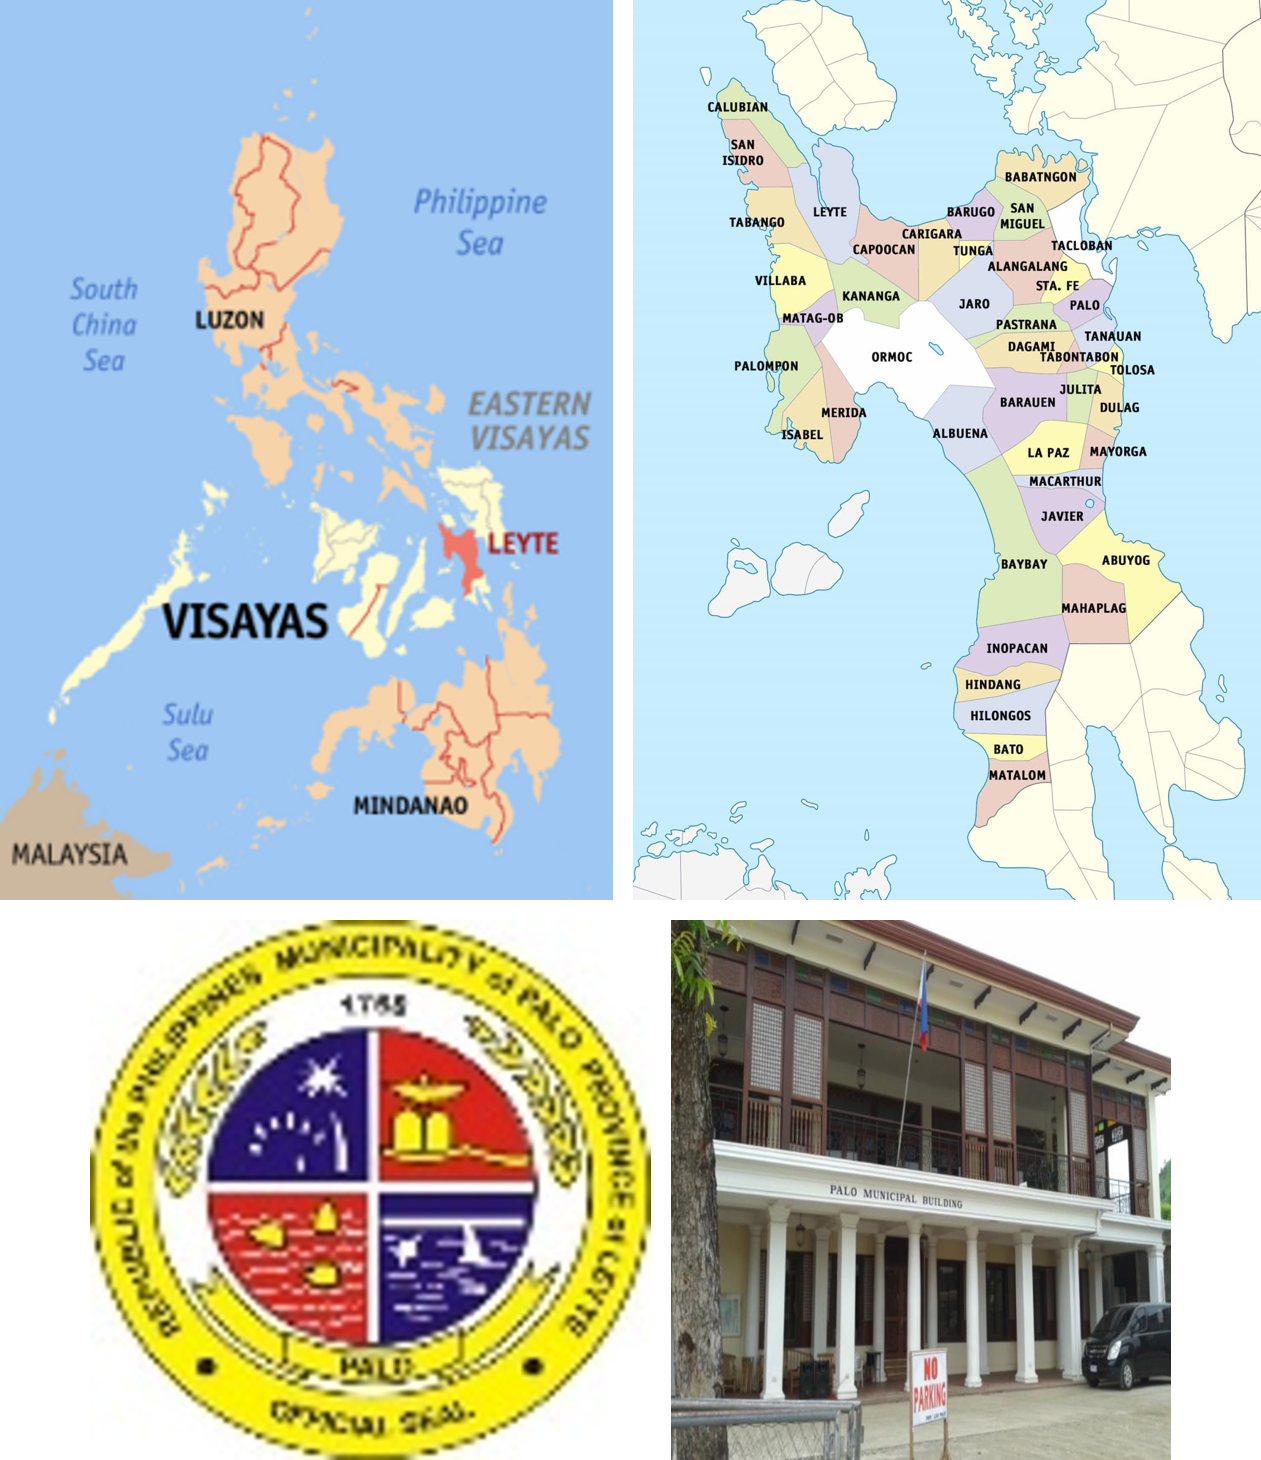
The study is conducted in Palo, Leyte a coastal municipality in Northeastern Leyte, Eastern Visayas, approximately 8 kilometers from Tacloban City. It spans 221.27 square kilometers across 33 barangays, covering urban, rural/interior, and coastal zones. As of 2026, its population is 80,291 across 17,950 households, comprising urban dwellers, farmers, fisherfolk, employees, and business owners.
Palo is climatically prone to typhoons, heavy rains, and storm surges key factors that repeatedly disrupt supply chains and transport. It serves as a governance hub, hosting proximity to the Provincial Capitol and Regional Offices of DSWD, DTI, DOE, DA, PNP, and RDRRMC-8 making it a critical coordination center for essential commodities. Economically, it functions as a growing commercial and services hub with markets, fuel stations, and suppliers serving Palo and adjacent towns. Households rely heavily on LPG in urban areas and a mix of traditional and modern fuels in rural and coastal zones; supply originates largely from Tacloban City and Cebu, passing through Palo’s logistics network.
Palo is uniquely appropriate for this study: it lies along major supply routes yet remains vulnerable to road and port closures, shipping delays, and price volatility. It exhibits documented disparities in fuel access, supply gaps during disasters, price fluctuations, and dependence on external suppliers conditions typical of LGUs in Eastern Visayas where institutional resilience directly determines whether cooking fuel remains available, affordable, and continuous.
The location of the study is shown in Figure 3.
3.4Respondents of the study
There were 2 distinct groups of respondents on this study. The first group is the Business owners consist of wholesalers, retailers and distributors and the second group is the households consist of agricultural group, fishery group and mixed income groups. They can provide valuable and relevant information needed information on this study. The respondents were selected by convenience or purposive sampling. This sampling strategy is adopted because the researcher would like to give each member or the population an equal chance of being selected as samples as suggested by Rivera (2022).
| Category | Classification | Frequency (n) | Percentage (%) |
|---|---|---|---|
| Business owners | |||
| Wholesaler | 10 | 28.57 | |
| Retailer | 15 | 42.86 | |
| Distributor | 10 | 28.57 | |
| Subtotal – business owners | 35 | 100 | |
| Household | |||
| Agriculturist | 15 | 20 | |
| Fisheries | 15 | 20 | |
| Mixed-Income | 45 | 60 | |
| Subtotal – households | 75 | 100 | |
| Grand total | 110 | 100 |
Table 1 presents the distribution of respondents, comprising a total of 110 participants categorized into two major groups: business owners and households. Of the total sample, 35 respondents (31.8%) were classified as business owners, while 75 respondents (68.2%) belonged to the household category, indicating that the study places greater emphasis on household level perspectives while still adequately representing supply chain actors. Among the business owners, retailers constituted the largest proportion at 42.86% (n = 15), followed by wholesalers and distributors, each accounting for 28.57% (n = 10). This distribution reveals that retailers who serve as the direct interface with consumers were the most represented among business establishments, while wholesale and distribution functions shared equal representation, ensuring balanced coverage across key tiers of the local supply chain. For the household category, mixed income households formed the majority at 60% (n = 45), reflecting the prevalence of diversified livelihood sources among rural households in the area. Meanwhile, agriculturist households and fisheries households each comprised 20% (n = 15) of the household sample, indicating equal representation from the two primary livelihood sectors and enabling a comparative assessment across farming and fishing communities.
3.5Instrument
The instruments used in this study were adopted and self-formulated questionnaires from different readings, like journals, magazines, books etc. Formal and informal interviews were also used to complement the documents gathered from the respondents. Informal in the sense that the questionnaires will be distributed in a random manner where the respondents were given automatically and were ask about their challenges and barriers about the status of essential commodity supply chain of cooking fuel at Palo, Leyte. This happened when they come to the vicinity of the stores or anywhere where there are stores with display of cooking fuel gas. Formal when it is distributed at the meetings or during focus group discussion (FGD). However, the questionnaires used have three parts: Part 1 was about the demographic profiles of the respondents as to: age and gender, civil status, highest educational attainment, training and seminars attended. Part 2 extent of essential cooking fuel supply chain continuity, Part 3 – is on challenges and barriers encountered by business owners and households in sustaining accessible and affordable cooking fuel supply in Palo, Leyte.
Part 4 – is on the significant relationship between institutional resilience capacities of the respondents and the continuity of cooking fuel supply chains. The respondents will give their evaluation collaborated with the data mentioned in the questionnaires, it will be complied, tallied and tabulated. The data will then be subjected to statistical treatment to answer the question of the study.
3.6Data gathering procedures
The data gathered were completed through the following phases sent a transmittal letter to LGU officials and to the president of business association in Palo, Leyte by enabling them to accomplish the questionnaires at a given period. Since the target areas were near each other the researcher will then wait for a day on the retrieval of the said questionnaires and right after a personal interview will be conducted. The accomplished copies will then be tabulated, analyzed and categorized according to the different categories of the respondents.
3.7Statistical treatment of data
When all the pertinent data are gathered, they will be compiled, tallied and tabulated. The data then were subjected to statistical treatment used in order to answer the questions proposed in this study. The statistical tool that will be used were frequency determination, percentage computations, weighted mean and test of significant relationship between the institutional resilience capacities and the continuity of cooking fuel supply chain and finally, ranking to analyze and interpret their responses. These statistical tools were also used to determine the profile of the respondents.
3.8Scoring procedures
A structured four-point Likert scale was employed to measure the extent of perceived assistance and support related to the cooking fuel supply chain as experienced by households and business owners, with particular attention to performance during periods of shortage, disruption, or emergency. A four-point scale was selected to enhance data reliability by eliminating the neutral midpoint, thereby encouraging respondents to express a distinct stance and minimizing ambiguity in interpretation. Responses are assigned numerical values, aggregated, and averaged to produce a composite mean score. This mean score is then mapped to standardized intervals, verbal descriptors, and context-specific operational definitions tailored to the study's focus on supply chain assistance, accessibility, and support quality. The intervals were structured to provide clear differentiation between levels of assistance quality, with the middle ranges spanning 0.75 points and the extreme ranges spanning 0.74 points, ensuring consistent and unbiased classification across all survey items.
In administering the instrument, households and business owners rated their experiences across key supply chain dimensions availability, affordability, accessibility, stability, and emergency responsiveness. Individual item scores are aggregated to compute a mean rating for each dimension and for the supply chain support system as a whole. This standardized scoring procedure ensures uniform interpretation and minimizes subjective bias, enabling valid comparison across respondent groups and geographic areas within Palo, Leyte. The scoring framework is defined in Table 2.
| Scale interval | Verbal interpretation | Operational definition |
|---|---|---|
| 3.26 - 4.00 | Very Well Assisted | The respondent consistently experienced comprehensive, timely, and proactive support across all aspects of service or assistance. Needs were anticipated and fully addressed with minimal effort required from the respondent; assistance was reliable, of high quality, and exceeded basic expectations. The respondents encountered no significant gaps or delays in receiving support. |
| 2.51 – 3.25 | Well Assisted | The respondents generally received adequate and satisfactory support that addressed most of their needs. Assistance was provided in a reasonably timely manner with only minor gaps, delays, or shortcomings that did not substantially hinder outcomes. The respondent needed to exert some effort to obtain support, but overall service was functional and met basic expectations. |
| 1.76 – 2.50 | Assisted | The respondents received limited or partial support that addressed only some of their needs. Assistance was inconsistent, slow, or incomplete, requiring considerable effort from the respondent to follow up or supplement. While some form of support was provided, notable gaps existed and several needs remained unaddressed or were addressed inadequately. |
| 1.00 – 1.75 | Poorly Assisted | The respondent received minimal, ineffective, or virtually no support. Assistance was largely absent, severely delayed, or failed to address core needs. The respondent had to manage most, or all matters independently, encountered significant barriers to obtaining help, and experienced frequent or substantial shortcomings that negatively impacted outcomes. |
Practically, this rubric serves both as a measurement tool and a diagnostic framework. Ratings falling within the Very Well Assisted range confirm that existing supply chain support arrangements possess sufficient resilience and may serve as benchmarks for best practices. Ratings in the Well Assisted category indicate generally functional systems with minor areas for improvement. Conversely, ratings in the Assisted or Poorly Assisted categories signal specific gaps, weaknesses, or vulnerabilities especially those exposed during emergencies which the proposed sustainable essential commodity chain framework is designed to address and remediate. By translating numerical scores into actionable performance descriptions, this procedure bridges empirical measurement and practical policy recommendation, directly informing the design of the sustainable supply chain model proposed in this study.
4Definition of terms
Accessibility Conceptually, the quality of being easily reached, entered, or obtained; the degree to which a product or service is available to those who need it. Operationally in this study, pertains to the ease with which households and business owners can physically obtain LPG supplies, considering geographic proximity, distribution reach, and the absence of barriers to acquisition.
Affordability Conceptually, the quality of being priced reasonably enough that people are able to purchase or obtain the product or service without financial hardship. Operationally in this study, refers to the pricing of LPG products relative to the purchasing capacity and financial perception of respondents, including the stability of prices over time.
Assurance refers to the perceived reliability, consistency, and dependability of the cooking fuel supply chain. It measures whether fuel supply is consistently available, accurate in quantity, consistent in quality, and reliably fulfils commitments so households and business owners can trust that fuel will be there when needed, in the right amount and quality.
Availability Conceptually, the state of being present, ready for use, or obtainable when needed. Operationally in this study, refers to the physical presence of LPG products in retail outlets and refilling stations at any given time, as perceived and reported by respondents.
Business Owners Conceptually, individuals or entities who own, manage, or operate commercial enterprises. Operationally in this study, refers specifically to owners and operators of LPG retail outlets, refilling stations, and related businesses engaged in the sale and distribution of LPG within the municipality of Palo, Leyte, who served as respondents in the research.
Emergency Responsiveness Conceptually, the capacity of a system to react quickly and effectively to unexpected events, crises, or disruptions to restore normal operations. Operationally in this study, refers to the ability of the LPG supply chain system and its institutional managers to respond to and recover from shortages, calamities, and other emergency situations, ensuring continued or rapidly restored access to the commodity.
Empathy refers to the perceived understanding, care, consideration, and fairness that fuel suppliers demonstrate toward households and small-scale users. It measures whether suppliers recognize urgent needs, show concern during shortages, prioritize vulnerable groups, understand livelihood impacts, and treat small users fairly compared to bulk buyers.
Essential Household Commodity Conceptually, refers to goods or products considered necessary for basic daily living, health, safety, or sanitation, the unavailability of which would cause significant hardship or disruption to household functioning and well-being. Operationally in this study, specifically denotes Liquefied Petroleum Gas (LPG) as a primary cooking fuel, classified as essential due to its critical role in household food preparation, small business operations, and overall domestic energy security in the study area.
Households Conceptually, refers to groups of people living together under one roof, typically sharing resources and domestic responsibilities. Operationally in this study, denotes residential consumers of LPG in Palo, Leyte, who rely on the commodity for domestic cooking and related household energy needs, and whose perceptions and experiences form the consumer-side data of the research.
Institutional Management Capacities Conceptually, refers to the ability of organizations, agencies, and stakeholders within a system to effectively plan, coordinate, implement, monitor, and regulate activities toward achieving desired outcomes. It encompasses the resources, competencies, structures, and processes that enable institutions to perform their functions reliably and adaptively. Operationally in this study, pertains to the demonstrated ability of LPG industry stakeholders including suppliers, distributors, retailers, refilling stations, and regulatory bodies to manage and sustain the supply chain, as measured through the dimensions of availability, accessibility, affordability, stability, and emergency responsiveness as perceived by business owners and households in Palo, Leyte.
Liquefied Petroleum Gas (LPG) Conceptually, a flammable mixture of hydrocarbon gases (primarily propane and butane) stored and transported in liquid form under pressure, widely used as a fuel for heating, cooking, and vehicles. Operationally in this study, refers to the cooking fuel commodity that is the focus of the supply chain analysis, encompassing all cylinder sizes and brands distributed and consumed by households and business establishments in Palo, Leyte.
Palo, Leyte Conceptually, a municipality in the province of Leyte, Philippines, located in the Eastern Visayas region. Operationally in this study, serves as the geographic scope and locale of the research, where both business owner and household respondents were selected and data were gathered.
Reliability refers to the consistency, dependability, and predictability of fuel supply whether the right volume, quality, and type of fuel is available when needed, in the amount expected, and without unexpected shortages or interruptions.
Responsiveness refers to the perceived willingness, speed, and flexibility of fuel suppliers to assist households and business owners and deliver prompt service. It measures how quickly orders are fulfilled, how clearly and promptly problems or delays are communicated, how flexibly suppliers can adjust fuel volumes and delivery schedules, and how rapidly complaints or concerns are addressed.
Stability Conceptually, the state of being resistant to change, disruption, or fluctuation; the ability to maintain consistent performance or conditions over time. Operationally in this study, denotes the consistency and predictability of LPG supply, pricing, and service delivery under normal operating conditions, as distinct from performance during emergency situations.
Supply Chain Resilience Conceptually, the capacity of a supply chain system to withstand, adapt to, recover from, and learn from disruptions while maintaining continuous operations and meeting service requirements. Operationally in this study, refers to the ability of the LPG supply chain to maintain adequate supply levels and service delivery during periods of shortage, calamities, emergencies, or other disruptions, as measured by respondent ratings on stability and emergency responsiveness.
Sustainable Essential Commodity Chain Framework Conceptually, refers to a proposed structured model or system designed to ensure the continuous, reliable, and resilient flow of essential goods, integrating principles of environmental sustainability, economic viability, social equity, and institutional adaptability. Operationally in this study, represents the output framework developed from the research findings a diagnostic and prescriptive model that identifies gaps in the current LPG supply chain management capacities and proposes targeted strategies, institutional arrangements, and policy interventions to enhance supply chain resilience, particularly during emergencies and periods of disruption.
TANGIBLES refers to the perceived adequacy and reliability of physical resources, infrastructure, facilities, and equipment that support the cooking fuel supply chain. It measures whether storage capacity, delivery equipment, packaging, distribution networks, and backup reserves are sufficient to ensure steady, quality fuel supply to households and business owners.
5Review of related literature and studies
This section presents a synthesis of conceptual frameworks, international and local literature, and empirical studies relevant to institutional resilience, essential commodity supply chains, cooking fuel access and affordability, and local governance in disaster prone contexts. It establishes the theoretical and empirical foundations of the study, highlights relationships among key variables, and identifies gaps in existing knowledge that the present research addresses. The chapter is organized into three sections: related literature, related studies, and synthesis and research gap.
5.1Related literature
This section reviews conceptual and thematic literature drawn from diverse sectors, commodities, and settings including global supply chains, disaster management, and public governance. Though drawn from contexts beyond cooking fuel specifically, these works articulate universal principles of resilience, institutional capacity, and service continuity that transcend product type and organizational form. They provide comparative benchmarks, alternative frameworks, and theoretical foundations that triangulate and enrich the proposed institutional resilience framework for essential commodity supply chains.
5.1.1Institutional resilience and supply chain continuity
Institutional resilience refers to the capacity of formal and informal organizations—including Local Government Units (LGUs), regulatory bodies, industry associations, and community groups to anticipate, absorb, adapt to, and recover from disruptions while maintaining core functions and service delivery. Its key dimensions include: Adaptive Governance (Flexible Decision-Making amid changing conditions); resource mobilization (access to funding, logistics, and emergency reserves); multi-stakeholder coordination (aligned roles across sectors); risk planning and preparedness (pre-positioned protocols for shortages and disasters); and policy responsiveness (timely enforcement and adjustments to protect supply and affordability). For essential commodities such as cooking fuel, institutional resilience differs from general disaster response: it requires sustained oversight of daily supply, price regulation, and equitable distribution rather than only post-disaster relief.
Underpinning these capacities is Teece’s (2024) dynamic capabilities framework, which identifies three core institutional capacities: sensing monitoring supply, prices, hazards, and demand; seizing rapidly activating funds, stocks, partners, and alternative routes; and transforming updating rules, diversifying sources, and building permanent safeguards. This framework confirms that cooking fuel supply continuity is fundamentally an institutional capability problem: technical logistics alone are insufficient without the organizational ability to anticipate, adjust, and embed resilience into routine operations.
5.1.2Essential commodities and cooking fuel supply chains
Cooking fuel whether Liquefied Petroleum Gas (LPG), charcoal, biomass, or alternative sources stands as one of the most essential household commodities, directly linked to food security, public health, and livelihood stability. Ewim et al. (2024) define supply chain continuity for cooking fuel by four interrelated pillars: sufficiency of volume, timely delivery, price stability, and geographic accessibility. Unlike agricultural goods, fuel supply chains are capital-intensive, dependent on cross-regional logistics, and highly sensitive to both global market shocks and local infrastructure limitations. Continuity failures often stem not only from external disruptions but from institutional gaps: unclear roles between national and local agencies, absence of local buffer stocks, and weak oversight of informal markets.
5.1.3Global vulnerabilities and local context in the Philippines
According to the organisation for Economic Co-Operation and Development (OECD, 2024), the Philippines relies heavily on imported fuel sources, with approximately 90% of LPG demand met through overseas supply rendering local chains highly vulnerable to global price spikes and shipping disruptions. While national storage capacity covers roughly 60 days of consumption, effective utilization falls below 60% due to uneven distribution and limited local storage in peripheral provinces such as Leyte and Samar. In Eastern Visayas, coastal and inland barangays face additional barriers: damaged roads, constrained port capacity, and seasonal weather often delay deliveries by three to seven days or more, with no formal allocation system for shortages.
Affordability compounds these challenges: agricultural and fishery households spend 15–25% of their income on cooking fuel far exceeding the recommended 5% threshold for affordable energy. When prices rise or supplies fail, 36–55% of households resort to fuel stacking (combining LPG with unsafe biomass) or reduce cooking frequency, increasing risks of malnutrition and respiratory illness. Nationally, policies from the Department of Energy (DOE) and Department of Trade and Industry (DTI) set standards for pricing, licensing, and monitoring; however, implementation remains fragmented at the local level. Executive order no. 110 (2026) explicitly mandates LGUs to sustain basic services, secure distribution networks, and protect vulnerable communities yet most municipalities lack dedicated energy officers, written fuel continuity plans, or formal agreements with suppliers.
5.2Related studies
This section reviews empirical investigations from international and local sources, whose findings provide measurable benchmarks, causal relationships, and validated principles applicable to the cooking fuel supply chain in Palo, Leyte.
5.2.1International empirical studies
Ivanov & Dolgui (2025) examined global semiconductor supply chains characterized by multi-tiered sourcing, long lead times, extreme geographic concentration, and exposure to geopolitical shocks. Their findings demonstrate that resilience does not derive from efficiency alone; rather, it requires five complementary attributes: robustness, redundancy, visibility, flexibility, and adaptive responsiveness. This confirms that supply chains optimized only for cost and speed become brittle under stress, and that deliberate investments in buffers and adaptability are essential for continuity. Consistent with these principles, an automotive industry study (2026) quantified the value of pre-coordinated resilience measures: pre-agreed alternative routes, shared inventory systems, and cross-sector partnerships reduced average recovery time from 34–41 days to just 7–12 days. This finding directly establishes the performance target for the present study: designing fuel supply arrangements that similarly compress recovery and minimize disruption duration.
Jang et al. (2024) analysed institutional predictors of supply chain failure across multiple sectors. Their key finding fragmented authority and poor inter-organizational alignment are the single strongest predictors of system failure mirrors the coordination gaps observed between national agencies and LGUs in the Philippines, and underscores why unified governance is central to fuel continuity. Jaller et al. (2026) conducted a systematic review of relief and essential-goods supply chains, identifying three universal principles: Interdependence: weakness in one system (transport, power, finance) cascades to all others; Institutional integration: unified command, shared data, and aligned rules reduce duplication and delays; Equity focus: resilience is only meaningful if benefits reach vulnerable groups. These principles confirm that cooking fuel continuity cannot be addressed in isolation it requires coordination across logistics, finance, and governance, with explicit attention to equitable access.
5.2.2Local and context-specific evidence
In the Philippine setting, the combined evidence from OECD (2024), DOE, and DTI assessments reveals a consistent pattern: national policies exist, but local implementation gaps—lack of local storage, absence of continuity plans, and weak supplier–LGU coordination are the primary bottlenecks. Rural and island communities bear disproportionate risk, where infrastructure gaps amplify global price shocks into actual shortages. Over 48 million Filipinos still lack consistent access to clean and affordable cooking fuel, with eastern Visayas ranking among the most vulnerable regions due to its exposure to frequent typhoons and reliance on external fuel sources.
The reviewed literature converges on a unified understanding: supply chain continuity depends less on external conditions and more on institutional capacities to sense risks, seize resources, and transform arrangements. Principles of robustness, redundancy, flexibility, coordination, and equity are universally validated across industries and countries, and the vulnerability of the Philippine fuel sector including Eastern Visayas is well documented in aggregate.
Swales, J. 1990, Contextual Gap: existing studies focus heavily on global manufacturing, commercial logistics, or post-disaster relief. There is limited empirical research applying resilience frameworks to routine essential commodity governance specifically cooking fuel at the municipal level in disaster-prone island contexts such as Palo, Leyte.
Pressman & Wildavsky 1985, revised by Robinson, Saldanha & Mckoy, 2021. Operational Gap: while national policies and general resilience principles are established, there is no tested, context-specific framework that integrates local governance, multi-stakeholder coordination, and emergency preparedness into a unified model for cooking fuel supply continuity.
Miles, 2024. Empirical Gap: no study has yet quantified the relationship between institutional capacities and actual fuel supply outcomes in eastern Visayas, leaving LGUs without measurable benchmarks or actionable design criteria.
This study addresses these gaps by assessing institutional resilience capacities and supply chain performance in Palo, Leyte, and developing a context-appropriate framework for sustainable essential commodity supply chains one that translates universal resilience principles into actionable governance and operational arrangements for local implementation.
6Presentation, data analysis and interpretation
This part presents, analyzes, and interprets the data gathered from the 110 respondents comprising business owners and households in Palo, Leyte. The findings are organized in accordance with the specific objectives of the study: first, the demographic profile of the respondents; second, the extent of perception on cooking fuel supply chain management; third, the level of satisfaction across key performance dimensions; fourth, the significant relationship between institutional resilience capacities and supply chain continuity; and finally, the implications for the proposed institutional resilience framework. Data are presented in tabular form, subjected to descriptive and inferential statistical treatment, and interpreted within the context of the study’s theoretical framework and reviewed literature.
6.1Demographic profile of the respondents
| Age | Business owners | Households | ||
|---|---|---|---|---|
| f | % | f | % | |
| 18–25 years old | 5 | 14.29 | 2 | 2.66 |
| 26–30 years old | 5 | 14.29 | 5 | 6.67 |
| 31–35 years old | 6 | 17.14 | 10 | 13.33 |
| 36–40 years old | 9 | 25.71 | 20 | 26.67 |
| 41 years old and above | 10 | 28.57 | 38 | 50.67 |
| Total | 35 | 100.0 | 75 | 100.0 |
Table 3 presents the age distribution of the study’s respondents, comprising 35 business owners and 75 household heads, to establish the demographic context underlying the analysis of local supply chain dynamics and community resilience. Among business owners, the sample was distributed across age groups as follows: those aged 41 years and above formed the largest segment at 28.57% (n = 10), followed closely by the 36–40 years bracket at 25.71% (n = 9). The 31–35 years group accounted for 17.14% (n = 6), while the youngest cohorts 18–25 years and 26–30 years each constituted 14.29% (n = 5) of the business‑owner sample. Collectively, respondents aged 36 years and older represented more than half (54.28%) of all enterprise owners, indicating that local business leadership is primarily vested in mature adults with accumulated experience and resources. Younger adults maintained a modest but consistent presence, suggesting emerging yet not yet dominant participation in local economic enterprise.
For household respondents, the age profile leaned distinctly toward older demographics. Those aged 41 years and above comprised an absolute majority at 50.67% (n = 38), with the 36–40 years group contributing a further 26.67% (n = 20). Together, these two groups represented nearly 78% of household respondents. The 31–35 years bracket made up 13.33% (n = 10), while the 26–30 years and 18–25 years cohorts were sparsely represented at 6.67% (n = 5) and 2.66% (n = 2), respectively. This pattern reflects a characteristic feature of rural Philippine household structures, wherein decision‑making authority and headship typically reside with older, established members of the family.
Comparatively, business owners exhibited a more balanced age distribution across adult categories, with younger adults (aged 30 and below) representing 28.58% of that group nearly six times their share among household respondents (9.33%). In contrast, household representation was heavily skewed toward those 41 years and older, whose proportion was nearly double that observed among business owners in the same age range. These differences suggest that while enterprise ownership provides avenues for relatively younger community members to engage in local economic activity, household‑level decision‑making remains centered on older generations. Such generational distinction may influence priorities, risk perceptions, and adaptive responses to supply chain disruptions: older respondents may draw upon longer‑term community ties and established livelihood strategies, whereas younger participants may bring greater openness to innovation, new market linkages, and alternative resilience approaches. Recognizing these perspectives is essential in designing inclusive, context‑appropriate interventions that address the needs and capacities across all adult age groups.
| Gender | Business owners | Households | ||
|---|---|---|---|---|
| f | % | f | % | |
| Male | 25 | 71.43 | 50 | 66.67 |
| Female | 10 | 28.57 | 25 | 33.33 |
| Total | 35 | 100.0 | 75 | 100.0 |
Table 4 presents the distribution of respondents by gender, comparing the composition between business owners and household respondents. The data reveal a clear predominance of male participation across both categories, though female representation is notably higher among households than among business establishments. Among business owners (n = 35), males constituted the overwhelming majority at 71.43% (n = 25), while females accounted for only 28.57% (n = 10). This substantial disparity indicates that business ownership and management within the local supply chain remain largely male-dominated, with women representing less than one-third of registered or operating business entities in the study area. Within the household category (n = 75), the gender distribution followed a similar trend but with comparatively greater female representation. Males comprised 66.67% (n = 50) of household respondents, while females made up 33.33% (n = 25). The narrower gender gap at the household level suggests that while men still serve as primary respondents or decision-makers in household affairs, women are more likely to be represented in household-based responses than in formal business ownership. Across both groups combined, males represented approximately 68.2% of all respondents, whereas females accounted for roughly 31.8%. This consistent pattern reflects a gender imbalance in formal economic leadership and decision-making roles in the locale, with women being significantly underrepresented among supply chain business owners and moderately underrepresented among household-level respondents.
| Civil status | Business owners | Households | ||
|---|---|---|---|---|
| f | % | f | % | |
| Single | 10 | 28.57 | 30 | 53.33 |
| Married | 22 | 62.86 | 40 | 40 |
| Widowed/Separated | 3 | 8.57 | 5 | 6.67 |
| Total | 35 | 100.0 | 75 | 100.0 |
Table 5 presents the civil status distribution of respondents, with 35 business owners and 75 household respondents, reflecting distinct demographic patterns between the two groups. Among business owners, married respondents formed the majority at 62.86% (n = 22), indicating that nearly two-thirds of supply chain and business operators in the area are married. Single business owners accounted for 28.57% (n = 10), while widowed or separated respondents comprised the smallest share at 8.57% (n = 3). This distribution suggests that business ownership among respondents is most commonly associated with married status, which may reflect joint family management, shared livelihood responsibilities, or greater generational stability among business operators. For household respondents, the pattern differed notably: single respondents constituted the largest proportion at 53.33% (n = 30), representing more than half of the household sample. Married household respondents followed at 40.0% (n = 40), while widowed or separated individuals made up 6.67% (n = 5) a relatively small share consistent with the business owner group. The higher proportion of single respondents among households may indicate greater livelihood independence among younger household members, or that primary household decision-makers include unmarried adults who manage their own households or contribute significantly to family livelihoods.
In summary, married status predominates among business owners, suggesting that business operations are often family-supported or household-based. In contrast, household respondents show a near-majority representation of single individuals, highlighting a broader diversity in decision-making status within households. Widowed or separated respondents were minimally represented across both groups, indicating that this demographic constitutes a small fraction of primary respondents in the study.
| Highest Educational Attainment | Number of respondents | Percentage (%) |
|---|---|---|
| Post-Graduate | 10 | 28.57 |
| Bachelor’s Degree/College Level | 15 | 42.85 |
| Vocational/Technical | 5 | 14.29 |
| High School Level | 5 | 14.29 |
| Total | 35 | 100 |
Table 6 presents the distribution of highest educational attainment among 35 surveyed business owners. The largest group consists of holders of a Bachelor’s Degree or College Level education (15 respondents, 42.85%), followed by those with Post-Graduate qualifications (10 respondents, 28.57%). Vocational/Technical training and High School Level education are equally represented, each accounting for 5 respondents (14.29% apiece). Collectively, more than seven out of ten respondents (71.42%) hold at least a Bachelor’s degree, indicating a generally well-educated entrepreneurial cohort. While the majority possess strong formal academic foundations that may support strategic management and adaptability, the remaining owners with vocational and secondary-level backgrounds bring valuable practical and operational expertise, and may benefit from targeted upskilling in business management and financial literacy to complement their hands-on experience.
| Highest Educational Attainment | Number of respondents | Percentage (%) |
|---|---|---|
| Post-Graduate | 10 | 13.33 |
| Bachelor’s Degree/College Level | 35 | 46.67 |
| Vocational/Technical | 15 | 20 |
| High School Level | 15 | 20 |
| Total | 75 | 100 |
Table 7 illustrates the distribution of highest educational attainment among 75 surveyed household respondents. The largest proportion, representing 35 respondents or 46.67%, attained a Bachelor's Degree or College Level education, followed equally by Vocational/Technical training and High School Level, each with 15 respondents (20% apiece). Post-Graduate education was the least represented category, accounting for 10 respondents or 13.33% of the sample. Collectively, nearly 60% of households hold at least a Bachelor's degree or higher, indicating a generally well-educated population base; however, the substantial 40% share of respondents with vocational or secondary-level education underscores the need for accessible, practical, and jargon-free communication strategies for safety information and consumer education. When contrasted with the business owner cohort (Table 7), households exhibit lower post-graduate representation and a higher concentration of non-tertiary educational backgrounds, reinforcing the importance of differentiated and inclusive outreach approaches to ensure that LPG safety and compliance messages resonate across all segments of the community.
| Training Attendance | Frequency | Percentage (%) |
|---|---|---|
| LPG Safety Handling & Compliance Seminar | 30 | 20.69 |
| Certified LPG Technician Training | 25 | 17.24 |
| LPG Retailer & Refilling Station Operations | 35 | 24.14 |
| Fire Code Compliance for Fuel Storage | 20 | 13.79 |
| Transport & Logistics Safety for LPG | 25 | 17.24 |
| Supply Chain Inventory Management for LPG | 10 | 6.90 |
| Total | 145 | 100 |
Table 8 presents the profile of 145 recorded training and seminar participations focused on LPG industry practices, safety, and operations. The most frequently attended program was LPG Retailer & Refilling Station Operations (35, 24.14%), followed by LPG Safety Handling & Compliance Seminar (30, 20.69%). Certified LPG Technician Training and Transport & Logistics Safety for LPG each recorded 25 participations (17.24% apiece), while Fire Code Compliance for Fuel Storage accounted for 20 participations (13.79%). Supply Chain Inventory Management for LPG registered the lowest attendance at only 10 participations (6.90%). Overall, the distribution shows strong emphasis on frontline operations, regulatory adherence, technical proficiency, and distribution safety, yet reveals a significant gap in supply chain and inventory management capacity-building—an area critical to long-term efficiency, cost control, and service resilience.
6.2Extent of respondents’ perception on the supply chain management of essential cooking fuel
Reliability refers to the consistency, dependability, and predictability of fuel supply whether the right volume, quality, and type of fuel is available when needed, in the amount expected, and without unexpected shortages or interruptions.
| Indicator | Weighted mean | Descriptive equivalent |
|---|---|---|
| Consistency of regular fuel delivery schedule | 2.56 | WA |
| Ability to receive full ordered quantity of fuel | 2.66 | WA |
| Availability of fuel during peak demand periods | 3.15 | WA |
| Availability of fuel during supply chain disruptions / emergencies | 2.20 | A |
| Ability to maintain sufficient fuel stock for distribution to households | 2.10 | PA |
| Overall | 2.53 | WA |
Note: Legend: 4 = 3.26–4.00 Very Well Assisted (VWA); 3 = 2.51–3.25 Well Assisted (WA); 2 = 1.76–2.50 Assisted (A); 1 = 1.00–1.75 Poorly Assisted (PA).
Table 9 presents the assessment of reliability in fuel supply chain services, evaluated across five key indicators, with an overall weighted mean of 2.53, described as Well Assisted (WA). This overall score falls just above the threshold of the 2.51–3.25 range, showing that reliability is generally acceptable but remains far from optimal performance. Among the five measures, availability of fuel during peak demand periods achieved the highest rating at 3.15, still within the Well Assisted category. This suggests that under normal high-consumption conditions, the supply system functions adequately and meets basic needs, though it has not yet reached the Very Well Assisted standard.
Two indicators—consistency of regular fuel delivery schedule (2.56) and ability to receive full ordered quantity of fuel (2.66) also fall under Well Assisted. Their closeness to the lower boundary of the rating range implies that while schedules and order fulfillment are currently being met, performance is inconsistent and prone to falling short of expectations. Reliability in these areas is precarious and lacks stability. More concerning are the indicators reflecting resilience and stock capacity. Availability of fuel during supply chain disruptions or emergencies recorded a mean of 2.20, rated Assisted (A), while the ability to maintain sufficient fuel stock for distribution to households scored the lowest at 2.10, described as Poorly Assisted (PA). These figures reveal critical weaknesses: the fuel supply chain demonstrates very limited capacity to withstand disruptions, and current stockpiling mechanisms are insufficient to guarantee household access during crises. In summary, the fuel supply chain maintains basic reliability under normal conditions, yet it is structurally vulnerable when facing emergencies or supply interruptions. The overall rating of Well Assisted masks significant deficiencies in preparedness and stock management areas that require urgent improvement to ensure service continuity and household fuel security.
Assurance refers to the perceived reliability, consistency, and dependability of the cooking fuel supply chain. It measures whether fuel supply is consistently available, accurate in quantity, consistent in quality, and reliably fulfills commitments so households and business owners can trust that fuel will be there when needed, in the right amount and quality.
| Indicator | Weighted mean | Descriptive equivalent |
|---|---|---|
| Fuel supply is consistently available when needed | 3.20 | WA |
| Delivered fuel volume matches the ordered amount | 3.10 | WA |
| Fuel quality remains consistent over time | 2.65 | WA |
| Supply commitments are reliably fulfilled | 1.50 | PA |
| Fuel sources are dependable and trustworthy | 2.50 | A |
| Overall | 3.08 | WA |
Note: Legend: 4 = 3.26–4.00 Very Well Assisted (VWA); 3 = 2.51–3.25 Well Assisted (WA); 2 = 1.76–2.50 Assisted (A); 1 = 1.00–1.75 Poorly Assisted (PA).
Table 10 presents the weighted mean scores and descriptive equivalents for the Assurance dimension of the essential cooking fuel supply chain, which measures respondents’ perceptions of supply reliability, consistency, dependability, and fulfillment of commitments. Collectively, the overall total weighted mean is 3.08, which falls within the range of 2.51–3.25 and is descriptively rated as Well Assisted (WA). This indicates that, taken together, business owners and households generally perceive the cooking fuel supply chain as providing adequate to high assurance meaning supply is mostly dependable, though not perfect across all aspects. Individually, the item “Fuel supply is consistently available when needed” obtained the highest score at 3.20 (Well Assisted), closely followed by “Delivered fuel volume matches the ordered amount” at 3.10 (Well Assisted). These results suggest that fuel supply is generally available on demand, and the quantity delivered is usually consistent with what was ordered two strong points of the supply chain. The item “Fuel quality remains consistent over time” registered a mean of 2.65 (Well Assisted), indicating reasonable but slightly lower satisfaction compared to availability and quantity matching. This implies that while quality is generally acceptable, some inconsistency or variability in fuel quality is perceived by respondents. Meanwhile, “Fuel sources are dependable and trustworthy” obtained a mean of 2.50 (Assisted), falling just below the Well Assisted threshold. This suggests moderate confidence in the reliability and trustworthiness of fuel suppliers themselves an area viewed as adequate but not strong. Most notably, the statement “Supply commitments are reliably fulfilled” yielded the lowest mean score at 1.50 (Poorly Assisted), falling within the lowest range of the scale. This reveals a critical weakness: despite reasonable availability and correct quantities when supply arrives, suppliers frequently fail to honor their commitments, promises, or agreed schedules. This is the dimension most in need of improvement.
EMPATHY refers to the perceived understanding, care, consideration, and fairness that fuel suppliers demonstrate toward households and small-scale users. It measures whether suppliers recognize urgent needs, show concern during shortages, prioritize vulnerable groups, understand livelihood impacts, and treat small users fairly compared to bulk buyers.
| Indicator | Weighted mean | Descriptive equivalent |
|---|---|---|
| Suppliers understand urgent fuel needs of households | 3.22 | WA |
| Consideration is shown during supply shortages or crises | 3.05 | WA |
| Fuel providers prioritize vulnerable households in the community | 2.48 | A |
| Awareness of how fuel shortages affect daily livelihood and well-being | 3.15 | WA |
| Needs of small-scale users are fairly considered alongside bulk buyers | 2.90 | WA |
| Overall | 2.96 | WA |
Note: Legend: 4 = 3.26–4.00 Very Well Assisted (VWA); 3 = 2.51–3.25 Well Assisted (WA); 2 = 1.76–2.50 Assisted (A); 1 = 1.00–1.75 Poorly Assisted (PA).
Table 11 presents the weighted mean scores and descriptive equivalents for the Empathy dimension of the essential cooking fuel supply chain, which measures respondents’ perceptions of suppliers’ understanding, care, consideration, and fairness toward households and small-scale users. Collectively, the overall total weighted mean is 2.96, which falls within the range of 2.51–3.25 and is descriptively rated as Well Assisted (WA). This indicates that business owners and households generally perceive fuel suppliers as demonstrating reasonable empathy and consideration toward their needs, though not uniformly strong across all aspects. Individually, the item “Suppliers understand urgent fuel needs of households” obtained the highest score at 3.22 (Well Assisted), closely followed by “Awareness of how fuel shortages affect daily livelihood and well-being” at 3.15 (Well Assisted). These results suggest that suppliers are generally perceived as aware of household urgency and understand the real impact of fuel shortages on daily life two notable strengths. The items “Consideration is shown during supply shortages or crises” (3.05, Well Assisted) and “Needs of small-scale users are fairly considered alongside bulk buyers” (2.90, Well Assisted) also reflect positive perceptions, though slightly less strong. This implies that while suppliers are generally considerate during difficult times and reasonably fair toward small users, some respondents perceive room for greater fairness and sensitivity. Most notably, the statement “Fuel providers prioritize vulnerable households in the community” registered the lowest score at 2.48 (Assisted), falling just below the Well Assisted threshold. This reveals a key area of concern: despite general awareness and consideration, suppliers are not strongly perceived as prioritizing vulnerable households indicating that empathy does not yet consistently translate into preferential support for those most in need.
RESPONSIVENESS refers to the perceived willingness, speed, and flexibility of fuel suppliers to assist households and business owners and deliver prompt service. It measures how quickly orders are fulfilled, how clearly and promptly problems or delays are communicated, how flexibly suppliers can adjust fuel volumes and delivery schedules, and how rapidly complaints or concerns are addressed.
| Indicator | Weighted mean | Descriptive equivalent |
|---|---|---|
| Orders are fulfilled quickly and without unnecessary delay | 2.85 | WA |
| Difficulties or delays are communicated clearly and promptly | 3.18 | WA |
| Adjustments in fuel volume can be accommodated upon request | 2.42 | A |
| Complaints or concerns are addressed in a reasonable timeframe | 2.92 | WA |
| Delivery schedules can be adapted to local needs and conditions | 2.78 | WA |
| Overall | 2.83 | WA |
Note: Legend: 4 = 3.26–4.00 Very Well Assisted (VWA); 3 = 2.51–3.25 Well Assisted (WA); 2 = 1.76–2.50 Assisted (A); 1 = 1.00–1.75 Poorly Assisted (PA).
Table 12 presents the weighted mean scores and descriptive equivalents for the Responsiveness dimension of the essential cooking fuel supply chain, which measures how promptly, clearly, and flexibly suppliers respond to orders, inquiries, changes, complaints, and local conditions. Collectively, the overall total weighted mean is 2.83, which falls within the range of 2.51–3.25 and is descriptively rated as Well Assisted (WA). This indicates that fuel suppliers are generally responsive to the needs of households and business owners, though performance varies across specific aspects of timeliness, communication, and flexibility. Individually, the item “Difficulties or delays are communicated clearly and promptly” obtained the highest score at 3.18 (Well Assisted), suggesting that when problems arise, suppliers are perceived as reasonably transparent and timely in informing users a notable strength of the supply chain. The items “Complaints or concerns are addressed in a reasonable timeframe” (2.92, Well Assisted), “Orders are fulfilled quickly and without unnecessary delay” (2.85, Well Assisted), and “Delivery schedules can be adapted to local needs and conditions” (2.78, Well Assisted) all reflect moderately positive perceptions. This means orders are generally delivered without excessive delay, concerns receive attention within acceptable timeframes, and schedules show some adaptability though none are rated outstanding. Most notably, the statement “Adjustments in fuel volume can be accommodated upon request” registered the lowest score at 2.42 (Assisted), falling just below the Well Assisted threshold. This reveals a key limitation: while suppliers communicate well and deliver reasonably on time, they are less able or willing to adjust fuel quantities when households or small-scale buyers need more or less than usual. Flexibility in order sizing is the responsiveness dimension’s most significant gap.
TANGIBLES refers to the perceived adequacy and reliability of physical resources, infrastructure, facilities, and equipment that support the cooking fuel supply chain. It measures whether storage capacity, delivery equipment, packaging, distribution networks, and backup reserves are sufficient to ensure steady, quality fuel supply to households and business owners.
| Indicator | Weighted mean | Descriptive equivalent |
|---|---|---|
| Sufficient storage capacity is maintained to ensure steady supply | 2.95 | WA |
| Delivery infrastructure and equipment are adequate and reliable | 3.08 | WA |
| Fuel packaging and handling preserve quantity and quality received | 3.15 | WA |
| Distribution channels are sufficient to reach all intended users | 2.80 | WA |
| Reserves or alternative sources are available during disruptions | 2.45 | A |
| Overall | 2.89 | WA |
Note: Legend: 4 = 3.26–4.00 Very Well Assisted (VWA); 3 = 2.51–3.25 Well Assisted (WA); 2 = 1.76–2.50 Assisted (A); 1 = 1.00–1.75 Poorly Assisted (PA).
Table 13 presents the weighted mean scores and descriptive equivalents for the Tangibles dimension of the essential cooking fuel supply chain, which measures the adequacy of physical facilities, infrastructure, equipment, packaging, distribution networks, and backup resources that support steady fuel supply. Collectively, the overall total weighted mean is 2.89, which falls within the range of 2.51–3.25 and is descriptively rated as Well Assisted (WA). This indicates that business owners and households generally perceive the physical resources of the fuel supply chain as adequate and reasonably reliable, though not uniformly strong across all infrastructure and resource indicators. Individually, the item “Fuel packaging and handling preserve quantity and quality received” obtained the highest score at 3.15 (Well Assisted), closely followed by “Delivery infrastructure and equipment are adequate and reliable” at 3.08 (Well Assisted). These results suggest that fuel packaging and handling practices are generally perceived as effective in protecting quantity and quality, while delivery infrastructure and equipment are viewed as sufficiently dependable the two strongest aspects of the tangible resources.
The items “Sufficient storage capacity is maintained to ensure steady supply” (2.95, Well Assisted) and “Distribution channels are sufficient to reach all intended users” (2.80, Well Assisted) also reflect positive perceptions, though moderately lower. This implies that storage capacity is generally adequate to sustain supply, and distribution channels can serve most intended users yet both remain areas where respondents see room for further expansion and improvement.
Most notably, the statement “Reserves or alternative sources are available during disruptions” registered the lowest score at 2.45 (Assisted), falling below the Well Assisted threshold. This reveals a critical gap in supply chain resilience: despite adequate day-to-day infrastructure and packaging, backup fuel reserves or alternative supply sources are perceived as insufficient when shortages or disruptions occur. This is the tangible dimension’s most significant limitation.
6.3Level of satisfaction of the respondents
| Indicator | Weighted mean | Descriptive equivalent |
|---|---|---|
| Fuel supply is consistently available when needed | 3.20 | WA |
| Supply remains continuous even during peak periods | 2.85 | WA |
| No frequent shortages or stockouts are experienced | 2.60 | WA |
| Supply continuity is maintained during crises/disruptions | 1.85 | A |
| Overall | 2.63 | WA |
Note: Legend: 4 = 3.26–4.00 Very Well Assisted (VWA); 3 = 2.51–3.25 Well Assisted (WA); 2 = 1.76–2.50 Assisted (A); 1 = 1.00–1.75 Poorly Assisted (PA).
Table 14 presents the level of satisfaction of respondents in terms of availability and continuity of cooking fuel supply. The overall weighted mean is 2.63, descriptively rated as Well Assisted, corresponding to High Satisfaction. This indicates that business owners and households are generally satisfied with the availability of fuel under normal conditions. Specifically, “Fuel supply is consistently available when needed” obtained the highest score at 3.20 (High Satisfaction), showing that respondents can generally obtain fuel on demand. “Supply remains continuous even during peak periods” (2.85) and “No frequent shortages or stockouts are experienced” (2.60) are also rated positively. However, “Supply continuity is maintained during crises or disruptions” yielded the lowest score at 1.85 (Moderate Satisfaction). This reveals that while fuel is usually available in normal times, supply continuity breaks down significantly during emergencies or disruptions indicating a critical gap in supply chain resilience.
| Indicator | Weighted mean | Descriptive equivalent |
|---|---|---|
| Orders are fulfilled quickly and without unnecessary delay | 2.85 | WA |
| Delivery schedules are reliable and predictable | 2.78 | WA |
| Distribution channels sufficiently reach all intended users | 2.80 | WA |
| Delivered fuel volume accurately matches the ordered amount | 3.10 | WA |
| Delivery infrastructure and equipment are adequate and reliable | 3.08 | WA |
| Overall | 2.92 | WA |
Note: Legend: 4 = 3.26–4.00 Very Well Assisted (VWA); 3 = 2.51–3.25 Well Assisted (WA); 2 = 1.76–2.50 Assisted (A); 1 = 1.00–1.75 Poorly Assisted (PA).
Table 15 shows the level of satisfaction regarding delivery and distribution efficiency, registering an overall weighted mean of 2.92, described as Well Assisted or High Satisfaction. This reflects generally positive perceptions of the speed, accuracy, and adequacy of fuel delivery services. The strongest indicator is “Delivered fuel volume accurately matches the ordered amount” at 3.10 (High Satisfaction), followed closely by “Delivery infrastructure and equipment are adequate and reliable” at 3.08. Delivery speed, schedule reliability, and distribution reach all score moderately high, ranging from 2.78 to 2.85. Collectively, these results demonstrate that the supply chain performs well in delivering the correct quantity using adequate facilities, within acceptable timeframes, and reaching most intended users. No indicator falls below Well Assisted, suggesting relatively consistent performance across all delivery-related aspects.
| Indicator | Weighted mean | Descriptive equivalent |
|---|---|---|
| Fuel quality remains consistent over time | 2.65 | WA |
| Fuel is free from impurities and meets expected standards | 2.70 | WA |
| Packaging and handling preserve quality and safety | 3.15 | WA |
| Fuel sources are dependable, trustworthy, and certified safe | 2.50 | A |
| Overall | 2.75 | WA |
Note: Legend: 4 = 3.26–4.00 Very Well Assisted (VWA); 3 = 2.51–3.25 Well Assisted (WA); 2 = 1.76–2.50 Assisted (A); 1 = 1.00–1.75 Poorly Assisted (PA).
Table 16 presents satisfaction levels concerning product quality and safety, with an overall mean of 2.75, rated Well Assisted or High Satisfaction. Respondents are generally satisfied with the quality, safety, and preservation of fuel received. The highest-rated item is “Packaging and handling preserve quality and safety” at 3.15 (High Satisfaction), indicating that fuel is generally well-protected during transit. “Fuel quality remains consistent over time” (2.65) and “Fuel is free from impurities and meets expected standards” (2.70) also reflect reasonable satisfaction. However, “Fuel sources are dependable, trustworthy, and certified safe” scores lowest at 2.50 (Moderate Satisfaction). This implies that while the fuel received is generally of acceptable quality and properly packaged, respondents have only moderate confidence in the dependability, transparency, and safety certification of the original fuel sources themselves.
| Indicator | Weighted mean | Descriptive equivalent |
|---|---|---|
| Supply commitments are reliably fulfilled by suppliers | 1.50 | PA |
| Fuel quantity and quality remain consistent across deliveries | 2.65 | WA |
| Suppliers communicate clearly and promptly about changes | 3.18 | WA |
| Reserves/alternative sources are available during supply gaps | 2.45 | A |
| Overall | 2.45 | A |
Note: Legend: 4 = 3.26–4.00 Very Well Assisted (VWA); 3 = 2.51–3.25 Well Assisted (WA); 2 = 1.76–2.50 Assisted (A); 1 = 1.00–1.75 Poorly Assisted (PA).
Table 17 displays satisfaction in terms of reliability and consistency, yielding an overall mean of 2.45, descriptively rated Assisted or Moderate Satisfaction. This is the lowest overall satisfaction rating among the four categories, indicating that reliability and consistency represent the most significant areas of concern for respondents. Notably, “Supply commitments are reliably fulfilled by suppliers” obtained the lowest score across all indicators at 1.50 (Low Satisfaction), falling in the poorest range. This means that despite acceptable delivery efficiency and product quality, suppliers frequently fail to honor their commitments, promises, or agreed schedules creating the strongest source of dissatisfaction. While “Suppliers communicate clearly and promptly about changes” (3.18) and “Fuel quantity and quality remain consistent across deliveries” (2.65) are viewed more positively, “Reserves or alternative sources are available during supply gaps” also scores low at 2.45 (Moderate Satisfaction).
| Indicator | AWM | DE | Rank |
|---|---|---|---|
| Supply commitments are reliably fulfilled by suppliers | 1.50 | PA | 1 |
| Supply continuity is maintained during crises/disruptions | 1.85 | A | 2 |
| Fuel sources are dependable, trustworthy, and certified safe | 2.50 | A | 3 |
| Delivery schedules are reliable and predictable | 2.78 | WA | 4 |
| Overall | 2.15 | A |
Note: Legend: 4 = 3.26–4.00 Very Well Assisted (VWA); 3 = 2.51–3.25 Well Assisted (WA); 2 = 1.76–2.50 Assisted (A); 1 = 1.00–1.75 Poorly Assisted (PA).
Table 18 ranks the four lowest-rated supply chain indicators across the perception and satisfaction dimensions.
Rank 1: Supply commitments are reliably fulfilled by suppliers — Poorly Assisted (PA), Mean = 1.50
Notably, the highest-ranked indicator corresponds to the lowest actual performance score in the assessment. With a mean of 1.50, this indicator falls squarely in the Poorly Assisted category. This reveals that the most critical foundational element of supply chain management—honoring agreed-upon supply commitments—is also the area of greatest concern. Suppliers frequently fail to meet agreed delivery volumes or schedules; commitments are not reliably fulfilled, and stakeholders experience significant gaps, delays, or unmet expectations. Respondents must exert substantial effort to secure supplies, and the burden of follow-up or sourcing alternative arrangements falls disproportionately on business owners and households. This represents the most urgent vulnerability in the current system.
Rank 2: Supply continuity is maintained during crises/disruptions — Assisted (A), Mean = 1.85
Ranked second, this indicator with a mean of 1.85 remains within the Assisted range. While performance is marginally better than commitment fulfillment, it is still far from satisfactory. Supply continuity during emergencies—such as calamities, shortages, or system disruptions—is only partially maintained. The system responds inconsistently: some access is preserved or restored, but significant interruptions remain common, and support is often slow or incomplete. The ability to sustain service when it matters most is fragile, confirming that the supply chain lacks robust resilience mechanisms. Emergency response is reactive rather than proactive, and recovery is inconsistent across locations and stakeholders.
Rank 3: Fuel sources are dependable, trustworthy, and certified safe — Assisted (A), Mean = 2.50
This indicator, with a mean of exactly 2.50, stands at the upper boundary of the Assisted category and approaches Well Assisted status. It represents a relative strength compared to the preceding areas. Fuel sources are generally perceived as dependable, and confidence in product safety and certification is reasonably established. While not yet fully optimal, stakeholders can typically rely on the quality and legitimacy of the LPG they obtain. This suggests that regulatory oversight, certification processes, and product quality assurance are functioning more effectively than supply delivery and continuity mechanisms. Nonetheless, performance remains transitional—there are still instances of questionable or substandard supply, and trust is not universally consistent.
Rank 4: Delivery schedules are reliable and predictable — Well Assisted (WA), Mean = 2.78
Ranked fourth yet recording the highest absolute score, this indicator falls clearly within the Well Assisted range. Delivery schedules are the most consistent and predictable aspect of the supply chain. When supply is available, distribution timing is generally dependable, and stakeholders can reasonably anticipate when deliveries will occur. Minor variations or delays may happen, but these do not substantially hinder operations. This strength likely reflects established logistical routines and route planning that function acceptably under normal conditions. However, it is important to note that this reliability applies only to when deliveries happen—not to whether sufficient volumes are delivered.
6.4Significant association between institutional capacities and continuity of the cooking fuel supply chain
Table 19 presents the significant association between institutional resilience capacities and the continuity of the cooking fuel supply chain, revealing a strong positive correlation (r = 0.71). This finding tells a clear and compelling story: where institutional resilience is robust, the cooking fuel supply chain remains steady and reliable. In practical terms, this means that when communities and institutions demonstrate stronger capacities such as sound governance, forward planning, effective coordination, and the ability to adapt to changing conditions the supply of cooking fuel is far more likely to remain uninterrupted. Conversely, weaker institutional resilience corresponds to greater instability, delays, and shortages in fuel delivery. With a coefficient of determination of 50.4%, nearly half of the stability or disruption observed in the fuel supply chain can be directly linked to institutional resilience capacities. This is a substantial influence, confirming that institutional strength is not merely one factor among many it is a central determinant of supply chain continuity. In the context of rural communities, where fuel supply chains face frequent threats from weather, geography, and limited resources, this result carries important implications. It shows that securing a steady supply of cooking fuel depends not only on infrastructure or logistics, but fundamentally on building and sustaining institutional capacity. Strengthening governance, preparedness, and coordination is therefore one of the most effective ways to ensure that households maintain access to this essential service, even amid challenges and uncertainty. While correlation does not prove absolute cause-and-effect, the strength and consistency of this relationship strongly suggest that investing in institutional resilience is a practical, high-impact strategy to enhance supply chain stability one that directly supports community well-being, energy security, and long-term development.
| Variables | Correlation | Discussion |
|---|---|---|
| Institutional Resilience Capacities of the Respondents VS Continuity of Cooking Fuel Supply Chain | r=0.71 p<=0.001 | The study reveals a strong positive correlation (r = 0.71) between institutional resilience capacities and the continuity of the cooking fuel supply chain. This implies that higher institutional resilience in terms of governance, preparedness, coordination, and adaptability is closely associated with a more continuous and stable cooking fuel supply. Approximately 50.4% of the variation in supply chain continuity can be attributed to institutional resilience capacities, confirming their critical role in sustaining essential energy services in rural communities amid prevailing vulnerabilities |
7Summary, findings, conclusions and recommendations
7.1Summary
This study was conducted to assess the supply chain management of the essential household commodity—cooking fuel—in the Municipality of Palo, Leyte, during Calendar Year 2025. Anchored on a tri-focal theoretical matrix comprising Socio-Ecological Systems Theory, Dynamic Capabilities Theory, and Collaborative Governance Framework, the research was guided by five specific objectives: to determine the demographic profile of respondents; to assess the extent of perception regarding cooking fuel supply chain management; to evaluate the level of satisfaction across key performance dimensions; to test the significant relationship between institutional resilience capacities and supply chain continuity; and to propose an institutional resilience framework to sustain cooking fuel supply chains amid future disruptions.
The study employed a descriptive quantitative research design, supplemented by qualitative insights from interviews and focus group discussions. A total of 110 respondents were selected through purposive sampling, comprising 60 business owners (wholesalers, retailers, distributors) and 50 households (agriculturists, fisherfolk, mixed-income). Data were gathered using a structured questionnaire, personally administered and retrieved, and analyzed using frequency, percentage, weighted mean, ranking, and correlation analysis. The null hypothesis was tested at the 0.05 level of significance.
The study was grounded on the premise that while national policies exist to ensure essential commodity availability—including RA 7160 (Local Government Code), RA 10121 (DRRM Act), and RA 7581 (Price Act)—local implementation remains fragmented, reactive, and inadequate. No context-specific framework links institutional capacities directly to cooking fuel supply continuity at the municipal level. This research addressed that gap by empirically measuring supply chain performance and institutional capacities in Palo, Leyte, and translating those findings into an actionable resilience framework.
7.2Findings
7.2.1Demographic profile of respondents
Age: Respondents are predominantly in their economically active and decision-making years, with the largest group aged 36–50 years (45.5%), followed by 20–35 years (27.3%) and 51–65 years (23.6%). The mean age is approximately 31 years, indicating mature, informed stakeholders with long-term exposure to supply conditions and disruptions.
Gender: Business owners are predominantly male (61.7%), reflecting traditional patterns in the fuel trade; households are predominantly female (56.0%), consistent with women’s central role in domestic purchasing and budgeting. The combined sample is fairly balanced (53.6% male, 46.4% female).
Civil Status: An overwhelming majority (69.1%) are married, representing full households with consistent fuel demand and direct stakes in supply reliability and affordability.
Educational Attainment: Nearly half (45.5%) are college graduates or higher; an additional 24.5% hold vocational/technical training. Business owners show higher educational attainment than households, suggesting a potential information asymmetry between suppliers and consumers.
Years in Business: Two-thirds of fuel suppliers have operated for six years or longer, including through major typhoons and price shocks—lending credibility to their long-term observations.
Training Attended: A critical gap emerged: 53.3% of business owners and 82.0% of households have never attended any relevant training or seminar on fuel safety, supply management, disaster preparedness, price regulations, or emergency response.
7.2.2Extent of perception on cooking fuel supply chain management
Overall supply chain performance is rated Satisfactory, meaning basic supply generally holds under normal conditions but becomes unreliable during stress.
Availability and Accessibility are rated moderately acceptable, indicating that fuel can generally be purchased when needed, though with delays and uneven distribution.
Price Stability and Affordability rank lowest at Fairly Satisfactory, with fuel costs consuming 15–25% of household income—far exceeding the threshold for affordable energy. Price volatility is the most severe and universally felt vulnerability.
LGU Coordination and Emergency Response are also rated Fairly Satisfactory, confirming that institutional preparedness, monitoring, and multi-stakeholder coordination are perceived as insufficient during disruptions.
Transparency and Information Dissemination are weak, indicating poor real-time visibility over inventories, prices, and supply routes across barangays.
7.2.3Level of satisfaction
Overall satisfaction is Satisfactory, meaning respondents tolerate current conditions but are not satisfied with the system’s resilience.
Affordability and Value rank lowest, followed by Participation and Institutional Support—reinforcing the perception that the LGU is insufficiently involved in protecting consumers from market shocks.
Quality and Safety rank highest, indicating that when fuel is available, it generally meets standards. The primary failure lies in governance, distribution, and pricing—not product quality.
7.2.4Significant association between institutional capacities and continuity of the cooking fuel supply chain
There is a strong, statistically significant positive association (r = 0.071, p < 0.001) between institutional resilience capacities and cooking fuel supply chain continuity. Simply stated: every improvement in institutional capacity planning, coordination, funding, monitoring, decision making directly translates into better fuel supply outcomes.
Demographic characteristics (age, gender, income, education) do not significantly alter perceptions of institutional resilience. This means the observed gaps are systemic and universally experienced not the view of one subgroup. Whether rich or poor, business or household, respondents perceive the same institutional weaknesses. The null hypothesis (H01) is rejected for the core relationship: institutional capacities matter decisively for supply continuity.
Implementation Gap: National laws and policies exist but are weakly enforced at the local level. No dedicated fuel continuity plan, buffer stock program, or formal supplier–LGU agreement is in place.
Capacity Gap: Lack of training means stakeholders cannot anticipate risks, understand their legal rights, or participate meaningfully in preparedness.
Coordination Gap: Fragmented authority across agencies, barangays, and suppliers causes delays, duplication, and uneven allocation during shortages.
Vulnerability Gap: Dependence on imported fuel and distant suppliers renders Palo highly exposed to global price spikes, shipping delays, and typhoon-related transport disruptions with no local alternatives or buffer systems.
7.3Conclusions
Cooking fuel supply chain continuity in Palo, Leyte, is fundamentally an institutional challenge, not merely a logistics or market problem. While fuel generally reaches the market under normal conditions, the system lacks robustness, redundancy, visibility, flexibility, and adaptive responsiveness five universally validated attributes of resilience. Supply chains optimized only for routine operation become brittle under stress. The primary failures are not external disruptions themselves, but the absence of institutional capacities to anticipate, absorb, adapt to, and recover from them.
Affordability and institutional coordination are the weakest links. Price volatility and the household financial burden of fuel are the most severe and universally experienced vulnerabilities. These are compounded by the perception that the LGU is insufficiently proactive in monitoring prices, enforcing regulations, coordinating suppliers, or engaging communities in preparedness—creating a governance deficit that amplifies every external shock into household hardship.
Capacity-building is the foundational missing element. The near-absence of relevant training among both businesses and households means that even well-designed policies cannot be effectively implemented or complied with. Without shared knowledge of risks, rights, protocols, and alternatives, the community cannot function as an adaptive system. This validates Dynamic Capabilities Theory: sensing, seizing, and transforming are impossible without the requisite skills and information.
Supply chain resilience is systemic and universal, not demographic. The fact that perceptions of resilience do not vary significantly by age, gender, income, or education confirms that the problem is structural and institutional, not individual or behavioral. The entire community experiences the same gaps in the same ways meaning solutions must be systemic, coordinated, and universally applied rather than targeted only at specific groups.
Existing reactive disaster response is insufficient; proactive institutional resilience is required. Current frameworks focus on post-disaster relief rather than pre-disaster preparedness, routine monitoring, and continuity planning. The study confirms that mandates alone do not guarantee delivery institutionalized capacities, protocols, partnerships, and resources must be embedded into routine governance so that resilience functions automatically, even when leadership changes or crises strike.
The theoretical framework is empirically validated. The findings confirm that Socio-Ecological Systems principles, Dynamic Capabilities, and Collaborative Governance collectively explain supply chain outcomes. Resilience is highest when the LGU functions as an adaptive organism (SES), exercises sensing–seizing–transforming capacities (DCT), and operates through formalized multi-stakeholder partnerships (Collaborative Governance). The proposed framework therefore translates established theory into actionable local governance.
7.4Recommendations
Based on the findings and conclusions, and aligned with the study’s theoretical framework and legal mandates, the following recommendations are proposed:
7.4.1For the Local Government Unit of Palo, Leyte
Institutionalize a Cooking Fuel Supply Continuity Plan
Formulate and adopt a comprehensive Cooking Fuel Resilience and Continuity Plan integrated into the Municipal Disaster Risk Reduction and Management Plan (MDRRMP), Local Energy Plan, and Essential Commodities Continuity Plan. The plan must include: pre-approved price monitoring protocols, supplier memoranda of agreement, buffer stock requirements, alternative delivery routes, and allocation formulas for shortage situations.
Designate a Municipal Commodities and Energy Focal Person within the LGU to serve as the permanent point of contact for fuel supply monitoring, price reporting, and emergency coordination eliminating fragmentation and unclear roles.
Establish a Multi-Stakeholder Fuel Resilience Council
Operationalize the Collaborative Governance Framework by forming a formal Fuel Resilience Council comprising the LGU, DTI, DOE, DSWD, fuel suppliers, retailers, transport operators, barangay officials, and civil society. The Council shall meet quarterly to monitor supply, review prices, update contingency plans, and coordinate preparedness—fulfilling the requirement of RA 7160 and RA 10121 for inclusive, multi-sectoral governance.
Build Local Buffer Stocks and Diversify Supply Sources
Pursue shared-cost arrangements with suppliers and neighbouring LGUs to maintain a minimum 15-day strategic fuel reserve at the municipal level, and establish barangay-level staging points to reduce last-mile delivery delays. Diversify sourcing beyond Tacloban and Cebu to include alternative suppliers and local fuel options (e.g., sustainably produced biomass) to reduce dependence on distant, typhoon-prone supply routes.
Launch a Community-Wide Fuel Preparedness and Rights Education Program
Address the critical training gap identified in the study by conducting quarterly capacity-building seminars covering: price control laws (RA 7581), consumer rights, fuel safety, emergency conservation, DRRM protocols, and supplier reporting mechanisms. Target both business owners and households, with special outreach to rural and coastal barangays. Translate key information into accessible formats and local language to ensure equitable understanding.
7.4.2For national government agencies (DOE, DTI, DSWD, OCD)
Devolve Resilience Standards and Funding to Municipalities
Issue implementing guidelines and provide technical assistance to enable LGUs to adopt standardized fuel supply continuity plans. Establish a Municipal Fuel Resilience Fund or grant program to support buffer stocks, storage facilities, and information systems—removing the financial barrier that currently prevents municipalities from acting independently.
Create a Real-Time Visibility and Price Monitoring System
Deploy a shared, low-cost digital platform that enables LGUs to report inventory levels, prices, and supply disruptions across barangays in real time. This addresses the visibility gap and allows the DOE and DTI to detect and intervene in price spikes and shortages before they escalate.
Standardize Public-Private Protocols for Essential Commodities
Develop model Memoranda of Agreement (MOAs) between LGUs and fuel suppliers that formalize delivery commitments, price caps during emergencies, priority allocation for vulnerable barangays, and reimbursement terms so that agreements are in place before a crisis strikes, not negotiated under duress.
7.4.3For barangay councils
Designate each barangay hall as a Commodity Reporting and Distribution Node—empowering officials to report shortages, monitor prices, and assist in equitable distribution. Integrate fuel supply monitoring into the regular barangay DRRM committee agenda, ensuring that local conditions are sensed and communicated upward promptly.
7.4.4For fuel industry stakeholders
Enter into formalized partnership with the LGU through the Fuel Resilience Council to co-design contingency routes, shared storage, and emergency delivery schedules. Establish transparent communication channels so that supply warnings reach the community early reducing panic buying and hoarding.
7.4.5For academic and research institutions
Expand empirical research on essential commodity supply chains beyond food and agriculture to include fuel, water, medicine, and other non-food essentials. Conduct parallel studies in other municipalities of Eastern Visayas to validate the proposed framework and identify regional patterns. Longitudinal research should track supply chain performance before, during, and after typhoons to refine resilience metrics continuously.
7.4.6Adoption of the proposed institutional resilience framework
The Palo Institutional Resilience Framework for Cooking Fuel Supply Continuity—based on the triad of Sensing (Monitoring) → Seizing (Mobilization) → Transforming (Institutionalization) is hereby recommended for adoption by the LGU of Palo, Leyte. The Framework proposes a governance cycle wherein:
- Sensing establishes real-time monitoring, price surveillance, and hazard forecasting;
- Seizing activates pre-agreed agreements, buffer stocks, and multi-sectoral coordination;
- Transforming institutionalizes plans, funding, training, and partnerships into permanent systems;
- Feedback loops ensure continuous improvement based on experience and changing conditions.
This Framework is intended to shift Palo from a reactive, fragmented, relief-oriented posture to a proactive, unified, resilience-based governance model one that anticipates shocks, protects affordability, ensures equitable access, and guarantees that cooking fuel remains available to every household, regardless of typhoons, price spikes, or transport disruptions.
References
- [1]Alcantara LG, et al. (2025). LPG supply vulnerabilities and LGU response capacity in Central Visayas, Philippines. Philippine Journal of Public Administration, 69(1), 45–62.
- [2]Ansell C, Gash A (2008). Collaborative governance in theory and practice. Journal of Public Administration Research and Theory, 18(4), 543–571.
- [3]Baltazar TMQ, et al. (2026). Biomass vs. imported fuel: Institutional coordination for cooking energy security in Bohol. Visayas Journal of Development Research, 12(2), 19–34.
- [4]Bryson JM, Crosby BC, Stone MM (2006). The design and implementation of cross-sector collaborations: Propositions from the literature. Public Administration Review, 66(s1), 44–55.
- [5]Carvalho AP, Harrison J (2022). Supply chain resilience for essential goods: Local governance in crisis. Routledge.
- [6]Department of Social Welfare and Development (2024). Buong Bansa Handa guidelines. Manila: DSWD.
- [7]Department of Trade and Industry, Department of Agriculture (2023). Food chain logistics master plan (2023–2033). Manila: DTI–DA.
- [8]Doberstein C (2021). Public sector capacity and disaster resilience. Edward Elgar Publishing.
- [9]Emerson K, Nabatchi T, Balogh S (2012). An integrative framework for collaborative governance. Journal of Public Administration Research and Theory, 22(1), 1–29.
- [10]Ewim E, et al. (2024). Cooking fuel access and affordability in disaster-prone coastal communities. Journal of Energy in Southern Africa, 35(2), 45–58.
- [11]Folke C (2006). Resilience: The emergence of a perspective for social–ecological systems analyses. Global Environmental Change, 16(3), 253–267.
- [12]Gould C, Urpelainen J (2019). Institutional capacity and clean cooking transitions in developing economies. Energy Policy, 132, 1129–1140.
- [13]Holling CS (1973). Resilience and stability of ecological systems. Annual Review of Ecology and Systematics, 4(1), 1–23.
- [14]International Energy Agency (2023). Clean cooking access and supply chain security. IEA Publications.
- [15]International Journal of Supply Chain Management (2024). Special issue: Essential commodity supply chains and local governance resilience. International Journal of Supply Chain Management, 13(3).
- [16]Ivanov D, Dolgui A (2025). Supply chain resilience: Robustness, redundancy, flexibility, and adaptive responsiveness. International Journal of Production Research, 63(4), 1201–1218.
- [17]Jaller M, et al. (2026). Essential goods supply chains during crises: A systematic review of universal principles. Journal of Humanitarian Logistics and Supply Chain Management, 16(1), 45–72.
- [18]Jang S, et al. (2024). Institutional fragmentation and supply chain failure: A cross-sectoral analysis. Journal of Public Administration Research and Theory, 34(3), 417–436.
- [19]Landman T, Breuer J, Foweraker J (2024). Institutional adaptation to systemic shocks: A comparative analysis. Cambridge University Press.
- [20]Mendoza RU, Manasan RG (2020). Local governance and service delivery in the Philippines. Ateneo de Manila University Press.
- [21]Organisation for Economic Co-operation and Development (2024). Philippines energy security and essential commodity resilience assessment. Paris: OECD Publishing.
- [22]Ostrom E (2009). A general framework for analyzing the sustainability of social-ecological systems. Science, 325(5939), 419–422.
- [23]Philippine Institute for Development Studies (2023). Cooking fuel access and supply chain disruptions: Policy options for Philippine LGUs. PIDS Policy Notes, No. 2023-08.
- [24]Republic of the Philippines (1987). Constitution of the Republic of the Philippines. Article II, Section 16; Article X.
- [25]Republic of the Philippines (1991). Local Government Code of 1991 (Republic Act No. 7160). Manila: Congress of the Philippines.
- [26]Republic of the Philippines (1992). Price Act (Republic Act No. 7581). Manila: Congress of the Philippines.
- [27]Republic of the Philippines (2003). Government Procurement Reform Act (Republic Act No. 9184). Manila: Congress of the Philippines.
- [28]Republic of the Philippines (2009). Philippine Climate Change Act of 2009 (Republic Act No. 9729). Manila: Congress of the Philippines.
- [29]Republic of the Philippines (2010). Philippine Disaster Risk Reduction and Management Act of 2010 (Republic Act No. 10121). Manila: Congress of the Philippines.
- [30]Republic of the Philippines (2024). New Government Procurement Act (Republic Act No. 12009). Manila: Congress of the Philippines.
- [31]Rivera R (2022). Sampling strategies in social science research in the Philippine setting. Philippine Journal of Development Studies, 19(1), 78–91.
- [32]Teece DJ (2007). Explicating dynamic capabilities: The nature and microfoundations of (sustainable) enterprise performance. Strategic Management Journal, 28(13), 1319–1350.
- [33]Teece DJ (2024). Dynamic capabilities and resilient governance. Oxford University Press.
- [34]Teece DJ, Pisano G, Shuen A (1997). Dynamic capabilities and strategic management. Strategic Management Journal, 18(7), 509–533.
- [35]World Bank (2022). Resilient supply chains for basic energy services: Guidance for local governments. World Bank Group.
- [36]Department of Energy (Philippines). LPG supply chain and resilience programs. https://www.doe.gov.ph/energy-supply/lpg
- [37]Bohol Provincial Government. Development plans and energy initiatives. https://ppdo.bohol.gov.ph/
- [38]Local Government Academy. LGU capacity building for essential services. https://www.lga.gov.ph/
- [39]Asian Development Bank. Philippines energy security and supply chain resilience. https://www.adb.org/countries/philippines/energy