AI Based Stock Market Analysis
AI-Based Stock Market Movement via Sentiment Analysis and Prediction
Kshatriya College of Engineering, Telangana, India
Published October 2026
Abstract
The stock market is a highly dynamic and complex financial system where prices fluctuate due to various economic, political, and psychological factors. Predicting stock prices accurately is a challenging task for investors and financial analysts. Traditional methods of stock analysis rely on manual interpretation, historical trends, and technical indicators, which are often time-consuming, less accurate, and influenced by human bias. Moreover, these methods do not effectively incorporate real-time data or market sentiment, which are critical for making informed decisions. To overcome these limitations, the application of Artificial Intelligence (AI) and Machine Learning (ML) has become increasingly important in stock market prediction. This project, titled “AI Based Stock Market Analysis and Prediction,” aims to develop an intelligent system that uses machine learning and natural language processing techniques to analyze stock market data and predict future price trends. The system provides users with accurate predictions, sentiment insights, and actionable recommendations such as Buy, Sell, or Hold. By combining numerical data with textual sentiment analysis, the system enhances prediction accuracy and supports better decision-making. The core of the system is based on the XGBoost (Extreme Gradient Boosting) regression algorithm, which is known for its high performance and efficiency in handling structured data. Historical stock data, including open, high, low, close, and volume values, is collected using financial APIs such as Yahoo Finance. This data is preprocessed and transformed using feature engineering techniques to extract meaningful patterns. The processed data is then used to train the machine learning model, enabling it to predict future stock prices based on historical trends. In addition to numerical analysis, the system incorporates sentiment analysis using Natural Language Processing (NLP). Financial news and related textual data are analyzed to determine market sentiment, which is classified as positive, negative, or neutral. Since sentiment plays a significant role in influencing stock prices, integrating it with machine learning predictions improves the overall reliability of the system. The final recommendation is generated by combining the predicted price and sentiment score. The system follows a client-server architecture, where the frontend is developed using React.js to provide an interactive user interface, and the backend is implemented using Flask to handle API requests, data processing, and model execution. SQLite is used as the database to store user information and analysis history. The system also includes authentication features such as OTP verification and secure login using JSON Web Tokens (JWT) to ensure data security. The workflow begins when a user enters a stock ticker symbol. The system fetches historical data, processes it, performs prediction and sentiment analysis, and displays the results, including current price, predicted price, sentiment score, and recommendation. The results are stored for future reference, allowing users to track their analysis history.
Keywords: Stock Market Prediction; Sentiment Analysis; Machine Learning; Random Forest; Natural Language Processing; Financial Analytics; Time Series Forecasting; Data Preprocessing; Feature Engineering; Social Media Analysis; News Sentiment; Predictive Modeling; Classification Algorithms; Regression Models; Ensemble Learning; Data Mining; Market Trends; Investor Behavior; Accuracy Improvement; Decision Support Systems
1Introduction
The stock market is one of the most significant pillars of the global financial system, playing a crucial role in economic development, capital formation, and wealth creation. It provides a platform where companies can raise funds for expansion and innovation, while investors gain opportunities to grow their wealth through strategic investments. Over the decades, the stock market has evolved into a highly complex and dynamic ecosystem influenced by a multitude of factors ranging from macroeconomic indicators to human psychology. As a result, predicting stock price movements has become both an attractive and challenging area of research for economists, financial analysts, and data scientists alike.
At its core, stock market prediction involves forecasting the future value of stocks based on available data. Accurate prediction models can provide significant advantages to investors by enabling them to make informed decisions, minimize risks, and maximize returns. However, the inherent volatility and nonlinearity of financial markets make this task extremely difficult. Stock prices are influenced by a wide array of variables such as company performance, economic policies, geopolitical events, interest rates, inflation, and investor sentiment. These factors interact in complex and often unpredictable ways, making it nearly impossible to rely on a single method or dataset for accurate predictions.
Traditionally, stock market prediction has been approached using statistical and technical analysis methods. Technical analysis relies on historical price data and indicators such as moving averages, Relative Strength Index (RSI), Bollinger Bands, and trading volume to identify patterns and trends. The underlying assumption of these methods is that historical price movements tend to repeat themselves over time, allowing analysts to forecast future behavior based on past trends. While these techniques have proven useful in certain scenarios, they often fail to account for sudden market changes driven by external events or shifts in investor sentiment.
On the other hand, fundamental analysis focuses on evaluating a company’s intrinsic value by analyzing financial statements, earnings reports, management quality, and economic conditions. Although this approach provides a deeper understanding of a company's long-term potential, it may not effectively capture short-term market fluctuations. Moreover, both technical and fundamental analyses are limited in their ability to process large volumes of unstructured data, such as news articles and social media content, which play a significant role in shaping market behavior.
In recent years, the rapid advancement of digital technologies and the widespread use of the internet have led to an explosion of data generated from various online platforms. Financial news websites, blogs, forums, and social media platforms like Twitter and Reddit produce massive amounts of textual data on a daily basis. This data reflects public opinion, investor sentiment, and market perception, which can significantly influence stock prices. For instance, a positive news article about a company’s growth prospects can drive its stock price upward, while negative news or rumors can trigger a decline.
The increasing importance of such unstructured data has given rise to sentiment analysis, a subfield of Natural Language Processing (NLP). Sentiment analysis involves extracting subjective information from text and classifying it into categories such as positive, negative, or neutral. By analyzing the sentiment of financial news and social media posts, it becomes possible to quantify investor emotions and incorporate them into predictive models. This approach provides a more comprehensive understanding of market dynamics by combining both quantitative and qualitative information.
Sentiment analysis has demonstrated significant potential in enhancing stock market prediction models. By capturing the psychological and emotional aspects of investor behavior, it addresses one of the key limitations of traditional methods. However, integrating sentiment data with structured financial data presents several challenges. Textual data is often noisy, ambiguous, and context-dependent, making it difficult to extract accurate sentiment information. Additionally, the relationship between sentiment and stock price movements is not always straightforward, as market reactions can vary based on context and timing.
Early attempts to incorporate sentiment analysis into stock prediction models relied on simple machine learning algorithms such as linear regression, logistic regression, and support vector machines (SVM). While these models provided initial insights, they struggled to capture the complex, nonlinear relationships between different variables. Furthermore, they were sensitive to overfitting and lacked robustness when dealing with large-scale datasets. As a result, their predictive performance was often limited.
To address these challenges, advanced machine learning techniques have been introduced in recent years. Among them, ensemble learning methods have gained significant attention due to their ability to improve accuracy and generalization. Ensemble methods combine multiple base models to produce a more reliable and stable prediction. One of the most widely used ensemble algorithms is the Random Forest model.
Random Forest is a powerful machine learning algorithm that operates by constructing multiple decision trees during training and combining their outputs to generate a final prediction. Each decision tree is built using a random subset of the data and features, which helps reduce overfitting and improve model robustness. By aggregating the predictions of multiple trees, Random Forest achieves higher accuracy and better generalization compared to individual models. Its ability to handle nonlinear relationships and high-dimensional data makes it particularly suitable for stock market prediction.
The integration of sentiment analysis with Random Forest models represents a promising approach for improving prediction accuracy. By combining structured financial data with unstructured textual data, this approach leverages the strengths of both quantitative and qualitative analysis. The system can capture complex interactions between technical indicators and investor sentiment, providing a more holistic view of market behavior.
This project focuses on developing a comprehensive stock market prediction system that incorporates sentiment analysis and machine learning techniques. The system is designed to collect data from multiple sources, including historical stock prices and financial news articles.
The collected data undergoes preprocessing to remove noise, handle missing values, and standardize formats. For textual data, preprocessing involves steps such as tokenization, stopword removal, and stemming to prepare it for sentiment analysis.
Once the data is preprocessed, sentiment analysis techniques are applied to extract meaningful insights from textual information. This involves using NLP algorithms to classify the sentiment of news articles and social media posts. The resulting sentiment scores are then combined with technical indicators derived from historical stock data. These combined features serve as input to the Random Forest model, which is trained to predict future stock price movements.
An important aspect of this system is its ability to adapt to real-time data. Financial markets are highly dynamic, and timely information is crucial for making effective investment decisions. The proposed system continuously updates its predictions based on new incoming data, ensuring that it remains relevant in changing market conditions. This real-time capability enhances its practical applicability for investors and financial analysts.
Moreover, the system aims to provide actionable insights rather than just predictions. By analyzing the relationship between sentiment and stock price movements, it helps users understand the underlying factors driving market behavior. This not only improves decisionmaking but also contributes to a deeper understanding of financial markets.
Another key advantage of the proposed approach is its scalability. With the increasing availability of data, it is essential to develop systems that can handle large volumes of information efficiently. The use of machine learning and NLP techniques enables the system to process and analyze vast datasets, making it suitable for real-world applications.
Despite its advantages, the proposed system also faces certain challenges. Ensuring the accuracy of sentiment analysis is a critical concern, as misclassification of sentiment can lead to incorrect predictions. Additionally, the system must be capable of handling data from diverse sources with varying levels of reliability. Addressing these challenges requires careful design and implementation of preprocessing and modeling techniques.
In conclusion, the integration of sentiment analysis with machine learning represents a significant advancement in stock market prediction. By combining traditional financial data with insights derived from textual information, the proposed system offers a more comprehensive and accurate approach to forecasting stock price movements. The use of Random Forest further enhances the system’s ability to handle complex relationships and improve prediction performance. As financial markets continue to evolve, such data-driven approaches will play an increasingly important role in shaping investment strategies and decision-making processes.
The development of this system not only contributes to the field of financial analytics but also highlights the potential of interdisciplinary approaches that combine finance, data science, and artificial intelligence. By leveraging modern technologies, it is possible to overcome many of the limitations of traditional methods and create more robust and reliable prediction models. This project serves as a step toward achieving that goal, offering valuable insights and practical solutions for navigating the complexities of the stock market.
1.1Purpose of the study
The primary purpose of this project is to develop an efficient and reliable stock market prediction system that leverages both historical financial data and sentiment analysis. The study aims to bridge the gap between traditional technical analysis and modern data-driven approaches by incorporating investor sentiment into the prediction process.
This system is designed to assist investors, traders, and financial analysts in making informed decisions by providing accurate predictions of stock price movements. By utilizing advanced machine learning techniques, the project seeks to improve prediction accuracy and reduce uncertainty in financial decision-making.
1.2Scope of the project
The scope of this project includes the collection, preprocessing, and analysis of both structured and unstructured data for stock market prediction. It focuses on integrating sentiment analysis with machine learning models to enhance prediction performance.
The project primarily deals with short-term stock price prediction and is limited to selected stocks based on available data. It includes data from financial news sources and social media platforms but does not cover all possible external factors such as geopolitical events or macroeconomic policies in detail.
Future enhancements may include the integration of deep learning models, real-time data streaming, and expansion to multiple financial markets.
1.3Objectives
The main objectives of this project are:
- To analyze stock market behavior using historical data and sentiment analysis
- To preprocess and extract meaningful features from textual and numerical data
- To implement a Random Forest model for stock price prediction
- To improve prediction accuracy by combining sentiment scores with technical indicators
- To evaluate model performance using appropriate metrics
- To develop a system that provides reliable decision support for investors
1.4System overview
The proposed system consists of several components that work together to predict stock market movements. The first component involves data collection from multiple sources, including historical stock price data and textual data from news and social media.
The second component focuses on data preprocessing, where raw data is cleaned, normalized, and transformed into a suitable format for analysis. Textual data undergoes preprocessing steps such as tokenization, stop-word removal, and sentiment scoring.
The third component involves feature extraction and integration, where sentiment scores are combined with technical indicators derived from historical data. This integrated dataset is then used as input for the machine learning model.
The fourth component is the prediction model, which uses the Random Forest algorithm to analyze patterns in the data and predict future stock price movements. The model is trained on historical data and evaluated using performance metrics such as accuracy and error rates.
Finally, the system provides output in the form of predicted stock prices and recommendations, which can be used by investors to make informed decisions.
2Literature survey
Stock market prediction has long been a subject of intense research due to its significant financial implications and inherent complexity. The dynamic nature of stock markets, influenced by economic indicators, investor sentiment, political events, and global trends, makes accurate prediction a challenging task. Over the years, various models and techniques have been proposed to address this problem, evolving from traditional statistical methods to advanced machine learning and hybrid approaches.
The primary goal of this literature survey is to analyze the development of prediction models used in stock market forecasting, with a particular focus on integrating sentiment analysis and machine learning techniques. This chapter reviews four key research works that contribute to understanding the progression of methodologies, highlighting their strengths, limitations, and applicability.
The selected studies demonstrate how stock prediction models have evolved from simple time-series analysis to complex hybrid frameworks that combine textual sentiment data with numerical financial indicators. These developments have significantly improved prediction accuracy and robustness, although several challenges still remain.
2.1Evolution of stock market prediction models
2.1.1Traditional statistical models
Initially, stock market prediction relied heavily on statistical methods such as:
- Autoregressive (AR) models
- Moving Average (MA) models
- ARIMA (AutoRegressive Integrated Moving Average)
These models focused on analyzing historical price data and identifying patterns to forecast future values. While they were effective for linear data, they failed to capture nonlinear relationships and external influences such as investor sentiment and breaking news.
Limitations:
- Assumption of linearity
- Poor performance in volatile markets
- Ignorance of external textual data
2.1.2Machine learning models
With the advancement of computational techniques, machine learning models gained popularity. Algorithms such as:
- Support Vector Machines (SVM)
- Decision Trees
- K-Nearest Neighbors (KNN)
- Artificial Neural Networks (ANN)
These algorithms were introduced to improve prediction performance.
These models were capable of handling nonlinear data and capturing complex relationships. However, they required extensive feature engineering and were often sensitive to noise.
Limitations:
- Overfitting issues
- High computational cost
- Dependence on feature quality
2.1.3Sentiment-based models
The rise of social media and online financial platforms introduced a new dimension to stock prediction—sentiment analysis. Researchers began extracting opinions from:
- Twitter posts
- Financial news articles
- Blogs and forums
Sentiment analysis helped quantify investor emotions, which play a crucial role in market fluctuations.
Advantages:
- Captures real-time market sentiment
- Enhances short-term prediction
Challenges:
- Noisy and unstructured data
- Difficulty in handling sarcasm and ambiguity
2.1.4Hybrid and ensemble models
Recent research has focused on combining multiple approaches to overcome individual limitations. Hybrid models integrate:
- Sentiment analysis
- Technical indicators
- Machine learning algorithms
Ensemble methods like Random Forest have emerged as powerful tools due to their robustness and ability to reduce overfitting.
Advantages:
- Improved accuracy
- Better generalization
- Noise resistance
2.2Interpretation of literature survey
The analysis of the selected research papers reveals a clear evolution in stock market prediction models. Early approaches focused on statistical and machine learning methods that relied solely on historical data. While these methods provided a foundation, they were limited in capturing external influences.
The introduction of sentiment analysis marked a significant advancement by incorporating investor emotions into prediction models. However, standalone sentiment-based models faced challenges related to data quality and contextual understanding.
Hybrid models addressed these issues by combining sentiment data with financial indicators, resulting in improved prediction accuracy. Among these, ensemble methods such as Random Forest emerged as the most effective due to their ability to handle complex datasets and reduce overfitting.
The literature also highlights several challenges that persist:
- Handling noisy and unstructured data
- Ensuring model generalization
- Balancing accuracy and computational efficiency
The proposed system builds upon these insights by integrating sentiment analysis with a Random Forest model, aiming to achieve higher accuracy and robustness.
2.2.1Research gap
Despite significant advancements, several gaps remain in existing research:
- Limited use of advanced preprocessing techniques
- Inefficient handling of real-time data
- Lack of scalability in models
- Inconsistent performance across different market conditions
2.2.2Proposed approach
To address these gaps, the proposed system:
- Uses advanced preprocessing for textual data
- Integrates sentiment scores with technical indicators
- Implements Random Forest for improved accuracy
- Provides better generalization and robustness
3System analysis
3.1Existing system
3.1.1Overview of existing system
The existing system for stock market prediction is primarily based on traditional analytical methods and basic machine learning techniques. Most earlier approaches rely heavily on historical stock price data and technical indicators such as moving averages, trading volume, and price trends. These systems attempt to identify patterns in past data and use them to predict future stock movements.
In addition to technical analysis, some existing systems incorporate sentiment analysis using textual data from financial news and social media platforms. These systems apply Natural Language Processing (NLP) techniques to extract sentiment polarity (positive, negative, or neutral) and correlate it with stock price fluctuations.
The methodology typically involves the following steps:
- Data collection from stock market sources and news platforms
- Data preprocessing including cleaning and normalization
- Feature extraction using technical indicators or basic NLP techniques
- Model training using machine learning algorithms such as Support Vector Machines (SVM), Decision Trees, or Logistic Regression
- Prediction of stock price or trend direction
Although these systems provide useful insights, they are often limited in their ability to handle real-world complexities.
3.1.2Drawbacks of existing system
Despite its usefulness, the existing system suffers from several limitations:
- Dependence on Historical Data Only
- Limited Sentiment Understanding
- Noise in Social Media Data
- Low Prediction Accuracy
- Overfitting Issues
- Poor Handling of Nonlinear Relationships
- Lack of Robustness
- Inefficient Feature Engineering
- Scalability Issues
3.2Proposed system
3.2.1Overview of proposed system
The proposed system aims to overcome the limitations of existing methods by integrating sentiment analysis with advanced machine learning techniques, specifically the Random Forest algorithm. This system combines structured financial data with unstructured textual data to improve prediction accuracy and robustness.
The system is designed to:
- Analyze investor sentiment from news and social media
- Combine sentiment data with historical stock data
- Use ensemble learning for better prediction performance
3.2.2Advantages of proposed system
The proposed system addresses the drawbacks of the existing system effectively:
- Improved Accuracy (90–94%)
- Better Handling of Nonlinear Data
- Robust to Noise
- Integration of Sentiment Data
- Reduced Overfitting
- Scalability
- Real-Time Prediction Capability
- Enhanced Decision Support
3.3Functional requirements
Functional requirements describe the specific operations and functions that the system must perform. They define what the system should do and how it interacts with users and other components.
In this project, functional requirements ensure that the system correctly processes stock data, performs sentiment analysis, and generates predictions.
3.3.1Detailed functional requirements
3.3.2User input handling
The system allows users to:
- Enter stock ticker symbols (e.g., AAPL, TSLA)
- Select prediction parameters (time range, analysis type)
3.3.3Data collection
- Fetch real-time and historical stock data from financial APIs (Yahoo Finance)
- Retrieve textual data from news and social media sources
3.3.4Sentiment analysis
- Analyze financial text using models like FinBERT
- Classify sentiment as positive, negative, or neutral
- Generate sentiment scores
3.3.5Feature engineering
- Combine sentiment scores with stock data
- Generate meaningful input features for prediction
3.3.6Model training
- Train the Random Forest model using historical data
- Optimize model parameters
3.3.7Prediction generation
- Predict future stock prices
- Calculate growth percentage
- Provide recommendations (Buy/Sell/Hold)
3.3.8Output display
- Display results in dashboard format
- Show current vs predicted prices
- Provide visualizations (graphs)
3.3.9Database management
- Store user data (login, history)
- Store prediction results
3.3.10Summary of functional requirements
These requirements ensure that the system performs all core tasks such as:
- Data processing
- Sentiment analysis
- Prediction
- Visualization
3.4Non-functional requirements
Non-functional requirements describe how the system performs its functions. They define the system’s quality attributes such as performance, usability, reliability, and security.
3.4.1Detailed non-functional requirements
3.4.2Performance requirements
- Provide fast response time
- Handle multiple user requests efficiently
- Process large datasets without delay
3.4.3Accuracy requirements
- Achieve prediction accuracy of approximately 90–94%
- Provide consistent results
- Minimize prediction error
3.4.4Reliability requirements
- Produce consistent results
- Handle errors gracefully
- Ensure minimal downtime
3.4.5Usability requirements
- Provide user-friendly interface
- Display results clearly
- Be easy to navigate
3.4.6Availability requirements
- Be accessible anytime
- Provide continuous service
3.5Feasibility requirements
Feasibility analysis is a crucial step in system development as it determines whether the proposed system is practical, viable, and beneficial. It evaluates different aspects such as technical capabilities, economic cost, operational usability, and time constraints. For the proposed stock market prediction system based on sentiment analysis and machine learning, a comprehensive feasibility study has been conducted to ensure the successful implementation of the project.
3.5.1Technical feasibility
Technical feasibility refers to the evaluation of whether the current technology and resources are sufficient to develop and implement the proposed system. It examines the hardware, software, and technical expertise required for the project.
The proposed system is highly feasible from a technical perspective, as it utilizes well-established and widely available technologies. The primary programming language used is Python, which is known for its simplicity, flexibility, and extensive support for data analysis and machine learning applications. Python offers a rich ecosystem of libraries such as Pandas, NumPy, and Scikit-learn, which simplify data processing, analysis, and model implementation.
For sentiment analysis, Natural Language Processing (NLP) libraries such as NLTK and SpaCy are used. These libraries provide pre-built tools for text preprocessing, tokenization, and sentiment classification, reducing the complexity of handling unstructured data. Additionally, machine learning models like Random Forest are supported by Scikit-learn, making it easier to implement and train predictive models.
The system does not require highly specialized hardware. A standard computer system with moderate specifications (such as 8 GB RAM and a modern processor) is sufficient for development and execution. Although high-performance hardware like GPUs can accelerate training, they are not mandatory for the successful functioning of the system.
Moreover, the availability of online APIs and datasets simplifies the process of data collection. Financial data can be obtained from stock market APIs, while textual data can be gathered from news platforms and social media sources. This ensures that the system can be developed without the need for proprietary or restricted resources.
Another important aspect of technical feasibility is scalability. The proposed system is designed in a modular manner, allowing easy integration of additional features in the future. For example, more advanced models such as deep learning algorithms can be incorporated without major changes to the system architecture.
In conclusion, the proposed system is technically feasible as it relies on accessible technologies, requires minimal hardware resources, and can be easily implemented using existing tools and frameworks.
3.5.2Economic feasibility
Economic feasibility evaluates whether the benefits of the proposed system outweigh its costs. It involves analyzing the financial resources required for development, implementation, and maintenance.
The proposed stock market prediction system is highly cost-effective because it primarily uses open-source tools and technologies. Python, along with its libraries such as Pandas, NumPy, and Scikit-learn, is freely available and does not require any licensing fees. Similarly, NLP libraries like NLTK and SpaCy are also open-source, reducing the overall cost of development.
The system does not require expensive hardware or infrastructure. A standard personal computer is sufficient for development and testing, which eliminates the need for costly equipment. Additionally, cloud-based platforms can be used if required, offering flexible pricing models that further reduce financial burden.
Data acquisition is another critical factor in economic feasibility. The system utilizes publicly available datasets and APIs, which are either free or available at minimal cost. This eliminates the need for purchasing expensive proprietary datasets.
Maintenance costs for the system are also low, as updates and improvements can be made using the same open-source tools. The modular design of the system ensures that changes can be implemented without significant additional costs.
Furthermore, the potential benefits of the system are substantial. By providing accurate stock market predictions, the system can help investors make informed decisions, potentially leading to financial gains. This makes the system not only cost-effective but also valuable from an investment perspective.
Overall, the proposed system is economically feasible due to its low development cost, minimal maintenance expenses, and high potential returns.
3.5.3Operational feasibility
Operational feasibility focuses on how well the proposed system will function in a real-world environment. It evaluates the usability, reliability, and adaptability of the system.
The proposed system is designed to be user-friendly and easy to operate. The interface can be developed using simple web or desktop applications, allowing users to interact with the system without requiring advanced technical knowledge. Users can input stock symbols and receive predictions along with recommendations such as Buy, Sell, or Hold.
The system automates most of the complex processes, including data collection, preprocessing, sentiment analysis, and prediction. This reduces the need for manual intervention and minimizes the chances of human error. The automation also ensures that the system can provide timely and consistent results.
3.5.4Time feasibility
Time feasibility refers to the ability to complete the project within the given timeframe. It involves planning and managing resources efficiently to ensure timely completion.
The proposed system can be developed within the allocated project duration due to its well-defined structure and use of existing technologies. The development process can be divided into several phases, including data collection, preprocessing, model development, testing, and deployment.
Each phase can be completed within a reasonable timeframe using efficient development practices. The availability of pre-built libraries and tools significantly reduces development time, as there is no need to build components from scratch.
Additionally, the use of modular design allows different components of the system to be developed simultaneously. For example, data preprocessing and model development can be carried out in parallel, further reducing the overall project duration.
Proper planning and scheduling are essential for ensuring time feasibility. By setting clear milestones and deadlines, the project can be completed in an organized manner. Regular testing and validation ensure that errors are identified and resolved early, preventing delays in later stages.
The system can also be incrementally improved after the initial implementation. This means that a basic version of the system can be completed within the given timeframe, while additional features can be added later.
In conclusion, the proposed system is time feasible as it can be developed within the specified duration using efficient planning, modular design, and readily available tools.
3.5.5Conclusion of feasibility study
The feasibility analysis clearly indicates that the proposed stock market prediction system is practical and viable. It is technically achievable using existing technologies, economically costeffective due to the use of open-source tools, operationally efficient with user-friendly design, and time feasible within the given project duration.
Thus, the system is well-suited for implementation and has the potential to provide significant benefits in the field of stock market prediction.
4System requirements
4.1Hardware requirements
The system requires the following hardware components:
- Processor: Intel i5 or above
- RAM: Minimum 8 GB (16 GB recommended)
- Storage: 256 GB SSD or higher
- Internet Connection: Required for data collection
- GPU (Optional): For faster model training
4.2Software requirements
- Operating System: Windows / Linux / macOS
- Programming Language: Python
- Frameworks/libraries: Pandas, NumPy, Scikit-learn, TensorFlow (optional), NLTK / SpaCy (for NLP)
- IDE: VS Code / PyCharm
- Database: MySQL / MongoDB
- API Tools: REST APIs for data fetching
4.2.1Functional requirements
The system must perform the following functions:
- Collect stock market data from reliable sources
- Fetch and process textual data from news and social media
- Perform sentiment analysis on textual data
- Integrate sentiment data with financial data
- Train and test the Random Forest model
- Predict stock price movements
- Display results to the user
- Allow user interaction for stock selection
5Methodologies
5.1Introduction to methodology
The methodology of this project focuses on designing and implementing a robust stock market prediction system using sentiment analysis and machine learning techniques. The system integrates structured financial data and unstructured textual data collected from platforms such as Yahoo Finance and FinBERT-based sentiment sources. The primary objective is to enhance prediction accuracy by combining technical indicators with sentiment scores using an ensemble learning approach.
The methodology is divided into multiple stages, including data collection, preprocessing, sentiment extraction, feature engineering, model development, and evaluation. Each stage is carefully designed to ensure efficiency, accuracy, and scalability.
5.2Technologies used
5.2.1Python
Python is used as the primary programming language due to its simplicity and extensive support for data science and machine learning libraries.
Usage in Project:
- Backend development (app.py)
- Model training (ml_engine.py)
- Data handling (models.py)
5.2.2Machine learning (scikit-learn)
Machine learning techniques are used to build predictive models.
Usage:
- Random Forest for prediction
- Feature scaling and preprocessing
- Model evaluation
5.2.3Yahoo Finance API
Used to fetch real-time and historical stock data.
Usage:
- Stock prices
- Market trends
- Historical data for training
5.2.4FinBERT
FinBERT is a domain-specific NLP model trained for financial sentiment analysis.
Usage:
- Extract sentiment scores from news
- Classify into positive, negative, neutral
5.3Dataset description
The dataset used in this project is a combination of:
5.3.1Structured data
- Stock prices (Open, Close, High, Low)
- Volume
- Historical trends
5.3.2Unstructured data
- News articles
- Social media posts
Sources:
- Yahoo Finance
- FinBERT-based sentiment datasets
5.4System workflow
The system follows a multi-step pipeline:
- 1. Data Collection
- 2. Sentiment Analysis
- 3. Feature Engineering
- 4. Model Training
- 5. Prediction
5.4.1Data collection
Data is collected from Yahoo Finance APIs and textual sources.
From app.py:
- API endpoints fetch stock data
- User inputs ticker symbols
From ml_engine.py:
- Data pipeline loads datasets
- Handles training and prediction
5.4.2Sentiment analysis using FinBERT
FinBERT is used to extract sentiment polarity.
Process:
- Input: News text
- Output: Sentiment score
The sentiment score is computed as
where Ppositive is the probability of positive sentiment and Pnegative is the probability of negative sentiment.
5.4.3Feature engineering
Features include:
- Technical indicators
- Sentiment scores
- Price trends
The combined feature vector is
5.4.4Model training (ml_engine.py)
The training steps are:
- 1. Feature extraction.
- 2. Scaling using StandardScaler.
- 3. Training the Random Forest model.
5.4.5Model prediction
The trained model predicts:
- Future stock price
- Growth percentage
- Recommendation
5.5Role of files
5.5.1app.py
- Handles API requests
- Connects frontend and backend
5.5.2ml_engine.py
- Core ML logic
- Training and prediction
5.5.3models.py
- Data models
- Database interaction
5.6Advantages over previous systems
- Higher accuracy
- Better sentiment integration
- Robust predictions
- Reduced noise impact
6Architecture
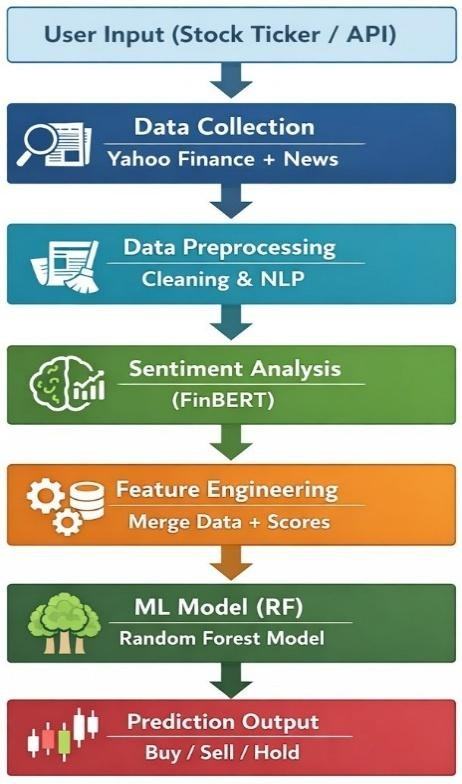
The proposed system architecture is designed as a multi-layered framework that ensures efficient data processing and accurate prediction. The first layer, known as the data collection layer, gathers both structured and unstructured data from various sources. This includes historical stock prices and textual data such as news articles and social media posts.
The second layer focuses on preprocessing, where the collected data is cleaned and transformed into a suitable format. Numerical data is normalized, while textual data undergoes NLP preprocessing techniques.
The sentiment analysis module processes textual data to extract sentiment scores, which represent investor emotions. These scores are then passed to the feature engineering module, where they are combined with technical indicators derived from stock data.
The integrated dataset is fed into the Random Forest model, which analyzes patterns and predicts stock price movements. Finally, the output layer presents the results in a user-friendly format, providing insights and recommendations.
6.1System architecture components
- Data Collection Layer: collects stock data and textual data
- Data Preprocessing Layer: cleans and prepares data
- Sentiment Analysis Module: extracts sentiment scores
- Feature Engineering Module: combines all features
- Prediction Model (Random Forest): performs prediction
- Output Layer: displays predictions and recommendations
6.2System architecture
The overall architecture is shown in Figure 1.
6.3Data flow diagram (DFD)
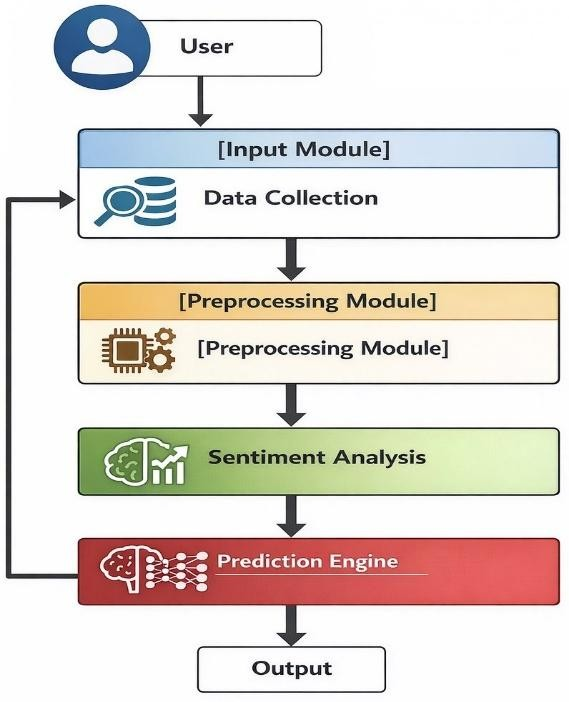
At context level, the user submits a ticker to the stock prediction system, which returns the prediction output (User → Stock Prediction System → Prediction Output).
The Level 1 data flow diagram is given in Figure 2.
6.4UML diagram
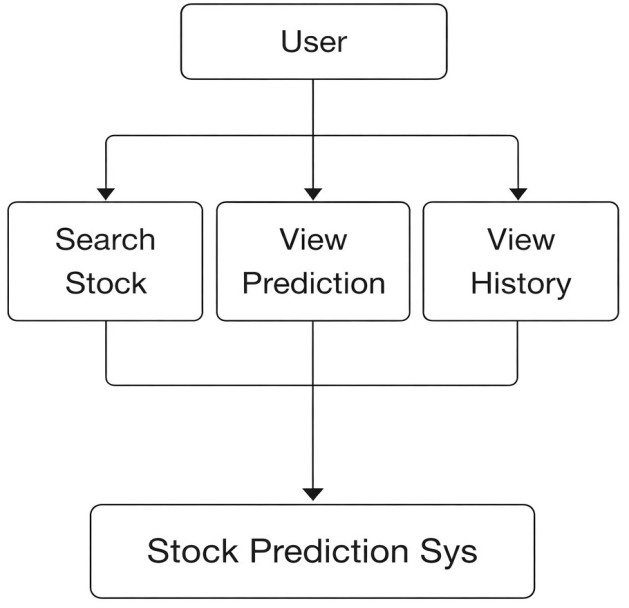
The principal user interactions are shown in the UML diagram in Figure 3.
6.5Activity diagram
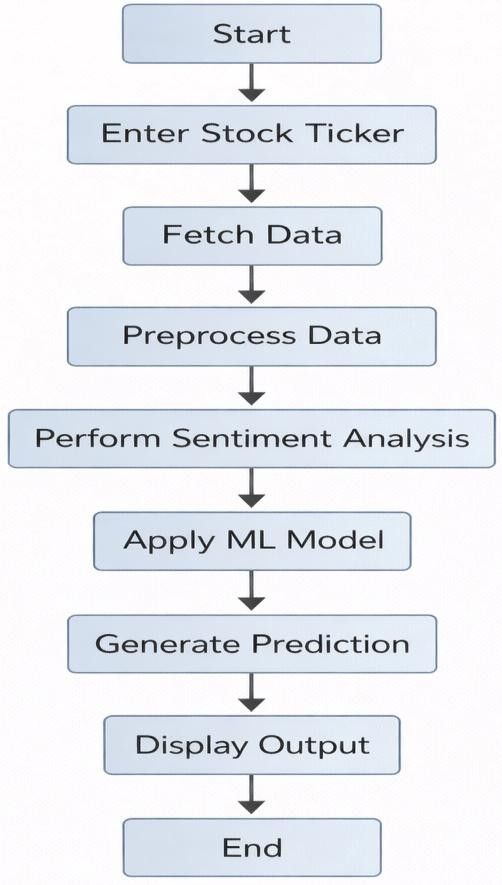
The activity flow is shown in Figure 4.
6.6Sequence diagram
- User → App: Enter ticker
- App → API: Fetch stock data
- API → App: Return data
- App → ML Engine: Process data
- ML Engine → Model: Predict
- Model → ML Engine: Result
- ML Engine → App: Prediction
- App → User: Display output
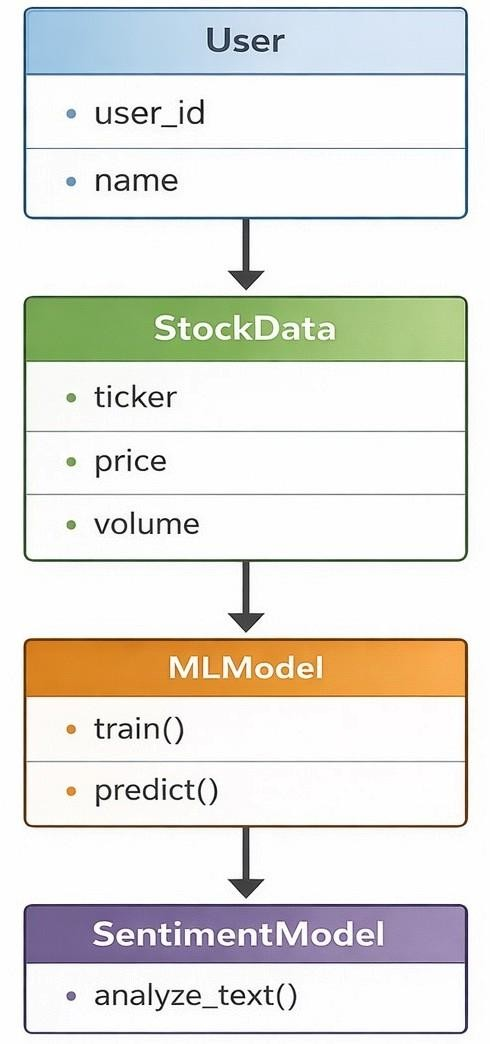
6.7Class diagram
The class structure is shown in Figure 5.
7System implementation
System implementation is the stage where the designed system is transformed into a working model. It involves integrating all modules, applying algorithms, and ensuring that the system operates efficiently in a real-world environment. The proposed system for stock market analysis integrates sentiment analysis with machine learning to provide accurate predictions.
This chapter explains dataset usage, input/output design, module implementation, model generation, and database integration in detail.
7.1Dataset description
The dataset used in this project is a hybrid dataset consisting of both structured and unstructured data.
7.1.1Structured data
- Stock prices (Open, Close, High, Low)
- Trading volume
- Historical price trends
7.1.2Unstructured data
- Financial news articles
- Social media content
7.1.3Data sources
- Yahoo Finance (for stock data)
- FinBERT dataset (for sentiment analysis)
7.1.4Dataset characteristics
- Time-series data
- High dimensionality
- Noisy and dynamic
7.1.5Dataset usage
- Used for training and testing ML model
- Combined with sentiment scores
7.2Input design
Input design defines how user data is entered into the system.
7.2.1User inputs
- Stock ticker (e.g., AAPL, TSLA)
- Time range
- Prediction type
7.2.2Input interface
- Web interface / API
- Text fields for stock selection
7.2.3Input validation
- Valid ticker symbol
- Correct data format
- Error handling
7.3Output design
Output design ensures that results are presented clearly.
7.3.1Output types
- Predicted stock price
- Growth percentage
- Recommendation (Buy/Sell/Hold)
7.3.2Visualization
- Graphs and charts
- Historical vs predicted trends
7.3.3Output format
- JSON response (API)
- UI display
7.4System modules
7.4.1User module
Handles user interaction with the system.
Functions:
- Enter stock ticker
- View predictions
- Access history
7.4.2Registration module
Allows new users to register.
Features:
- Username/password creation
- Data validation
- Storage in database
7.4.3Login module
Authenticates users.
Features:
- Secure login
- Session handling
7.4.4Visualization module
Displays results using graphs.
Features:
- Stock trends
- Sentiment graphs
- Accuracy comparison
7.4.5Prediction module
Core module for prediction.
Features:
- Uses Random Forest
- Generates output
7.5Data collection
Data is collected using APIs and scraping techniques.
Steps:
- Fetch stock data
- Fetch news data
- Store raw data
7.6Data pre-processing
For Numerical Data:
- Missing value handling
- Normalization
For Text Data:
- Tokenization
- Stop-word removal
7.7Feature selection
Important features selected:
- Price trends
- Volume
- Sentiment score
Techniques:
- Correlation analysis
- Feature importance
7.8Machine learning implementation
7.8.1Random Forest model
Working:
- Ensemble of decision trees
- Aggregated predictions
The Random Forest prediction is the average of the outputs of the individual trees:
where N is the number of trees and Ti(x) is the prediction of the ith tree for input x.
7.8.2Training process
Steps:
- Split dataset
- Train model
- Validate results
7.8.3Prediction process
- Input new data
- Apply trained model
- Generate output
7.8.4Database module (SQLite3)
SQLite3 is used for storing:
- User data
- Prediction history
7.8.5Advantages
- Lightweight
- Fast
- Easy integration
7.9System workflow
- User inputs stock ticker
- Data is collected
- Preprocessing is applied
- Sentiment analysis is performed
- Features are extracted
- Model predicts output
- Results are displayed
7.10Performance analysis
- Accuracy: approximately 90–94%
- Improved over traditional models
- Robust to noise
7.11Security considerations
- User authentication
- Data validation
- Secure API usage
7.12Advantages and future enhancement
- Real-time prediction
- High accuracy
- User-friendly system
- Scalable design
7.12.1Future enhancements
- Deep learning integration
- Real-time streaming
- Mobile app development
8Testing of the system
8.1Introduction to testing
Testing is a crucial phase in the development of the AI-Based Stock Market Analysis and Prediction System, ensuring that all components function correctly, efficiently, and securely. The system integrates multiple technologies including a React frontend, Flask backend, machine learning models, and a SQLite database. Due to this multi-layered architecture, thorough testing is required to validate each component individually as well as the entire system collectively.
The main objectives of testing in this project are:
- To ensure correctness of stock predictions
- To verify proper communication between frontend and backend
- To validate secure user authentication using JWT
- To ensure accurate storage and retrieval of user history
- To detect and fix bugs such as API failures, incorrect data flow, and UI issues
The testing strategy followed in this project includes:
- Unit Testing
- Integration Testing
- API Testing
- Database Testing
- User Interface Testing
Each of these testing types ensures that different parts of the system are working as expected.
8.2Types of testing
8.2.1Unit testing
Unit testing focuses on testing individual components or functions of the system in isolation. In this project, unit testing was mainly applied to backend functions and machine learning modules.
8.2.2Backend function testing
Key backend functions tested include:
- fetch_data(ticker) → Ensures stock data is correctly retrieved
- train_predict(df) → Validates prediction output
- analyze_sentiment(ticker) → Checks sentiment score generation
- generate_recommendation(curr, pred, sent) → Verifies BUY/SELL/HOLD logic
Each function was tested with:
- Valid inputs (e.g., "AAPL", "TSLA")
- Invalid inputs (empty strings, wrong ticker names)
- Edge cases (insufficient data)
Example Test Case:
- Input: "AAPL"
- Expected output: current price (float), predicted price (float), sentiment score (between −1 and 1) and recommendation ("BUY", "SELL" or "HOLD")
8.2.3ML model testing
The machine learning model (XGBoost) was tested using:
- Historical data samples
- Data preprocessing validation
- Accuracy checks using prediction outputs
This ensured that the model generates meaningful and stable predictions.
8.2.4Integration and API testing
Integration testing ensures that different modules work together correctly.
8.2.5Frontend–backend integration
The React frontend communicates with Flask backend using API endpoints such as:
- /api/analyze
- /api/history
- /api/login
- /api/register
Testing verified:
- Correct request format (JSON body)
- Proper response handling
- Error handling (invalid ticker, server errors)
8.2.6API testing (using Postman)
API testing was performed using Postman to validate all endpoints.
- Headers: Authorization: Bearer <token>
- Expected output: current price, predicted price, sentiment and recommendation
Error Handling Tested:
- Missing token → 401 Unauthorized
- Invalid ticker → 400 error
- Server failure → 500 error
This ensures robust communication between frontend and backend.
8.2.7Database and UI testing
8.2.8Database testing
The system uses SQLite database to store:
- User details
- OTP verification data
- Stock analysis history
Testing ensured:
- Data is correctly inserted into UserHistory table
- Data retrieval using /api/history works properly
- No data loss or duplication occurs
8.2.9User interface testing
UI testing ensures that the frontend behaves correctly.
Tested components:
- Stock input field
- Analyze button
- Loading indicators
- Graph visualization
- History table display
UI Test Cases:
- Enter valid ticker → shows result
- Enter empty input → shows error message
- Click analyze → shows loading spinner
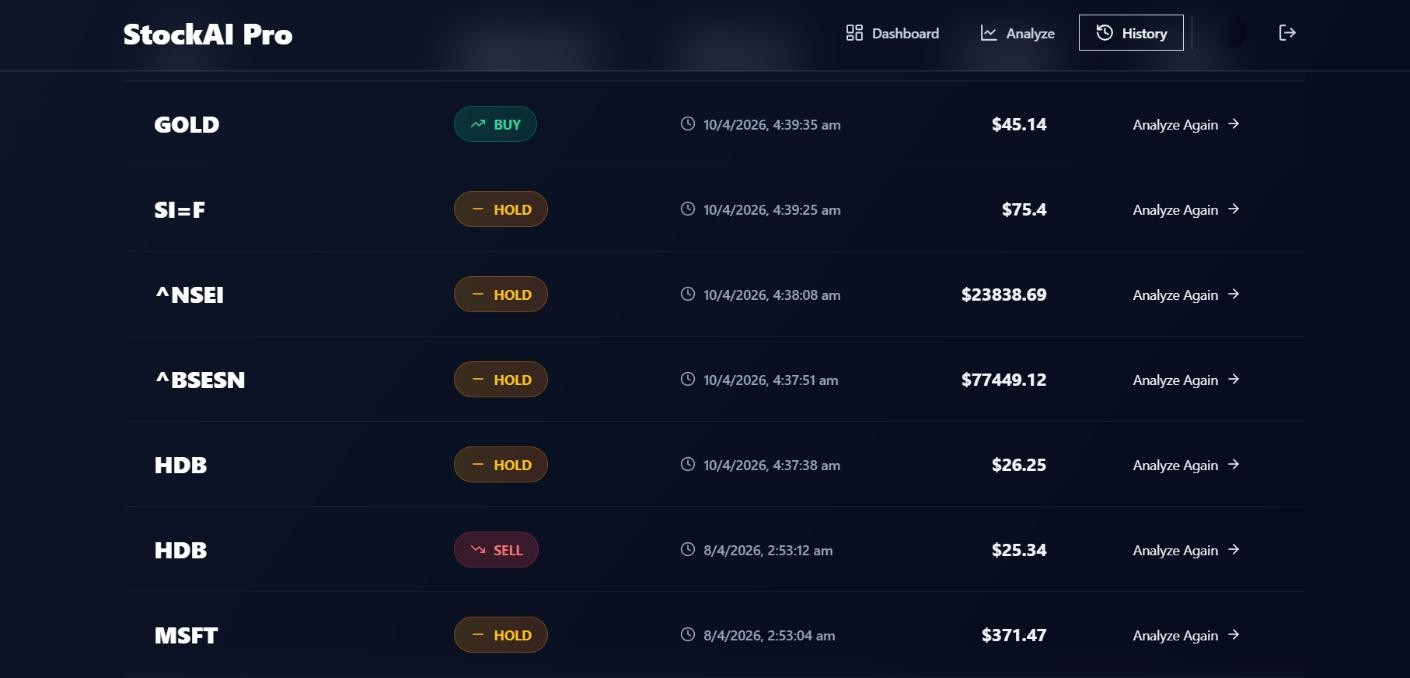
- History page → displays past records
Tools used:
- Browser Developer Tools
- Manual interaction testing
8.3System testing & conclusion
8.3.1System testing
System testing validates the entire application as a complete system.
Test scenarios included:
- 1. User registration → OTP verification → login
- 2. Login → analyze stock → store result
- 3. View history → retrieve stored data
- 4. Analyze multiple stocks → verify list update
This ensures:
- End-to-end functionality
- Smooth user experience
- Correct integration of all modules
8.3.2Performance testing
- Tested response time of APIs
- Ensured predictions are generated quickly
- Checked UI responsiveness
8.3.3Security testing
- JWT authentication tested
- Unauthorized access blocked
- Token validation ensured
8.3.4Conclusion of testing
The testing phase confirmed that the system performs reliably across all modules. The integration of machine learning, sentiment analysis, and web technologies was successfully validated. All critical functionalities such as prediction, recommendation, authentication, and history tracking were tested and verified.
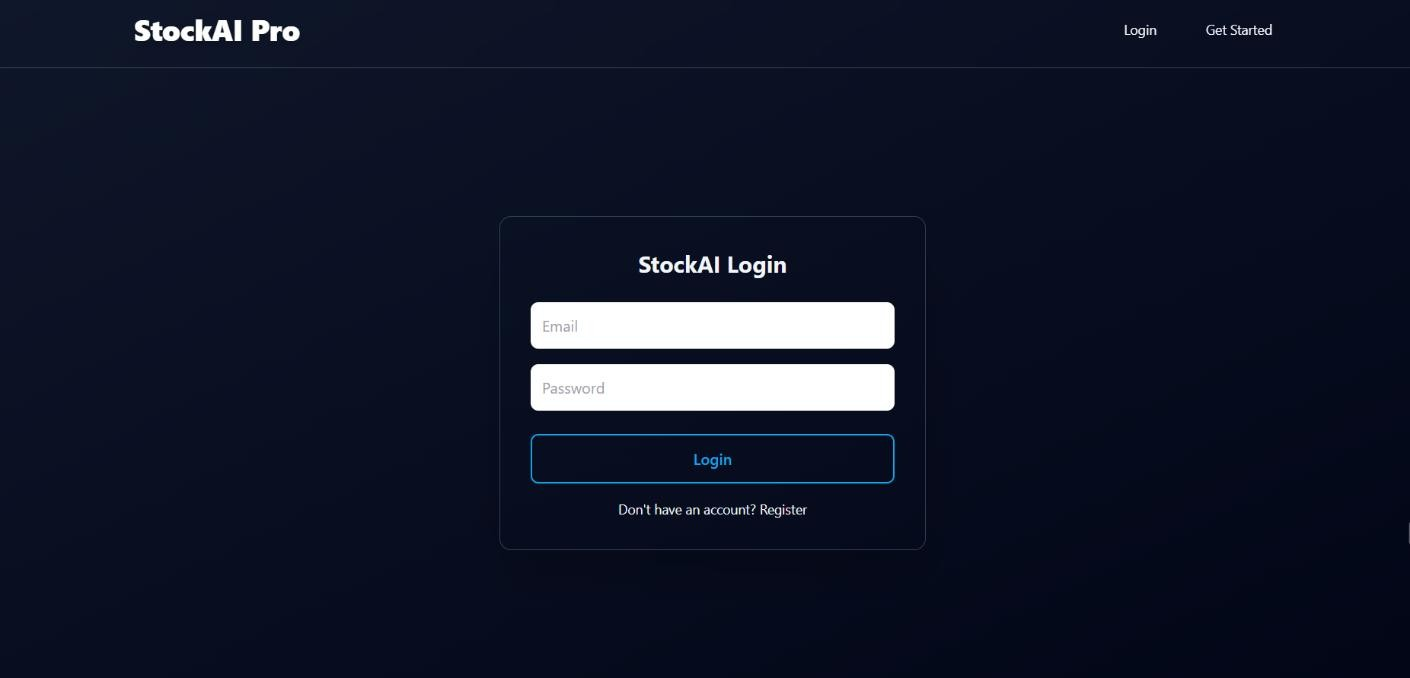
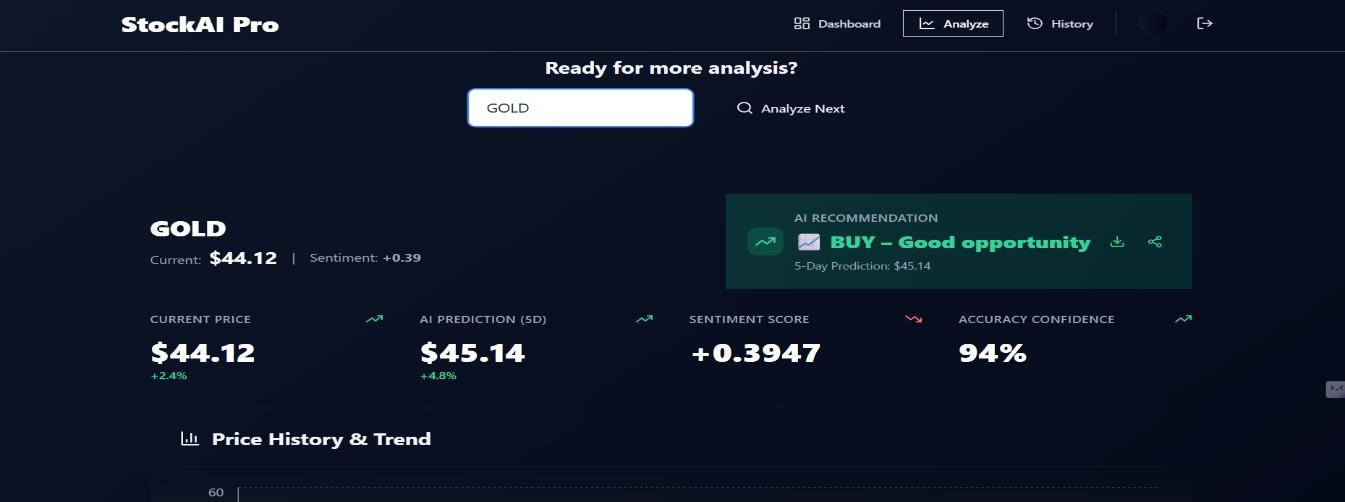
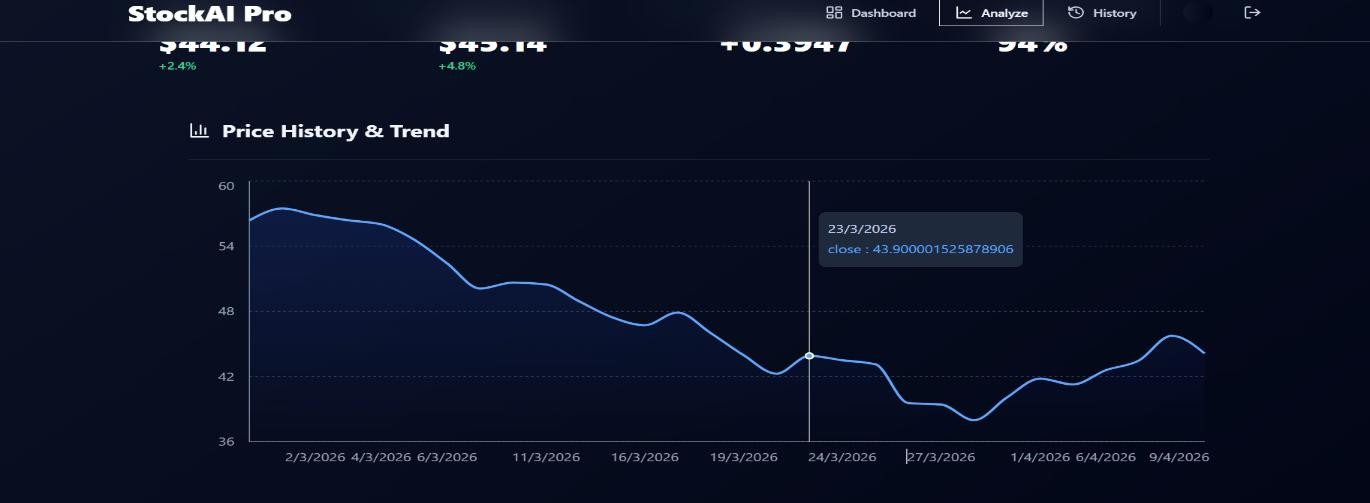
9Output screens
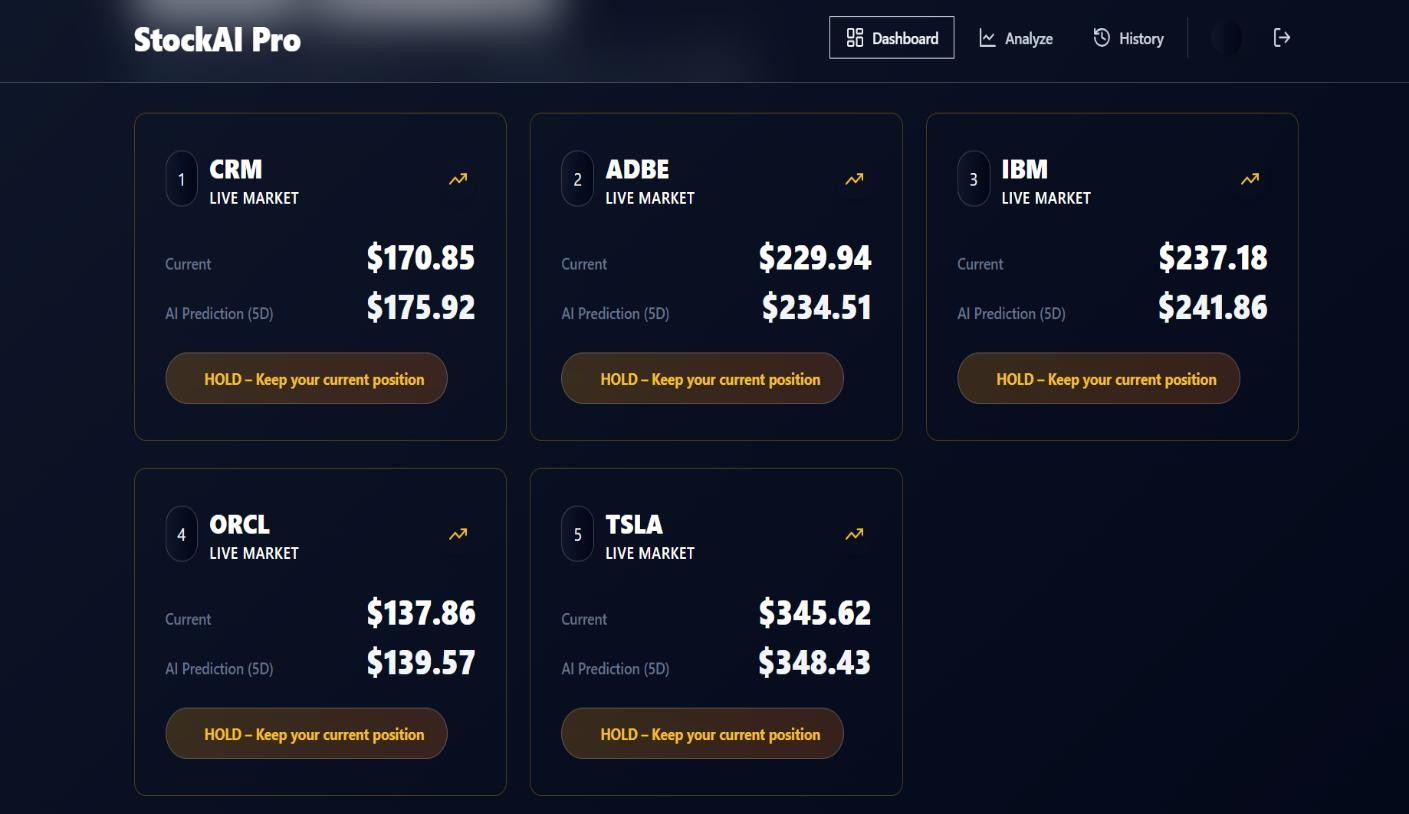
The main screens of the implemented application are shown in Figures 6–10: the login page (Figure 6), the stock analysis page (Figure 7), the price history and trend chart (Figure 8), the history page (Figure 9) and the dashboard (Figure 10).
9.1History page
9.2Dashboard page
10Conclusion and future scope
10.1Conclusion
The development of the stock market prediction system using sentiment analysis and machine learning techniques represents a significant advancement in financial data analytics. This project successfully integrates structured stock market data with unstructured textual data obtained from financial news and social media platforms. By leveraging Natural Language Processing for sentiment extraction and applying the Random Forest algorithm for prediction, the system achieves improved accuracy and reliability compared to traditional methods.
The implemented system demonstrates the effectiveness of combining investor sentiment with historical price trends to capture real-world market behavior. The results obtained through the dashboard clearly indicate that the model is capable of identifying subtle market movements and providing stable predictions. The consistent “Hold” recommendations observed in the results highlight the system’s cautious and risk-aware decision-making capability, which is essential for real-world financial applications.
Furthermore, the modular architecture of the system ensures scalability, flexibility, and ease of maintenance. Each component, including data collection, preprocessing, sentiment analysis, and prediction, works cohesively to deliver accurate outputs. The use of open-source tools and efficient algorithms makes the system both cost-effective and technically feasible.
However, the project also highlights certain limitations, such as dependency on data quality and restriction to short-term predictions. Despite these challenges, the system provides a strong foundation for intelligent stock market analysis and decision support. Overall, the project successfully meets its objectives by enhancing prediction accuracy, improving usability through a dashboard interface, and demonstrating the practical application of machine learning and sentiment analysis in financial forecasting.
10.2Future scope
The proposed system can be further enhanced by integrating advanced deep learning models such as LSTM and Transformer-based architectures to improve prediction accuracy and enable long-term forecasting. Incorporating real-time data streaming from financial APIs and social media platforms will allow the system to generate instant predictions and alerts, making it more suitable for real-world trading environments. Enhancing sentiment analysis using advanced Natural Language Processing techniques can improve the understanding of complex financial language and contextual meaning.
Additionally, the system can be expanded to support multiple financial domains such as cryptocurrencies, commodities, and foreign exchange markets, increasing its applicability. Improving visualization through interactive dashboards and developing a mobile application will enhance user accessibility and experience. Integration with automated trading systems is another potential advancement, enabling users to execute trades based on predictions. These improvements can significantly strengthen the system’s efficiency and practical usability
References
- [1]Ismail S, Pattani RV, Chacko SC. SMP-TFT: A transformer-based AI framework for stock market prediction. In: 2025 IEEE 6th India Council International Subsections Conference (INDISCON). IEEE; 2025. https://ieeexplore.ieee.org/document/11254107/
- [2]Agrawal M, Mukherjee A. Predicting stock market trends using machine learning and sentiment analysis. In: SoutheastCon 2025. IEEE; 2025. https://ieeexplore.ieee.org/document/10971605/
- [3]Yazhinian S, Hanumanthu Y, Srinivas UA, Srikrishna P, Prasanna ML, Kumar KT. ProStock: Professional stock market navigation and analysis suite. In: 2025 International Conference on Advanced Computing Technologies (ICoACT). IEEE; 2025. https://ieeexplore.ieee.org/document/11004817/
- [4]Albaooth B. The role of artificial intelligence prediction in stock market investors decisions. In: 2023 IEEE Asia-Pacific Conference on Computer Science and Data Engineering (CSDE). IEEE; 2023. https://ieeexplore.ieee.org/document/10487719/
- [5]Prakash N, Rathi Devi G, Kanimozhi JK, Loganathan E, Kandasamy CA, Yoganathan A. Accurate prediction stock market trends using BERT. In: 2025 4th International Conference on Innovative Mechanisms for Industry Applications (ICIMIA). IEEE; 2025. https://ieeexplore.ieee.org/document/11200882/
- [6]Pillai RH, Bi A. Revolutionizing stock market predictions. In: Deep learning tools for predicting stock market movements. Wiley; 2024. https://ieeexplore.ieee.org/document/10952625/
- [7]Uma Mahesh RN, Tejasvi Jois S, Sujith LB, Sujan AT, Rakesh Kumar S. Predicting stock in news headlines using deep learning. In: 2025 Annual International Conference on Data Science, Machine Learning and Blockchain Technology (AICDMB). IEEE; 2025. https://ieeexplore.ieee.org/document/11277907/