IoT in Healthcare
Smart IV Drip Monitoring and Auto-Control System Using IoT
Department of CSE (IoT, Cyber Security including Blockchain Technology), Alva’s Institute of Engineering and Technology, Moodbidri, Karnataka, India
Published October 2026
Abstract
Manual oversight of IV treatment in clinical settings is beset with inherent inefficiencies and medical complications ranging from undetected fluid depletion, wrong dosing rate, and lethal air embolism. Even though the currently available IoT-powered IV flow monitoring systems have the capability of offering uninterrupted telemetry and passive alarms, they are not capable of implementing any physical intervention to immediately stop or regulate fluid flow in emergency clinical situations. This paper aims to provide a design and implementation of an autonomous Smart IV Drip Monitoring and Auto-Control system powered by ESP32 microcontroller. The design includes a highly accurate load cell for fluid weight estimation, an optical sensor for drip rate estimation, and ultrasonic sensor for non-invasive detection of air bubbles. The key innovation of this paper involves an automated servo-controlled clamp that controls the flow rate and stops the fluid flow in a split second on detecting anomalies. The telemetry data from this system can be synchronized on web dashboards and automated mobile applications.
Keywords: Internet of Things (IoT); ESP32; infusion therapy; automated flow control; healthcare monitoring; load cell; air bubble detection
1Introduction
Intravenous (IV) infusion therapy involves the delivery of fluids, medication, and nutrition directly into the veins. The process, however, relies on visual inspections at regular intervals of time that are prone to human errors and labour intensity on part of nurses in hospital environments. Critical risks include undetected fluid depletion, reverse flow of blood, and air embolism. Although existing IoT based monitoring systems provide level measurement and passive notifications, they fail to provide autonomous real-time flow control in case of emergencies. This work aims to develop a Closed-Loop Smart IV Drip Monitoring and Automatic Flow Control System using an ESP32 microcontroller. In this design, a load cell, an optical sensor, and an ultrasonic sensor are used to monitor parameters of the fluid. As opposed to other telemetry-based systems, the most innovative feature of the system proposed in this paper is a servo-based flow clamp, which is responsible for continuous flow throttling under normal conditions and immediate stopping of the flow on anomaly detection.
2Literature survey
Several approaches have been suggested to bring innovation to infusion therapy based on IoT architecture and embedded computing technologies in order to lower the risk of complications of bedside care. Initially, much focus has been placed on the issues of monitoring fluid depletion and alerts. Maniktalia et al. [1], for example, have developed an IoT drip infusion monitoring system for measuring intravenous levels, while more et al. [7] have presented a smart saline bottle that generates automated health alerts. Similarly, John [16] has developed an automated hospital infusion monitoring system to use networking capabilities to inform nursing staff about fluid depletion. To improve calculations of drip rates, computer vision algorithms and hardware optimizations have been suggested. In particular, Giaquinto et al. [5] have used the real-time infusion monitoring framework with a specialized computer vision algorithm to validate drip rates. Jiang and He [8] have suggested ultra-low power medical infusion monitoring circuit to extend the lifetime of their solution. The embedded processing capability has been improved by Paranthaman and Annalakshmi [3] and Abiodun et al. [11], who have used ESP32 microcontroller for intravenous level monitoring and generation of automated alerts at tertiary medical centers.
Among the current trends in the field one may distinguish incorporating telemetric functionalities, mobile-based monitoring and flow regulation. Thus, Patil et al. [2] have designed the IVigilance system that allows for monitoring and regulating IV flow, while Al-Azzawi et al. [15] have developed IoT-based infusion tracker, which works with a central mobile application for caregivers. Also, network architectures are presented by Al-Zubaide et al. [13] and Chauhan et al. [10] that allow for automation of monitoring of drip parameters in smart hospitals. Among physical interventions one may point out the smart IV pole with automated drip rate adjustment function designed by Lee and Kim [9] and IoT-based automated drip rate controller introduced by Arfan et al. [6]. Moreover, multisensor inspection solutions, which involve vision and weighing sensors, have been examined by Singh et al. [14], Patil and Kulkarni [12], and Zade et al. [4].
However, the existing solutions are mostly passive notification systems [1, 7, 16] or address independently the problem of flow control [6, 9] and bubble detection [4]. The proposed architecture is able to fill these gaps by means of a combination of load cell, optical drip rate sensor, non-invasive ultrasonic bubble detector and a servo motor-operated clamp.
3System architecture
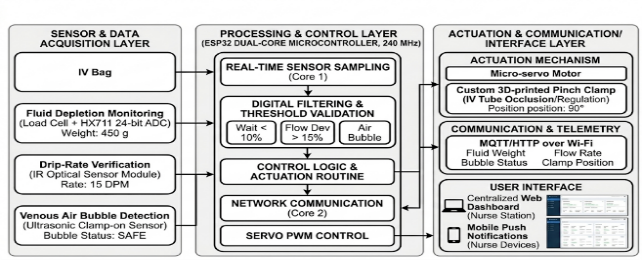
The designed closed-loop Smart IV Drip Monitoring and Auto-Control System contains three interconnected layers: the sensing and data acquisition layer, the central processing and control layer, and the communication and user interface layer. The system is designed for continuous monitoring of key infusion parameters, performing physical fail-safe actions and telemetry to remote interfaces. Figure 1 shows the overall architecture.
3.1Hardware layer & sensing modules
Fluid depletion detection: A highly sensitive strain gauge load cell in combination with HX711 24-bit ADC module continuously measures the amount of remaining fluid in IV bag and calculates the rate of depletion and time to completion.
Drip-rate detection: An infrared (IR) optical sensor module placed in front of the drip chamber detects falling drops based on beam interruption and calculates drops per minute (DPM).
Air bubble detection in the venous line: Non-invasive ultrasonic sensor attached to the lower delivery line detects density changes due to air bubble presence and is capable of detecting bubbles of 50μL size or more before reaching the venous catheter of the patient.
Actuation module: A micro-servo motor combined with custom 3D printed pinch clamp physically constricts or releases the silicone IV tube and adjusts flow rate.
3.2Processing and control unit
The central computation and decision-making pipeline is governed by an ESP32 32-bit dual-core Xtensa LX6 microcontroller operating at a clock frequency of 240 MHz. Utilizing the FreeRTOS real-time operating system, processing tasks are partitioned deterministically across both cores to eliminate latency in time-critical operations:
- Core 0 (Data Acquisition & Signal Conditioning): Dedicated to high-frequency sensor sampling and digital filtering. It applies a moving-average filter over consecutive raw ADC readings from the load cell to suppress mechanical vibrations and patient movement artifacts. Concurrently, an external hardware interrupt service routine (ISR) captures falling drop timestamps from the optical sensor to compute instantaneous drops-per-minute (DPM).
- Core 1 (Control Logic, Actuation & Telemetry): Executes the closed-loop control algorithm and network stack. It compares real-time infusion metrics against clinician-defined setpoints. For steady-state administration, a pulse-width modulation (PWM) driver adjusts the micro-servo angle to dynamically throttle the IV tube diameter.
When anomalous states occur—specifically fluid volume dropping below 10%, flow-rate deviations exceeding ±15%, or the ultrasonic bubble sensor detecting air ingress—the microcontroller instantly executes a high-priority emergency shutdown routine. This routine drives the servo to full occlusion (0°) within 300ms, cuts the flow, triggers the bedside piezoelectric buzzer, and flags an alert payload for prioritized network broadcast.
3.3Communication and telemetry interface
The ESP32 transmits telemetry packets containing fluid weight, instantaneous flow rate, bubble status, and clamp position over Wi-Fi using the lightweight MQTT/HTTP protocol. Data is visualized on a centralized web dashboard at the nurse station and relayed via push notifications to duty nurses' mobile devices, ensuring real-time multi-bed surveillance across hospital wards.
4Methodology
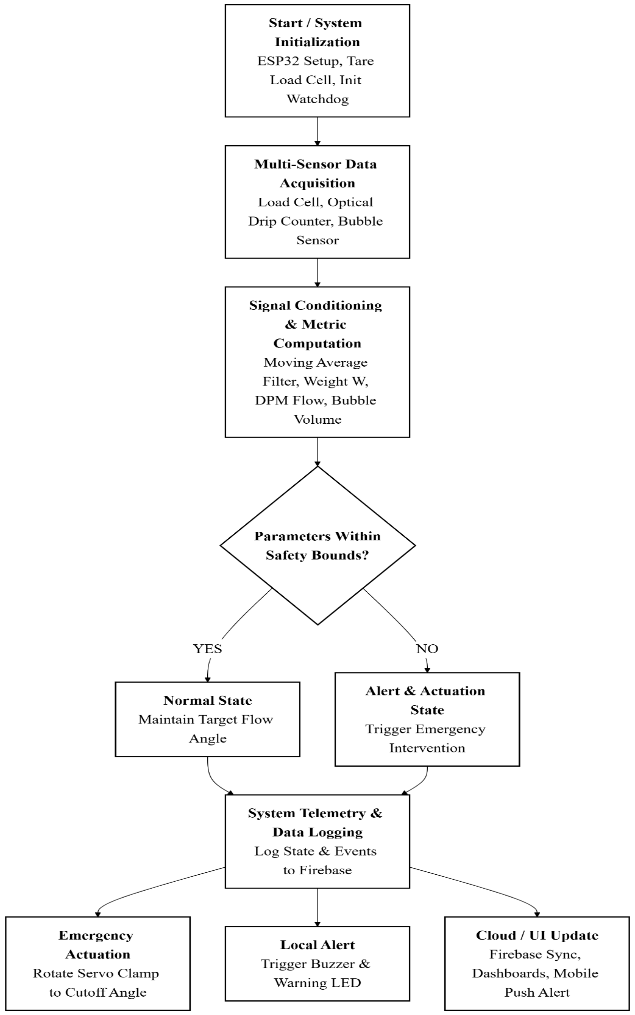
The system is designed to operate as a continuous sense–decide–act loop (Figure 2):
- 1. initialize sensors and the Wi-Fi connection
- 2. acquire load-cell, drip, and bubble readings
- 3. compute fluid level, flow rate, and bubble radius/cumulative volume
- 4. compare each quantity against its safety threshold
- 5. if all parameters are within range, upload the readings to Firebase and update both dashboards
- 6. if any parameter is unsafe, actuate the clamp servo proportionally, trigger the local buzzer/LED, push a mobile alert, and log the event to Firebase
- 7. Repeat continuously.
The remainder of this section details how each subsystem is to be calibrated, how the firmware is structured to execute this loop reliably, and how the system is planned to be tested and validated.
4.1Sensor calibration and signal processing
The load cell is calibrated using a two-step process. First the HX711 24-bit ADC module is tared with a container to get the baseline offset, which is called ADCoffset. Then a known reference weight is placed on the load cell to find the calibration constant Kcal, measured in counts, per gram. After that the instantaneous fluid weight W is calculated using this information.
where ADCraw is the raw reading from the sensor. To get rid of electrical noise and movement a moving average is used over N numbers:
The optical IR sensor is a device that watches a beam of light. The optical IR sensor notices every interruption, in that beam when a drop passes. The drops per minute are changed into how much fluid's moving each hour using the drop factor from the maker Kdrop (drops per mL):
DPM stands for drops per minute. It is calculated based on the time interval between each beam interruption. This means the number of times the beam is blocked in one minute determines the DPM value.
The sound sensor finds air bubbles in the tube. The size of a bubble is found using the way sound gets weaker:
where I0 is the acoustic intensity in fluid, I is the attenuated intensity, in the presence of an air bubble and μ is the attenuation coefficient. The total amount of air that moves during a period of observation is then calculated as:
4.2How the software works and the control loop
The ESP32 firmware works as a state machine that runs on both processor cores of the microcontroller. The ESP32 firmware has four states: Idle/Initialization, Monitoring, Alert and Actuation. The ESP32 firmware keeps the flow rate by using the difference between the actual flow and the target flow Qtarget. The ESP32 firmware then adjusts the clamp opening angle using a control rule.
where Kp is the gain governing the angular correction and θbaseline is the nominal clamp opening. When an emergency condition is detected. Weight, below 10% of capacity flow rate deviation exceeding 15% or cumulative air volume Vair exceeding a threshold Vthreshold. The system fully closes the clamp within 300ms activates the local alarm and transmits an alert to the cloud.
4.3Calibration. accuracy assessment
Each sensing subsystem is checked against a reference standard. Weight measurements are compared with containers that have a known mass on a calibrated scale. Drop timing is checked using a precision timer. Bubble detection is tested by injecting controlled amounts of air into the line. Accuracy is measured using the percentage error:
The time it takes to close the tube after a problem is recorded to make sure it works in time for patients.
4.4Early software version: Screen and alert test
Before connecting the hardware, the dashboard and alert-logic layer that communicates with Firebase were tested using software simulation. Simulated fault conditions. Such as air bubbles, low fluid levels and flow-rate deviations, were introduced to test the system. These tests showed that the software properly controls the clamp, sends alert messages and records every event. This validation happened before building the prototype.
5Simulation-based performance analysis
Because the physical prototype has not yet been built this section reports results from a simulation of the sensing and control-loop model described in Section 4 implemented in Python (NumPy). Every figure below is computed from the governing equations of Sections 3 and IV and the component timing constants sourced from manufacturer datasheets; none of the values in this section are measurements from assembled hardware. The simulation script and raw output are retained for reproducibility. Will be re-run against bench measurements following the protocol of Section 4.3 once the prototype is assembled.
5.1Component timing parameters and response-time budget
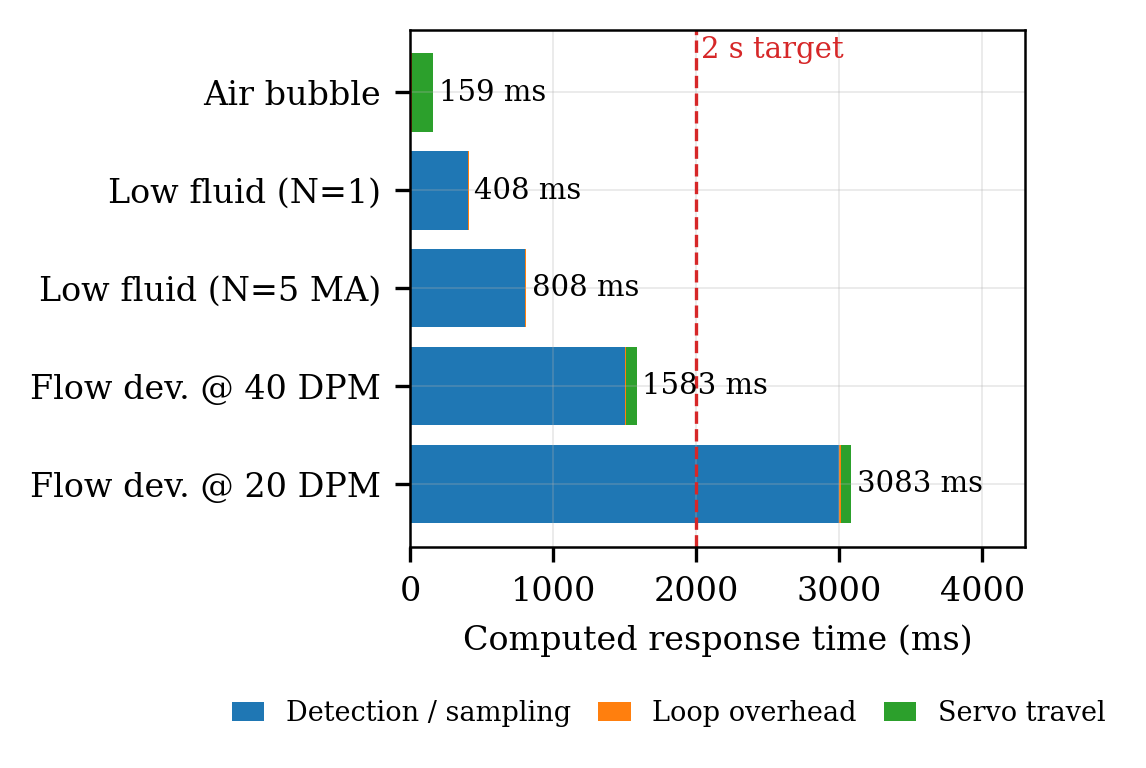
The simulation gets its timing constants directly from component datasheets: the HX711 load-cell amplifier settles in 400ms at its 10 SPS output rate and Section 3’s five-sample moving average (Eq. 2) therefore takes 800ms to update; the SG90 servo used for the flow clamp slews at 600°/s; the IR/optical drop sensor responds in under 1ms; and Firebase Realtime Database pushes over the ESP32’s Wi-Fi link typically complete in 100–500ms. An additional 8ms control-loop overhead, an engineering assumption rather than a datasheet figure is added to every path. From these constants a deterministic response-time budget was computed for each fault type by summing (i) sensor detection or sampling time (ii) the control-loop overhead and (iii) servo travel time where actuation is required.
Air-bubble shutdown is the fastest path at 159 ms (1ms detection, 8ms loop overhead 150ms servo travel) because full occlusion does not need to wait for a periodic sample. The low-fluid path is a trade-off: a single HX711 sample flags the threshold in 408ms but is susceptible to load-cell noise while the 5-sample moving average of Eq. (2) is more robust but raises the budget to 808 ms. Flow-deviation detection is bounded by the drop interval itself. At the 40 drops/min rate the total comes to 1583ms. At the 20 drops/min target rate a full 3-second interval is needed to register one new inter-drop timestamp so the computed total rises to 3083 ms, exceeding the 2-second design target stated in Section 4. This is a limitation of the per-drop measurement strategy at low flow rates that the simulation exposes analytically rather than a result that could only have been found empirically; it motivates averaging over multiple drop intervals or adding a windowed rate estimator, as future work (Section 6). Figure 3 shows the budget for each fault type.
5.2Closed-loop flow regulation under a disturbance
The proportional controller of Eq. (6) was tested against a step disturbance set to +10% of the 60 mL/h target flow rate applied at t = 30 seconds. Simulations were run for proportional gains Kp ranging from 0 to 1.0. Drip rate measurements were recorded event-by-event using inter-drop timestamps with 20ms Gaussian jitter added to mimic timing noise as it would occur on actual hardware firmware.
When no correction is used (Kp = 0) the 10% disturbance remains unchanged and becomes a steady-state error. As Kp increases the proportional feedback reduces this error. At Kp = 0.1 the steady-state deviation drops to 8.8%. At Kp = 0.25 it decreases further to 7.5%. At Kp = 0.5 the error is 6.1%. At Kp = 0.7 it reaches 5.3%. However, improving accuracy comes with a trade-off: oscillations around the setpoint grow larger. Ripple starts at 0.4% when Kp = 0.1 increases to 1.9% at Kp = 0.5 and rises to 4.0% at Kp = 0.7. At this point the system becomes only marginally stable showing oscillations. When Kp is pushed to 1.0 the system does not settle. It overshoots into the ±15% emergency range and triggers a false shutdown at simulated time t = 44.2 seconds.
This shows that Kp ≈ 0.5 is the upper limit for this actuator and servo combination. This result is derived directly from simulation data not assumed during design. Figure 4 compares the uncorrected and proportionally controlled responses.
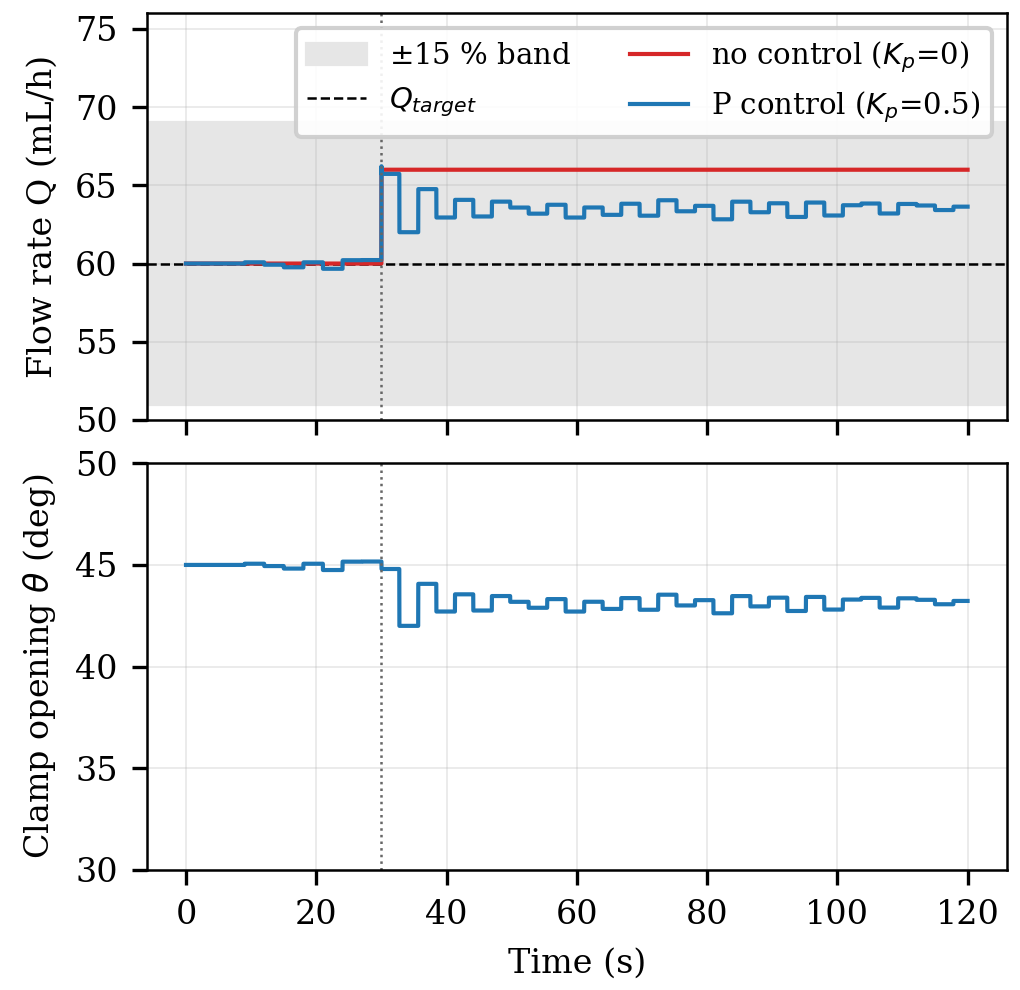
This behaviour matches the closed-loop theory of Eq. (6): for a disturbance d and loop gain g (mL/h per degree of clamp opening) the predicted residual error is d/(1+gKp). The simulation reproduces this formula to within 0.2 percentage points at every tested gain. This confirms the control model against its equations before any hardware is involved.
5.3Emergency shutdown, for a disturbance
When the same control loop faces a larger disturbance, specifically a +30% change the measured flow deviation goes beyond the ±15% emergency threshold mentioned in Section 4. In response the firmware model commands a full clamp closure instead of making a proportional correction (Figure 5).
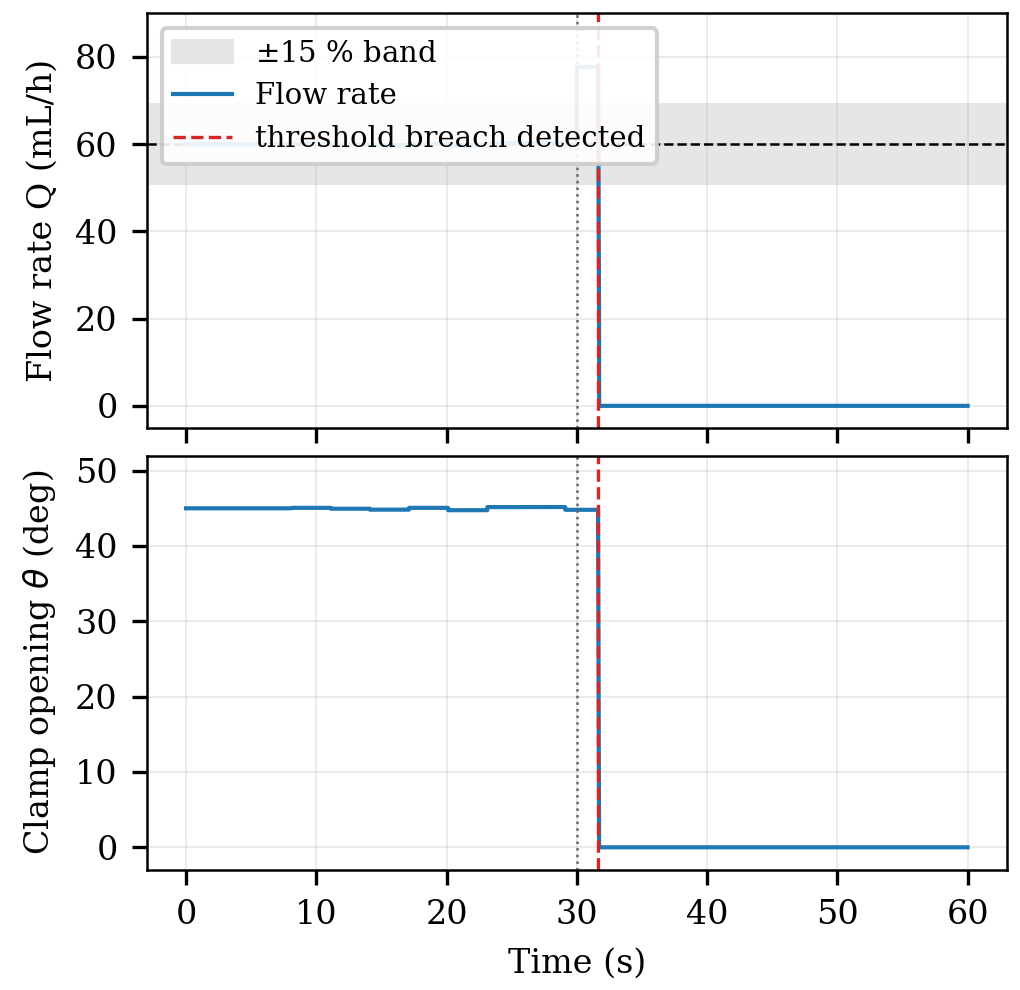
Because detection requires finishing one inter‑drop interval before the change can be measured shutdown latency is tied to when the disturbance starts compared with the drop cycle. Running the scenario with 300 onset phases shows an average shutdown latency of 2646 milliseconds (the 95th percentile is 3750 milliseconds, with a range from 1350 to 3975 milliseconds) which is safely within the two‑second target for this fault type even in the worst simulated situation.
5.4Cloud synchronization latency
Cloud alert latency was simulated as a random variable between 100 and 500 milliseconds matching the range reported for ESP32‑to‑Firebase Realtime Database pushes. In 10,000 pushes the average latency was 301 milliseconds (the 95th percentile was 481 milliseconds). This confirms that the local buzzer, LED and servo path—each taking less than one second as stated in subsection A—will always alert a caregiver at the bedside long before the cloud‑dependent mobile notification arrives. This is the intended two‑tier alerting behaviour explained in Section 3.
Note: All figures and numbers in this section come from a software simulation that uses manufacturer datasheet parameters and the control equations from Sections 3 and IV. These are presented as computed or predicted results not as measurements, from hardware. The same simulation script will be run again with measured component parameters, and its outputs will be compared to bench measurements taken under the validation protocol of Section 4‑C once the physical prototype is built.
6Conclusion and future scope
This paper presented a Smart IV Drip Monitoring and Auto-Control System that pushes prior IoT drip-monitoring work beyond passive observation into closed-loop safety management — combining fluid-level, drip-rate, and sized bubble detection on an ESP32 platform with autonomous, servo-actuated flow correction and a two-tier local-plus-cloud alerting scheme built on a Firebase real-time backend. Each subsystem was grounded in an explicit physical or control-theoretic model — Wheatstone-bridge load sensing, beam-attenuation bubble sizing, and proportional feedback control — rather than treated as a black-box sensor-to-alert pipeline.
By replacing single-parameter, notification-only monitoring with multi-parameter sensing and direct, physically grounded actuation, this design aims to shrink the window during which a patient is exposed to risk, while staying inexpensive, modular, and scalable across different ward and clinic settings. Section 5 sets out the specific accuracy and response-time targets — drawn from the underlying sensing physics and from comparable systems in the literature — against which the fabricated prototype will eventually be benchmarked. Network dependency for remote dashboard access, along with the need for periodic load-cell and IR-sensor recalibration, remain practical considerations for deployment, though the local buzzer/LED/servo path is deliberately designed to keep working through a network outage.
A preliminary software prototype of the dashboard and alert-logic layer, described in Section 4.4, has already been built and exercised with simulated sensor inputs, confirming that the intended data flow and threshold-to-actuation behaviour can be implemented in software ahead of hardware fabrication. The immediate next step is to build the hardware prototype and validate it empirically against the performance targets set out in Section 5. Beyond that, planned future work includes machine-learning-based anomaly detection tuned to individual patient infusion profiles to cut down on false alarms relative to fixed thresholds; integration with hospital information systems and electronic health records so infusion data is logged directly against the patient's clinical record; a digital-twin model of patient infusion status to support richer, simulation-based clinical decision-making; and edge-AI inference running directly on the ESP32 so anomaly detection keeps working even during a network outage. Together, these directions point toward a more autonomous, predictive, and deeply integrated next generation of connected IV safety systems.
References
- [1]Maniktalia R, Tanwar S, Billa R, Deepa K. IoT based drip infusion monitoring system. In: Proc. IEEE Delhi Section Conf. (DELCON). 2022. p. 1–6.
- [2]Patil H, Ram M, Gharat V, Kudoo S. IVigilance – IoT based intravenous drip monitoring and controlling system. Int J Creative Res Thoughts (IJCRT). 2024;12(4):120–128.
- [3]Paranthaman A, Annalakshmi K. IV fluid bag monitoring, alert, and control system using ESP32 and IoT. Int J Sci Adv Technol (IJSAT). 2025;16(2):270–277.
- [4]Zade KS, Pathan FK, Darbe H, Khan F. Smart visual inspection and IV monitoring system with IoT. Int Res J Modernization Eng Technol Sci (IRJMETS). 2024;6(4):1–10.
- [5]Giaquinto N, Scarpetta M, Ragolia MA, Pappalardi P. Real-time drip infusion monitoring through a computer vision system. In: Proceedings of the IEEE International Symposium on Medical Measurements and Applications (MeMeA); 2020. p. 1–5.
- [6]Arfan M, Srinivasan M, Baragur AG, Naveen V. Design and development of IoT enabled IV infusion rate monitoring and control device. In: Proc. 4th Int. Conf. Electronics, Communication and Aerospace Technology (ICECA). 2020. p. 1–7.
- [7]More A, Bhor D, Tilak M, Nagare G. IoT based smart saline bottle for healthcare. Int Res J Eng Technol (IRJET). 2021;10(6):1020–1025.
- [8]Jiang S, He Y. A low power circuit for medical drip infusion monitoring system. In: Proc. IEEE Int. Conf. Smart Internet of Things (SmartIoT). 2020. p. 342–345.
- [9]Lee J, Kim H. Development of a smart IV pole with automatic drip-rate regulation. IEEE Sensors J. 2022;22(14):14210–14218.
- [10]Chauhan H, Verma V, Gupta D, Gupta S. IoT-based automatic intravenous fluid monitoring system for smart medical environment. Int J Comput Appl Technol. 2021;66(2):154–164.
- [11]Abiodun OJ, Okpe AO, Otiko AO, Junior AS. Internet of Things based intravenous fluid level monitoring and alert system for Nigeria tertiary healthcare centers using ESP32 microcontroller. Int J Saf Secur Eng. 2025;13(2):13–24.
- [12]Patil SR, Kulkarni AR. Smart intravenous fluid monitoring system using IoT. Int J Eng Res Technol (IJERT). 2021;10(6):300–305.
- [13]Al-Zubaide MA, Issa AA, Al-Zoubi HM. Design and implementation of a smart intravenous infusion monitoring system based on IoT. Int J Electr Comput Eng (IJECE). 2023;13(3):3323–3332.
- [14]Singh SK, Verma AK, Singh PK. IoT enabled smart intravenous drip monitoring and control system for healthcare applications. Int J Recent Technol Eng (IJRTE). 2022;10(6):45–50.
- [15]Al-Azzawi RSH, Al-Salihi MAM, Al-Dujaili ZT. Smart intravenous infusion monitoring system using IoT and mobile application. Int J Interactive Mobile Technol (iJIM). 2023;17(8):78–93.
- [16]John A. Intravenous drip monitoring system for smart hospital using IoT. Int J Eng Adv Technol (IJEAT). 2020;9(3):2237–2242.