Geosciences and Environmental Management
Spatial Distribution and Hydrogeological Controls on Hydrocarbon Contamination in Groundwater in Ogale, Niger Delta, Nigeria
Institute of Geosciences and Environmental Management, Rivers State University, Nkpolu Oroworukwo, Port Harcourt, Rivers State, Nigeria
Published October 2026
Abstract
Groundwater contamination by petroleum hydrocarbons is an environmental concern in the Niger Delta, where oil-related activities threaten groundwater resources used by surrounding communities. This study investigated the spatial distribution of total petroleum hydrocarbons (TPH), polycyclic aromatic hydrocarbons (PAHs), and benzene, toluene, ethylbenzene and xylenes (BTEX) in groundwater in Ogale, Rivers State, Nigeria, and examined their relationships with selected hydrogeological parameters. Fifty-six groundwater sampling locations were assessed using hydrocarbon concentration data, hydraulic-head measurements, hydraulic-conductivity estimates, and geospatial analysis. Descriptive statistics showed substantial spatial variability in contaminant concentrations. TPH ranged from 0 to 1,680,625 µg/L, with a mean of 108,024.36 µg/L and a median of 8,255.50 µg/L. PAHs ranged from 0 to 12,454 µg/L, while BTEX ranged from 0 to 25,469 µg/L. Hydraulic head ranged from 4.640 to 16.120 m, and hydraulic conductivity varied from 1.220 × 10⁻⁸ to 2.610 × 10⁻³ m/s. Spearman’s rank correlation analysis identified a positive association between TPH concentration and depth to water (ρ = 0.301, p = 0.024). No statistically significant associations were observed between the other hydrocarbon groups and the examined hydrogeological parameters. The findings demonstrate heterogeneous groundwater contamination and indicate that depth to water may be associated with TPH distribution. However, the observational design and limited statistical associations do not establish causal transport mechanisms. The study highlights the importance of integrating contaminant mapping with hydrogeological characterisation to guide targeted groundwater monitoring, delineation of contamination, and remediation planning in Ogale.
Keywords: Hydrocarbon contamination; groundwater quality; spatial distribution; hydrogeological controls; total petroleum hydrocarbons (TPH); polycyclic aromatic hydrocarbons (PAHs); BTEX; hydraulic conductivity; groundwater flow
1Introduction
Groundwater is an important source of domestic and other water supplies in the Niger Delta, Nigeria, but its quality is threatened by petroleum exploration, pipeline leakage, oil spills and artisanal refining. Hydrocarbon contamination can compromise groundwater suitability and create persistent environmental and public-health concerns, particularly where settlements depend on shallow aquifers. The vulnerability of groundwater is influenced by contaminant characteristics, geological formations, rainfall, groundwater depth and subsurface hydraulic properties. Consequently, understanding the spatial distribution of hydrocarbon contaminants and the hydrogeological factors influencing their occurrence and potential migration is essential for sustainable groundwater management (Sam et al., 2017; Ite et al., 2018; Adeniran et al., 2023).
Ogale, in Eleme Local Government Area of Rivers State, is situated within the hydrocarbon-producing Niger Delta, where petroleum-related activities have contributed to concerns about environmental contamination. Previous investigations have documented the occurrence and spatial extent of hydrocarbon-impacted subsurface materials in the community. Ovuru and Udom (2018) employed vertical electrical sounding and electrical resistivity tomography to investigate hydrocarbon-contaminated soil and groundwater in parts of Ogale, identifying subsurface characteristics consistent with aquifer contamination. More recently, Ogolo et al. (2026) integrated geophysical, geochemical and hydrogeological methods to characterise hydrocarbon contamination at the Ajeokpori artisanal refinery site in Ogale. These investigations demonstrate the importance of combining subsurface characterisation with chemical analysis to delineate contamination and inform environmental management.
Evidence from other parts of the Niger Delta further illustrates the spatial complexity of petroleum contamination. Ite et al. (2018) reviewed petroleum hydrocarbon contamination in surface water and groundwater across the region, while Umar et al. (2023) investigated hydrocarbon pollution in the Ahoada area using an integrated assessment approach. Lubi and Akinluyi (2022) examined the spatial distribution of groundwater hydrocarbon contamination in Opuama, and Ola et al. (2024) assessed petroleum contamination through a sub-catchment-based field investigation. At the regional scale, Oyebamiji et al. (2025) applied a source–pathway–receptor framework to identify areas vulnerable to groundwater contamination from crude-oil spills. Collectively, these studies highlight the importance of spatial analysis, hydrogeological conditions and contaminant pathways in assessing groundwater vulnerability.
Hydrocarbon migration is controlled by interactions between groundwater-flow conditions, hydraulic conductivity, aquifer geometry, lithological heterogeneity and the physicochemical properties of individual compounds. Permeable formations may facilitate contaminant transport, whereas low-permeability layers may restrict movement or contribute to contaminant persistence. However, dissolved hydrocarbons and separate non-aqueous phases exhibit different transport behaviours; therefore, concentration patterns alone cannot establish the presence or movement of dense non-aqueous phase liquids (DNAPLs). Studies of groundwater attenuation and the spatial and vertical distribution of hydrocarbons in the Niger Delta further demonstrate the need to consider subsurface conditions when interpreting contamination patterns (Aleku et al., 2024; Abam, 2025).
Despite these contributions, further site-specific investigation is needed to clarify how the distributions of total petroleum hydrocarbons (TPH), polycyclic aromatic hydrocarbons (PAHs) and benzene, toluene, ethylbenzene and xylenes (BTEX) relate to groundwater-flow directions and hydraulic conductivity in Ogale. This study therefore integrates contaminant concentration data, hydrogeological characterization and geospatial modelling to identify contamination hotspots and evaluate the subsurface conditions associated with their distribution. The findings are intended to strengthen the evidence base for groundwater monitoring, contamination delineation and targeted remediation in Ogale and comparable hydrocarbon-affected environments across the Niger Delta.
1.1Aim of the study
The aim of this study is to assess the spatial distribution of hydrocarbon contamination in groundwater and evaluate the hydrogeological controls influencing its occurrence and potential migration in Ogale, Niger Delta, Nigeria.
1.2Specific objectives
The study seeks to:
- 1. Determine the spatial distribution and concentrations of total petroleum hydrocarbons (TPH), polycyclic aromatic hydrocarbons (PAHs), and benzene, toluene, ethylbenzene and xylenes (BTEX) in groundwater in Ogale.
- 2. Characterise the hydrogeological conditions of the study area, including groundwater hydraulic head, flow patterns and hydraulic conductivity.
- 3. Evaluate the relationships between hydrocarbon contamination patterns and hydrogeological conditions to identify potential contaminant transport pathways and areas requiring further investigation
2Theoretical framework
2.1Advection–dispersion theory
The advection–dispersion theory, associated with Bear (1972) and further developed in the groundwater literature by Freeze and Cherry (1979), explains the transport and spreading of dissolved contaminants in groundwater. Advection describes the movement of contaminants with flowing groundwater, whereas dispersion accounts for contaminant spreading resulting from variations in pore-water velocities and molecular diffusion. Other processes, including sorption, degradation and chemical reactions, may also influence contaminant mobility and persistence (Bear, 1972; Freeze & Cherry, 1979).
The theory is relevant to the present study because it provides a conceptual basis for examining the relationships between groundwater hydraulic head, flow direction, hydraulic conductivity, subsurface heterogeneity and the spatial distribution of total petroleum hydrocarbons (TPH), polycyclic aromatic hydrocarbons (PAHs) and benzene, toluene, ethylbenzene and xylenes (BTEX) in Ogale, Niger Delta, Nigeria. It helps explain why contaminant concentrations may vary spatially under different hydrogeological conditions. However, concentration distributions alone cannot establish contaminant migration pathways or demonstrate the processes responsible for observed patterns.
Previous applications of the theory include the groundwater-flow and contaminant-transport analyses presented by Freeze and Cherry (1979) and subsequent investigations of contaminant behaviour in porous aquifers. In the present study, the theory supports the interpretation of hydrocarbon concentration maps alongside groundwater-flow and hydraulic-conductivity patterns.
2.2Source–pathway–receptor model
The Source–Pathway–Receptor (SPR) model is an environmental risk-assessment framework used to identify and evaluate the connections between contamination sources, migration pathways and potentially exposed receptors. Rather than being attributed to a single originating author, the framework has been incorporated into environmental risk-assessment guidance, including that of the UK Environment Agency. It provides a systematic approach for determining whether a plausible linkage exists between a contaminant source, a route of migration and a receptor that may be affected.
The model is relevant to this study because hydrocarbon releases in Ogale represent potential contamination sources, while contaminated soil, geological formations and groundwater may constitute migration pathways. Groundwater users and connected environmental systems are potential receptors. Integrating hydrocarbon concentration measurements with groundwater-flow patterns and hydraulic conductivity can therefore help identify contamination hotspots and locations requiring further investigation. Nevertheless, establishing a complete source–pathway–receptor linkage requires evidence beyond spatial coincidence alone.
A relevant previous application is the study by Oyebamiji et al. (2024), published in Earth Systems and Environment, which applied the SPR approach with geospatial analysis to assess groundwater contamination risk from crude-oil spills across the Niger Delta. Their work demonstrates the framework's regional applicability. The present study extends this line of investigation by focusing on the spatial distribution of measured TPH, PAHs and BTEX concentrations and their relationships with hydrogeological conditions in Ogale.
3Materials and methods
3.1Research design
The study adopted a field-based environmental investigation integrating groundwater sampling, laboratory hydrocarbon analysis, hydrogeological characterisation, and geospatial analysis. Fifty-six groundwater sampling locations were assessed to determine contaminant concentrations and investigate their relationships with hydraulic head, hydraulic conductivity, depth to water, and aquifer thickness.
The study was observational. Accordingly, the findings were interpreted as evidence of spatial patterns and statistical associations rather than experimental confirmation of contaminant migration or causal hydrogeological controls.
3.2Study area
The study was conducted in Ogale, Eleme Local Government Area, Rivers State, Nigeria, within the Niger Delta. The investigation covered an approximate spatial extent bounded by eastings 294,300–295,000 m and northings 531,400–532,300 m in the projected coordinate system used for the study.
The sampling locations provided the spatial framework for mapping hydrocarbon concentrations and hydrogeological parameters.
3.3Groundwater sampling and data collection
Groundwater samples were collected from GPS-referenced boreholes or sampling points across the study area. The coordinates were linked to laboratory measurements to facilitate spatial analysis. Available information on borehole construction, groundwater depth, sampling depth, surrounding land use, and proximity to petroleum-related activities was considered where documented.
3.4Laboratory analysis of hydrocarbons
The target contaminant groups were TPH, PAHs, and BTEX. TPH was used to characterise the measured petroleum hydrocarbon burden, while PAHs and BTEX represented distinct groups of petroleum-associated compounds with different environmental behaviours.
Gas chromatography–mass spectrometry (GC–MS) was used as the analytical approach.
The analytical results were linked to the corresponding sampling coordinates. Concentrations were reported in micrograms per litre (µg/L).
3.5Hydrogeological characterisation
Hydrogeological assessment focused on hydraulic head, groundwater-flow patterns, hydraulic conductivity, depth to water, and aquifer thickness.
3.5.1Hydraulic head and groundwater-flow patterns
Hydraulic-head values were compiled for the 56 sampling locations. Where calculated from groundwater levels, hydraulic head should be determined using surveyed measuring-point elevations and corresponding water-level measurements. Groundwater-flow direction was inferred from spatial variations in hydraulic head, with groundwater generally flowing from higher to lower hydraulic potential.
Hydraulic-head distribution was compared with contaminant concentration maps to examine whether concentration patterns were spatially associated with the inferred flow field. The final manuscript should clarify whether water levels were measured during the same sampling period and how elevation and water-level measurement uncertainties were addressed.
3.5.2Hydraulic conductivity
Hydraulic conductivity was used to characterise the ability of subsurface materials to transmit groundwater. The reported values were spatially compared with contaminant concentrations to investigate whether areas of elevated hydrocarbon concentrations coincided with differences in subsurface permeability.
Hydraulic conductivity should not be interpreted as the sole determinant of contaminant transport because groundwater gradients, lithology, aquifer geometry, sorption, dissolution, and degradation also influence contaminant behaviour.
3.6Geospatial analysis
Golden Software Surfer was used to visualise the spatial distributions of TPH, PAHs, BTEX, hydraulic head, and hydraulic conductivity. Separate maps were prepared for the individual variables to distinguish their spatial patterns.
Spatial interpolation was used to estimate values between sampling points, using inverse distance weighting (IDW) and kriging as candidate methods. Interpolated surfaces should be interpreted as spatial estimates rather than direct measurements or definitive contamination boundaries.
3.7Statistical analysis
Descriptive statistics, including means, standard deviations, medians, minima, and maxima, were used to summarise contaminant concentrations and hydrogeological parameters.
Spearman’s rank correlation was used to assess monotonic relationships between hydrocarbon concentrations and selected hydrogeological variables. The analysis included hydraulic head, hydraulic conductivity, depth to water, and aquifer thickness. Correlation coefficients and p-values were used to evaluate the direction, strength, and statistical evidence of associations.
Because the contaminant data were strongly skewed, the interpretation emphasised medians, ranges, and rank-based associations rather than relying on means alone.
3.8Quality assurance and spatial uncertainty
Predictions in areas with sparse sampling or beyond the sampled locations should be interpreted cautiously.
4Results
4.1Descriptive statistics of TPH, PAHs, and BTEX concentrations
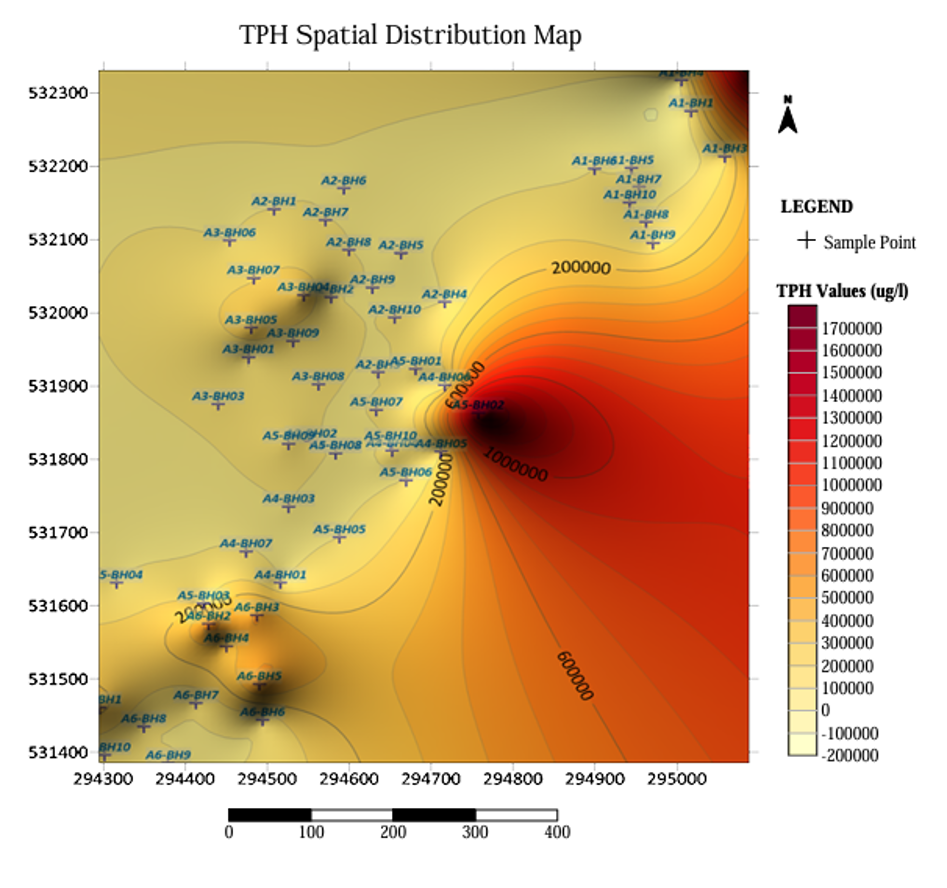
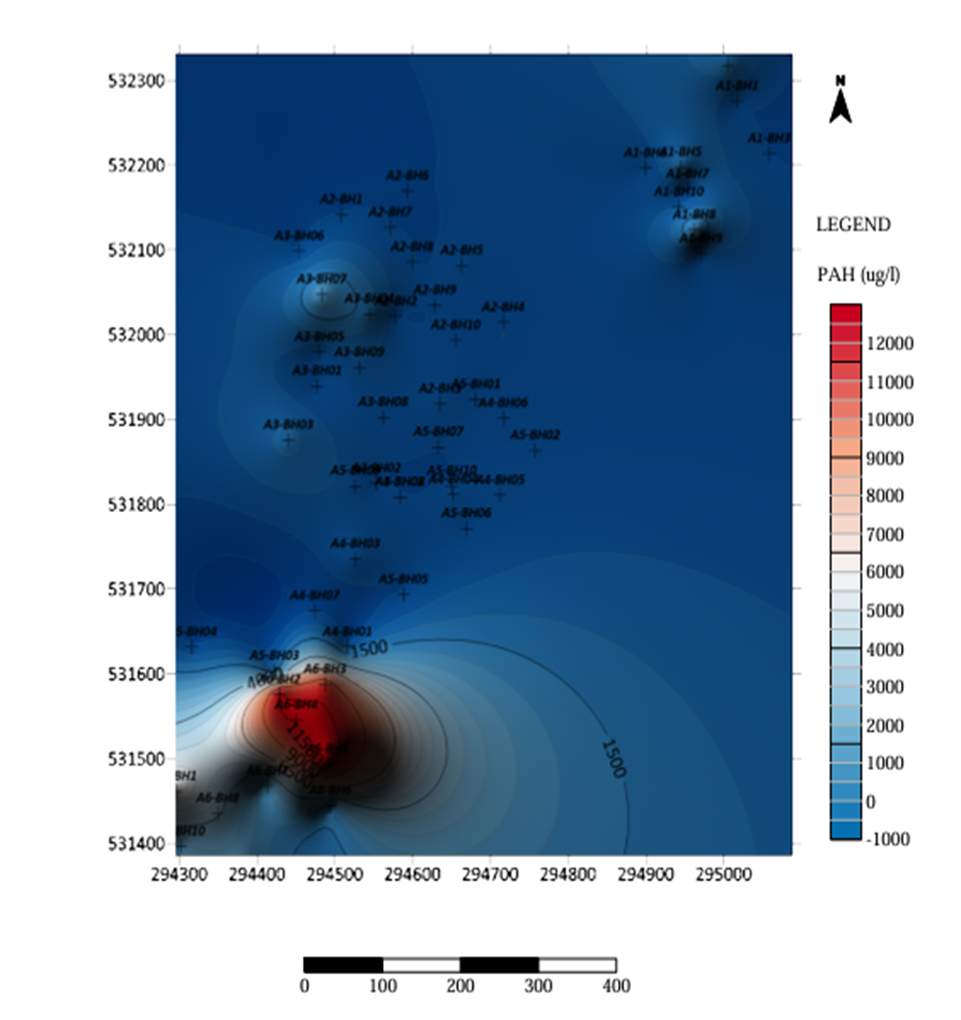
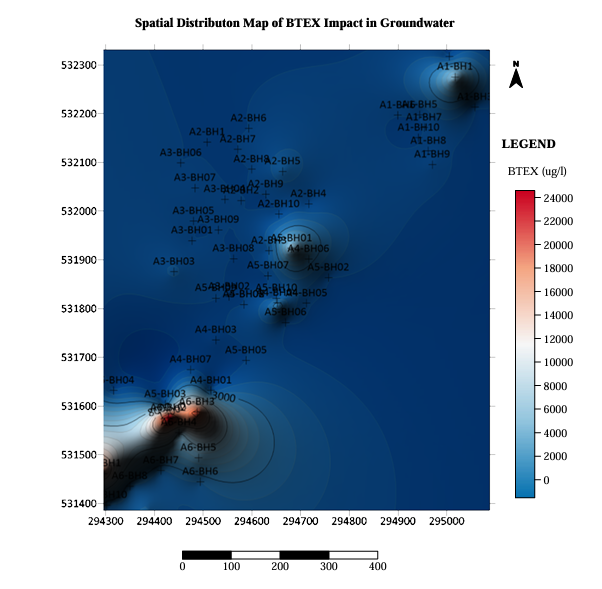
The 56 groundwater samples exhibited substantial variability in TPH, PAH, and BTEX concentrations (Table 1). TPH recorded the highest mean concentration, at 108,024.36 ± 309,493.24 µg/L, and a maximum of 1,680,625 µg/L. Its median concentration was 8,255.50 µg/L. PAHs recorded a mean of 1,494.91 ± 3,114.52 µg/L and a maximum of 12,454 µg/L, while BTEX had a mean of 2,036.61 ± 4,996.70 µg/L and a maximum of 25,469 µg/L.
For all three contaminant groups, the means substantially exceeded the medians, indicating strongly right-skewed distributions. This pattern suggests that high-concentration observations influenced the arithmetic means and that contamination was spatially heterogeneous..
| Parameter | n | Mean (µg/L) | SD (µg/L) | Median (µg/L) | Minimum (µg/L) | Maximum (µg/L) |
|---|---|---|---|---|---|---|
| TPH | 56 | 108,024.36 | 309,493.24 | 8,255.50 | 0.00 | 1,680,625.00 |
| PAHs | 56 | 1,494.91 | 3,114.52 | 81.90 | 0.00 | 12,454.00 |
| BTEX | 56 | 2,036.61 | 4,996.70 | 16.00 | 0.00 | 25,469.00 |
4.2Distribution of hydrogeological parameters
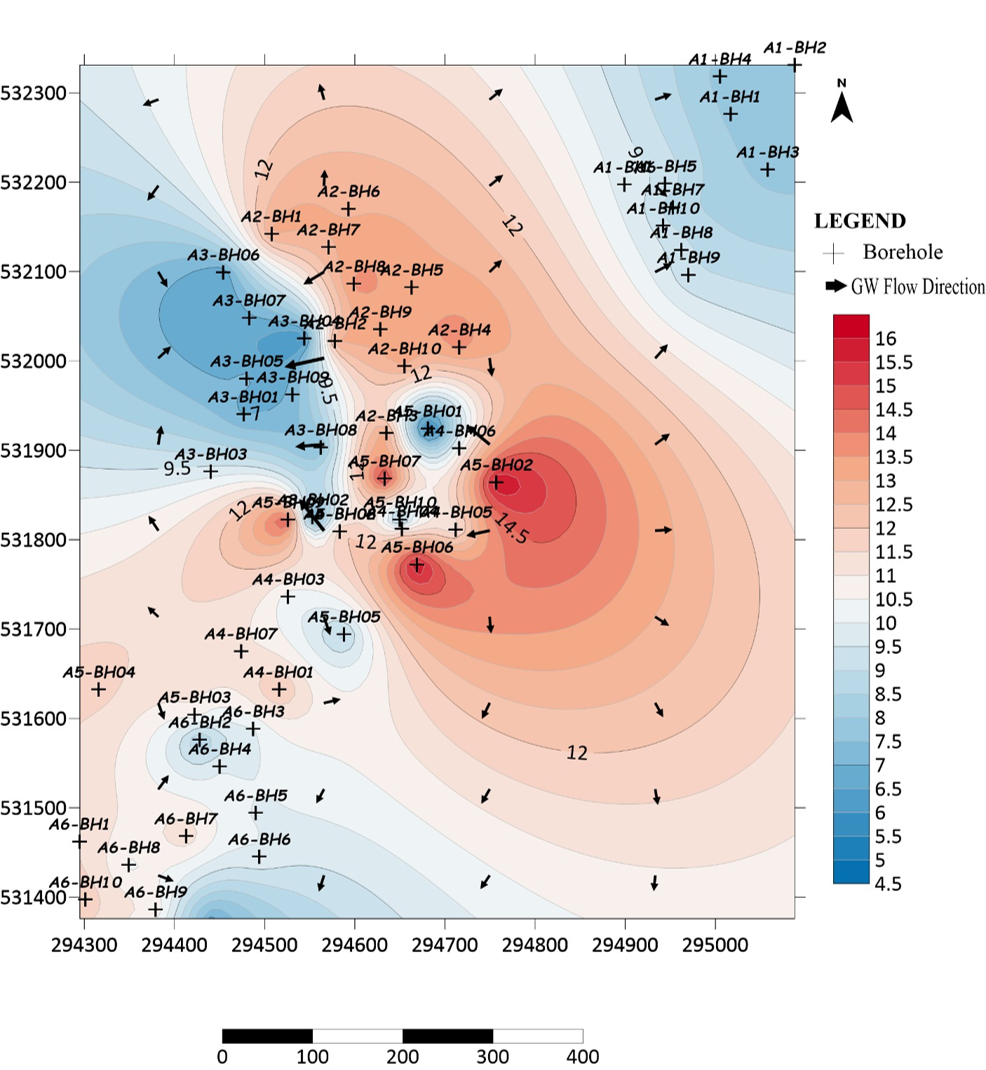
Hydraulic head ranged from 4.640 to 16.120 m, with a mean of 10.236 ± 2.806 m and a median of 10.090 m. Hydraulic conductivity ranged from 1.220 × 10⁻⁸ to 2.610 × 10⁻³ m/s (Table 2). Its mean was 2.529 × 10⁻⁴ m/s, while the median was 3.330 × 10⁻⁴ m/s.
The broad hydraulic-conductivity range indicates substantial variability in the reported estimates. The mean being lower than the median suggests that lower values influenced the arithmetic average. The spatial significance of these differences depends on the distribution of the values, the reliability of their estimation, and the geological conditions represented by the sampling locations.
| Parameter | Unit | n | Mean | SD | Median | Minimum | Maximum |
|---|---|---|---|---|---|---|---|
| Hydraulic head | m | 56 | 10.236 | 2.806 | 10.090 | 4.640 | 16.120 |
| Hydraulic conductivity (K) | m/s | 56 | 2.529 × 10⁻⁴ | 4.118 × 10⁻⁴ | 3.330 × 10⁻⁴ | 1.220 × 10⁻⁸ | 2.610 × 10⁻³ |
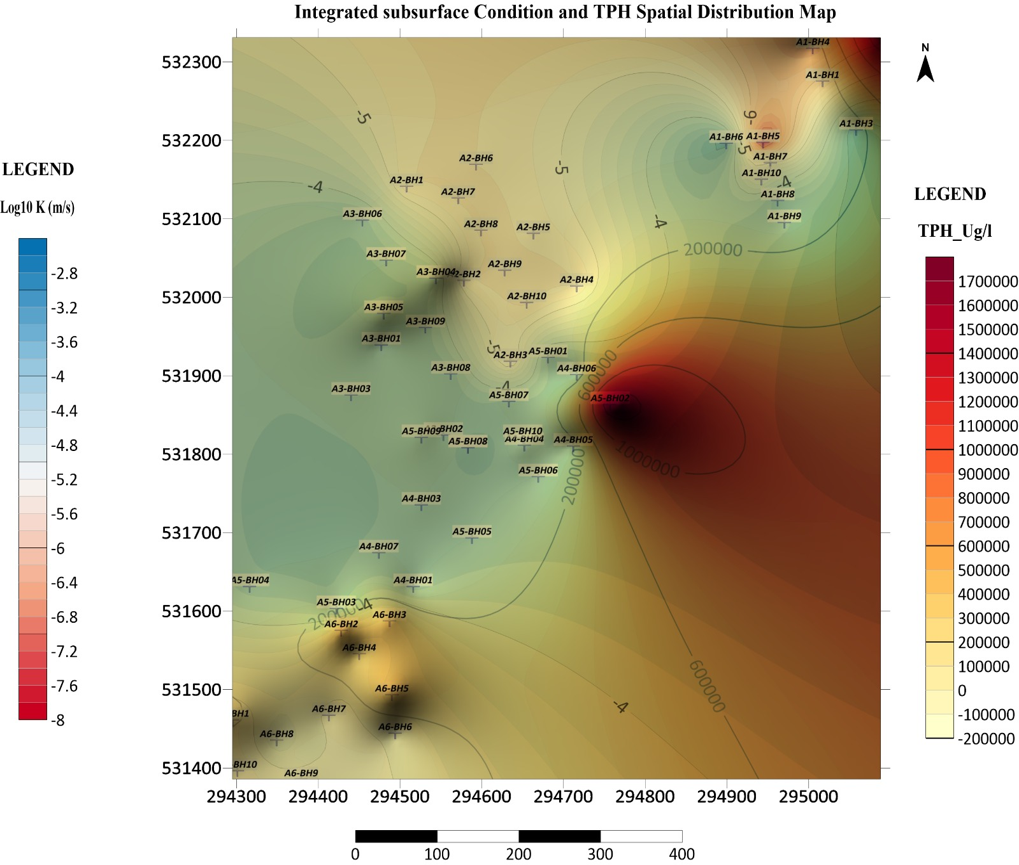
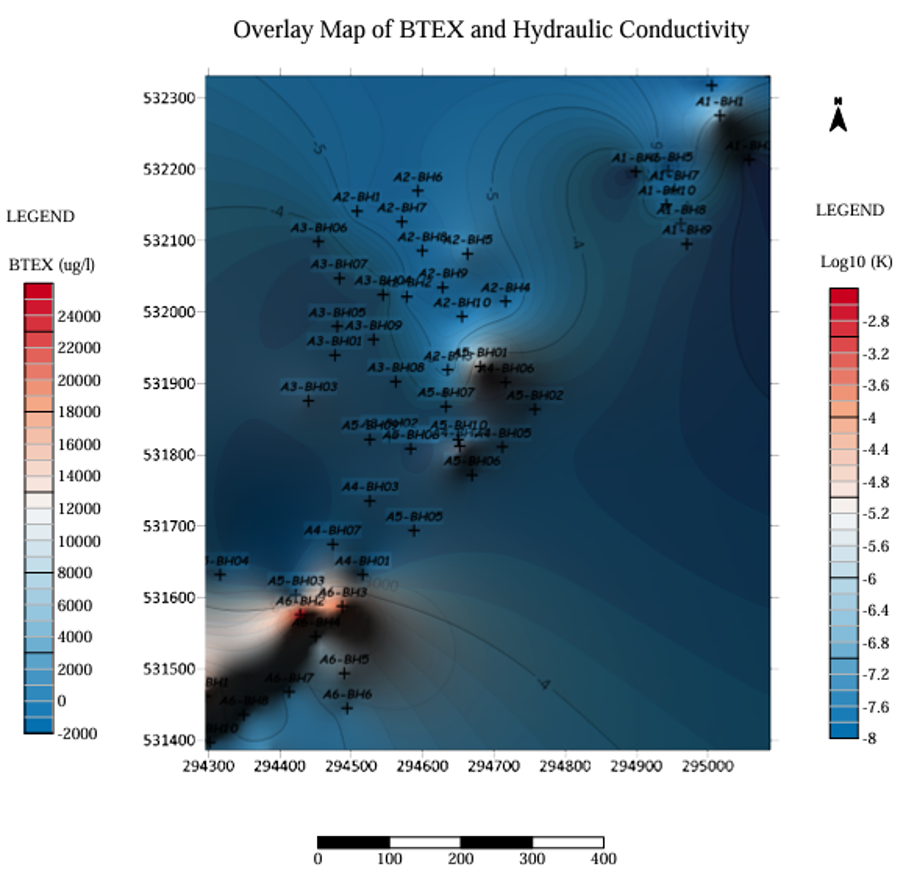
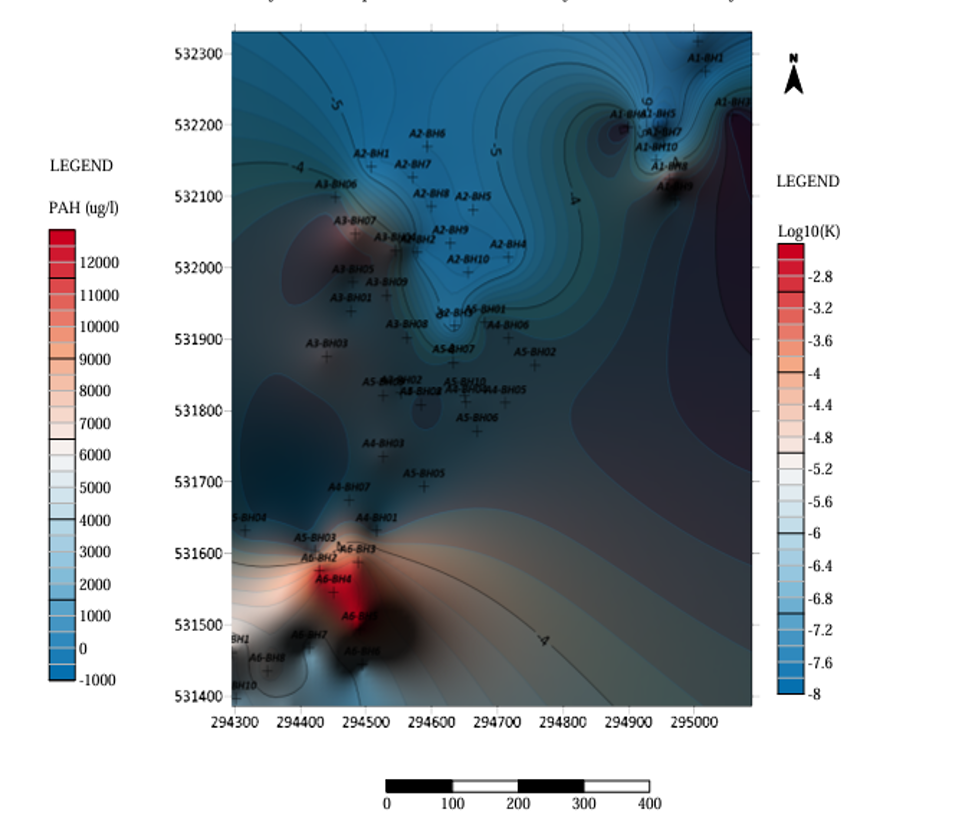
The spatial distributions of TPH, PAHs and BTEX are mapped in Figures 1–3.
4.3Statistics of hydraulic head and hydraulic conductivity
TPH concentrations exhibited substantial variability, with a mean of 108,024.36 µg/L and a maximum of 1,680,625 µg/L. The median (8,255.50 µg/L) was considerably lower than the mean, indicating a strongly right-skewed distribution influenced by high-concentration observations. PAHs and BTEX similarly showed substantial differences between their means and medians, suggesting heterogeneous contaminant distributions across sampling locations.
Hydraulic head ranged from 4.640 to 16.120 m, while hydraulic conductivity varied by several orders of magnitude. The difference between the mean and median hydraulic conductivity indicates that a small number of relatively high values influenced the overall average. These variations may be relevant to interpreting groundwater flow and contaminant migration, although flow direction and transport pathways require spatial hydraulic-head analysis and appropriate hydrogeological interpretation.
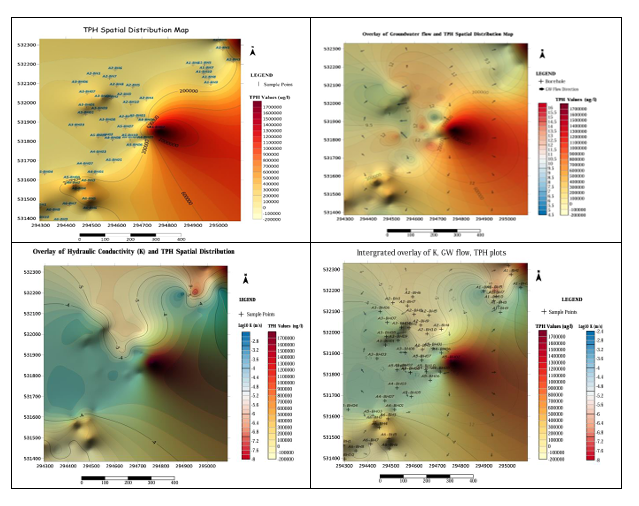
Hydraulic-head distribution and inferred groundwater-flow directions are shown in Figure 4, and the overlays of contaminant concentrations on subsurface conditions and hydraulic conductivity in Figures 5–7.
4.4Statistical associations between hydrocarbon concentrations and hydrogeological parameters
Spearman’s rank correlation analysis (Table 3) showed a statistically significant positive association between TPH and depth to water (ρ = 0.301, p = 0.024). However, TPH was not significantly associated with hydraulic head (ρ = −0.106, p = 0.436), hydraulic conductivity (ρ = 0.016, p = 0.908) or aquifer thickness (ρ = 0.002, p = 0.989). Similarly, none of the hydrogeological parameters was significantly correlated with BTEX or PAH concentrations (p > 0.05). Overall, depth to water was the only parameter showing a statistically significant association with a hydrocarbon group, specifically TPH. This relationship should be interpreted cautiously because correlation does not establish causation or independently demonstrate contaminant transport mechanisms. Moreover, the p-value for the TPH–depth-to-water association was unadjusted for multiple comparisons and should therefore be regarded as exploratory.
| Hydrocarbon Parameter | Hydrogeological Parameter | Spearman’s ρ | p-value | Interpretation |
|---|---|---|---|---|
| TPH | Hydraulic head (m) | −0.106 | 0.436 | Weak negative, not significant |
| TPH | Hydraulic conductivity (m/s) | 0.016 | 0.908 | Negligible positive, not significant |
| TPH | Depth to water (m) | 0.301 | 0.024 | Moderate positive, significant (p < 0.05) |
| TPH | Aquifer thickness (m) | 0.002 | 0.989 | Negligible positive, not significant |
| BTEX | Hydraulic head (m) | −0.049 | 0.719 | Negligible negative, not significant |
| BTEX | Hydraulic conductivity (m/s) | −0.217 | 0.109 | Weak negative, not significant |
| BTEX | Depth to water (m) | 0.152 | 0.265 | Weak positive, not significant |
| BTEX | Aquifer thickness (m) | 0.170 | 0.211 | Weak positive, not significant |
| PAHs | Hydraulic head (m) | −0.003 | 0.985 | Negligible negative, not significant |
| PAHs | Hydraulic conductivity (m/s) | −0.032 | 0.813 | Negligible negative, not significant |
| PAHs | Depth to water (m) | −0.027 | 0.846 | Negligible negative, not significant |
| PAHs | Aquifer thickness (m) | 0.100 | 0.462 | Weak positive, not significant |
An integrated spatial comparison of hydrocarbon hotspots and hydrogeological conditions is presented in Figure 8.
5Discussion
5.1Spatial variability of groundwater hydrocarbon contamination
The substantial variability in total petroleum hydrocarbons (TPH), polycyclic aromatic hydrocarbons (PAHs), and benzene, toluene, ethylbenzene, and xylenes (BTEX) indicates a heterogeneous distribution of hydrocarbon contamination across the sampled locations in Ogale. The considerable differences between the means and medians suggest that a small number of high-concentration observations influenced the overall distributions. This pattern highlights the importance of spatial mapping and robust descriptive statistics for identifying potential contamination hotspots. Similar studies in the Niger Delta have demonstrated the value of integrating geochemical measurements with spatial and geophysical investigations to delineate hydrocarbon-affected areas (Ogolo et al., 2026; Lubi & Akinluyi, 2022).
The maximum recorded TPH concentration of 1,680,625 µg/L represents a particularly elevated observation within the dataset. Its environmental significance, however, should be assessed against verified analytical results, applicable groundwater-quality criteria, and the intended use of the affected water. Because TPH represents a mixture of compounds with different chemical and toxicological properties, its concentration alone cannot establish the toxicity or health risk associated with individual hydrocarbons. Consequently, the observed concentrations should be interpreted alongside compound-specific data and relevant regulatory benchmarks.
The spatial behaviour of PAHs and BTEX may also differ from that of TPH because of variations in molecular properties, solubility, volatility, sorption, and biodegradation. These differences can influence contaminant persistence and mobility within groundwater systems. Aleku et al. (2024), for example, investigated residential benzene exposure and groundwater natural attenuation in the eastern Niger Delta, illustrating the importance of evaluating specific petroleum-related compounds rather than relying solely on aggregate hydrocarbon measurements. Accordingly, the three contaminant groups should be interpreted separately when identifying potential hotspots and designing groundwater-monitoring programmes.
5.2Hydrogeological conditions and contaminant distribution
The observed hydraulic-head range indicates spatial variation in groundwater potential across the study area. Hydraulic-head mapping can help establish groundwater-flow direction when water-level measurements are referenced to a common elevation datum and interpreted in relation to the hydraulic-head gradient. However, contaminant concentrations alone cannot determine flow direction, and a mapped concentration hotspot does not necessarily represent the origin or direction of plume migration.
Hydraulic conductivity also varied substantially across the sampled locations, indicating differences in the reported capacity of subsurface materials to transmit groundwater. Its influence on contaminant movement depends on the hydraulic gradient, geological continuity, aquifer geometry, and the physical and chemical properties of the contaminants. Higher hydraulic conductivity may facilitate groundwater movement under a given gradient, but it does not necessarily result in higher contaminant concentrations at a particular location. Conversely, lower-permeability materials may retard groundwater movement and influence contaminant retention and persistence.
The correlation analysis did not establish statistically significant associations between hydraulic conductivity and TPH, PAHs, or BTEX. This finding indicates that a simple monotonic relationship between conductivity and the measured contaminant concentrations was not demonstrated in the sampled dataset. It does not, however, establish that hydraulic conductivity does not influence contaminant transport. Such effects may depend on interactions among groundwater gradients, lithological variations, contaminant properties, and other factors not captured by the bivariate analysis.
These findings support the integration of hydrochemical, hydrogeological, and geospatial evidence when investigating groundwater contamination. Previous research in Ogale has similarly combined geophysical and geochemical information to characterize hydrocarbon-affected subsurface conditions (Ogolo et al., 2026). Nevertheless, delineating contaminant migration pathways in the present study requires that interpretations from concentration maps be corroborated by reliable groundwater-flow data and adequate geological information.
5.3Depth to water and TPH concentration
Spearman’s rank correlation analysis revealed a modest positive association between TPH concentration and depth to water (ρ = 0.301, p = 0.024). This result indicates that locations with greater measured depths to groundwater tended to have higher TPH concentrations in the sampled dataset. However, the correlation does not establish that increasing depth to water causes higher TPH concentrations or that the observed pattern reflects a particular contaminant migration mechanism.
Possible explanations include differences in contamination-source locations, unsaturated-zone thickness, subsurface geological conditions, and the spatial distribution of hydrocarbon releases. These explanations remain hypotheses because the correlation analysis did not directly test the underlying processes. Further interpretation would require additional information on contaminant-source locations, lithology, groundwater gradients, and the vertical distribution of hydrocarbons.
The statistical significance of this relationship also requires qualification. Twelve correlations were examined across the three hydrocarbon groups and four hydrogeological parameters. Because the reported p-value of 0.024 is unadjusted for multiple comparisons, the association may not remain statistically significant after an appropriate correction. It should therefore be treated as exploratory unless supported by a prespecified hypothesis or further analysis. Additional sampling and multivariable analysis would help determine whether depth to water provides an independent contribution to explaining TPH variability.
5.4Implications for groundwater management
The observed spatial variability supports a targeted approach to groundwater monitoring in Ogale. Monitoring priorities should include locations with elevated measured concentrations, nearby groundwater abstraction points, and areas where plausible contamination sources, subsurface pathways, and potential receptors coincide. Such prioritisation is consistent with the source–pathway–receptor (SPR) framework, which evaluates contamination risk through the interaction of pollutant sources, migration pathways, and exposed receptors (Oyebamiji et al., 2024).
The integration of hydrocarbon measurements with hydraulic-head, hydraulic-conductivity, and spatial data provides a useful basis for identifying areas requiring further investigation. However, concentration maps alone are insufficient to confirm plume boundaries or establish migration pathways. Such conclusions require adequate sampling density, verified analytical results, reliable groundwater-level measurements, geological characterization, and, where feasible, repeated monitoring to assess temporal changes.
Where groundwater is used for drinking or domestic purposes, measured concentrations should be compared with applicable water-quality standards, with particular attention to compounds of toxicological concern, including benzene and relevant PAHs. Exposure assessment should also consider actual groundwater-use patterns and the potential for human contact. At the broader management level, the challenges associated with petroleum-contaminated sites in Nigeria underscore the importance of coordinated monitoring, evidence-based risk assessment, and appropriate remediation planning (Sam et al., 2017).
Overall, the findings provide a spatial and hydrogeological basis for prioritising further investigation of groundwater hydrocarbon contamination in Ogale. Although the observed TPH–depth-to-water association warrants additional examination, the available correlations do not independently establish the hydrogeological controls or causal mechanisms governing contaminant migration. Future investigations should combine denser spatial sampling, detailed subsurface characterization, and temporal groundwater monitoring to strengthen contaminant delineation and support defensible management decisions.
5.5Study limitations
The study provides a spatially referenced assessment based on 56 groundwater samples, but several limitations affect interpretation. First, the observational design and available measurements do not establish causal relationships between hydrogeological parameters and contamination. Second, the strongly skewed concentration distributions and potential influence of extreme values complicate summary comparisons. Third, the reported correlation analysis does not account for all possible interactions among groundwater flow, geology, and contaminant properties. Fourth, conclusions from interpolated surfaces depend on sampling density, spatial distribution, and interpolation performance. Finally, the reported TPH–depth-to-water association requires cautious interpretation in view of the multiple correlations examined.
Future studies should incorporate repeated sampling, verified contaminant-source information, detailed lithological and aquifer data, improved spatial validation, and, where feasible, groundwater-flow and contaminant-transport modelling.
6Conclusion
This study assessed the spatial distribution of TPH, PAHs, and BTEX in groundwater in Ogale and examined their relationships with selected hydrogeological parameters. The 56 samples exhibited substantial concentration variability, with TPH recording a maximum of 1,680,625 µg/L. Hydraulic head ranged from 4.640 to 16.120 m, while hydraulic conductivity varied from 1.220 × 10⁻⁸ to 2.610 × 10⁻³ m/s.
Spearman’s correlation analysis identified a modest positive association between TPH concentration and depth to water. No statistically significant associations were found between the other contaminant–parameter combinations examined. These findings indicate that the observed contamination patterns cannot be explained by any single hydrogeological parameter based on the available analysis.
The study demonstrates the value of combining groundwater chemical analysis, hydrogeological characterisation, and spatial mapping to identify areas requiring further investigation. It recommends targeted groundwater monitoring, verification of contamination hotspots, assessment of potential source–pathway–receptor linkages, and remediation planning based on measured evidence. Further sampling and hydrogeological investigation are necessary to confirm contaminant pathways and establish the processes controlling the observed distributions.
References
- [1]Abam T (2025). Spatial and vertical distribution of hydrocarbon contamination in coastal plain sands of the Niger Delta, Nigeria. International Journal of Latest Technology in Engineering, Management & Applied Science. https://doi.org/10.51583/ijltemas.2025.1408000164
- [2]Adeniran M, Oladunjoye M, Doro K (2023). Soil and groundwater contamination by crude oil spillage: A review and implications for remediation projects in Nigeria. Frontiers in Environmental Science, 11, 1137496. https://doi.org/10.3389/fenvs.2023.1137496
- [3]Aleku DL, Biester H, Pichler T (2024). Pipeline-related residential benzene exposure and groundwater natural attenuation capacity in the Eastern Niger Delta, Nigeria. Environments, 11(10), 221. https://doi.org/10.3390/environments11100221
- [4]Bear J (1972). Dynamics of fluids in porous media. New York: Elsevier.
- [5]Freeze RA, Cherry JA (1979). Groundwater. Englewood Cliffs (NJ): Prentice-Hall.
- [6]Ite AE, Harry TA, Obadimu C, Asuaiko ER, Inim IJ (2018). Petroleum hydrocarbons contamination of surface water and groundwater in the Niger Delta region of Nigeria. Journal of Environment Pollution and Human Health, 6(2), 51–61. https://doi.org/10.12691/jephh-6-2-2
- [7]Lubi SP, Akinluyi F (2022). Groundwater hydrocarbon contamination spatial pattern in Opuama, Western Niger-Delta, Nigeria. Environmental Earth Sciences, 81. https://doi.org/10.1007/s12665-022-10250-x
- [8]Ogolo BT, Abam T, Nimame P (2026). Integrated geophysical and geochemical characterization of hydrocarbon contamination at the Ajeokpori artisanal refinery site, Ogale, Niger Delta, Nigeria. Iconic Research and Engineering Journals, 10(2). https://doi.org/10.64388/irev10i2-1722449
- [9]Ola I, Drebenstedt C, Burgess RM, Mensah M, Hoth N, Okoroafor P, Külls C (2024). Assessing petroleum contamination in parts of the Niger Delta based on a sub-catchment delineated field assessment. Environmental Monitoring and Assessment, 196. https://doi.org/10.1007/s10661-024-12743-7
- [10]Ovuru C, Udom GJ (2018). Geo-electric characterization of recent hydrocarbon contaminated soil and groundwater in parts of Ogale community, Eleme Local Government Area of Rivers State, Nigeria. International Journal of Research, 5, 505–514.
- [11]Oyebamiji A, Hoque MA, Whitworth M (2024). Regional assessment of groundwater contamination risk from crude oil spillages in the Niger Delta: A novel application of the source-pathway-receptor model. Earth Systems and Environment, 9, 117–133. https://doi.org/10.1007/s41748-024-00416-x
- [12]Sam K, Coulon F, Prpich G (2017). Management of petroleum hydrocarbon contaminated sites in Nigeria: Current challenges and future direction. Land Use Policy, 64, 133–144. https://doi.org/10.1016/j.landusepol.2017.01.051
- [13]Umar HA, Khanan M, Shiru MS, Ahmad A, Rahman MZ, Din AHM (2023). An integrated investigation of hydrocarbon pollution in Ahoada area, Niger Delta Region, Nigeria. Environmental Science and Pollution Research, 30, 116848–116859. https://doi.org/10.1007/s11356-023-25144-z