Solar Capacity Expansion, Need for Recycling
Solar Deployment, Land Requirements and End-of-Life PV Management in India: A Benchmarked Scenario Analysis for FY 2026–27 to FY 2039–40
Indian Institute of Technology Bombay, Mumbai, Maharashtra, India
Published November 2026
Abstract
This paper examines how a high-deployment solar pathway could affect annual electricity supply, land occupation and planning for photovoltaic (PV) end-of-life management in India. The analysis combines official benchmarks with transparent scenario assumptions. India had 171.05 GW of installed solar capacity at 30 September 2026 (MNRE); the Central Electricity Authority (CEA) 2029–30 optimal mix study identifies approximately 292.6 GW of solar PV capacity and reports a 20th Electric Power Survey energy requirement of 2,279.7 TWh for that year. Extending capacity to 629 GW by FY 2039–40 is treated here as an illustrative scenario, not a government target. At a 21% capacity utilisation factor (CUF), this pathway yields about 1,157 TWh per year, or 31.2% of a separately assumed 5% annual demand-growth pathway from the CEA 2029–30 benchmark. A land-intensity assumption of 1.62 ha/MW for the non-rooftop share implies approximately 1.02 million ha of cumulative project footprint by FY 2039–40; this is a scenario estimate, not a parcel-level land-suitability assessment. Published India-specific modelling estimates cumulative PV waste by 2040 at 6.64 Mt under an early-loss business-as-usual case and 5.48 Mt under a regular-loss case. These are alternative model outputs and do not support a claim that 6 Mt/year of recycling capacity is required. A screening-level 50,000 t/year plant model produces a 6.5% base-case IRR and an NPV of about −₹41 crore at a 12% discount rate under flat annual EBITDA assumptions. Results indicate that the original draft’s detailed annual waste series and recycling-capacity gap claims are not reproducible from its cited sources. The paper provides a transparent framework and identifies the additional cohort, land and facility data needed for investment-grade estimates.
Keywords: solar photovoltaics; India; land occupation; electricity demand; PV waste; recycling; scenario analysis; project finance
1Introduction
India’s solar expansion links power-system planning to land allocation and future management of discarded modules. These questions are often discussed together, yet the evidence base differs: installed-capacity statistics are observed data; 2030 capacity and demand values are planning projections; 2040 capacity and demand are scenarios; and PV waste is a modelled future flow. Treating these categories as interchangeable can produce false precision.
This study revises an earlier analytical report by checking its headline figures against primary and peer-reviewed sources, reconciling units and time bases, and recalculating quantities that follow directly from stated assumptions. It asks three questions: (1) what annual solar generation and land footprint follow from a clearly defined capacity scenario; (2) what can be inferred, and what cannot, from published India PV-waste forecasts; and (3) how sensitive is a representative recycling plant’s screening-level return to its stated assumptions?
The contribution is methodological rather than a new national forecast. The paper separates observed benchmarks from scenario outputs, documents the equations and exclusions, and flags unsupported claims so that future work can replace assumptions with spatial, cohort and facility-level data.
2Data and methods
2.1Evidence hierarchy and validation
Primary administrative and planning sources were used for installed capacity and electricity-system benchmarks. Peer-reviewed India-specific modelling was used for the 2040 PV-waste reference. Values were checked for unit, date, scenario, and internal arithmetic consistency. Any value not directly reported by a source is labelled as a calculation or assumption. The reported MNRE capacity is measured as of 30 September 2026; CEA planning values refer to financial years, and are not presented as calendar-year observations.
| Claim or input | Source check | Treatment in this paper |
|---|---|---|
| Solar capacity in 2026: 150 GW | MNRE reports 171.05 GW installed by 30 Sep 2026 [1]. | Replace with dated observed benchmark; do not use 150 GW as a 2026 fact. |
| 2030 solar: about 292 GW | CEA Version 2.0 optimal-mix study gives about 292.6 GW [2]. | Retain as a planning benchmark, with FY and source version stated. |
| 2030 demand: 2,400 TWh | 2,400 BU belonged to the earlier 19th EPS basis; Version 2.0 uses 20th EPS demand of 2,279.7 BU [2,3]. | Use 2,279.7 TWh as the cited FY 2029–30 benchmark. |
| 2040 solar capacity: 629 GW | No cited source establishes this as an adopted target. | Retain only as an illustrative extension scenario. |
| PV waste table totals 6.64 Mt by 2040 | The source table rows sum to 5.68 Mt; Sharma et al. report 6.64 Mt for an early-loss BAU case and 5.48 Mt for a regular-loss BAU case [4]. | Remove the unsupported annual series; cite the published cumulative scenario estimates. |
| Recycling capacity is short of waste in several years | In the source table, capacity is greater than annual waste in all listed years; in 2040 the displayed surplus is 5.58 Mt/year. | Withdraw the annual capacity-shortage claim and the 6 Mt/year “required” conclusion. |
| Plant base-case returns | Reported IRR, NPV and ROI do not all reconcile with a flat 15-year EBITDA cash-flow model. | Recalculate under an explicit constant-cash-flow screening model; report exclusions. |
2.2Solar generation and demand pathway
Annual solar generation is calculated as Gt = Ct × 8,760 × CUF / 1,000, where C is installed capacity in GW and G is TWh/year. A constant CUF of 21% is an illustrative system-wide assumption; it does not account for technology mix, degradation, curtailment, outages or transmission limits. The solar share is Gt / Dt, where D is annual electricity requirement. It is an annual energy ratio, not a measure of hourly adequacy or capacity credit.
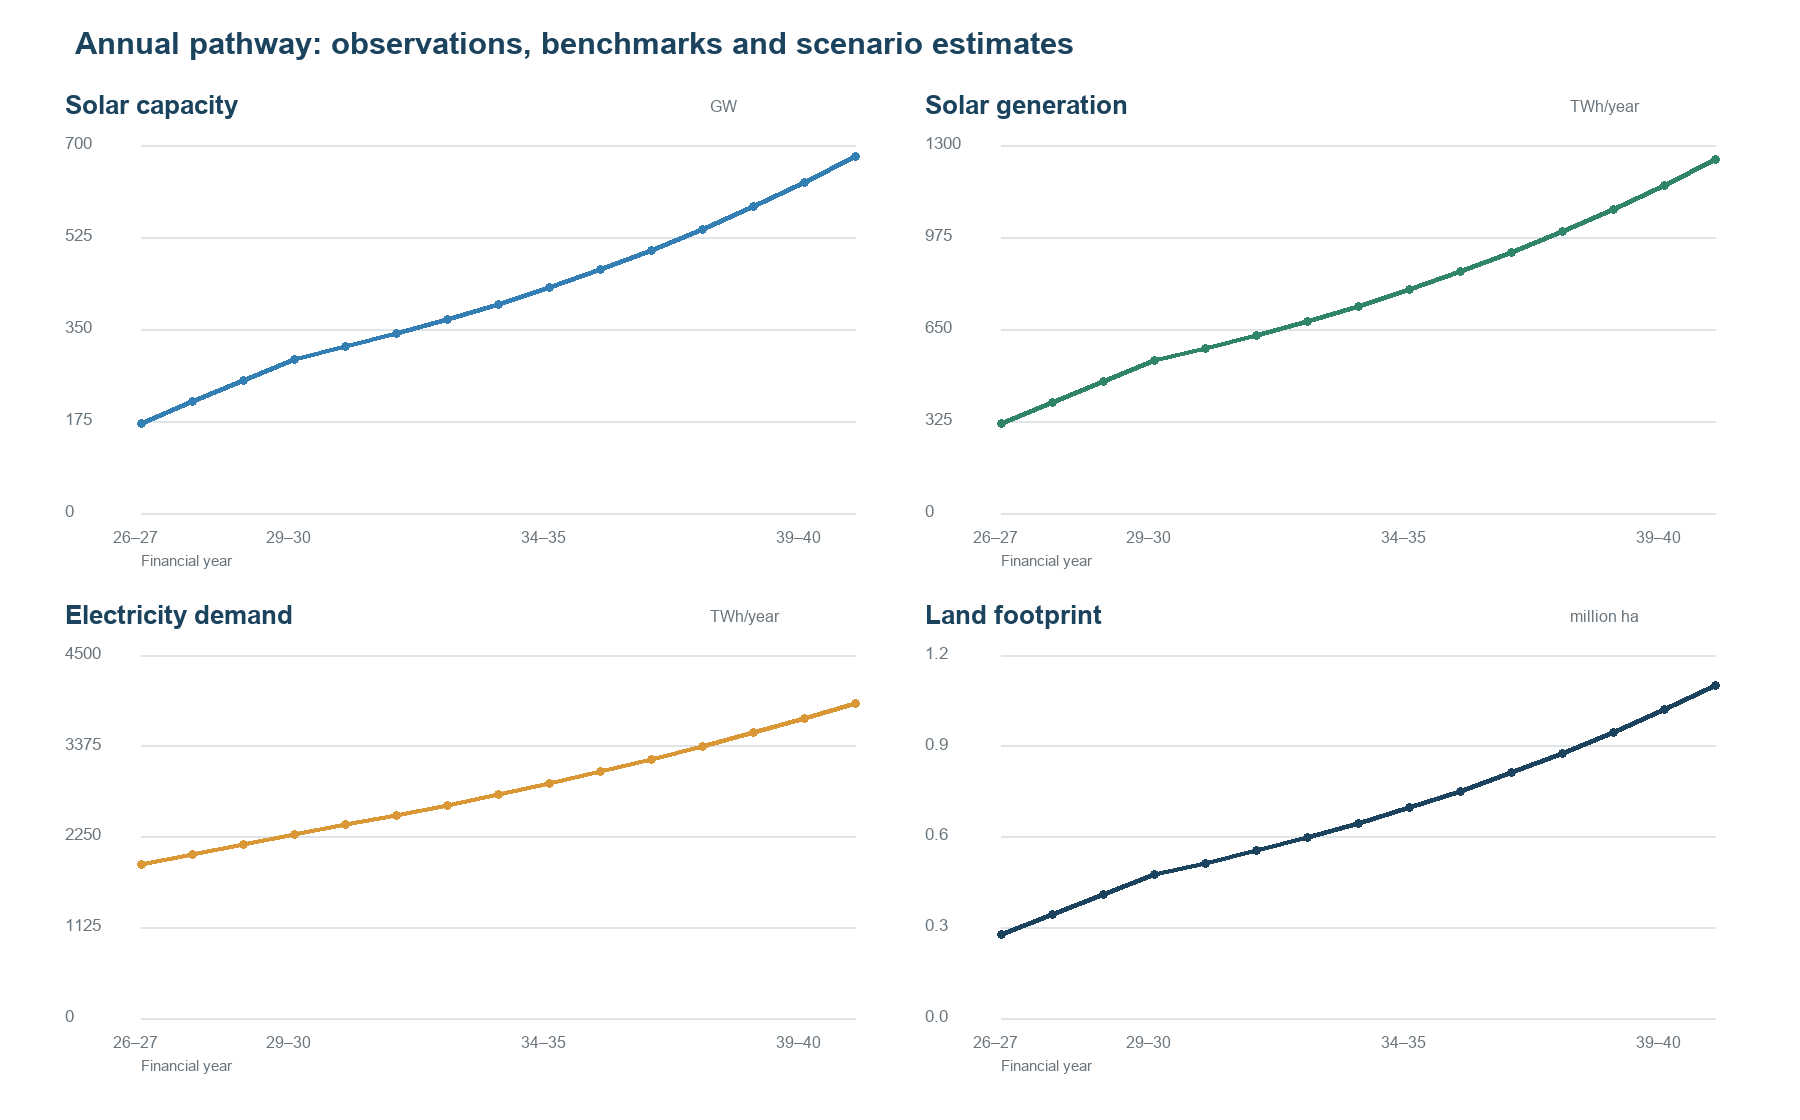
The observed 171.05 GW endpoint (30 September 2026) is reported separately from the FY 2029–30 CEA planning benchmark of 292.6 GW. Annual capacity values between these endpoints are linearly interpolated for display. The intervening demand values are also linearly interpolated. For the later horizon, capacity grows geometrically from 292.6 GW in FY 2029–30 to 629 GW in FY 2039–40; this implies a 7.95% compound annual growth rate over ten years. Demand uses the CEA Version 2.0 FY 2029–30 benchmark of 2,279.7 TWh and grows at an assumed 5% annually thereafter. The 2026–27 demand benchmark of 1,907.8 TWh is from CEA planning material [3]; intervening values are illustrative interpolation, not a revised CEA forecast.
2.3Land footprint calculation
Cumulative land occupation is estimated using an assumed deployment allocation of 60% ground-mounted PV at 2.2 ha/MW, 25% rooftop PV at zero additional ground footprint, and 15% floating PV or agrivoltaics at 2.0 ha/MW. The weighted coefficient is therefore 0.60×2.2 + 0.25×0 + 0.15×2.0 = 1.62 ha/MW. The national estimate is Lt = Ct × 1,000 × 1.62, in hectares. This is a gross area-intensity calculation; it is not a land-cover map or an estimate of land that is technically, ecologically or socially available. Rooftop has zero incremental land occupation in the equation, but still uses built structures and may have other siting constraints.
2.4PV waste evidence and recycling capacity
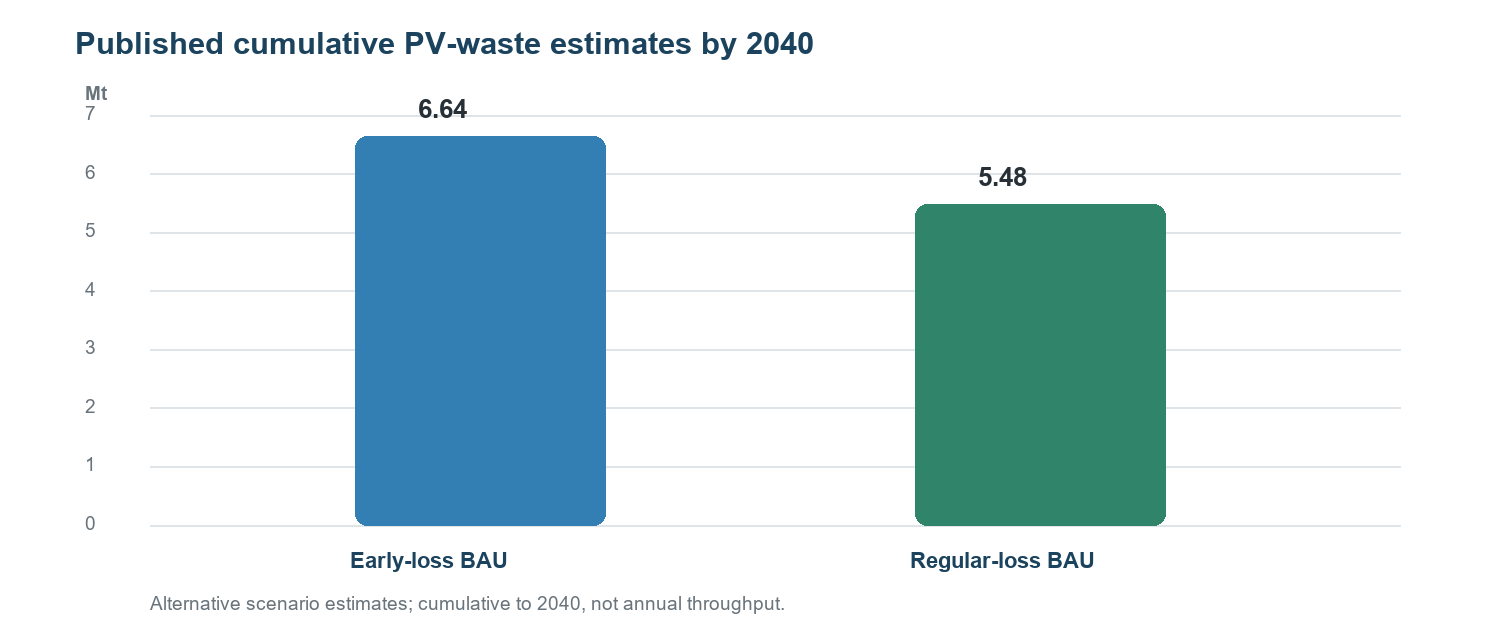
The waste analysis does not generate a new annual national forecast because the cited source draft does not disclose the installation-cohort data, module mass trajectory, loss rates or annual outputs needed to reproduce its table. Instead, we report the published cumulative 2040 business-as-usual estimates from Sharma et al. [4]: 6.64 Mt under an early-loss scenario and 5.48 Mt under a regular-loss scenario. These are distinct modelled cases, not observed waste and not values to be added together. A cumulative mass through 2040 cannot be interpreted as the annual throughput requirement in 2040. Annual recycling capacity must be sized against annual collected flows, inventory accumulation, collection efficiency, recycler yield and plant utilization.
India’s E-Waste (Management) Rules, 2022 explicitly cover solar PV modules, panels and cells. The rules require producers to maintain inventory and store generated PV waste through 2034–35 under CPCB guidance; the government’s summary also states that PV recyclers are subject to material-recovery requirements [5]. This regulatory pathway supports traceability and safe handling, but does not itself validate a particular national annual capacity target.
2.5Financial screening model
A representative plant is modelled at 50,000 t/year nameplate capacity over 15 years, with three utilization, revenue, operating-cost and capital-cost cases. Annual processed mass equals nameplate capacity multiplied by utilization; revenue and operating cost equal processed mass multiplied by the respective per-tonne assumptions. EBITDA is treated as a constant annual cash-flow proxy. NPV is calculated as −I0 + Σt=115 EBITDA/(1+r)t, using r = 12%; IRR is the rate at which this NPV equals zero. Simple payback is I0/EBITDA. Undiscounted project ROI is (15×EBITDA − I0)/I0. This deliberately simplified model is not a bankable valuation: it excludes taxes, financing, working capital, ramp-up, price escalation, residual value, decommissioning and plant replacement.
3Results
3.1Solar generation, demand and land scenario
Table 2 reports the observed or planning anchors and the derived extension scenario. At the stated 21% CUF, the FY 2039–40 capacity of 629 GW yields approximately 1,157 TWh/year. Against the assumed 3,713 TWh demand pathway, the annual energy share is 31.2%. This ratio should not be interpreted as solar meeting 31.2% of demand in every hour. At the same land-intensity assumption, gross cumulative footprint is about 1.02 million ha, or 10,190 km2. The estimate scales linearly with the land coefficient and capacity; no geographic suitability or competing-use exclusions are applied. Figure 1 visualizes the annual pathway between these milestone years.
| Metric | FY 2026–27 | FY 2029–30 | FY 2034–35 | FY 2039–40 |
|---|---|---|---|---|
| Solar capacity (GW) | 171.05 observed1 | 292.6 CEA benchmark | 429.0 scenario | 629.0 scenario |
| Demand (TWh/year) | 1,907.8 CEA benchmark2 | 2,279.7 CEA benchmark | 2,909.5 scenario | 3,713.4 scenario |
| Solar generation (TWh/year) | 314.0 calculated | 538.3 calculated | 789.2 calculated | 1,157.1 calculated |
| Solar share of demand (%) | 16.5 calculated | 23.6 calculated | 27.1 calculated | 31.2 calculated |
| Cumulative land footprint (million ha) | 0.277 calculated | 0.474 calculated | 0.695 calculated | 1.019 calculated |
3.2End-of-life PV waste and capacity implications
The two cited BAU waste estimates place cumulative Indian PV waste by 2040 in the approximate 5.5–6.6 Mt range, depending on loss assumptions [4]. They do not provide evidence for the source draft’s annual profile peaking at 0.74 Mt/year in 2036–37, nor for a national recycler fleet of 6 Mt/year by 2040. Indeed, that annual capacity figure would be close to the entire cited cumulative waste mass through 2040, before accounting for collection delays, regional logistics or plant utilization. A defensible capacity trajectory requires annual module retirement and early-failure cohorts, mass per module by vintage, collection rates, reuse/refurbishment shares, processing yields, inventory stocks and facility commissioning schedules.
The policy implication is to build the measurement system and modular regional capacity in step with verified feedstock, while meeting applicable storage, registration and material-recovery requirements. Capacity targets should be expressed as nameplate throughput and expected utilized throughput separately, and should be revised when registry and collection data become available.
3.3Recycling-plant economics
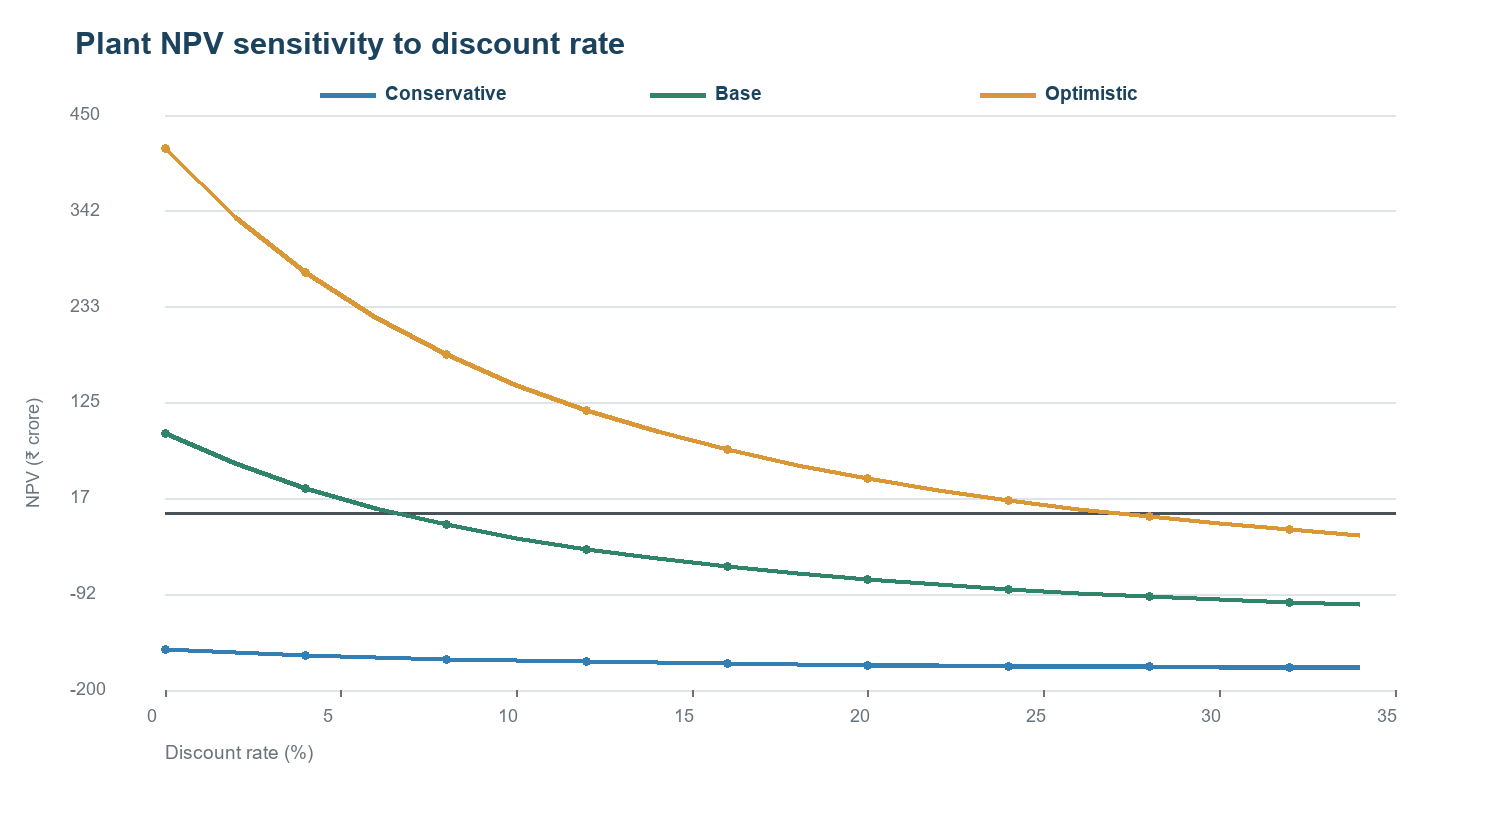
Table 3 recalculates the representative plant economics under the stated assumptions. In the base case, 40,000 tonnes are processed annually, generating ₹60 crore revenue and ₹44 crore operating costs, or ₹16 crore annual EBITDA. The resulting simple payback is 9.4 years, but the 12% NPV is negative at about ₹41 crore and the IRR is 6.5%. The optimistic case clears the 12% hurdle under these assumptions; the conservative case does not recover capital over 15 years. These results are highly sensitive to contracted feedstock, realized recovered-material value and operating cost, none of which is established by the source draft through quotes, assays or contracts. Figure 3 shows the corresponding NPV sensitivity to the discount rate.
| Assumption or result | Conservative | Base | Optimistic |
|---|---|---|---|
| Utilization | 70% | 80% | 85% |
| Throughput (t/year) | 35,000 | 40,000 | 42,500 |
| Revenue (₹/t processed) | 10,000 | 15,000 | 20,000 |
| Operating cost (₹/t processed) | 9,500 | 11,000 | 11,500 |
| Annual revenue (₹ crore) | 35.00 | 60.00 | 85.00 |
| Annual operating cost (₹ crore) | 33.25 | 44.00 | 48.88 |
| Annual EBITDA proxy (₹ crore) | 1.75 | 16.00 | 36.13 |
| Initial capital (₹ crore) | 180 | 150 | 130 |
| IRR | −18.0% | 6.5% | 27.0% |
| NPV at 12% (₹ crore) | −168.1 | −41.0 | +116.0 |
| Undiscounted ROI over 15 years | −85.4% | 60.0% | 316.8% |
| Simple payback | 102.9 years | 9.4 years | 3.6 years |
Values are recalculated from a level annual EBITDA proxy and rounded. Negative IRR in the conservative case is mathematically defined for the stated cash-flow sequence, but the undiscounted cash recovered over 15 years is far below initial capital; the payback is therefore not commercially meaningful within the project life.
4Discussion
The data audit changes the interpretation of the original results. First, a “2026 capacity” of 150 GW is not consistent with the MNRE’s September 2026 installed figure; it may be a rounded earlier baseline, but it should not be described as a current observation. Second, the 2,400 TWh demand value cited in the draft reflects an older planning basis. The CEA’s updated Version 2.0 report uses the 20th EPS benchmark of 2,279.7 TWh for FY 2029–30 [2, 3]. Third, the waste table’s cumulative total conflicts with the paper’s own cited cumulative forecast, and the capacity-balance column contradicts the narrative. These are not cosmetic issues: they affect claimed land totals, waste capacity needs and policy conclusions.
The revised scenario remains useful as a transparent “what-if” calculation. It shows how capacity, annual energy and land footprint change under stated assumptions. It does not establish that 629 GW is optimal, that 21% CUF will persist across a changing fleet, or that a national land area is available. Demand growth at 5% after 2030 is a stress assumption selected for illustration, not a forecast. Similarly, a 1.62 ha/MW coefficient aggregates distinct project types and should be replaced by technology- and state-specific ranges.
For waste planning, the more important research gap is not a single national capacity figure but the annual, spatially resolved flow of modules reaching end of life. A cohort model can be built as Wt = Σy Cy × my × ft−y, where Cy is capacity installed in vintage y, my is tonnes per MW for that vintage, and f is the probability of failure or retirement at age t−y. Early-loss and lifetime distributions should be modelled separately, with uncertainty ranges and collection and reuse fractions added downstream. The necessary vintage-level inputs and parameterization are not supplied in the draft, so this paper does not invent an annual series.
Finally, plant viability cannot be inferred from recovered-material revenue alone. Facility-level evaluation needs mass-balance assays by module type, recovery yields, contamination and residue treatment, inbound transport radius, feedstock contract terms, product specifications and offtake prices. The screening IRR here is a transparent arithmetic check; it should not be used as an investment recommendation.
5Limitations and data needs
This analysis is limited by aggregated national benchmarks, simplified linear/geometric interpolation and fixed parameters. It does not model hourly dispatch, storage, grid constraints, degradation, module technology turnover, state-level land patterns, biodiversity or agricultural opportunity costs. The PV waste figures are secondary estimates from one peer-reviewed study and are not independently reproduced here. The plant model uses constant EBITDA as a proxy for cash flow and omits taxes, financing and major lifecycle costs. No primary plant quotations, recycler data or site-specific land records were available.
Before journal submission, the authors should identify all contributors and affiliations, choose a target journal, attach a reproducible calculation workbook or code, and replace the illustrative assumptions with documented sensitivities. A publishable empirical follow-up should include: (i) dated CEA/MNRE source files and extraction notes; (ii) a complete annual capacity and demand series with formulas; (iii) a PV installation-cohort and module-mass dataset with uncertainty bounds; (iv) geospatial land coefficients and exclusions; and (v) audited facility cost, revenue, recovery-yield and feedstock data. Journal-specific formatting and declarations must be added once the destination journal is known.
6Conclusions
A source-checked scenario suggests that extending India’s solar fleet from the CEA’s FY 2029–30 benchmark of 292.6 GW to 629 GW by FY 2039–40 could produce roughly 1,157 TWh/year at a 21% CUF. Under a 5% post-2030 demand-growth assumption, this equals about 31% of annual energy requirement. Applying an explicitly assumed 1.62 ha/MW footprint yields about 1.02 million ha of gross cumulative project area. These are scenario calculations, not observed outcomes or land-availability findings.
Published India-specific modelling estimates 5.48–6.64 Mt of cumulative PV waste by 2040 across two alternative BAU loss cases. That cumulative total does not justify a 6 Mt/year recycling-capacity requirement. The annual waste curve and facility trajectory require a transparent cohort model and verified collection data. The simplified plant economics likewise show that commercial viability is conditional: the recalculated base case returns a 6.5% IRR and negative NPV at 12%, while the optimistic case is viable only under more favorable assumptions. A credible investment and policy pathway therefore depends on better data, verified feedstock, safe regulated processing and facility-specific costing.
References
- [1]Ministry of New and Renewable Energy (MNRE), Government of India. Year-wise achievements: installed renewable energy capacity, cumulative achievements to 30 September 2026 [Internet]. [cited 2026 Oct 17]. Available from: https://mnre.gov.in/en/year-wise-achievement/
- [2]Central Electricity Authority (CEA), Government of India. Report on Optimal Generation Capacity Mix for 2029–30, Version 2.0. New Delhi: CEA; 2023 [cited 2026 Oct 17]. Available from: https://cea.nic.in/wp-content/uploads/notification/2023/05/Optimal_mix_report__2029_30_Version_2.0__For_Uploading.pdf
- [3]Central Electricity Authority (CEA), Government of India. Report on 20th Electric Power Survey of India, Volume I. New Delhi: CEA; 2022 [cited 2026 Oct 17]. Available from: https://cea.nic.in/ps___lf/report-on-twentieth-electric-power-survey-of-india-volume-i/?lang=en
- [4]Sharma A, Mahajan P, Garg R. End-of-life solar photovoltaic panel waste management in India: forecasting and environmental impact assessment. International Journal of Environmental Science and Technology. 2024;21(2):1961–1980. https://doi.org/10.1007/s13762-023-04953-2
- [5]Ministry of Environment, Forest and Climate Change, Government of India. E-Waste (Management) Rules, 2022. G.S.R. 801(E); 2022 Nov 2 [cited 2026 Oct 17]. Available from: https://cpcb.nic.in/uploads/Projects/E-Waste/e-waste_rules_2022.pdf. See also: MNRE. Solar waste treatment under E-Waste (Management) Rules, 2022; 2023 Mar 14. Available from: https://www.pib.gov.in/Pressreleaseshare.aspx?PRID=1906920