Environmental Science
Spatial Analysis of Flood Risk Zones in the Usuma Watershed, Federal Capital Territory, Nigeria
Department of Geography, Nasarawa State University, Keffi, Nigeria
Published November 2026
Abstract
This study examined flood risk zones within the Usuma Watershed in the Federal Capital Territory (FCT), Nigeria, with the aim of identifying spatial patterns of flood vulnerability and informing sustainable flood risk management. The objectives were to map flood-prone areas, analyze flood frequency, and evaluate the biophysical and anthropogenic factors contributing to flood risks. Data were collected through satellite imagery, Shuttle Radar Topography Mission (SRTM) digital elevation data, hydrological datasets, and field observations. The Analytical Hierarchy Process (AHP) and Geographic Information Systems (GIS) were used for data analysis, allowing for the integration of thematic layers including slope, elevation, land use/land cover, rainfall, drainage density, Soil Permeability Index (SPI), and Topographic Wetness Index (TWI). The study reveals that areas of very high to high flood risk accounted for approximately 24.51% and 24.25% of the watershed respectively, predominantly in the central, southern, and eastern portions of the floodplain, including communities such as Gwagwalada, Kuje, and parts of Abuja Municipal Area Council. Flood frequency analysis between 2018 and 2023 showed that the worst flood event occurred in 2022, during which about 70,058 hectares were inundated. Key factors influencing flood risk included low elevation, moderate slopes, high rainfall, sparse vegetation, and dense drainage networks. Based on the findings, the study recommended the enforcement of land use regulations in high-risk areas, the development of sustainable urban drainage systems, regular updates to flood risk maps, and community-based early warning systems. The study concluded that spatial analysis techniques offer critical insights for flood risk reduction, and its approach can serve as a model for other flood-prone regions in Nigeria and across sub-Saharan Africa.
Keywords: flood risk; Usuma watershed; GIS; spatial analysis; FCT
1Introduction
Flooding is increasingly recognized as one of the most pressing environmental and socio-economic challenges facing urban and peri-urban regions across sub-Saharan Africa, and Nigeria is no exception (Adelekan et al., 2015; Nkwunonwo, Whitworth and Baily, 2020; Eze and Efiong, 2023). With the intensification of global climate change and rapid, unregulated urbanization, the incidence, frequency, and severity of flood disasters have escalated in recent years, posing significant threats to human livelihood, infrastructure, food security, and sustainable urban development (IPCC, 2022; Abah et al., 2022).
In many parts of Nigeria, floods have become annual occurrences, resulting in displacement of populations, damage to critical infrastructure, loss of biodiversity, and widespread economic disruption (NEMA, 2022; Olanrewaju et al., 2023). The Federal Capital Territory (FCT)—often presumed to be better planned than other cities in Nigeria, has witnessed a disturbing increase in flood incidents in recent years. This is largely attributed to the rapid physical expansion of the city into naturally sensitive flood-prone areas, including wetlands, river valleys, and low-lying plains (Ajibade et al., 2021; Akinsanola et al., 2023). In particular, the Usuma River floodplain presents a critical example of how urban growth, climate variability, and human mismanagement intersect to heighten disaster risks. Located in the northwestern part of the FCT, the Usuma River and its floodplain drain a substantial portion of the territory, passing through rapidly urbanizing districts such as Bwari, Dutse, and Gwagwalada. The area is characterized by topographical depressions, clayey soil composition with low permeability, and erratic rainfall patterns—factors that collectively increase surface runoff and reduce natural water absorption (Ede et al., 2021).
Furthermore, land-use changes driven by population growth, infrastructure development, and informal housing have led to the encroachment of human settlements into natural flood buffers. Deforestation, inadequate drainage infrastructure, and poor enforcement of environmental regulations further exacerbate flood risks in the area (Adelekan et al., 2020; Mohammed and Abdulrahman, 2023).
Several studies have documented the role of urban sprawl in aggravating flood disasters in Abuja. For instance, Aderoju and Bello (2022) reported that the transformation of vegetated areas to impervious surfaces, such as concrete pavements and buildings, increases stormwater runoff, overwhelming existing drainage systems. Similarly, Jeb and Aggarwal (2008) previously noted that inadequate mapping and monitoring of flood-prone zones in the study area have led to poor preparedness and response measures, leaving residents highly vulnerable to disaster. Recent flood events in the FCT reinforce the critical need for proactive and evidence-based flood risk management strategies. According to the National Emergency Management Agency (NEMA, 2022), between 2015 and 2022, over 10,000 residents of the FCT were displaced by flood incidents, with hundreds of buildings damaged or destroyed and several lives lost. Climate projections by the Nigerian Meteorological Agency (NiMet, 2023) further suggest that the intensity of rainfall events in Abuja is expected to increase in the coming decades, leading to more frequent and severe urban floods if preventive actions are not taken.
In this context, spatial analysis using geospatial technologies such as Geographic Information Systems (GIS) and remote sensing has become an indispensable tool for identifying flood risk zones, monitoring environmental change, and informing decision-making (Nkeki et al., 2022). GIS-based flood risk assessment integrates spatial variables such as elevation, slope, land use/land cover, drainage density, soil type, and proximity to water bodies to produce flood susceptibility maps that can guide land-use planning, emergency response, and infrastructure design (Ahmed et al., 2021; Egwuonwu et al., 2022; Arowolo and Akinola, 2023). These tools provide spatial intelligence that can help stakeholders prioritize intervention areas and reduce the human and material costs of flooding. Despite the acknowledged relevance of geospatial tools in flood risk management, there remains a significant gap in their application at local levels in Nigeria, particularly in peri-urban floodplains such as that of the Usuma River. The lack of disaggregated spatial data and limited institutional capacity to utilize them continue to hinder effective disaster risk reduction in the country (UNDRR, 2022; Okechukwu and Adebayo, 2024). Moreover, most existing flood maps are either outdated or generalized at the national scale, lacking the granularity needed to inform local planning efforts.
Therefore, this study seeks to address these gaps by undertaking a spatial analysis of flood risk zones in the Usuma watershed using advanced geospatial techniques. The study aims to produce a high-resolution flood susceptibility map based on key biophysical and anthropogenic variables, including digital elevation data, land use classification, proximity analysis, and hydrological features. The outcome is intended to assist urban planners, disaster managers, environmental agencies, and community stakeholders in identifying vulnerable areas, planning mitigation measures, and making data-informed decisions regarding land allocation, development control, and climate adaptation. By focusing on the Usuma watershed in the FCT, this study contributes to the growing body of knowledge on localized flood risk assessment and reinforces the need for spatially explicit, science-based planning approaches to urban resilience and sustainable development in Nigeria.
2Materials and methods
2.1Study area description
The Usuma watershed is situated within the Bwari and Gwagwalada Area Councils of the Federal Capital Territory (FCT), Nigeria, between latitudes 8.95°N and 9.15°N and longitudes 7.32°E and 7.55°E (Federal Ministry of Environment, 2021). The Usuma river originates from the lower slopes of the Bwari Hills and traverses through several densely populated peri-urban communities before discharging into the Gurara River (Abdullahi and Lawal, 2019). The region lies within the tropical savannah climate zone, which is characterized by distinct dry and wet seasons. The dry season typically extends from November to March, while the wet season lasts from April to October. Annual rainfall in the area ranges between 1,200 mm and 1,800 mm, with peak rainfall intensities recorded in the months of July and August (NiMet, 2023).
Topographically, the area consists of gently undulating terrain, with elevation levels ranging from 250 to 800 meters above sea level, influencing drainage patterns and the flow accumulation potential of surface waters (Jeb and Aggarwal, 2008; Eze and Efiong, 2023). Land use within the Usuma floodplain is varied, comprising residential neighborhoods, institutional zones, and agricultural lands. In recent years, the expansion of informal settlements along the floodplain has intensified due to rising urban housing demands and weak development control mechanisms (Aderoju and Bello, 2022; Ede et al., 2021). This unregulated expansion increases flood exposure, especially among low-income populations living in substandard housing structures. Soil characteristics in the region include a mix of loamy and clayey substrates with heterogeneous permeability profiles, which significantly affect surface runoff and infiltration rates during intense rainfall events (Ahmed et al., 2021). Poor drainage infrastructure further compounds these risks, especially in areas with compacted clayey soils and minimal vegetative cover.
2.2Research methodology
The materials and methods adopted for this study involved a comprehensive geospatial analysis integrating multiple hydrological and topographical parameters to assess flood vulnerability within the watershed. To analyze the flow direction, the study utilized digital elevation models (DEMs) to determine the pathways of surface water movement across the terrain. The direction of flow, which was found to be predominantly higher in the southern part of the study area and lower in some northern areas, significantly influenced the spatial distribution of flood risks by identifying zones where water is likely to accumulate due to slope and terrain characteristics. Flow direction data were visualized and interpreted using ArcGIS 10.8. The distance to rivers was another critical parameter incorporated into the flood vulnerability analysis. This was determined using the Euclidean distance tool in ArcGIS 10.8, which calculated the straight-line distance of each cell in the raster to the nearest river channel. It was observed that proximity to rivers increases flood vulnerability due to higher likelihood of overflow and runoff impacts, while vulnerability decreases as the distance from the river increases, reflecting a gradient of risk based on sediment connectivity and flow dynamics.
The Topographic Wetness Index (TWI) was derived from the DEM using a raster calculator to model soil moisture and runoff potential across the watershed. The TWI was calculated using the equation ln(catchment area/tan β), where β represents the slope in degrees. Higher TWI values indicated wetter areas prone to saturation and, thus, more susceptible to flooding, while lower values represented drier, less flood-prone areas. The TWI values in the study area ranged from -1.7 to 6.8, providing detailed insight into zones with varying moisture retention capacities. Similarly, the Stream Power Index (SPI) was computed to quantify the erosive power of flowing water, which directly relates to flood vulnerability due to sediment transport potential. The SPI was also derived using a raster calculator in ArcGIS and computed using the formula: SPI = catchment area × tan β. This helped identify areas at higher risk of erosion and inundation due to increased water flow, with SPI values ranging from -4.5 to 7.4 across the watershed. To determine the relative importance of each criterion used in the flood vulnerability assessment, the Analytical Hierarchy Process (AHP) was employed. A 10 × 10 pairwise comparison matrix was constructed based on expert opinions, existing literature, and field knowledge. Each criterion (elevation, rainfall, drainage density, slope, TWI, SPI, distance to river, flow direction, and land use/land cover (LULC)) was compared and ranked on a scale from 1 to 9. The comparison matrix was then normalized, and the weights of each criterion were calculated. The consistency ratio (CR) of the matrix was found to be 0.051, which is less than the acceptable threshold of 0.10, indicating a satisfactory level of consistency in expert judgment.
Weights were subsequently assigned to the sub-criteria within each main criterion based on their influence on flood vulnerability. Higher scores were allocated to sub-criteria with greater impact, while those with lesser significance received lower scores. For instance, higher elevations and distances farther from rivers were assigned lower scores due to reduced flood risk, whereas low elevations and areas closer to rivers received higher scores. All input layers were then reclassified to a common scale and resampled to a uniform cell size. A weighted overlay analysis was performed using ArcGIS to integrate the reclassified layers according to their assigned weights. This process generated a composite flood vulnerability map, which categorized the landscape into five vulnerability classes: very high, high, moderate, low, and very low. This spatial modeling approach enabled the identification of priority areas for flood mitigation and management interventions.
3Results and discussion
3.1Identification of flood risk zones
Figure 1 and Table 1 present a spatial analysis of flood risk zones within the Usuma watershed, a major hydrological feature that significantly influences flood dynamics across the Federal Capital Territory (FCT), Nigeria. A composite flood risk map was generated by overlaying multiple spatial datasets, including elevation, slope, drainage density, vegetation cover, rainfall intensity, and key hydrological indices such as the Topographic Wetness Index (TWI) and Stream Power Index (SPI). The resulting classification delineated five flood risk categories: very high, high, moderate, low, and very low. The analysis revealed that the very high flood risk zones cover approximately 1,744.73 square kilometers, representing 24.51% of the total land area within the FCT. These zones are predominantly concentrated in the central, eastern, and southern stretches of the Usuma River floodplain, which have historically experienced intense flood events. Specific locations within this category include Lugbe, Lokogoma, Karu, Galadimawa, Gwagwalada, Kuje, and Abaji. These areas are typically characterized by low elevation, high drainage density, low vegetation cover, moderate slope, and high TWI and SPI values, which collectively contribute to severe surface water accumulation and runoff during periods of heavy rainfall.
Zones of high flood risk, accounting for 1,726.73 square kilometers or 24.25% of the study area, form an expansive transition belt around the core floodplain. These include parts of Mpape, Pegi, Chukuku, Garki extension, Jahi, Bwari, and peri-urban districts adjacent to major tributaries of the Usuma River. These locations exhibit similar characteristics to the very high-risk zones but with slightly more favorable topography and vegetation conditions. The moderate flood risk zones span 1,551.40 square kilometers (21.79%) and include settlements such as Nyanya, Karmo, Asokoro extension, Gwagwa, and Bwari outskirts. These areas are located on higher terrain with moderate slopes, relatively stable drainage patterns, and intermediate levels of rainfall and vegetation cover. While not frequently inundated, they remain susceptible during extreme weather events or upstream overflow from the Usuma River and its associated tributaries. Areas categorized under low flood risk cover 1,088.85 square kilometers, constituting 15.29% of the FCT. These include Kubwa, Jabi, Wuse, Gwarinpa, and sections of Bwari North. These districts benefit from favorable topographic features, such as steep slopes, resistant geological formations, and lower floodplain connectivity, which significantly mitigate flood impact.
The very low flood risk zones, covering 1,006.31 square kilometers (14.13%), are situated primarily in the northern and northwestern upland regions of the FCT. These include areas around Ushafa, Jiwa, Shere, Usuma Dam, and the northern extension of Bwari Area Council. These locations sit at higher elevations, have low drainage densities, well-drained soils, and limited exposure to floodplain interactions, making them the most hydrologically stable zones within the study area. The spatial analysis underscores that flood risk in the Federal Capital Territory is significantly influenced by the geomorphological and hydrological dynamics of the Usuma River floodplain. Over 48% of the FCT falls within high to very high-risk zones, particularly concentrated in the central, eastern, and southern catchment areas where urban development encroaches on natural floodplains. The findings highlight the necessity for flood-sensitive urban planning, enforcement of land-use regulations, and early warning systems focused on settlements within the Usuma watershed. Conversely, the northern highland zones, including Ushafa, Shere, and Jiwa, provide examples of low-risk zones due to their favorable elevation and slope characteristics.
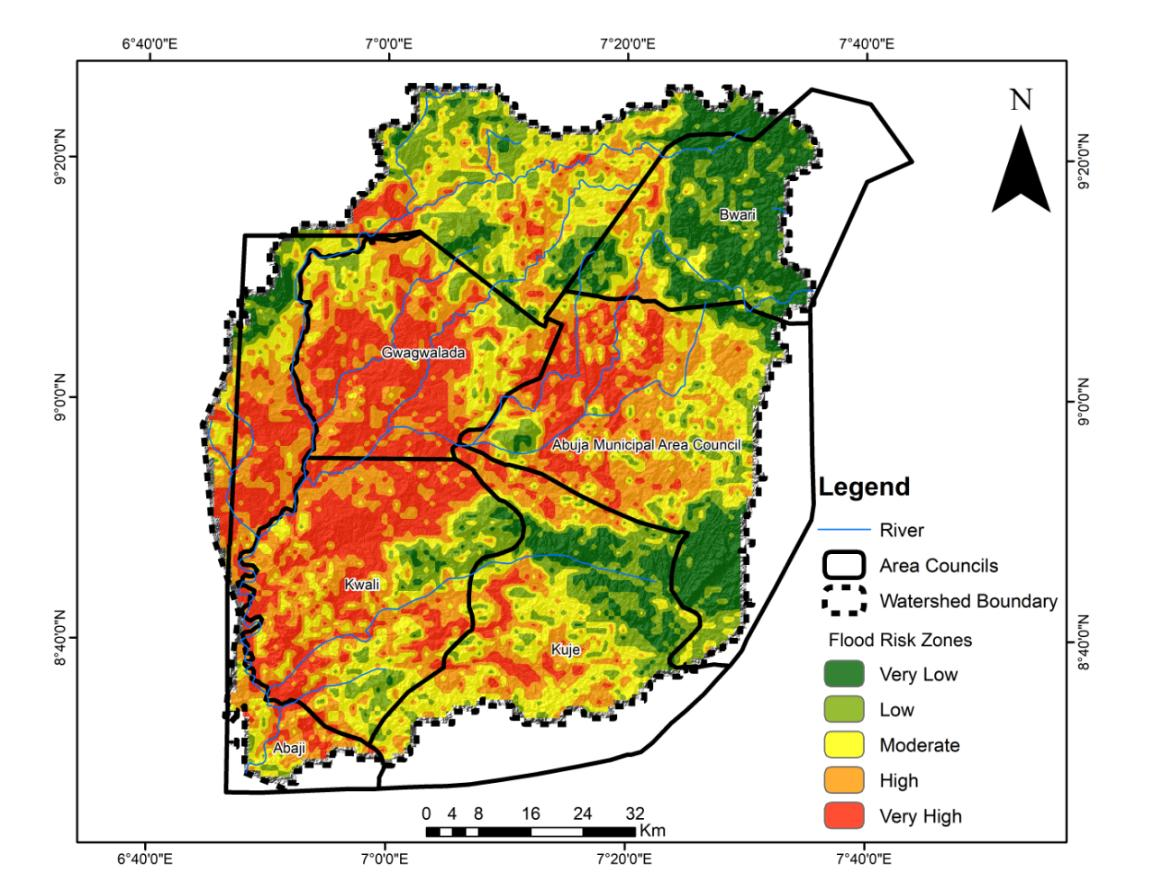
| Risk level | Area (km2) | Percentage (%) |
|---|---|---|
| Very Low | 1006.31 | 14.13 |
| Low | 1088.85 | 15.29 |
| Moderate | 1551.40 | 21.79 |
| High | 1726.73 | 24.25 |
| Very High | 1744.73 | 24.51 |
| Total | 7,118.02 | 100.00 |
Note: Source: authors’ analysis (2025).
3.2Assessment of flood frequency in the study area (2018–2023)
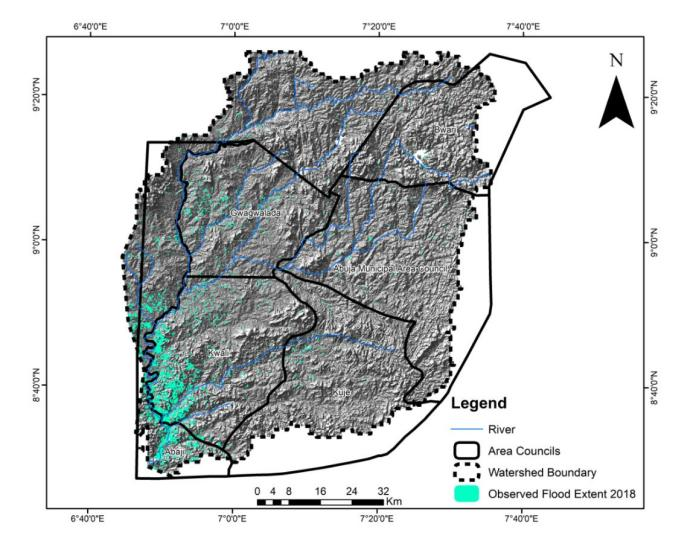
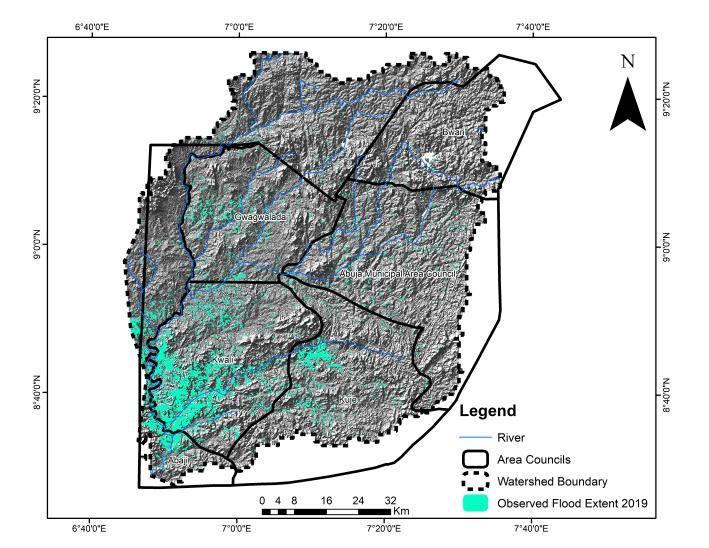
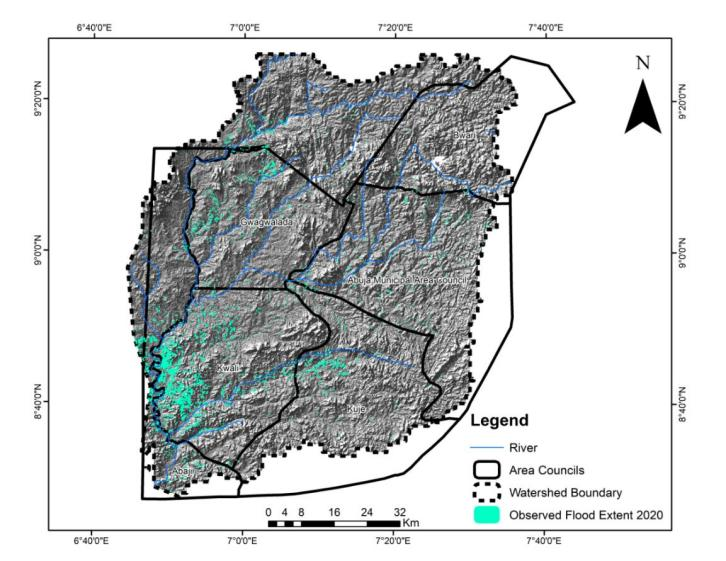
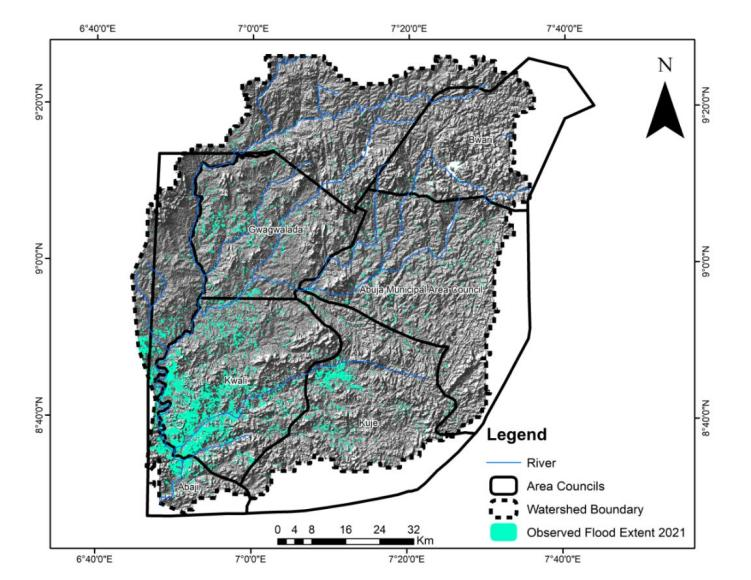
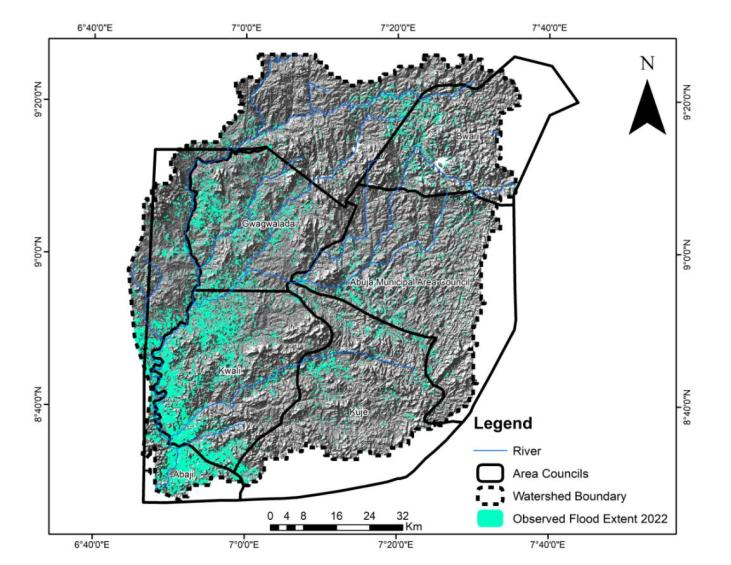
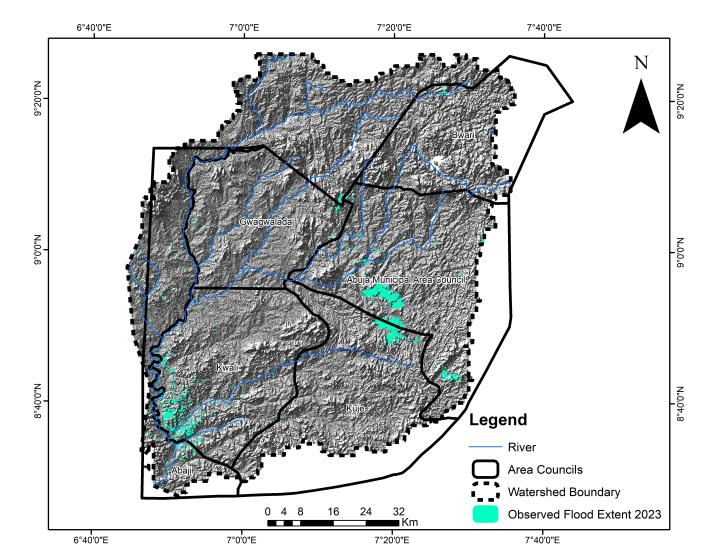
The assessment of flood frequency in the Usuma River floodplain of the Federal Capital Territory (FCT), Nigeria, reveals significant insights into the temporal and spatial patterns of flood occurrences between the years 2018 and 2023 (Figures 2–7). Through the use of geospatial techniques and hydrological data, the study examined the extent and recurrence of flooding within the watershed. A classification approach known as the Jenks Natural Breaks method was applied to the spatial data in order to group flood frequencies into five distinct categories: very high, high, moderate, low, and very low. This classification provided a clearer understanding of the varying levels of flood risk across the region. The analysis indicates that most flood events during the six-year period occurred predominantly in the southern and central parts of the watershed. The years 2019 and 2022 recorded particularly intense flood events, with the flood incident of 2022 standing out as the most severe. During that year, almost every section of the Usuma watershed experienced inundation, including both historically affected areas and locations that had previously been less vulnerable. The extent of the 2022 flooding suggests a growing hydrological stress within the basin, driven by a combination of increasing rainfall intensity, changes in land use, urban expansion, and inadequate drainage infrastructure.
Several localities were repeatedly affected during the assessment period, indicating zones of high flood frequency. Areas such as Lugbe, Lokogoma, and Galadimawa, located within the lower stretches of the floodplain, experienced multiple flood episodes due to their proximity to the Usuma River channel, as well as increasing levels of urban development which have altered the natural flow of surface water. Similarly, the communities of Gwagwalada and Kuje were frequently inundated, as these areas lie along tributary channels and downstream sections of the watershed, where overflow from the Usuma River and surface runoff tend to accumulate. The eastern suburbs of Karu and Nyanya also showed recurrent flooding patterns, attributed to their location at the edge of sloped terrains, where runoff is intensified by rapid land cover change and poor drainage management. In addition, regions such as Abaji and Pegi, situated in the southern portion of the study area, were affected by downstream flood flows, particularly during prolonged rainfall events. Even areas like Jahi and Mpape, which are generally considered elevated, were not immune, as localized flooding occurred due to poor drainage, blocked waterways, and impermeable urban surfaces.
Over the course of the study period, a total of 70,058 hectares of land within the Usuma River watershed experienced flood inundation at least once, reflecting a substantial and persistent flood challenge. The widespread inundation has had several far-reaching impacts, including environmental degradation, displacement of residents, destruction of infrastructure, and loss of livelihoods. Additionally, these flood events have exposed affected communities to heightened public health risks, particularly in terms of water contamination and outbreaks of waterborne diseases. The data further reveals that the most frequently inundated areas correspond with low-lying terrain, dense drainage networks, minimal vegetation cover, and close proximity to the Usuma River and its floodplain. The presence of such physical and hydrological characteristics has contributed to the persistence of flooding in these regions, making them highly vulnerable to future flood disasters. The analysis underscores the importance of recognizing flood frequency not merely as a historical phenomenon but as an indicator of growing risk in a context of climate variability, urban pressure, and inadequate planning controls.
In light of these findings, it is imperative to develop and implement comprehensive flood risk management strategies for the Usuma River floodplain. These should involve proactive land-use planning, enforcement of development regulations in flood-prone zones, upgrading of drainage infrastructure, and community education on flood preparedness. Moreover, integrating flood frequency data into environmental and urban planning frameworks will enhance the capacity of local authorities and residents to respond to and mitigate the impacts of future flood events within the FCT.
4Conclusion and recommendations
This study applied spatial analysis techniques to assess flood risk zones within the Usuma River floodplain in the Federal Capital Territory (FCT), Nigeria. By integrating geospatial datasets and employing methods such as weighted overlay and Jenks classification, the study successfully categorized the floodplain into five levels of risk: very high, high, moderate, low, and very low. The analysis revealed that the central, southern, and eastern parts of the floodplain, including locations such as Gwagwalada, Kuje, parts of Abuja Municipal Area Council (AMAC), and Kwali—are most vulnerable to flood hazards. These areas are repeatedly exposed to flood events due to a combination of low elevation, high rainfall, moderate slope, dense drainage networks, and increasing loss of vegetation linked to urbanization. The flood frequency analysis between 2018 and 2023 further confirmed a disturbing trend, with severe flooding notably recorded in 2019 and peaking in 2022, when approximately 70,058 hectares of land across the watershed were inundated.
The findings emphasize that flooding in the Usuma watershed is both spatially recurrent and intensifying, posing threats to lives, infrastructure, and the environment. This reality calls for urgent, coordinated, and evidence-based interventions. Therefore, it is recommended that future development within high-risk flood zones be strictly regulated through enforced land-use planning policies and zoning restrictions. Urban planners and environmental agencies must work together to limit construction and human settlement in vulnerable floodplain areas, particularly in regions with past flood histories. In addition, infrastructure aimed at flood mitigation must be prioritized. This includes constructing and upgrading stormwater drainage systems, retaining natural flood buffers, restoring degraded vegetation, and building levees or embankments in the most exposed areas. Community-level interventions, such as flood education programs and early warning systems, are equally essential in reducing vulnerability. Furthermore, regular updates of flood risk maps using GIS and remote sensing should be institutionalized to guide urban growth and disaster preparedness planning. Importantly, the methodology and lessons drawn from this study are not only applicable to the Usuma River floodplain but also provide a model for other flood-prone regions across Nigeria and sub-Saharan Africa. As climate change and rapid urbanization continue to escalate flood risks, adopting spatially informed, proactive strategies will be critical in enhancing resilience, safeguarding lives and property, and promoting sustainable urban development. Integrated approaches that combine scientific analysis with local knowledge and institutional commitment will remain vital in mitigating future flood disasters both within the FCT and beyond.
References
- [1]Adelekan IO (2010). Vulnerability of poor urban coastal communities to flooding in Lagos, Nigeria. Environment and Urbanization, 22(2), 433–450.
- [2]Adelekan IO, Olajide-Taiwo LB, Eze B (2020). Flood risk perception and response in low-income urban communities in Ibadan, Nigeria. Journal of Flood Risk Management, 13(3), e12650.
- [3]Aderoju OM, Bello RO (2022). Urban expansion and flood vulnerability mapping in Abuja, Nigeria using GIS and remote sensing techniques. Journal of Environmental Geography, 15(1–2), 37–48.
- [4]Aderoju OA, Bello FO (2022). Spatial expansion of informal settlements and their flood risk implications in Abuja, Nigeria. African Journal of Environment and Sustainable Development, 9(2), 89–101.
- [5]Ahmed MT, Musa SM, Ibrahim UM (2021). Application of GIS in flood risk mapping: A case study of Hadejia River Basin, Nigeria. Nigerian Journal of Environmental Sciences and Technology, 5(3), 457–470.
- [6]Ahmed AM, Bello AA, Ibrahim Y (2021). Soil properties and flood vulnerability in the Federal Capital Territory, Nigeria. Environmental Research and Technology, 4(1), 32–42.
- [7]Akinsanola AA, Ogunjobi KO, Ajayi AE (2023). Assessment of urban flooding risks under changing climate in West Africa: Insights from Nigeria. Climate Risk Management, 39, 100521.
- [8]Ajibade I, Sullivan M, Hauer M (2021). Climate change and urban flooding: A synthesis of socio-spatial vulnerability research. Progress in Human Geography, 45(3), 574–593.
- [9]Arowolo MO, Akinola TO (2023). Integrating remote sensing and GIS for flood vulnerability assessment in Lagos Megacity. Geojournal of Environment and Earth Science, 14(2), 55–68.
- [10]Ede PN, Eneh OC, Nwankwo O (2021). Topographic and land use influences on flood vulnerability in Abuja, Nigeria. Environmental and Earth Sciences Research Journal, 8(2), 73–81.
- [11]Ede PN, Onuoha HC, Daudu JB (2021). Urban land use dynamics and flood risk exposure in the Abuja Municipal Area Council. Journal of Environmental Management and Safety, 12(4), 77–90.
- [12]Egwuonwu GN, Okonkwo AC, Ezeabasili ACC (2022). GIS-based flood risk mapping and assessment for disaster preparedness in Anambra State, Nigeria. Journal of Geoscience and Environment Protection, 10(3), 120–135.
- [13]Eze MC, Efiong J (2023). Flood disaster management and the role of community participation in Nigeria: A review. Sustainable Cities and Society, 96, 104686.
- [14]Eze CJ, Efiong J (2023). Geospatial assessment of topography and drainage patterns in the Usuma River catchment, FCT Abuja. Journal of Geomatics and Environmental Studies, 6(1)
- [15]Federal Ministry of Environment (2021). National flood risk management strategy. Abuja: Government of Nigeria Press.
- [16]Intergovernmental Panel on Climate Change (IPCC) (2022). Climate change 2022: Impacts, adaptation and vulnerability. Working Group II contribution to the Sixth Assessment Report of the IPCC. Cambridge University Press.
- [17]Jeb DN, Aggarwal SP (2008). Flood inundation hazard modeling of the River Kaduna using remote sensing and geographic information systems. Journal of Applied Sciences Research, 4(12), 1822–1833.
- [18]Jeb DN, Aggarwal SP (2008). Flood inundation hazard modeling of the River Usuma using remote sensing and GIS. Journal of Environmental Hydrology, 16(3), 1–10.
- [19]Mohammed SM, Abdulrahman AM (2023). Human-induced drivers of flood vulnerability in Abuja's urban peripheries. Journal of Urban Management, 12(1), 45–58.
- [20]National Emergency Management Agency (NEMA) (2022). Annual flood impact report: 2015–2022. Abuja: NEMA Press.
- [21]Nigerian Meteorological Agency (NiMet) (2023). Seasonal climate prediction for Nigeria 2023. Abuja: NiMet Publications.
- [22]Nigerian Meteorological Agency (NiMet) (2023). 2023 Seasonal Climate Prediction. Abuja: NiMet Publications.
- [23]Nkeki FN, Bello EI, Agbaje IG (2022). Flood risk mapping and urban infrastructural susceptibility assessment using a GIS and analytic hierarchical raster fusion approach in the Ona River Basin, Nigeria. International Journal of Disaster Risk Reduction, 77, 103097.
- [24]Nkwunonwo UC, Whitworth M, Baily B (2020). A review and critical analysis of the efforts towards urban flood reduction in the Lagos region of Nigeria. Natural Hazards and Earth System Sciences, 20(12), 3573–3589.
- [25]Okechukwu JC, Adebayo MO (2024). Evaluating flood disaster preparedness strategies in Nigeria's capital territory. African Journal of Environmental Planning and Policy, 17(1), 22–36.
- [26]Olanrewaju CC, Fashae OA, Aladejana JA (2023). Post-disaster housing reconstruction after urban flooding in Ibadan, Nigeria. International Journal of Disaster Risk Reduction, 92, 103757.
- [27]United Nations Office for Disaster Risk Reduction (UNDRR) (2022). Global assessment report on disaster risk reduction: Our world at risk—Transforming governance for a resilient future. Geneva: UNDRR.