Object Detection, Marine Debris Monitoring
AquaGuard: AI-Assisted Underwater Marine Debris Detection and Reporting — A Literature Review and System Design
Department of Computer Science and Engineering, Sanjay Ghodawat Institute, Atigre, Maharashtra, India
Published November 2026
Abstract
Underwater marine debris is hard to monitor because observations are gathered with different tools, judged by different people and stored in formats that cannot be compared. Deep-learning detectors have been applied to sonar, remotely operated vehicle (ROV) and towed-camera imagery, yet the work reviewed here concentrates on detection models and annotated datasets rather than on the workflow that surrounds a detection. This paper surveys research on marine-debris detection and monitoring, compares existing approaches by sensing modality, detector family, data and workflow support, and derives six research gaps. It then presents AquaGuard, a modular system in which a single-stage object detector sits behind a Flask backend with role-based access, a SQLite store, reviewer-in-the-loop correction and shared web and Flutter mobile front ends. The contribution is a design argued from the literature: no detection accuracy is reported, and the held-out evaluation that must precede any performance claim is specified. Development status and open risks, including domain shift and false positives from natural background, are discussed.
Keywords: marine debris; underwater object detection; YOLO; human-in-the-loop review; environmental monitoring; Flask; Flutter
1Introduction
Marine debris is now found from shorelines to the deep seabed, and plastic forms a large share of it. A widely cited model built on waste-management data for 192 coastal countries placed the amount of land-based plastic reaching the ocean in 2010 at between 4.8 and 12.7 million tonnes [1]. Debris that sinks entangles or is swallowed by animals, damages seabed habitat, and burdens fisheries, ports and coastal tourism. Estimating how much waste enters the sea is, however, a different task from finding and recording it where it lies.
Routine underwater monitoring still depends largely on people. Divers, ROV crews and camera operators produce hours of footage that is screened by eye, summarised in notebooks or spreadsheets, and seldom linked to a searchable record. Citizen-science tools show that structured digital logging can replace paper data cards at scale: the Marine Debris Tracker had accumulated more than 400,000 logged items by
the time its design was described [2]. Such tools, however, still rely on a person recognising and entering every item.
Deep-learning object detectors can automate the recognition step. Single-stage detectors such as YOLO [3] and two-stage detectors such as Faster R-CNN [4] are well established, and maintained open-source implementations [5] make fine-tuning on a new class set routine. They have been applied to sonar imagery [6], to AUV-collected optical and hyperspectral data [7], and to seabed and surface photographs [8–10], as Section 2 describes.
A detector does not by itself make a monitoring tool. A field team must be able to submit media, see what was found and how reliable the finding is, let an expert overrule the model, store the outcome, and later retrieve it by place and date. This paper therefore asks how far the published literature supports that complete chain, and places AquaGuard, a student-scale system under development, against the answer. The contributions are: (i) a narrative review of marine-debris detection research across sonar, ROV, towed-camera and surface imagery; (ii) a comparison of approaches by sensing modality, detector family, data and workflow support; (iii) research gaps derived from that comparison; and (iv) the design, methodology and planned evaluation of AquaGuard as a response to those gaps.
The review is narrative rather than systematic. Sources were located by searching for deep-learning detection of marine litter, underwater debris datasets and citizen-science debris reporting. Peer-reviewed articles were preferred; three cited sources [7, 11, 12] are arXiv preprints and are marked as such in the reference list. Section 2 reviews the literature, Section 3 compares approaches, Sections 4 and V present the system and its methodology, Section 6 states the research gaps, and Sections 7 and VIII discuss limitations and conclude.
2Literature review
2.1Scale of the problem and citizen reporting
The ocean-input estimate in [1] quantifies the scale of the problem and motivates monitoring, but it is a modelling study and offers no way to locate debris underwater. The Marine Debris Tracker [2] addresses the reporting side: a phone application and web portal let volunteers log items with their location, and the resulting data can be viewed and mapped. Its contribution is the reporting channel, not recognition; every entry is made by a human observer.
2.2General-purpose object detectors
YOLO [3] treats detection as one regression from the whole image to bounding boxes and class probabilities, which is what makes it fast. Faster R-CNN [4] instead shares convolutional features between a region-proposal network and a classification head, trading speed for accuracy in many benchmarks. Both were designed for natural-image benchmarks rather than for the colour shifts, backscatter and low contrast of underwater scenes, so their usefulness for debris depends on fine-tuning with underwater data, as the studies below illustrate.
2.3Sonar- and vehicle-based detection
Valdenegro-Toro [6] trained convolutional networks on forward-looking sonar images from an AUV, an attractive modality because it does not depend on water clarity. Fulton et al. note, however, that the evaluation used objects typical of marine litter placed in a water tank, so transfer to natural environments remained unproven [13]. Fossum et al. went further in the field: an AUV carrying a hyperspectral imager and stereo camera detected, mapped and quantified debris in a sheltered bay in Bergen, Norway [7]. The result demonstrates autonomous mapping, but it presupposes a specialised vehicle and sensor payload that most monitoring groups do not have.
2.4Optical classification of floating and shoreline plastics
Kylili et al. trained a convolutional classifier on three categories of floating litter (bottles, buckets and straws) and reported a success rate of about 86% [8]. A later study widened the scheme to eight classes, including bags, food wrappings, derelict nets and fish, and reported about 90% on shoreline and sea-surface images using a bottleneck-feature classifier [9]. The same group subsequently applied deep learning to video footage to estimate debris abundance [10]. These works show that automated recognition can replace manual sorting for surface and shoreline litter, but they address floating rather than submerged objects and are presented as methods, not as deployable applications.
2.5Underwater visual detection, datasets and surveys
Fulton et al. fine-tuned four detectors (YOLOv2, Tiny-YOLO, Faster R-CNN and SSD) on 5,720 annotated frames drawn from the JAMSTEC deep-sea debris archive, with three classes (plastic, ROV and biological), and tested them on 820 images from different videos [13]. Faster R-CNN achieved the highest mean average precision (mAP), while the YOLO-based networks ran much faster on a GPU; Section 3 examines these figures. The same group released TrashCan, a set of 7,212 annotated images from the same archive in two label versions, with Mask R-CNN and Faster R-CNN baselines [11].
Politikos et al. applied a region-based network to towed-camera seabed images from Greek waters, using 11 annotated litter categories, and obtained an mAP of 62% [14]. They observed that background features such as seagrass, algae and boulders led the model to predict more litter items than were actually present, a failure mode that matters for any tool used outside the training scene. Jiang et al. modified YOLOv8 with a context-aware local-enhancement module, a redundancy-reducing convolution block and a different box-regression loss, and reported gains of 5.7% in [email protected] and 6% in F1 on TrashCan-Instance over the unmodified model [15].
Đuraš et al. published the Seaclear dataset of 8,610 shallow-water ROV images from multiple sites and cameras, annotated for 40 categories that include animals, plants and robot parts. Their baselines with Faster R-CNN and YOLOv6 showed that performance degrades when a model is applied to a site or camera it has not seen [16]. A recent survey of 28 deep-learning contributions to marine-debris detection found that, in the results it cross-referenced, the YOLO family outperformed other detector families, but it also stressed the lack of a comprehensive underwater debris database; the authors’ own YOLOv5 test on a small, self-labelled set gave low accuracy and many false positives [12].
2.6Confidence and human oversight
Guo et al. showed that modern neural networks are frequently poorly calibrated, meaning that the confidence they attach to a prediction can overstate how often it is right [17]. Their study concerned classifiers, but it cautions against presenting a detector’s score to a user as a probability. Amershi et al. consolidated more than 150 design recommendations into 18 guidelines for human–AI interaction; these ask that a system set expectations about what it can do and how well, and that it let users correct it when it is wrong [18]. As far as the sources examined here show, the debris-detection studies evaluate models offline and do not describe a user-facing step at which a reviewer can confirm or correct detections.
Table 1 condenses the detection-related studies discussed in this section.
| Ref. | Data and method | Reported outcome | Limitation for monitoring use |
|---|---|---|---|
| [6] | Forward-looking sonar; CNN | Evaluated on tank data | Transfer to open water unproven |
| [7] | AUV with hyperspectral and stereo imaging | Debris detected, mapped and quantified in one bay | Needs specialised vehicle and sensors |
| [8] | Sea-surface images; CNN, 3 classes | ≈86% success rate | Floating debris; classification only |
| [9] | Shoreline and surface images; 8 classes | ≈90% success rate | Not submerged debris |
| [13] | ROV frames; YOLOv2, Tiny-YOLO, Faster R-CNN, SSD | mAP 31.6–81.0 by detector | Benchmark; 3 classes; no data management |
| [11] | 7,212 ROV images; Mask R-CNN, Faster R-CNN | Baselines only | Dataset resource |
| [14] | Towed-camera seabed images; region-based CNN | mAP 62%, 11 classes | Seagrass, algae and rocks cause extra detections |
| [15] | TrashCan; modified YOLOv8 | +5.7% [email protected] over YOLOv8 | Model-level improvement; no application |
| [16] | 8,610 shallow-water ROV images; Faster R-CNN, YOLOv6 | Baselines; domain shift shown | Dataset resource |
3Comparative analysis of existing research
3.1Sensing modality
Sonar and hyperspectral imaging reduce dependence on visibility but require dedicated hardware, and the sonar evidence cited here comes from a tank [6, 13]. Ordinary optical imagery is the only modality that volunteers, divers and inspection crews already carry, which is why the optical studies dominate the field. Its weakness is that lighting and turbidity change how an object looks [13], and turbidity and suspended particles degrade images in shallow water as well [16]. A system intended for broad use must therefore accept optical media and be explicit about conditions under which results are unreliable.
3.2Detector family and the accuracy–speed trade-off
The most direct head-to-head evidence in the reviewed set is the comparison in [13], reproduced in Table 2. Faster R-CNN is clearly the most accurate, YOLOv2 is the fastest of the larger networks on a desktop GPU, and Tiny-YOLO is the fastest on the embedded board, with SSD next. Two points deserve attention. First, the speed ranking is hardware-dependent: on the CPU, YOLOv2 was the slowest model and SSD the fastest, so “single-stage means fast” does not hold everywhere. Second, average IoU varies far less across detectors (49.8–60.6) than mAP does (31.6–81.0), which suggests that box placement differs less between them than overall detection performance. The very low AP of YOLOv2, Tiny-YOLO and SSD on the under-represented biological class also shows how class imbalance can dominate a result.
| Detector | mAP | Avg. IoU | GPU (FPS) | TX2 (FPS) | CPU (FPS) | Bio AP |
|---|---|---|---|---|---|---|
| YOLOv2 | 47.9 | 54.7 | 74 | 6.2 | 0.11 | 9.5 |
| Tiny-YOLO | 31.6 | 49.8 | 205 | 20.5 | 0.52 | 4.2 |
| Faster R-CNN | 81.0 | 60.6 | 18.75 | 5.66 | 0.97 | 73.2 |
| SSD | 67.4 | 53.0 | 25.2 | 11.25 | 3.19 | 6.2 |
Note: Values are those reported in the authors’ public preprint (arXiv:1804.01079). GPU: GTX 1080; TX2: Jetson TX2; CPU: Intel i3-6100U. Three-class model (plastic, ROV, biological); “Bio AP” is the average precision on the biological class.
These detectors date from 2015–2017. Later work reports further gains from newer YOLO variants [15], and the survey in [12] favours the YOLO family across the results it compiled. The choice of a YOLO-style model for AquaGuard therefore rests on practicality (single-stage inference, mature tooling [5]) and survey-level evidence, not on a head-to-head result produced in this project; the evaluation in Section 5 is designed to test that choice.
3.3Data and generalisation
The studies differ in dataset size, class definitions and metrics: three classes and 5,720 training frames in [13], 11 categories in [14], 40 categories in [16]. A reported mAP of 81.0 on three coarse classes and one of 62% on eleven seabed categories are not comparable numbers, and neither should be quoted as the accuracy a new system will achieve. Domain shift is the consistent theme: performance fell when the site or camera changed [16], natural background produced spurious detections [14], and a small self-labelled set gave poor results even for a strong detector family [12].
3.4System and workflow support
Table 3 compares the main approaches on the capabilities a monitoring team needs. It records what the reviewed sources describe; “not reported” means that the source material examined does not mention the capability, not that it is impossible. AquaGuard’s column describes the intended design, and its implementation status is discussed in Section 4.
| Capability | Manual survey | Citizen app [2] | Research detection [6, 13, 14] | AquaGuard (design) |
|---|---|---|---|---|
| Automated detection | No | No (manual entry) | Yes | Yes |
| Persistent shared records | Ad hoc | Yes | Not reported | Yes |
| Location capture | Notes | Yes | Not reported | If valid coordinates exist |
| Structured human review | Informal | No | Not reported | Yes |
| Mobile access | No | Yes | Not reported | Yes (Flutter) |
| Role-based access | No | Not reported | Not reported | Yes |
| Confidence shown with caveat | — | — | Offline metrics | Per detection |
| Special hardware | Dive kit | Phone | Sonar, ROV, GPU | PC and phone |
The pattern is plain. The citizen-science tool provides records, location and mobile access but no recognition, whereas the detection studies provide recognition but, in the material examined, no surrounding system. No single reviewed source combines the two.
3.5Positioning of AquaGuard
AquaGuard sits between these two groups. From the citizen-science tradition [2] it takes the idea that observations should be logged digitally, tied to a place and available to others, and from the detection literature [13, 14] the idea that a trained model can screen media before a person looks at it. It deliberately leaves out what the surveyed work shows to be costly: sonar and vehicle platforms [6, 7], new dataset construction [11, 16] and detector redesign [15]. What remains is an integration problem, and the novelty claimed is limited to the way the pieces are combined and made reviewable, not to any individual component.
4Proposed system
4.1Aim and functional scope
AquaGuard aims to give small monitoring teams one practical, modular and transparent workflow from capture to report. It is intended to accept underwater images and videos; run a trained detector; display detections with confidence information; store observation metadata and references to the original and annotated media; let a reviewer confirm, correct or flag uncertain detections; and provide history, dashboard, report and map views. The same functions are to be reachable from a browser and from a Flutter application for Android and iOS.
4.2Architecture
The system follows a layered client–server design (Figure 1). The browser interface and the mobile application both call a Python Flask application server [19]. The server authenticates users, validates uploads and routes requests; it invokes the detector module, which loads model weights from a .pt file, and it reads and writes a SQLite database [20] and the folders that hold uploaded and annotated media. Keeping the detector, the data layer and the two clients behind separate interfaces allows any one of them to be replaced without rewriting the rest. The mobile client uses Flutter [21] so that one code base can target both platforms.
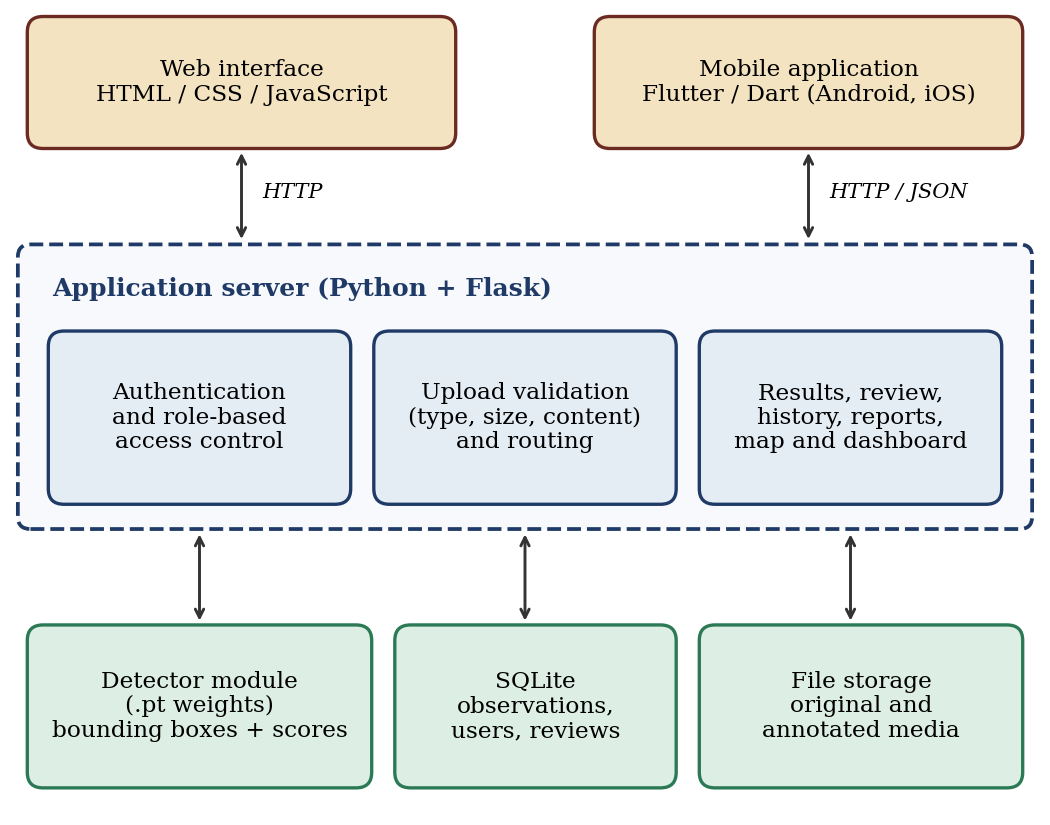
Table 4 records the main technology choices and the reason for each. The common thread is that a small team should be able to run, inspect and replace every component on ordinary hardware.
| Layer | Choice | Rationale |
|---|---|---|
| Backend | Python with Flask [19] | Same language as the detector; little configuration |
| Detector | YOLO-style .pt weights; Ultralytics tooling [5] | Single-stage inference loaded by one module; exact variant to be confirmed |
| Database | SQLite [20] | No separate database server; suits local and demonstration use |
| Web client | Flask templates, HTML, CSS, JavaScript | Served together with the backend |
| Mobile client | Flutter and Dart [21] | One code base for Android and iOS |
| Tooling | Git; Android Studio and SDK | Restorable snapshots; emulator and builds |
4.3Roles and transparency
Four roles are planned: administrators manage users and system activity; reviewers examine detections and record decisions; viewers have read-only access to permitted observations, dashboards and reports; and field observers submit media with whatever location and context they have. Permissions are to be enforced on the server rather than in the interface. Transparency is a stated design principle: every result is presented as a model prediction with its confidence and a limitations notice, never as proof that debris is present, and exact debris mass, depth or material are not claimed because they cannot be derived from an image alone.
4.4Development status
At the time of writing the Flask backend has been run locally, a trained model file has been loaded successfully in the development environment, and the Flutter and Android toolchain has been set up. Loading a model file demonstrates integration, not detection quality; no accuracy, throughput or user-study results exist yet, and none are claimed here. Public deployment and validation of the iOS build are later milestones.
4.5Requirements and verification
Table 5 condenses the functional requirements and the test planned for each. Non-functional requirements complement them: usability (clear navigation and error messages), reliability (a failure must not corrupt stored records), security (validated uploads, protected routes, hashed passwords and no secrets in source code), privacy (restricted access to media and location data), maintainability (separate modules) and transparency (predictions may be wrong).
| ID | Requirement | Priority | Planned test |
|---|---|---|---|
| FR-01, 02 | Accept supported image and video uploads; reject unsupported, empty or oversized files | High | Valid and invalid sample media |
| FR-03 | Load model weights with useful diagnostics | High | Valid, missing and corrupt model |
| FR-04, 05 | Return structured detections; show input and result artefacts | High | Known positive and negative samples |
| FR-06 | Persist observations and file references | High | Database inspection after detection |
| FR-07 | Enforce authentication and roles on the server | High | Unauthorised access attempts |
| FR-08, 09 | Show history and reports; allow review and feedback | Medium | Filters, empty state, saved review state |
| FR-10 | Show map points only for valid coordinates | Medium | Missing and valid coordinates |
| FR-11 | Support the core mobile workflow | High | Android now, iOS later |
| FR-12 | Handle backend, model and network errors clearly | High | Disconnect service and retry |
5Methodology
5.1Development approach
The work follows an iterative, incremental plan. Phases consolidate one authoritative project copy with backups; verify the backend, database and security; stabilise the Android client; complete the mobile screens; integrate review, report and map modules; evaluate the model; deploy securely for demonstration; and validate the iOS build. Each phase has a completion criterion, and the core tests are repeated after every change to catch regressions.
5.2Detection pipeline
An authenticated user submits an image or video with optional location and notes. The server checks file type, size and content, rejects invalid or unauthorised requests with a clear message, and stores the original file. The detector then runs inference with a configurable confidence threshold, and the backend formats the predictions, produces an annotated output where supported, saves the observation, and shows the result with the limitations notice. Detections that are uncertain or important are routed to a reviewer (Figure 2). Missing or corrupt weights must produce a useful diagnostic rather than a silent failure.
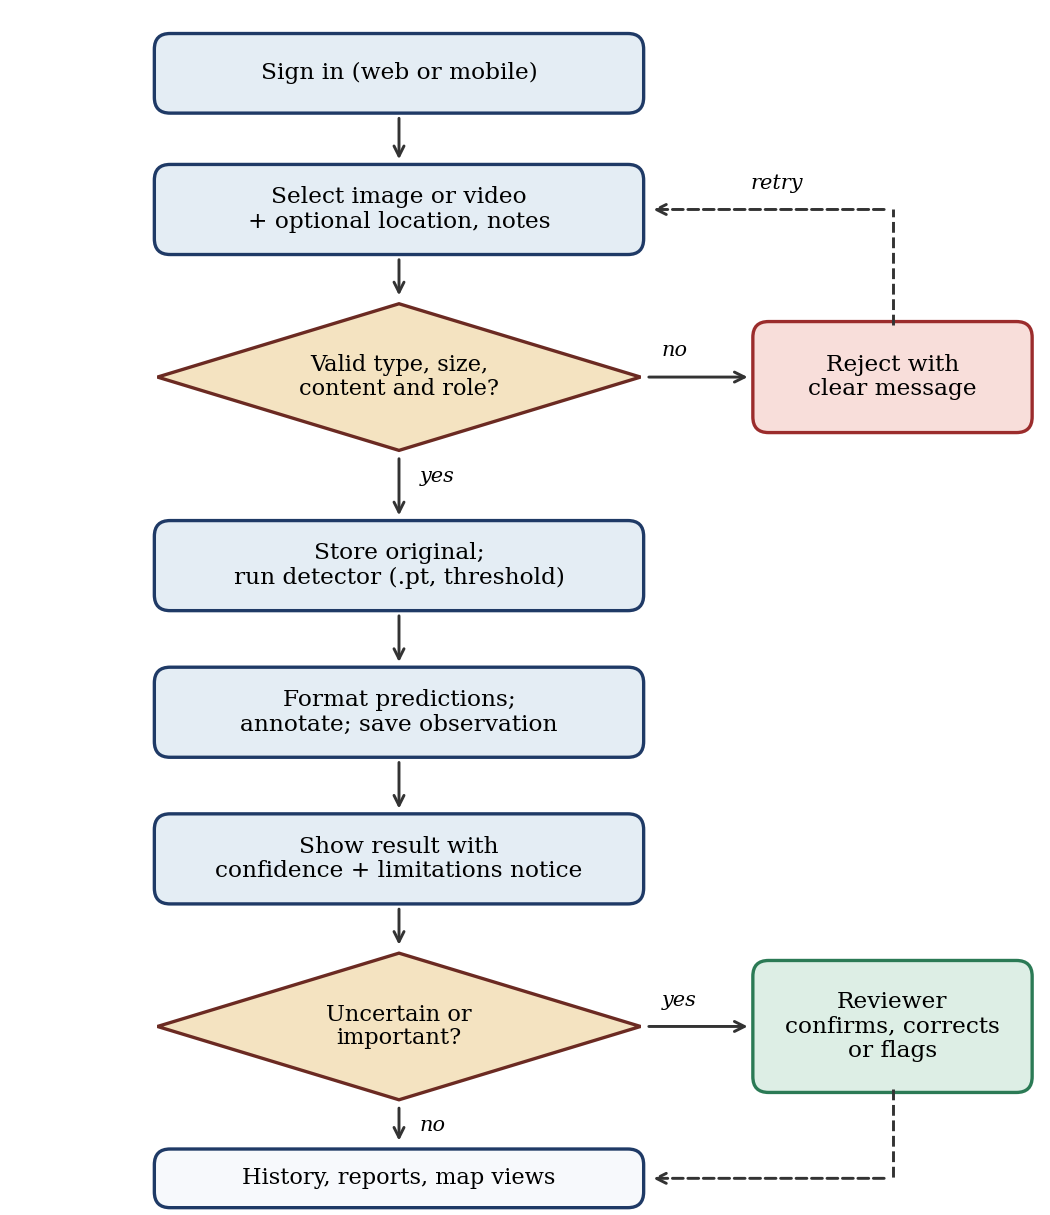
The detector is a YOLO-style model [3, 5]; the exact variant is still to be confirmed. The rationale is deployment-driven: single-stage inference with mature tooling is simple to wrap behind a web service, and in the older comparison of Table 2 the accuracy advantage of the two-stage model came at lower GPU throughput. Table 2 also warns that CPU throughput can be low for every detector, so video is planned to be processed on sampled frames, with the sampling rate fixed during testing rather than assumed in advance.
5.3Data model and storage
Each observation is intended to record references to the original and annotated media, the detections (class, confidence and bounding box), a timestamp, optional coordinates and notes, the submitting user and the review status. Map points are drawn only when valid coordinates exist, and location or depth values are never invented when unavailable. A conceptual entity–relationship model has been drawn; the final table and column names will be fixed after checking the actual schema in the source code.
5.4Review, access control and confidence display
Reviewers can confirm, correct or flag a detection, and the decision is stored with the observation. Authentication, hashed passwords, protected routes and the absence of secrets in source code are treated as security requirements. Confidence is displayed as the model’s score, labelled as such, because raw scores need not match the true probability of being correct [17]. The accompanying notice follows the guidance to state what the system can do and how well [18]. The operating threshold will be chosen from validation data and documented.
5.5Evaluation protocol
No performance claim will be made until the model has been tested on a held-out set that covers varied water clarity, lighting, camera angle, depth and debris type. Table 6 lists the planned measurements and the literature that motivates each. The set is deliberately broader than a single mAP figure, because the reviewed studies show that headline accuracy hides failures on background clutter and unseen sites [14, 16].
| Dimension | Planned measure | Motivation |
|---|---|---|
| Detection quality | Precision, recall, false positives, false negatives and mAP on a held-out test set | [13] |
| Generalisation | Results on a site or camera absent from training | [16] |
| Background confusion | False-positive rate on frames with seagrass, algae or rock but no debris | [14] |
| Threshold choice | Sweep on validation data; chosen value documented | [17] |
| Throughput | Seconds per image and frames per second on CPU and, if available, GPU | [13] |
| Media types | Still images and video reported separately | Design requirement |
| Functional tests | Upload validation, model loading, persistence, roles, history, review, map data, mobile flow and error handling | Project requirements |
| Reviewer workload (additional) | Share of detections that reviewers correct or flag | [18] |
6Research gaps
Six gaps follow from the comparison; Table 7 maps each to the evidence and to what AquaGuard does about it. The third column is deliberately candid, because a design can reduce a gap without closing it.
G1: Detector-centred contributions. The detection studies concentrate on models and datasets [11, 13–16]; the material examined does not describe the upload, storage, retrieval and reporting chain that turns detections into monitoring records.
G2: No structured review. Spurious detections from natural background [14] and a high false-positive rate in a small-data test [12] make expert correction desirable, yet none of the studies examined builds it in.
G3: Hardware and expertise barriers. Sonar, AUV and GPU-based pipelines [6, 7, 13] are likely to be out of reach for many volunteer or municipal teams.
G4: Reporting separated from recognition. Citizen applications capture location and scale well but depend on manual identification [2].
G5: Uncertainty communication. Raw scores can mislead [17], and interaction guidelines call for clear statements of capability and error [18], whereas the debris studies examined report offline metrics only.
G6: Data scarcity and domain shift. Annotated underwater debris data remain limited and site-specific [12, 16]; AquaGuard does not remove this constraint.
| Gap | AquaGuard response | What remains open | Status |
|---|---|---|---|
| G1 | Single workflow: upload, detection, storage, history, reports and maps | Usability not yet studied | Designed |
| G2 | Reviewer role to confirm, correct or flag detections | Reviewer burden unknown | Designed |
| G3 | Standard PC and phone; CPU inference supported | CPU video throughput is low | Designed; to be measured |
| G4 | Web and Flutter clients on one backend; location when valid | iOS build unvalidated | Android toolchain ready |
| G5 | Confidence shown with a limitations notice | Calibration not assessed | Designed |
| G6 | Held-out and cross-site evaluation planned | No new dataset is contributed | Open |
7Discussion
The contribution of AquaGuard is compositional. It does not propose a new detector and should not be judged on detector accuracy. Its argument is that the literature has shown debris can be recognised in images under favourable conditions, while leaving open how recognised debris becomes a trusted, retrievable record. Combining a conventional detector with role-based access, stored observations and a review step addresses that second question at a scale a small team can maintain.
Several risks follow directly from the review. First, background clutter [14] could make the reviewer queue long enough to defeat the purpose of automation, which is why reviewer workload is included in Table 6. Second, domain shift [16] means that a model that works at the training site may fail elsewhere, so cross-site testing should precede any deployment claim. Third, CPU inference is slow for video [13], and the design depends on frame sampling or an optional GPU. Fourth, SQLite suits a single-server deployment with modest concurrency [20]; a larger or public service would need a server database and managed storage. Fifth, uploaded media and coordinates can be sensitive, so access restrictions are part of the design rather than an afterthought.
A natural extension is to treat reviewer corrections as labelled data for later fine-tuning, which would address data scarcity gradually; this is a proposal, not a feature claimed for the current system. Calibration of scores, live camera feeds and scientific-grade quantification would each require work beyond the present scope.
The review has limits of its own. It is narrative, relies largely on published abstracts and, where accessible, full texts, and covers a small number of studies from a fast-moving field. The comparison in Table 2 uses older detector generations. The status of the system is early-stage, and the claims above are design arguments that the planned evaluation must confirm or refute.
8Conclusion
Research on underwater marine-debris detection has shown, across sonar, ROV, towed-camera and surface imagery, that convolutional detectors can find litter, yet the published work is dominated by models and datasets, with limited attention, in the material examined, to deployment hardware, data management, human review and the communication of uncertainty. AquaGuard is designed to fill part of that space: a modular Flask, SQLite and Flutter system that couples a single-stage detector with stored observations, role-based access and a reviewer-in-the-loop step. The paper has argued for the design from the literature and specified an evaluation that goes beyond a single accuracy figure. The next steps are model evaluation on a held-out, multi-condition set, measurement of CPU and GPU throughput, completion of the review and mapping modules, and validation of the iOS client.
References
- [1]Jambeck JR, Geyer R, Wilcox C, Siegler TR, Perryman M, Andrady A, et al. Plastic waste inputs from land into the ocean. Science. 2015;347(6223):768–771. https://doi.org/10.1126/science.1260352
- [2]Jambeck JR, Johnsen K. Citizen-based litter and marine debris data collection and mapping. Comput Sci Eng. 2015;17(4):20–26. https://doi.org/10.1109/MCSE.2015.67
- [3]Redmon J, Divvala S, Girshick R, Farhadi A. You only look once: Unified, real-time object detection. In: Proceedings of the IEEE Conference on Computer Vision and Pattern Recognition (CVPR); 2016; Las Vegas, NV, USA. p. 779–788. https://doi.org/10.1109/CVPR.2016.91
- [4]Ren S, He K, Girshick R, Sun J. Faster R-CNN: Towards real-time object detection with region proposal networks. IEEE Trans Pattern Anal Mach Intell. 2017;39(6):1137–1149. https://doi.org/10.1109/TPAMI.2016.2577031
- [5]Jocher G, Chaurasia A, Qiu J. Ultralytics YOLO [Software]. 2023. https://github.com/ultralytics/ultralytics
- [6]Valdenegro-Toro M. Submerged marine debris detection with autonomous underwater vehicles. In: Proceedings of the International Conference on Robotics and Automation for Humanitarian Applications (RAHA); 2016. p. 1–7.
- [7]Fossum TO, Sture Ø, Norgren-Aamot P, Hansen IM, Kvisvik BC, Knag AC. Underwater autonomous mapping and characterization of marine debris in urban water bodies [Preprint]. arXiv:2208.00802; 2022.
- [8]Kylili K, Kyriakides I, Artusi A, Hadjistassou C. Identifying floating plastic marine debris using a deep learning approach. Environ Sci Pollut Res. 2019;26(17):17091–17099. https://doi.org/10.1007/s11356-019-05148-4
- [9]Kylili K, Hadjistassou C, Artusi A. An intelligent way for discerning plastics at the shorelines and the seas. Environ Sci Pollut Res. 2020;27(34):42631–42643. https://doi.org/10.1007/s11356-020-10105-7
- [10]Teng C, Kylili K, Hadjistassou C. Deploying deep learning to estimate the abundance of marine debris from video footage. Mar Pollut Bull. 2022;183:114049. https://doi.org/10.1016/j.marpolbul.2022.114049
- [11]Hong J, Fulton M, Sattar J. TrashCan: A semantically-segmented dataset towards visual detection of marine debris [Preprint]. arXiv:2007.08097; 2020.
- [12]Moorton Z, Kurt Z, Woo WL. State of the art applications of deep learning within tracking and detecting marine debris: A survey [Preprint]. arXiv:2403.18067; 2024.
- [13]Fulton M, Hong J, Islam MJ, Sattar J. Robotic detection of marine litter using deep visual detection models. In: Proceedings of the IEEE International Conference on Robotics and Automation (ICRA); 2019; Montreal, QC, Canada. p. 5752–5758. https://doi.org/10.1109/ICRA.2019.8793975
- [14]Politikos DV, Fakiris E, Davvetas A, Klampanos IA, Papatheodorou G. Automatic detection of seafloor marine litter using towed camera images and deep learning. Mar Pollut Bull. 2021;164:111974. https://doi.org/10.1016/j.marpolbul.2021.111974
- [15]Jiang W, Yang L, Bu Y. Research on the identification and classification of marine debris based on improved YOLOv8. J Mar Sci Eng. 2024;12(10):1748. https://doi.org/10.3390/jmse12101748
- [16]Đuraš A, Wolf BJ, Ilioudi A, Palunko I, De Schutter B. A dataset for detection and segmentation of underwater marine debris in shallow waters. Sci Data. 2024;11:921. https://doi.org/10.1038/s41597-024-03759-2
- [17]Guo C, Pleiss G, Sun Y, Weinberger KQ. On calibration of modern neural networks. In: Proceedings of the 34th International Conference on Machine Learning (ICML); 2017. PMLR 70, p. 1321–1330.
- [18]Amershi S, Weld D, Vorvoreanu M, Fourney A, Nushi B, Collisson P, et al. Guidelines for human-AI interaction. In: Proceedings of the CHI Conference on Human Factors in Computing Systems; 2019; Glasgow, UK. p. 1–13. https://doi.org/10.1145/3290605.3300233
- [19]Pallets Projects. Flask documentation [Internet]. https://flask.palletsprojects.com
- [20]SQLite. SQLite documentation [Internet]. https://www.sqlite.org/docs.html
- [21]Google. Flutter documentation [Internet]. https://docs.flutter.dev