Mobile Broadband
Persistent Multidimensional Mobile Broadband Disadvantage and Population Exposure in Nigeria
Department of Electronic and Computer Engineering, Nnamdi Azikiwe University, Awka, Anambra State, Nigeria
Published November 2026
Abstract
Mobile broadband inequality can persist even when national averages appear stable, and the population significance of recurring disadvantage is not captured by state rankings alone. This study examines the magnitude, temporal persistence, and population exposure of state-level mobile broadband disadvantage across Nigeria's 36 states and the Federal Capital Territory using four consecutive quarters of Ookla Open Data from Q2 2025 to Q1 2026. Device-weighted state estimates were calculated for download throughput, upload throughput, and latency, with test weighting retained for robustness. Inequality was summarized with dispersion measures and cross-metric rank correlations. Temporal persistence was assessed with quarter-to-quarter Spearman correlations, Kendall's coefficient of concordance, Friedman tests, and random-intercept mixed-effects models. A state was classified as persistently disadvantaged when it occupied the adverse quartile in at least three of four quarters, and WorldPop 2025 estimates were used to quantify population exposure. Download and latency were more unequal than upload. Kendall's W was 0.867 for download, 0.750 for upload, and 0.775 for latency, while mixed-model intraclass correlations ranged from 0.610 to 0.836. Fifteen states were persistently disadvantaged in at least one dimension, representing 38.3% of the modeled population; six states were disadvantaged in at least two dimensions, representing 13.4%. The findings show that mobile broadband disadvantage in Nigeria is multidimensional, persistent, and socially consequential at population scale.
Keywords: mobile broadband; digital inequality; temporal persistence; population exposure; Nigeria; crowdsourced measurement
1Introduction
Broadband inequality is no longer adequately described only by whether a connection is available. The quality of realized service increasingly determines whether users can participate effectively in bandwidth-intensive and interactive activities. Download throughput, upload throughput, and latency capture different aspects of that quality, and each can produce a different map of advantage and disadvantage [1–4]. A national average can therefore conceal both the magnitude of internal disparity and the fact that the same locations may remain disadvantaged across repeated measurement periods.
The distinction between access and quality is especially important in mobile-first settings. A network can be nominally available across a large geographic area while realized throughput and delay differ substantially from place to place. Vicente and Gil-de-Bernabe [1] described this evolution as a movement from a penetration divide toward a quality divide, and more recent broadband-measurement work emphasizes that useful connectivity cannot be represented adequately by one access indicator or one headline speed [2–4]. For subnational analysis, the implication is straightforward: national averages can improve even while some states repeatedly occupy the weaker end of the performance distribution.
Performance inequality is also multidimensional. Download throughput describes downstream transfer capacity, upload throughput captures the reverse direction, and latency reflects end-to-end delay. The three measures are related to user experience in different ways and can respond differently to radio conditions, congestion, routing, device mix, access technology, and transport infrastructure. Studies that report several quality-of-service dimensions therefore provide a more informative picture than speed-only assessments [3], [4]. If the same states are not disadvantaged on every measure, a single composite description of 'poor broadband' can obscure the type of deficit that is actually recurring.
A second analytical issue is time. Cross-sectional broadband maps are useful for locating weak conditions, but they cannot distinguish a persistent disparity from a temporary fluctuation. Crowdsourced measurements vary with participation, devices, testing behavior, local demand, and network conditions [7], [9–12]. A state that falls into the lower tail in one quarter may move substantially in the next because the underlying network changed or because the observed sample changed. Repeated adverse placement across several quarters is therefore a stronger indicator of recurring geographic disadvantage than a single low measurement.
Longitudinal evidence can be evaluated in several complementary ways. Pairwise rank correlations show whether the relative ordering of states is similar from one quarter to another; Kendall's coefficient of concordance summarizes agreement across all quarters simultaneously; repeated-measures tests evaluate whether there is a common national shift over time; and mixed-effects models estimate how much modeled variation is associated with persistent between-state differences rather than within-state quarter-to-quarter movement. No one statistic is sufficient on its own. Taken together, however, these approaches can distinguish a stable hierarchy from a rapidly reshuffling performance surface.
The social scale of recurring disadvantage is another question that rankings alone cannot answer. Counting states implicitly treats a sparsely populated state and a very populous state as equivalent units. Population context does not turn a state average into an individual-level prevalence estimate, but it does show how many people are modeled to reside within the administrative areas repeatedly classified as disadvantaged. Gallardo and Whitacre [5] illustrate the value of combining broadband performance with demographic context, while WorldPop provides a consistent gridded population surface for ecological geographic analysis [22], [23]. The present study uses population only for this contextual purpose and not as a claim that every resident of a classified state experiences the same service.
Nigeria provides a strong empirical case because mobile networks carry much of everyday Internet access and previous research has already demonstrated geographic heterogeneity in both Internet use and measured mobile performance. Nigerian studies have used host-based measurement, user-centric applications, drive tests, and multi-state crowdsourcing [14–19], while Adeleke [20] documented spatial differences in Internet use across all states and the FCT. What has remained less explicit is whether directly measured state-level mobile-broadband disparities persist across repeated national periods and how much of the modeled population resides in states that are repeatedly disadvantaged on one or more performance dimensions.
This paper addresses that gap with a deliberately different objective from a one-period benchmarking study. It does not seek to identify the best or worst state from a single pooled ranking, and it does not convert the measurements into an infrastructure-priority score. Instead, it asks four connected questions: how unequal are state-level download, upload, and latency values; how stable are the relative state disparities over four quarters; which states recur in the adverse tail of the national distribution; and what share of the modeled population resides in those repeatedly disadvantaged states. The combination of dispersion, persistence, and population exposure provides a compact framework for describing broadband inequality as a recurring geographic condition rather than a one-time ranking.
Crowdsourced speed-test platforms make repeated subnational assessment possible at a scale that would be difficult to reproduce through researcher-run drive testing alone. Ookla measurements have been used to study spatial disparity, temporal progression, and digital inequality in several settings [5–8]. Their interpretation nevertheless requires care because test participation is self-selected and observed values can reflect devices, subscription tiers, network conditions, server selection, time of use, and the spatial distribution of people who choose to test [9–12]. The present study therefore treats the measurements as observed state-level performance rather than probability-sampled estimates of every resident.
Persistence is particularly important for inequality analysis. A low value in one quarter may reflect a temporary network condition or a changing measurement mix. A state that repeatedly occupies the lower tail of the national distribution presents a different problem because the relative disadvantage survives changes in measurement period. Temporal analysis of crowdsourced Internet-quality data has shown that geographic differences can persist even as absolute performance changes [7], [8], [13]. For broadband policy and monitoring, recurring disadvantage is therefore more informative than an isolated poor quarter.
Nigeria has a growing literature on mobile-broadband performance, including host-based measurement, user-centric approaches, drive testing, and multi-state crowdsourcing [14–19]. Nationwide evidence of digital inequality also exists for Internet use [20]. What remains less developed is a national analysis that keeps multiple performance dimensions separate, tests whether state disparities persist through repeated quarters, and then asks how much of the population resides in states that repeatedly occupy the adverse end of those distributions.
This paper addresses that gap using four quarters of mobile-broadband measurements for all 36 states and the Federal Capital Territory (FCT) together with WorldPop 2025 population estimates. It asks three questions: (1) how large and multidimensional are state-level inequalities in measured mobile-broadband performance; (2) how persistent are the relative state disparities across quarterly measurement periods; and (3) what proportion of Nigeria's modeled population resides in states experiencing recurring disadvantage in one or more performance dimensions? The study intentionally does not construct a composite score or intervention ranking; download, upload, and latency remain separate so that different forms of disadvantage remain visible.
2Materials and methods
2.1Data sources and state-level estimation
Four public Ookla Open Data mobile performance tile products were used: Q2 2025, Q3 2025, Q4 2025, and Q1 2026. The retained variables included average download speed, average upload speed, average latency, tests, devices, and tile coordinates. Download and upload were converted from kilobits per second to megabits per second, while latency was retained in milliseconds. Nigeria ADM1 boundaries were obtained from geoBoundaries (boundary ID NGA-ADM1-27671186). Each tile coordinate was converted to a point and included only when it fell within one state/FCT polygon, producing 148 state-quarter observations after aggregation [21].
The public mobile files contain zoom-level 16 tile aggregates rather than individual Speedtest histories. Retained fields included average download speed, average upload speed, average latency, test count, device count, and spatial identifiers. Download and upload were converted from kilobits per second to megabits per second; latency remained in milliseconds. Nigeria's first-order administrative boundaries were obtained from the geoBoundaries gbOpen ADM1 product [21]. A broad rectangular prefilter was used only to reduce the portion of the global files read into memory. Final inclusion was based on a spatial join between the Ookla tile coordinates and Nigerian state/FCT polygons, producing observations for all 37 administrative units in each of the four quarters.
The study treats the public speed-test data as observational measurements rather than a probability sample. Running a speed test is a user action, and the public aggregates do not contain the information needed to estimate every Nigerian user's probability of being observed. Device capability, subscription plan, network operator, local congestion, server assignment, and motivation to test can all affect the measurements [9–12]. The analyses therefore describe the structure of the observed state-level data after consistent aggregation; they do not claim that the weighted state values are unbiased population means.
The primary state estimator was a device-weighted mean. Each quarter-tile performance value was weighted by the corresponding reported device count. A parallel test-weighted estimator was retained for robustness. Pooled estimates combined all quarter-tile observations from Q2 2025 through Q1 2026 before calculating the weighted state mean; they were not simple averages of the four quarterly state means. Device and test counts were used only as aggregation weights and were not interpreted as unique users.
Device weighting was selected as the primary estimator because it gives greater influence to quarter-tile records associated with more reported devices while reducing the direct dominance of repeated testing compared with test weighting. This is an analytical weighting choice rather than a correction for sample selection. The test-weighted estimator was retained because it reconstructs the pooled mean across observed tests under the tile-level aggregation and therefore provides a useful alternative specification. Agreement between the two indicates that a conclusion is not dependent on one choice of activity weight.
For pooled state values, quarter-tile observations from all four quarters were combined before calculating the weighted mean. The pooled estimate is therefore not a simple arithmetic mean of four quarterly state means. This preserves the relative contribution of the observed quarter-tile device or test weights across the entire study period. Quarterly state values were retained separately for the persistence and disadvantage analyses.
2.2Inequality and temporal persistence
State-level inequality was summarized separately for download, upload, and latency using the mean, median, interquartile range (IQR), coefficient of variation (CV), 90th-to-10th percentile ratio (P90/P10), and Gini coefficient. The Gini statistic was used only as a scale-free measure of dispersion across state performance values. Pairwise Spearman rank correlations tested whether the three performance dimensions produced similar state orderings; because lower latency is better, correlations involving latency were interpreted in the opposite performance direction.
The dispersion measures were chosen because they capture different features of inequality. The interquartile range describes the central spread without being dominated by the most extreme state values. The coefficient of variation scales the standard deviation by the mean and therefore permits comparison of relative dispersion across metrics with different units and levels. The P90/P10 ratio compares the upper and lower tails of the state distribution. The Gini coefficient provides a bounded, scale-free summary of dispersion across state values; in this paper it is used descriptively rather than as a welfare index. Consistency among these measures provides stronger evidence than any single inequality statistic.
Pairwise Spearman correlations between pooled download, upload, and latency ranks were used to determine whether the three dimensions produce broadly similar state hierarchies. Correlations involving latency require directional care because lower latency indicates better performance. A negative download-latency correlation, for example, means that states with higher download speeds tend to have lower delay. Weak cross-metric correlation indicates that the location of disadvantage depends on the technical dimension being considered.
Temporal persistence was evaluated with four complementary procedures. First, Spearman correlations were calculated for all six possible pairs of quarters for each performance measure. Second, Kendall's coefficient of concordance (W) measured agreement among the four quarterly state rankings simultaneously. Third, Friedman tests examined whether the distributions of performance across the same 37 units shifted systematically by quarter. Fourth, random-intercept mixed-effects models separated persistent between-state variation from within-state quarter-to-quarter variation. The positively skewed outcomes were log transformed; quarter was entered as a categorical fixed effect and state as a random intercept. Models were estimated by restricted maximum likelihood, and the intraclass correlation coefficient (ICC) was calculated as the state-level variance divided by total modeled variance.
The four persistence procedures were intended to answer related but non-identical questions. Six pairwise Spearman correlations measured how strongly ranks in one quarter resembled ranks in another. Kendall's W treated the four quarters jointly and summarized concordance of the state ordering on a 0-to-1 scale. The Friedman test examined whether the same 37 administrative units experienced a systematic common shift in their performance distributions across quarters. A high W combined with a nonsignificant Friedman test would therefore describe stable relative inequality without evidence of one quarter producing a uniform national movement.
The mixed-effects models provided a variance-based complement to the rank statistics. Each positive, skewed performance outcome was transformed with the natural logarithm, quarter was entered as a categorical fixed effect, and state/FCT was modeled as a random intercept. Models were estimated by restricted maximum likelihood. The intraclass correlation coefficient was calculated as the estimated between-state variance divided by the sum of between-state and residual variance. A high ICC indicates that repeated observations from the same state tend to resemble one another relative to the variation observed across states, which is consistent with a durable geographic component in the one-year data.
2.3Persistent disadvantage and population exposure
Recurring disadvantage was defined from the quarterly state distributions. For download and upload, a state was classified as disadvantaged in a quarter when its performance was at or below the 25th percentile across the 37 units. For latency, disadvantage was defined as a value at or above the 75th percentile. A state was classified as persistently disadvantaged on a dimension when it met the adverse-quartile condition in at least three of the four quarters. The three-of-four rule allows one quarter of movement outside the adverse tail while retaining a requirement for recurring poor relative placement.
The adverse-quartile approach is intentionally relative rather than regulatory. It identifies states repeatedly located in the weaker tail of the national state distribution; it does not claim that the 25th percentile corresponds to an official minimum broadband standard. The three-of-four-quarter criterion was selected to require recurrence while allowing one period in which a state moves outside the adverse tail. A four-of-four rule would be more restrictive but could classify a state as nonpersistent after one temporary improvement, whereas a two-of-four rule would treat intermittent disadvantage as persistent. The chosen rule therefore balances continuity and tolerance for one-quarter movement.
Persistent disadvantage was evaluated separately for download, upload, and latency before overlap across dimensions was assessed. This preserves the multidimensional character of the problem. A state can be repeatedly disadvantaged in throughput without being repeatedly disadvantaged in delay, or vice versa. The number of dimensions in which a state is persistently disadvantaged therefore provides a simple indicator of recurring multidimensional burden without collapsing the three metrics into a weighted composite index.
Population estimates were obtained from the WorldPop 2025 R2025A v1 constrained population raster for Nigeria at approximately 100 m resolution [22], [23]. Population cells were summed within each state/FCT polygon, giving a modeled national total of 235.02 million. Population was then summed for states persistently disadvantaged in each metric, in at least one dimension, and in at least two dimensions. These quantities represent population exposure to classified state-level conditions; they do not estimate the number of individuals who personally experienced the measured state average.
The resulting modeled national population across the 37 units was approximately 235.02 million. State populations were attached only after the broadband classifications were determined. Population therefore does not influence whether a state is labelled persistently disadvantaged; it is used to quantify the ecological scale associated with the classified geography. This separation is important because weighting the broadband measurements by population would answer a different question and could obscure the persistence of conditions in smaller states.
Population exposure was calculated for each individual performance dimension, for states persistently disadvantaged in at least one dimension, and for states persistently disadvantaged in at least two dimensions. Because categories overlap, these quantities are not intended to sum to a mutually exclusive national partition except where the figure explicitly groups residents by number of persistent disadvantage dimensions. The analysis does not estimate the number of mobile subscribers experiencing a particular speed or latency.
Sensitivity analysis recalculated persistent disadvantage using adverse-tail cutoffs of 20%, 25%, and 33%. Device- and test-weighted state estimates were also compared using Spearman rank correlations and paired Wilcoxon signed-rank tests.
The 20%, 25%, and 33% adverse-tail definitions were chosen to test whether the main population conclusion depended on one arbitrary cutoff. A narrower tail requires more extreme placement to qualify; a broader tail includes a larger share of states. Robustness is therefore assessed by whether the substantive conclusion of nontrivial recurring multidimensional exposure survives this deliberate change in classification severity. Statistical tests used alpha = .05 unless a multiple-testing adjustment was specified elsewhere in the source analysis.
3Results
3.1Magnitude and multidimensionality of inequality
The four-quarter pooled estimates show that the degree of state-level inequality depends strongly on the performance dimension. Mean state download throughput was 32.28 Mbps, mean upload throughput was 15.82 Mbps, and mean latency was 70.65 ms. Download had a CV of 0.381 and P90/P10 ratio of 2.21, while latency had a CV of 0.347 and P90/P10 ratio of 1.94. Upload was considerably less dispersed, with a CV of 0.143 and P90/P10 ratio of 1.41. The Gini coefficients showed the same ordering: 0.196 for download, 0.176 for latency, and 0.079 for upload.
The agreement among the dispersion measures is useful. Download has the largest Gini coefficient and coefficient of variation, while latency is close behind on both measures. Upload is much more compressed across states regardless of whether inequality is summarized by the CV, P90/P10 ratio, or Gini coefficient. This consistency reduces the risk that the conclusion is an artifact of one inequality statistic. It also means that a national discussion focused only on average upload performance would miss the much larger interstate spread in downstream throughput and delay.
The relative magnitude of inequality should not be confused with the absolute quality of a metric. A lower Gini for upload does not mean that upload performance is necessarily adequate; it means only that state values are more similar to one another than they are for download or latency. Likewise, a high latency Gini describes dispersion in delay, not the technical cause of that delay. The inequality measures are therefore best interpreted as descriptions of interstate differentiation rather than service-quality thresholds.
| Metric | Mean | Median | IQR | CV | P90/P10 | Gini |
|---|---|---|---|---|---|---|
| Download | 32.28 | 26.59 | 13.17 | 0.381 | 2.212 | 0.196 |
| Upload | 15.82 | 15.91 | 3.90 | 0.143 | 1.408 | 0.079 |
| Latency | 70.65 | 62.81 | 24.31 | 0.347 | 1.937 | 0.176 |
The metrics were related but did not yield one interchangeable state hierarchy. Download and upload ranks were moderately correlated (rho = .520, p = .001), and higher download performance was associated with lower latency (rho = -.559, p < .001). Upload and latency were essentially unrelated (rho = .041, p = .812). This result demonstrates that weak mobile-broadband performance is not one uniform condition: a state can be disadvantaged in throughput without being unusually disadvantaged in responsiveness, or vice versa.
The cross-metric results reinforce the multidimensional interpretation. The moderate positive association between download and upload suggests that states with stronger downstream performance often, but not always, perform better upstream as well. The negative download-latency correlation indicates that higher-download states tend to experience lower delay. Yet the near-zero upload-latency relationship shows that one cannot infer responsiveness from upstream throughput. This matters for monitoring because a state may appear relatively satisfactory on one measure while repeatedly occupying a weak position on another.
These relationships also provide a reason not to replace the three measures with one composite score for the present research question. A composite can be useful for prioritization when weights are explicit, but it would hide the empirical fact that the metrics have only partial rank agreement. The aim here is to characterize inequality and recurrence by performance dimension, so retaining the components allows different forms of disadvantage to remain visible.
3.2State disparities persist across quarters
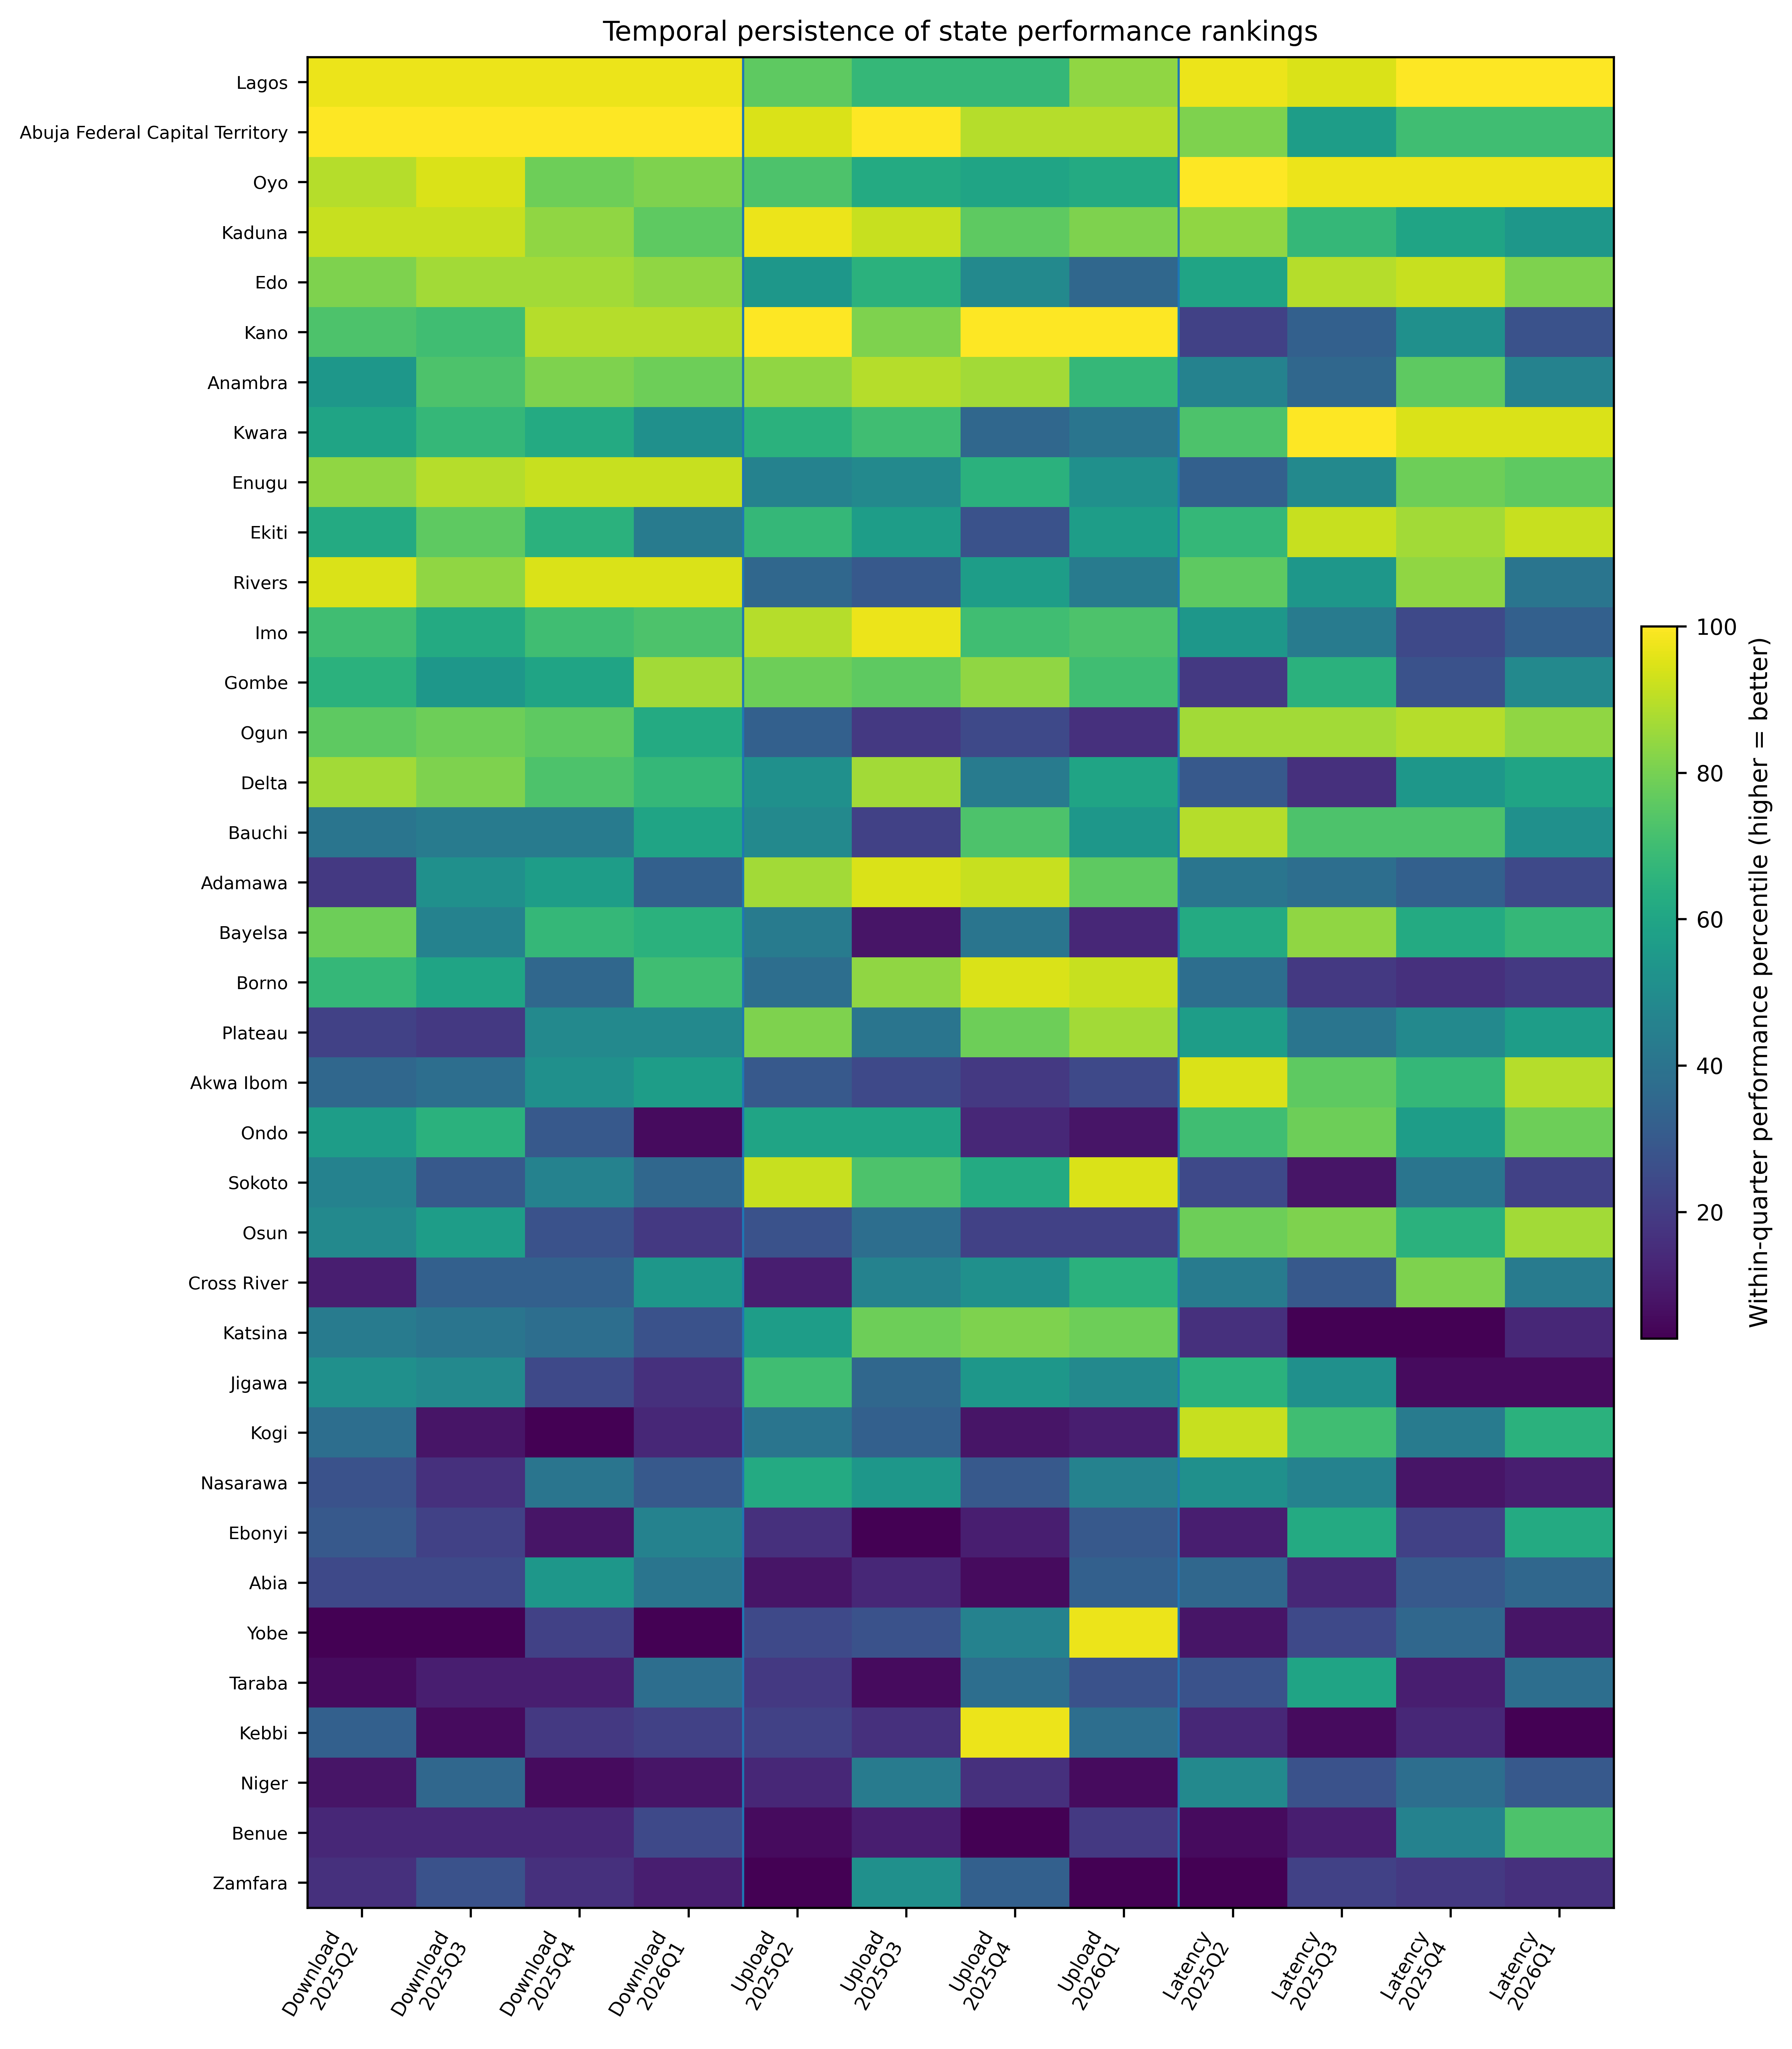
State rankings were strongly persistent through the four observed quarters. The six pairwise Spearman correlations ranged from 0.739 to 0.890 for download, 0.587 to 0.768 for upload, and 0.610 to 0.796 for latency. Kendall's W was 0.867 for download, 0.750 for upload, and 0.775 for latency; all three concordance tests were significant at p < .001. Download therefore showed the strongest temporal rank stability, but all three dimensions retained a substantial persistent component.
The size of the quarterly correlations indicates that persistence is not limited to one adjacent-quarter pair. Even the minimum correlations remain positive and statistically strong, particularly for download. Download therefore has the most stable state hierarchy, while upload and latency show more quarter-to-quarter movement but still retain substantial concordance. The all-quarter Kendall statistics confirm the same ordering: download is the most persistent, followed by latency and upload.
This pattern is important because the pooled inequality statistics alone cannot show whether the same states are repeatedly responsible for the observed spread. High concordance indicates that the national distribution is not being regenerated from a completely different ranking every quarter. In other words, the state inequalities have a durable component across the one-year window, even though individual state values can rise or fall between periods.
| Metric | Quarterly rho range |
Kendall W | Kendall p | Friedman chi-square |
Friedman p | ICC |
|---|---|---|---|---|---|---|
| Download | 0.739-0.890 | 0.867 | <0.001 | 7.09 | 0.069 | 0.836 |
| Upload | 0.587-0.768 | 0.750 | <0.001 | 1.51 | 0.680 | 0.620 |
| Latency | 0.610-0.796 | 0.775 | <0.001 | 4.17 | 0.244 | 0.610 |
The Friedman tests did not identify a statistically significant common quarter shift for download (p = .069), upload (p = .680), or latency (p = .244). This does not mean that state values were constant; rather, no single quarter produced a sufficiently uniform national shift across the 37 units. The mixed-effects models reinforce the persistence result. ICC values were 0.836 for download, 0.620 for upload, and 0.610 for latency, indicating that a substantial share of modeled variation was associated with persistent between-state differences rather than quarter-to-quarter movement within states.
The nonsignificant Friedman results complement rather than contradict the rank persistence. They indicate that there is no single quarter in which the state distributions collectively shifted enough in a common direction to produce a statistically significant repeated-measures effect. A system can therefore exhibit stable relative inequality without a significant uniform quarterly trend. This distinction is useful in broadband monitoring because policy attention may be warranted even when the national distribution is not clearly improving or deteriorating as a whole.
The mixed-model ICCs provide a third perspective. An ICC of 0.836 for download means that a large share of modeled log-download variation is associated with persistent between-state differences rather than residual within-state quarter variation. Upload and latency ICCs of 0.620 and 0.610 are lower but still indicate substantial state clustering of repeated observations. These values should not be read as causal shares attributable to infrastructure or policy, because unmeasured state characteristics can contribute to the random intercept. Their value is descriptive: repeated measurements from the same state tend to remain more alike than measurements drawn across different states.
3.3Persistent disadvantage and population exposure
Applying the three-of-four-quarter rule identified seven states persistently disadvantaged in download: Benue, Kebbi, Kogi, Niger, Taraba, Yobe, and Zamfara. Eight states were persistently disadvantaged in upload: Abia, Akwa Ibom, Benue, Ebonyi, Niger, Ogun, Osun, and Taraba. Six were persistently disadvantaged in latency: Borno, Katsina, Kebbi, Sokoto, Yobe, and Zamfara. The partial overlap across these lists again shows that persistent disadvantage is multidimensional rather than one common ranking.
The state lists show that persistent disadvantage is not concentrated in one identical group across all metrics. Benue and Taraba recur in both download and upload disadvantage; Kebbi, Yobe, and Zamfara recur in download and latency; and other states appear in only one dimension. The pattern therefore cannot be reduced to one universal set of poorly performing states. A state-level intervention or monitoring program that uses only one performance dimension could overlook a different recurring deficit visible in another part of the service experience.
The absence of any state persistently disadvantaged in all three dimensions is also informative. It suggests that the most severe recurring disadvantage in the observed period is multidimensional but not completely overlapping. That result is consistent with the cross-metric correlations: performance dimensions are related, yet each retains enough independence to produce a distinct adverse-tail geography.
| Category | No. states/FCT | Modeled population | Population share (%) |
|---|---|---|---|
| Persistent download disadvantage | 7 | 36,816,102 | 15.7 |
| Persistent upload disadvantage | 8 | 47,309,302 | 20.1 |
| Persistent latency disadvantage | 6 | 37,373,404 | 15.9 |
| At least one persistent dimension | 15 | 90,112,268 | 38.3 |
| At least two persistent dimensions | 6 | 31,386,540 | 13.4 |
Across performance dimensions, 15 states were persistently disadvantaged in at least one measure, representing 90.11 million people or 38.3% of the modeled national population. Six states – Benue, Kebbi, Niger, Taraba, Yobe, and Zamfara – were persistently disadvantaged in at least two dimensions and represented 31.39 million people, or 13.4% of the modeled population. No state was persistently disadvantaged in all three dimensions under the primary definition.
The population perspective changes the scale of interpretation. Fifteen states represent fewer than half of the 37 administrative units, yet together they contain more than 90 million people in the WorldPop model. Similarly, the six states persistently disadvantaged in at least two dimensions account for more than 31 million people. These figures do not establish how many residents personally experience poor mobile broadband, but they show that the recurring state-level conditions are associated with substantial population concentrations rather than geographically marginal areas alone.
The ecological nature of the result is especially important. State averages conceal within-state heterogeneity, and many residents may use different operators, technologies, devices, and service plans. The population totals should therefore be read as the number of people living within classified states, not as prevalence estimates for individual broadband deprivation. Even with that limitation, the figures are useful for communicating the potential social reach of persistent geographic performance differences.
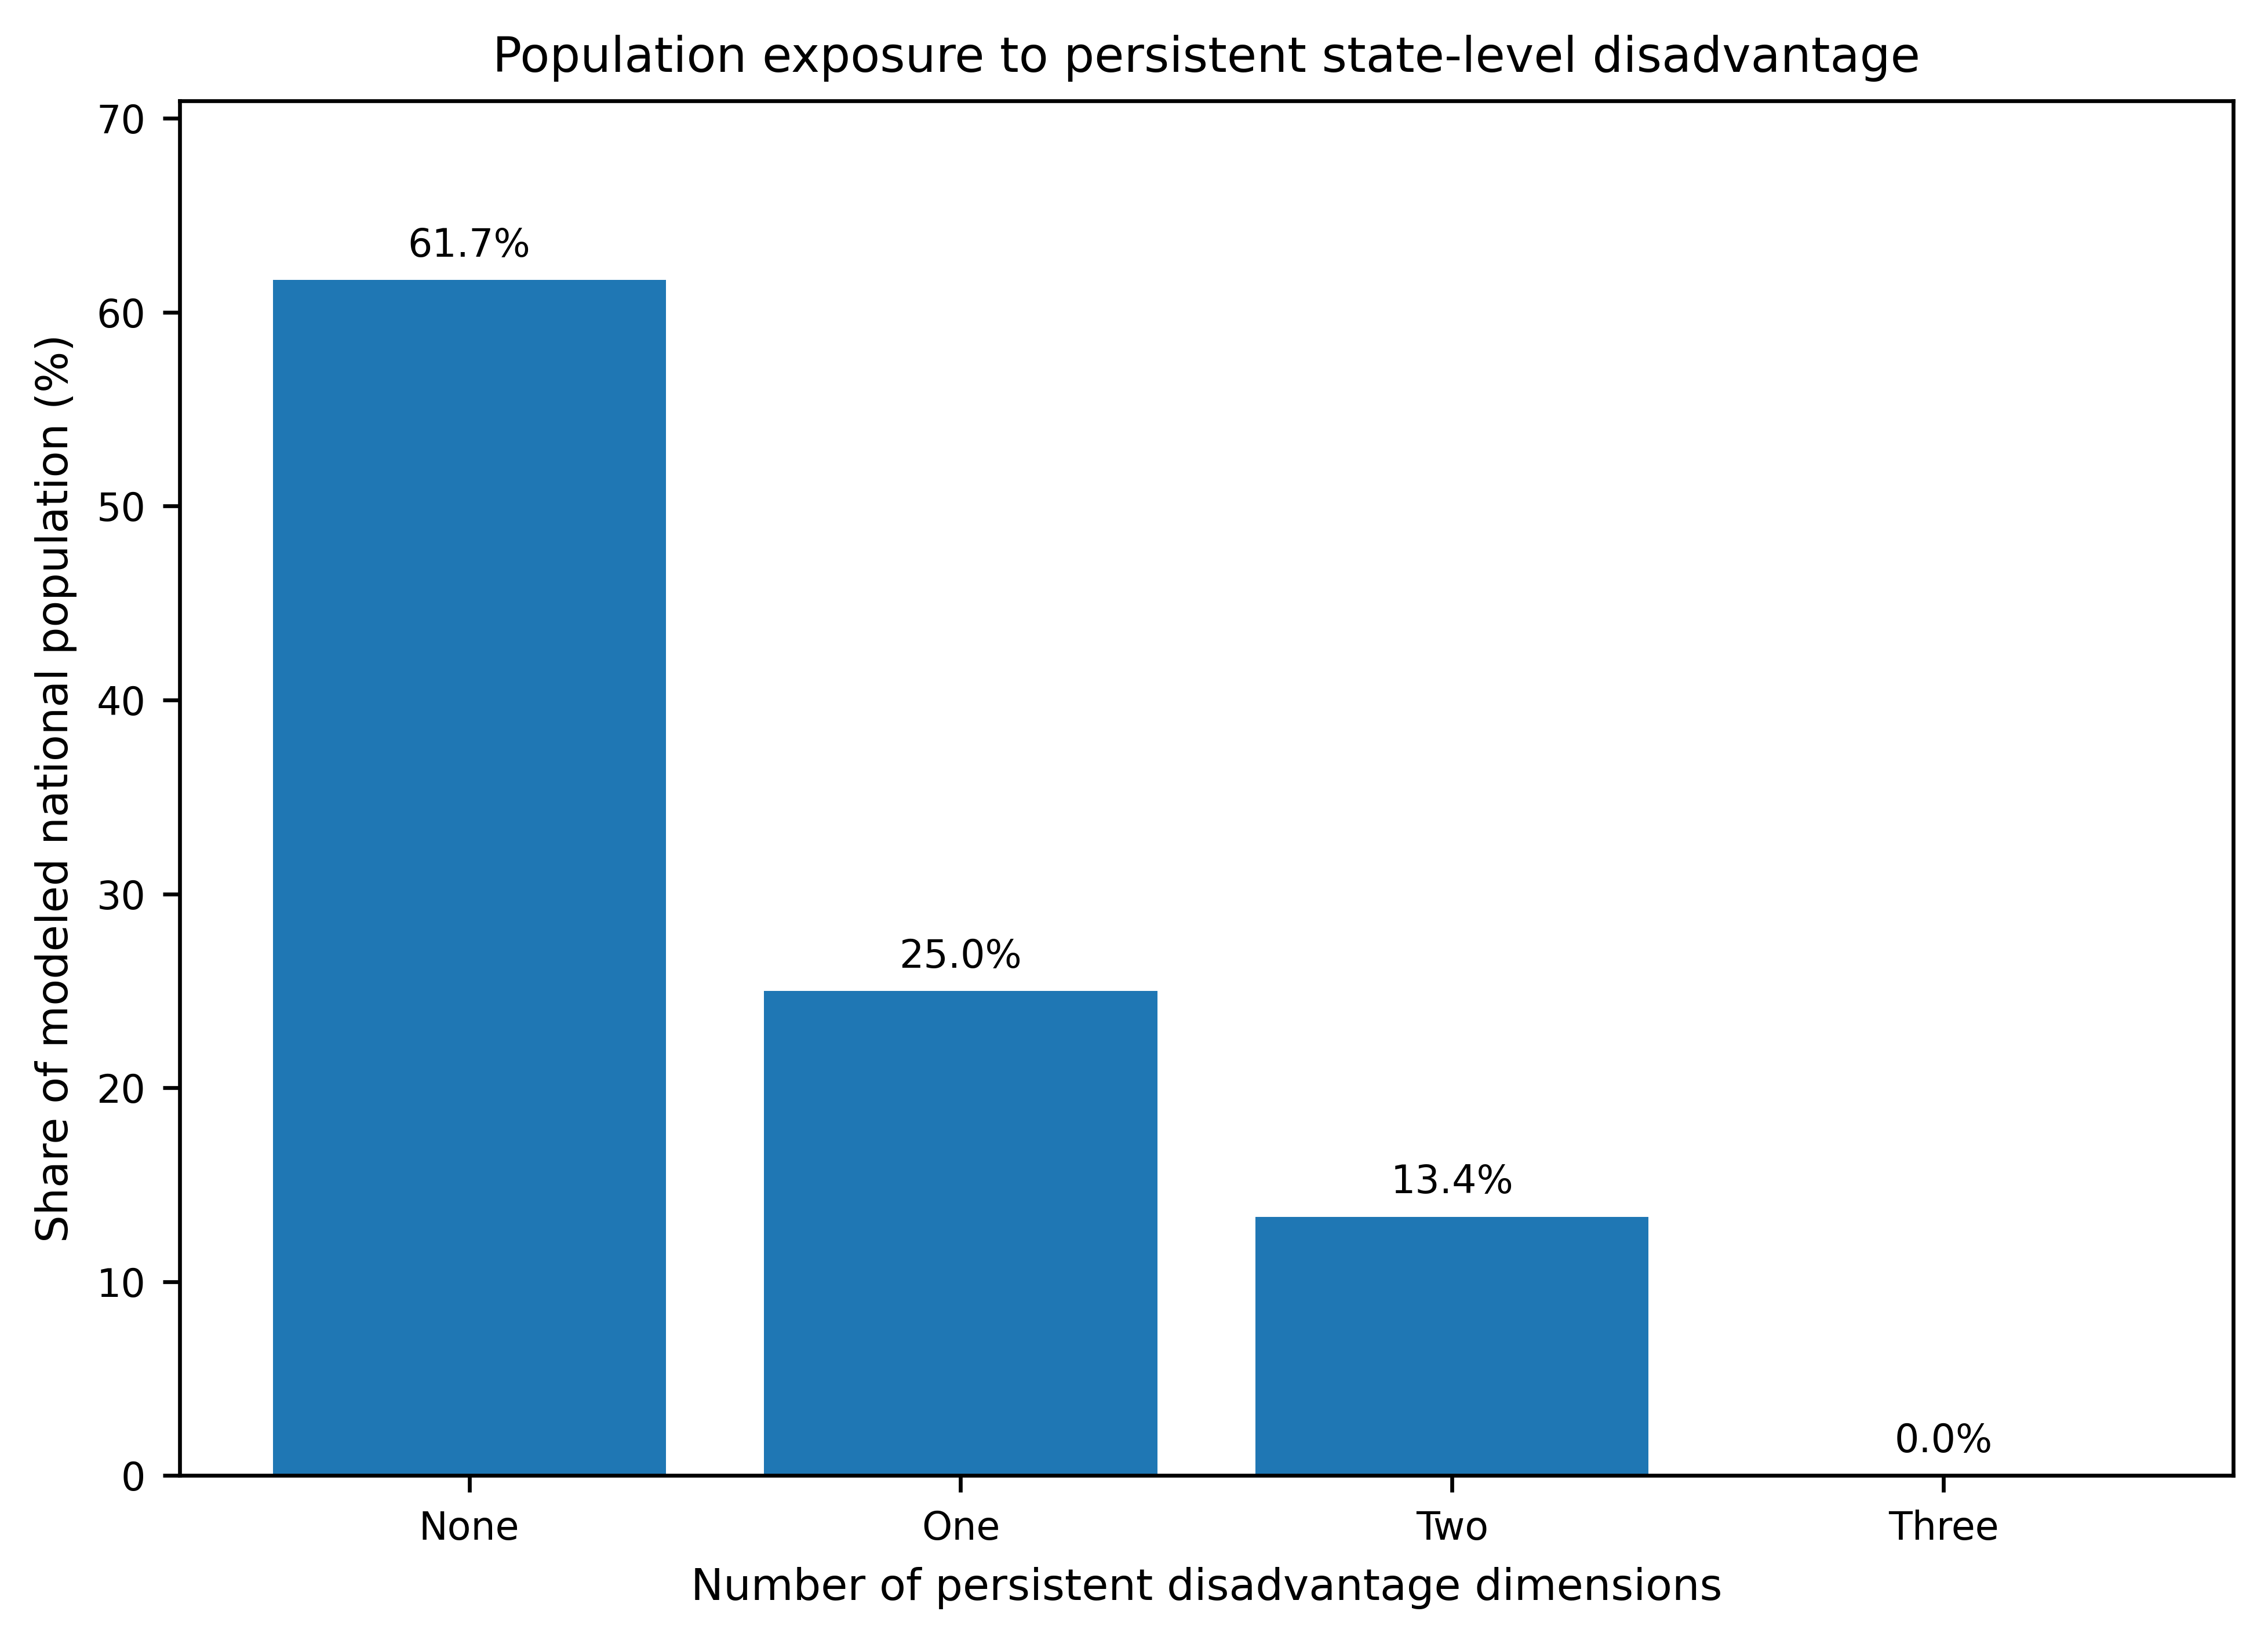
The population result remained substantively similar when the adverse-tail threshold changed. With a narrower 20% tail, 10.1% of the modeled population lived in states persistently disadvantaged in at least two dimensions; under the primary 25% threshold the share was 13.4%; and under a broader 33% threshold it was 17.2%. Device- and test-weighted state rankings were also strongly correlated for download (rho = .933), upload (rho = .893), and latency (rho = .976), and paired Wilcoxon tests did not indicate systematic shifts between the two estimators.
The monotonic movement across thresholds is expected because a broader adverse tail classifies more states as disadvantaged. What matters for robustness is that the central conclusion survives: under all three specifications, a meaningful share of the modeled population resides in states experiencing recurring disadvantage in at least two performance dimensions. The sensitivity analysis therefore supports the interpretation that multidimensional persistence is not created solely by the 25th/75th percentile convention.
4Discussion
The analysis shows that state-level mobile-broadband inequality in Nigeria is both multidimensional and persistent. Download and latency are markedly more dispersed than upload, while the weak relationship between upload and latency demonstrates that poor performance cannot be represented adequately by one generic ranking. This is consistent with the broader shift from access-based digital-divide measurement toward assessment of realized service quality [1–4].
The first implication is conceptual. Digital inequality should not be treated only as a binary access problem or as a one-dimensional speed problem. The observed state distributions show that download, upload, and latency have different degrees of dispersion and only partial agreement in their state rankings. This extends the quality-divide perspective [1] by showing that the quality divide itself has multiple technical dimensions. A state can occupy the adverse tail repeatedly for one measure without doing so for another, which means that policy claims about 'poor broadband' should specify what aspect of performance is poor.
The results also show why one-period maps are insufficient for describing persistent inequality. Crowdsourced measurements can change because of who tests, when they test, and what network conditions are present [7], [9–12]. Yet the state hierarchy observed here remains substantially concordant across four consecutive quarters, and the mixed-effects models independently point to a strong between-state component. The evidence therefore supports a claim of one-year persistence in relative state disadvantage, not merely a collection of quarterly anomalies.
The temporal results are especially important because they distinguish recurring disparity from a one-period anomaly. High Kendall concordance and mixed-model ICC values show that states tend to remain in broadly similar relative positions across the four quarters, even though the analysis does not find a common national quarter effect. Crowdsourced measurements can vary with participation and network conditions [9–12], but the persistence of relative state positions indicates that the main inequality pattern is not being generated solely by one unusual measurement period.
For monitoring systems, persistence can be more actionable than one-time severity. A state that appears in the lower tail once may warrant observation; a state that appears there in three of four quarters warrants a different level of attention because its relative disadvantage survives repeated measurement periods. This does not by itself identify the technical cause or justify a specific investment, but it provides a stronger empirical basis for deciding where more detailed diagnostic work should be concentrated.
The use of several temporal statistics also guards against overinterpreting a single method. Rank correlations and Kendall's W emphasize relative ordering; the Friedman test addresses a common temporal shift; the ICC addresses variance structure. Their combined message is coherent: the year is characterized more by durable interstate differences than by a uniform national quarterly movement. That convergence strengthens the persistence interpretation while remaining appropriately descriptive.
Population exposure provides a different perspective from counting states. Fifteen persistently disadvantaged states represent 38.3% of the modeled population, and the six states disadvantaged in at least two dimensions account for 13.4%. These are ecological quantities, not individual prevalence estimates. WorldPop indicates the modeled population residing within classified administrative units; it does not identify subscribers, devices, operators, or individual experiences. Even with that limitation, population context helps distinguish a recurring deficit affecting a small geographic unit from one associated with a much larger social scale.
Population context is not an intervention ranking. A populous state may contain many people but also substantial internal variation, while a smaller state may contain communities with very severe conditions. The present analysis therefore stops at describing the scale associated with recurring disadvantage. Actual infrastructure prioritization would require additional evidence on deployment cost, existing assets, operator incentives, spectrum, affordability, traffic demand, local geography, and the policy objective being optimized.
Nevertheless, the exposure estimates address an important communication problem. Reporting that six states are persistently disadvantaged in at least two dimensions gives no indication of their demographic scale. Reporting that those states contain approximately 31.4 million people, or 13.4% of the modeled national population, makes clear that the phenomenon is not numerically trivial. The figure remains ecological, but it provides a more policy-relevant sense of magnitude than a state count alone.
The findings have several monitoring implications. First, national averages should be accompanied by repeated subnational reporting. Second, download, upload, and latency should remain visible as separate indicators because they identify different persistent disadvantages. Third, public speed-test evidence should be complemented by regulator measurements, operator reporting, targeted field tests, and improved sampling where observation density is low. Finally, population exposure should be used to describe the scale of recurring disadvantage, not automatically as an intervention ranking. Investment decisions require additional information on cost, infrastructure feasibility, existing assets, spectrum, demand, and policy objectives.
A practical national monitoring framework could therefore report at least three layers of evidence: the national performance distribution, state-level component measures, and persistence indicators showing whether weak positions recur. Such reporting would make it harder for a national average to obscure a durable state-level problem and would allow download, upload, and latency deficits to be interpreted separately. Because the public speed-test sample is observational, measurement volume and uncertainty should accompany these indicators rather than being hidden behind point estimates.
Crowdsourced measurements are particularly useful as a screening layer because they are repeated, geographically broad, and available independently of operator reporting. Their limitations mean they should complement rather than replace regulator measurements, operator telemetry, drive tests, and controlled engineering diagnostics. Persistent adverse placement in public measurements can identify where those more expensive sources of evidence would be especially valuable.
Several limitations constrain interpretation. Ookla observations are self-selected rather than probability sampled. Device weighting and estimator sensitivity checks do not correct all differences in who tests, where they test, or which service plan and device they use. State averages conceal within-state rural-urban, operator, and neighborhood variation. The four-quarter window supports a claim of one-year persistence rather than long-term permanence. The analysis identifies recurring patterns, not causal mechanisms.
A second limitation is geographic aggregation. State means can conceal urban-rural differences, metropolitan concentration, local congestion, operator-specific coverage, and neighborhoods with much stronger or weaker performance than the state average. The population-exposure estimates inherit this limitation because every resident of a classified state is counted as living within that administrative condition even though individual experiences vary. Future work should move to finer geographic units where observation density permits.
Third, the persistence window covers four consecutive quarters. This is sufficient to distinguish repeated one-year disadvantage from a single snapshot, but it does not establish long-run permanence. Network upgrades, new spectrum, changing demand, device adoption, and infrastructure investment can change state positions over longer periods. Extending the same framework across several years would allow researchers to distinguish persistent structural disadvantage from medium-term convergence or deterioration.
Fourth, the adverse-tail definition is relative to the observed Nigerian state distribution. It identifies repeated national disadvantage rather than failure to meet a regulatory or application-specific threshold. This makes the method useful for inequality analysis, but it means a state can improve in absolute terms and still remain in the adverse tail if other states improve faster. Future work could compare the relative classification with explicit service standards or application-based thresholds where appropriate.
Finally, the study describes patterns rather than causes. Income, urbanization, electricity reliability, operator investment, spectrum holdings, terrain, demand, backhaul, and other factors may contribute to the observed differences. Establishing causal mechanisms would require additional explanatory variables and a different research design.
5Conclusion
Four consecutive quarters of crowdsourced mobile measurements show that Nigeria's state-level broadband inequality is not a single phenomenon. Download and latency are more unequal across states than upload, the three metrics produce different state orderings, and relative positions persist through repeated measurement periods.
The persistence becomes more consequential when population context is added. More than one-third of the modeled national population resides in a state persistently disadvantaged in at least one performance dimension, and about one in eight resides in a state disadvantaged in at least two. These figures should not be interpreted as individual user prevalence, but they demonstrate that recurring state-level performance disadvantage is associated with substantial population concentrations.
The principal implication is that broadband monitoring should move beyond one-period national averages. Repeated subnational measurement, multiple performance dimensions, explicit treatment of crowdsourced-data limitations, and population context together provide a more informative account of digital inequality.
The study therefore contributes a simple but important shift in emphasis: mobile-broadband inequality should be evaluated not only by how far apart states are at one moment, but by whether the same states repeatedly occupy disadvantaged positions and by how many people live within those recurring geographies. This persistence-and-exposure perspective complements conventional national benchmarking without turning observational speed-test data into a claim of individual prevalence.
For Nigeria, the immediate research priority is to continue repeated subnational measurement and to investigate the states that recur across multiple disadvantage dimensions with independent engineering and socioeconomic data. For other countries with similar crowdsourced measurement coverage, the same analytical sequence—component-wise inequality, repeated-quarter persistence, adverse-tail recurrence, and ecological population context—provides a reproducible way to distinguish transient variation from geographically persistent performance inequality.
Funding
No external funding was received for this research.
Conflict of interest
Conflict of interest: The authors declare no competing interests.
Data availability
Ookla mobile performance data, geoBoundaries Nigeria ADM1 boundary data, and WorldPop 2025 population data are publicly available from their respective providers. The analysis uses only aggregated secondary data and can be reproduced from the identified source products and procedures described in the Methods.
References
- [1]Vicente MR, Gil-de-Bernabe F. Assessing the broadband gap: From the penetration divide to the quality divide. Technological Forecasting and Social Change. 2010;77(5):816–822. https://doi.org/10.1016/j.techfore.2009.12.006
- [2]Frias Z, Lehr W, Stocker V, Mendo L. Measuring mobile broadband: Challenges and implications for policymaking. In: 32nd European Conference of the International Telecommunications Society; 2023; Madrid, Spain. https://hdl.handle.net/10419/277959
- [3]Frias Z, Lehr W, Stocker V. Building an ecosystem for mobile broadband measurement: Methods and policy challenges. Telecommunications Policy. 2025;49(5):102905. https://doi.org/10.1016/j.telpol.2025.102905
- [4]Jembre YZ, Jung WY, Attique M, Paul R, Kim B. Mobile broadband performance evaluation: Analysis of national reports. Electronics. 2022;11(3):485. https://doi.org/10.3390/electronics11030485
- [5]Gallardo R, Whitacre B. An unexpected digital divide? A look at internet speeds and socioeconomic groups. Telecommunications Policy. 2024;48(6):102777. https://doi.org/10.1016/j.telpol.2024.102777
- [6]Janc K, Ilnicki D, Jurkowski W. Spatial regularities in Internet performance at a local scale: The case of Poland. Moravian Geographical Reports. 2022;30(3):163–178. https://doi.org/10.2478/mgr-2022-0011
- [7]Lee H, Paul U, Gupta A, Belding E, Gu M. Analyzing disparity and temporal progression of Internet quality through crowdsourced measurements with bias-correction. arXiv [Preprint]. 2023. https://doi.org/10.48550/arXiv.2310.16136
- [8]Gozzi N, Comini N, Perra N. Bridging the digital divide: Mapping Internet connectivity evolution, inequalities, and resilience in six Brazilian cities. EPJ Data Science. 2024;13:69. https://doi.org/10.1140/epjds/s13688-024-00508-8
- [9]Feamster N, Livingood J. Measuring internet speed: Current challenges and future recommendations. Communications of the ACM. 2020;63(12):72–80. https://doi.org/10.1145/3372135
- [10]MacMillan K, Mangla T, Saxon J, Marwell NP, Feamster N. A comparative analysis of Ookla Speedtest and Measurement Labs Network Diagnostic Test (NDT7). Proceedings of the ACM on Measurement and Analysis of Computing Systems. 2023;7(1):19. https://doi.org/10.1145/3579448
- [11]Paul U, Liu J, Gu M, Gupta A, Belding E. The importance of contextualization of crowdsourced active speed test measurements. In: Proceedings of the 22nd ACM Internet Measurement Conference; 2022. p. 274–289. https://doi.org/10.1145/3517745.3561441
- [12]Tripkovic S, Eller L, Svoboda P, Rupp M. Unbiased benchmarking in mobile networks: The role of sampling and stratification. IEEE Access. 2023;11:53772–53787. https://doi.org/10.1109/ACCESS.2023.3280828
- [13]Bronzino F, Feamster N, Liu S, Saxon J, Schmitt P. Mapping the digital divide: Before, during, and after COVID-19. In: TPRC48: The 48th Research Conference on Communication, Information and Internet Policy; 2021. https://doi.org/10.2139/ssrn.3786158
- [14]Akinlabi AA, Dahunsi FM. Mobile broadband quality of service analysis using host-based performance measurements. African Journal of Science, Technology, Innovation and Development. 2022;14(4):1083–1101. https://doi.org/10.1080/20421338.2021.1936887
- [15]Akinlabi AA, Dahunsi FM, Popoola JJ. Measuring mobile broadband quality of service in cellular networks: A case study of South West Nigeria. Journal of Electrical Engineering. 2026;12(1):1–14.
- [16]Dahunsi FM, Akinlabi AA. Measuring mobile broadband performance in Nigeria: 2G and 3G. Nigerian Journal of Technology. 2019;38(2):422–436. https://doi.org/10.4314/njt.v38i2.19
- [17]Umoh VB, Ubom EA, Umoh JB, Ekpe UM. A framework for a user-centric determination of mobile broadband performance in Nigeria. In: Proceedings of ICMEAS; 2021. p. 1–5. https://doi.org/10.1109/ICMEAS52683.2021.9692425
- [18]Umoh VB, Ukommi US, Ekpe UM. A comparative study of user experienced mobile broadband performance. Nigerian Journal of Technology. 2022;41(3):560–568. https://doi.org/10.4314/njt.v41i3.16
- [19]Yusuf SD, Isa SI, Kwaha BJ. Analysis of 4G/LTE network performance in North-Central Nigeria: A comprehensive drive test approach. Journal of Engineering Research and Reports. 2024;26(9):105–122. https://doi.org/10.9734/jerr/2024/v26i91267
- [20]Adeleke R. Digital divide in Nigeria: The role of regional differentials. African Journal of Science, Technology, Innovation and Development. 2021;13(3):333–346. https://doi.org/10.1080/20421338.2020.1748335
- [21]Runfola D, et al. geoBoundaries: A global database of political administrative boundaries. PLOS ONE. 2020;15(4):e0231866. https://doi.org/10.1371/journal.pone.0231866
- [22]Bondarenko M, et al. Constrained estimates of 2015–2030 total number of people per grid square at a resolution of 3 arc (approximately 100 m at the equator), R2025A version v1 [Data set]. WorldPop, University of Southampton; 2025. https://doi.org/10.5258/SOTON/WP00839
- [23]Tatem AJ. WorldPop, open data for spatial demography. Scientific Data. 2017;4:170004. https://doi.org/10.1038/sdata.2017.4