AI, GPS, ML & Smart College Bus Tracking System
Where Is My Bus? An AI-Based Smart College Bus Tracking and Arrival-Time Information System
Department of Computer Science and Engineering, Sanjay Ghodawat Institute, Atigre, Kolhapur, Maharashtra, India
Published November 2026
Abstract
Students who depend on college buses often have no reliable way to know where the bus is or when it will reach their stop. This paper presents Where Is My Bus?, a smart college bus tracking and management system designed as a single role-based mobile application with six modules: Student, Parent, Staff, Driver, Bus Coordinator and Admin. The driver’s smartphone supplies live GPS positions, which a Node.js/Express server validates, stores and serves to a Google Maps interface together with a last-updated indicator. Arrival time is estimated by a Random Forest regression model trained on historical trip data, with a route-distance and speed baseline used when data are insufficient. Firebase Cloud Messaging delivers stop alerts and SOS or breakdown notifications, while Lost & Found, report submission, bus-fee photo upload and route management support daily operations. The paper reviews smartphone-based, hardware-based and arrival-time-prediction studies on campus and public buses, identifies seven practical gaps, and maps each gap to a design decision. Because the system needs only a smartphone and software, it adds no per-bus hardware cost. Field results are not yet available; an evaluation plan based on mean absolute error (MAE), root mean squared error (RMSE) and update reliability is defined instead.
Keywords: College bus tracking; GPS; estimated time of arrival (ETA); Random Forest; React Native; mobile application; campus transportation
1Introduction
Buses are the main daily transport for many college students, yet a printed timetable becomes unreliable as soon as traffic, weather, boarding time or a route diversion changes a trip. Students wait at stops without knowing whether the bus has already passed, and parents have no simple way to confirm that the bus is on its way. Earlier work has approached this problem from three directions: predicting arrival time from the historical running speed of each route section [1], learning travel time with machine-learning models [2], and building smartphone applications that show the bus on a map [3–7].
This paper presents Where Is My Bus?, a smart college bus tracking and management system. A single role-based Android application built with React Native serves students, parents, staff, drivers, bus coordinators and administrators. The driver’s phone shares its GPS position, a Node.js/Express server validates and stores each update, and passengers see the bus on a map together with the time of the last update and an estimated time of arrival (ETA).
The contributions of this work lie in system design, and no new algorithm is proposed: (i) one application that covers all six user roles; (ii) explicit handling of stale or missing location data, so that an old position is never shown as live; (iii) an ETA module that uses a Random Forest model with a transparent distance–speed baseline as fallback and benchmark; (iv) stop alerts and SOS/breakdown notifications without extra hardware; and (v) a repeatable evaluation plan with stated metrics.
Section 2 states the problem and objectives. Section 3 reviews related work and derives the research gaps. Sections 4–6 describe the proposed system, its workflow and the ETA methods. Sections 7–9 cover requirements, testing and security, and Sections 10–12 give limitations, future scope and the conclusion.
2Problem statement and objectives
The problem addressed is the lack of accessible, timely information about a college bus’s location and its likely arrival at a selected stop. A useful solution must present the latest location clearly, show when that location was last updated, and avoid presenting an uncertain ETA as a guaranteed arrival time. The objectives are to:
- 1. show the available buses and routes;
- 2. display the latest received bus location on a map;
- 3. provide route and stop details;
- 4. compute an indicative ETA when adequate data exist;
- 5. handle missing or stale location updates explicitly;
- 6. send stop, delay and emergency alerts;
- 7. support Lost & Found, report submission, bus-fee photo upload, route management and administrative reports; and
- 8. protect location data and restrict operator functions to authorised users.
3Related work
3.1Smartphone-based campus tracking applications
Several recent campus applications track buses with the phone’s own GPS instead of dedicated hardware. Bussin, developed at UiTM, follows a mobile application development lifecycle and offers destination search, a list of buses with their ETA and a bus-capacity notice; its preliminary survey of 26 students reported frequent waiting and full buses as the main problems [3]. The paper presents interface prototypes but does not explain how the ETA is computed. The UTHM bus tracking application is built with Flutter, Firebase and the Google Maps API using the waterfall model, and received positive responses in a ten-question user-acceptance survey of 20 users [4].
Shuttle Stalk, developed for INTI International College, adds shuttle booking, self-marked attendance, push notifications and an emergency report when a driver cancels or ends a journey early. Its driver app stores a new location each time the shuttle moves 100 m, and a usability test with eight participants produced requests such as a route polyline on the map [5]. The Campus Shuttle Tracker of Universitas Negeri Semarang is a Laravel web application that uses smartphone GPS and provides tracking, a drop-off list, seat-availability status, notifications and user reports; an internal ISO 9126 test scored 91.6%, although the authors state that the tracking algorithm still needs refinement before production use [6]. UMS HopIn! has separate student, driver and administrator applications; the driver app uploads the bus location every 5 s, passengers download it at the same interval, and a meCUE evaluation with 20 users rated usefulness at 6.65 and usability at 6.32 out of 7 [7].
3.2Hardware-based and IoT tracking systems
Other systems rely on devices fitted to the bus. Sridevi et al. connect GPS and GSM modules to a microcontroller [8]; Hing and Lee combine RFID with a linear-regression ETA model and the Blynk IoT application [9]; and an Android-based college-bus system stores positions from a GPS module and an ESP8266 Wi-Fi module in Firebase [10]. Prashanth et al. mount a GPS device on the bus and show its position in a Kotlin application with Google Maps for students, staff, guardians, administrators and emergency personnel; the device, server integration and field behaviour were tested, but no ETA error is reported [11]. Rekkawar et al. use a NodeMCU ESP8266 with Firebase or Blynk and add eye-blink, alcohol, ultrasonic and weight sensors for driver-safety alerts and load monitoring [12].
Kumar et al. combine the driver’s phone GPS with a dedicated NodeMCU GPS module as a backup and add a pattern-based chatbot for route and schedule questions; their results are described qualitatively [13]. Vahan Samvedak adds an emergency button, passenger counting, driver face authentication and drowsiness detection on Raspberry Pi-class hardware at an estimated cost of about ₹20,000 per bus, and reports GPS accuracy within 2.5 m, alerts in under two seconds, 99.2% uptime and a 68% reduction in student waiting time in a five-bus campus test [14]. These works show the value of safety and monitoring features, but each depends on per-bus hardware that must be bought, powered and maintained. The present project keeps such hardware out of scope and uses the driver’s smartphone instead.
3.3Mobile and cloud-based tracking
A scalable design for public buses uses internet-enabled devices already on board, or a simple Android tablet, to send location data, exposes the data through REST APIs to an Android application, SMS service or web portal, and proposes an MQTT back end as a lighter alternative to HTTP REST [15]. A cloud-based IoT bus-tracking system provides location and arrival time through a mobile application and adds online ticketing and seat booking [16]. Together, these works support the use of a phone-class device on the bus, a cloud-hosted back end and a passenger mobile application.
3.4ETA prediction methods
Meng et al. predict campus-bus arrival with a piecewise method: the historical average speed of each route section estimates the time spent in that section, the section times are summed, and the speeds are updated by exponential smoothing so that recent trips carry more weight; 14 predicted and actual arrival times from a prototype were judged to be within an acceptable range [1]. A university shuttle study applies artificial neural network (ANN) and support vector machine (SVM) models to 40,460 GPS points, finds that the ANN performs better, uses a Random Forest to select the five most useful input features, and adds a route recommender with fuel-cost and emission estimates [2].
For public buses, Sinn et al. predict arrival times from real-time GPS measurements using kernel regression on data from Dublin [17]. Jeong and Rilett compare a historical-data model, regression models and ANN models on a Houston route and find that the ANN performs best [18]. Yu et al. use an SVM to predict baseline travel times and a Kalman filter to update them with the latest arrival data [19]. Other work combines k-NN input selection with Kalman filtering [20], learns spatial and temporal correlations with a spatial Kalman filter [21], or uses a time-space discretization approach that outperforms historical-average, regression and ANN methods [22].
Recent deep-learning work also uses GPS trajectories. Liu et al. propose a multi-scale, traffic-state gated attention LSTM trained on 8,834 GPS records from 293 trips of one route; it reaches an MAE of 0.762 min and a MAPE of 12.06%, and the authors note that validation on more routes is still needed [23]. Tigani proposes an LSTM that reconstructs missing positioning data and estimates optimistic and pessimistic arrival times from the Haversine distance, giving an ETA interval instead of a single value [24].
3.5Machine-learning and Random Forest approaches
Li builds a Random Forest model for bus 607 in Beijing using six factors: junction number, travel distance, date type, time period, precipitation and visibility, and reports a mean absolute percentage error (MAPE) of 20.43% with 800 trees [25]. Yu et al. propose a Random Forest based on near neighbours (RFNN) and compare it with linear regression, k-NN, SVM and a classic Random Forest on two routes, reaching a MAPE of 6.90% on one route [26]. Reda et al. use GPS data from Addis Ababa and find that the Random Forest gives the best accuracy among the models tested [27], and a study of shuttle arrival times in Istanbul reports that Random Forest outperforms the other methods and that distance, holiday and weather features improve accuracy [28].
Studies on archived GPS data also find that gradient boosting outperforms historical averaging and linear regression for stop arrival times [29], predict dwell and running segments with separate models [30], or apply a hybrid LSTM to GPS-derived run and dwell times [31]. Taken together, these studies suggest that ETA quality depends on route geometry, timestamp quality, historical coverage and the prediction horizon, and that a model tuned on one network cannot be assumed to perform equally well on another. For a student prototype, a transparent baseline should therefore be evaluated alongside the Random Forest model.
3.6Comparative summary
Table 1 summarises the reviewed systems by location source, ETA method and the evaluation each paper actually reports. The campus applications mostly report user-satisfaction or functional results, whereas the ETA studies report prediction error but are not packaged as college applications.
| System | Location source / platform | ETA method and main features | Evaluation reported |
|---|---|---|---|
| Bussin (UiTM) [3] | Phone app prototype | Destination search, bus list with ETA, capacity notice; ETA method not described | Survey of 26 students |
| UTHM Bus Tracking [4] | Flutter, Firebase, Google Maps | Live bus location on map | Acceptance survey, 20 users |
| Shuttle Stalk (INTI) [5] | Driver phone; update every 100 m | Booking, attendance, push alerts, emergency report | Usability test, 8 participants |
| Campus Shuttle Tracker (UNNES) [6] | Smartphone GPS; Laravel web app | Tracking, drop-off list, seat status, reports | Internal ISO 9126 score 91.6% |
| UMS HopIn! [7] | Driver phone; 5-s updates | Live location, schedule/ETA, reservation, announcements | meCUE evaluation, 20 users |
| Prashanth et al. [11] | Dedicated GPS device | Tracking, ETA screen, five user groups; ETA method not described | Device, server and field tests; no ETA error |
| Rekkawar et al. [12] | NodeMCU with GPS and safety sensors | Tracking, driver-safety alerts, load sensing | Functional tests |
| Kumar et al. [13] | Phone GPS plus GPS module | ETA, stop alerts, chatbot, complaints | Qualitative results only |
| Vahan Samvedak [14] | Raspberry Pi-class hardware | Emergency alert, passenger count, face and drowsiness checks | Accuracy, uptime and wait-time figures (5 buses) |
| Meng et al. [1] | Driver phone GPS | Piecewise historical speed with exponential smoothing | 14 predicted vs. actual arrivals |
| Noor et al. [2] | Bus GPS (40,460 points) | ANN and SVM travel time; route recommender | ANN better than SVM |
| Liu et al. [23] | GPS trajectories, one route | Multi-scale gated attention LSTM | MAE 0.762 min, MAPE 12.06% |
| Tigani [24] | GPS positions | LSTM gap reconstruction, Haversine ETA interval | ETA interval estimates |
| Li [25] | Bus 607 data, Beijing | Random Forest on six factors | MAPE 20.43% (800 trees) |
| This work | Driver smartphone only | Random Forest ETA with baseline fallback, stale-data status, six roles, SOS alerts | Evaluation plan (MAE, RMSE, reliability); no results yet |
3.7Research gap
GPS-based tracking and ETA prediction are established approaches, so this work does not claim novelty in either. The following gaps are design opportunities for a college-scale application. They do not imply that every existing system lacks these features:
- 1. the application papers reviewed show a live map marker but do not describe how stale data are indicated;
- 2. several applications display an ETA without describing how it is computed [3, 11], while the ETA-prediction studies [1, 2, 23–25] are not packaged as a college application;
- 3. GPS-permission, network and invalid-data failures are rarely described;
- 4. route, stop and bus-assignment data must be maintained for the map and ETA to be correct;
- 5. evaluation is mostly by user surveys or functional tests [3–7], and ETA error against a baseline is rarely reported;
- 6. safety and capacity features frequently depend on per-bus hardware [12–14]; and
- 7. location data and operator accounts need access control and privacy protection.
Table 2 maps each gap to the solution adopted in this project.
| Gap | Solution in this project |
|---|---|
| Stale location looks live | Show last-update time and an explicit stale/offline status. |
| ETA may mislead or is not explained | Use route-aware distance; state the formula and features; label ETA as an estimate; hide it when data are insufficient. |
| GPS/network failures | Handle permission errors, retry safely, show “unavailable” instead of a false live position. |
| Route/stop mismatch | Admin module maintains validated routes, stop order and bus-route assignments. |
| No objective evaluation | Report update success, freshness, MAE and RMSE from real trips against a baseline. |
| Dependence on extra hardware | Use the driver’s smartphone only; no tracking device on the bus. |
| Security and privacy | HTTPS, authenticated users, role-based access, minimal data retention. |
4Proposed system
4.1Overview and user roles
The system is a single role-based mobile application; after login, each user sees only the functions of their role (Table 3). Live positions come from the driver’s smartphone, so no extra tracking hardware is required.
| Role | Main functions |
|---|---|
| Student | Select route/bus, view live map and ETA, set stop alerts, use Lost & Found, submit reports, upload bus-fee photo. |
| Parent | Follow the child’s bus, view ETA, receive arrival, delay and emergency alerts. |
| Staff | Track the bus on the assigned route, view ETA, use Lost & Found. |
| Driver | Start/stop a trip, share the phone’s GPS location, raise SOS or breakdown alerts. |
| Bus Coordinator | Monitor buses and trips on the live map; follow up on reports and Lost & Found entries. |
| Admin | Manage buses, routes, stops, assignments and users; review fee photos and reports. |
4.2Architecture
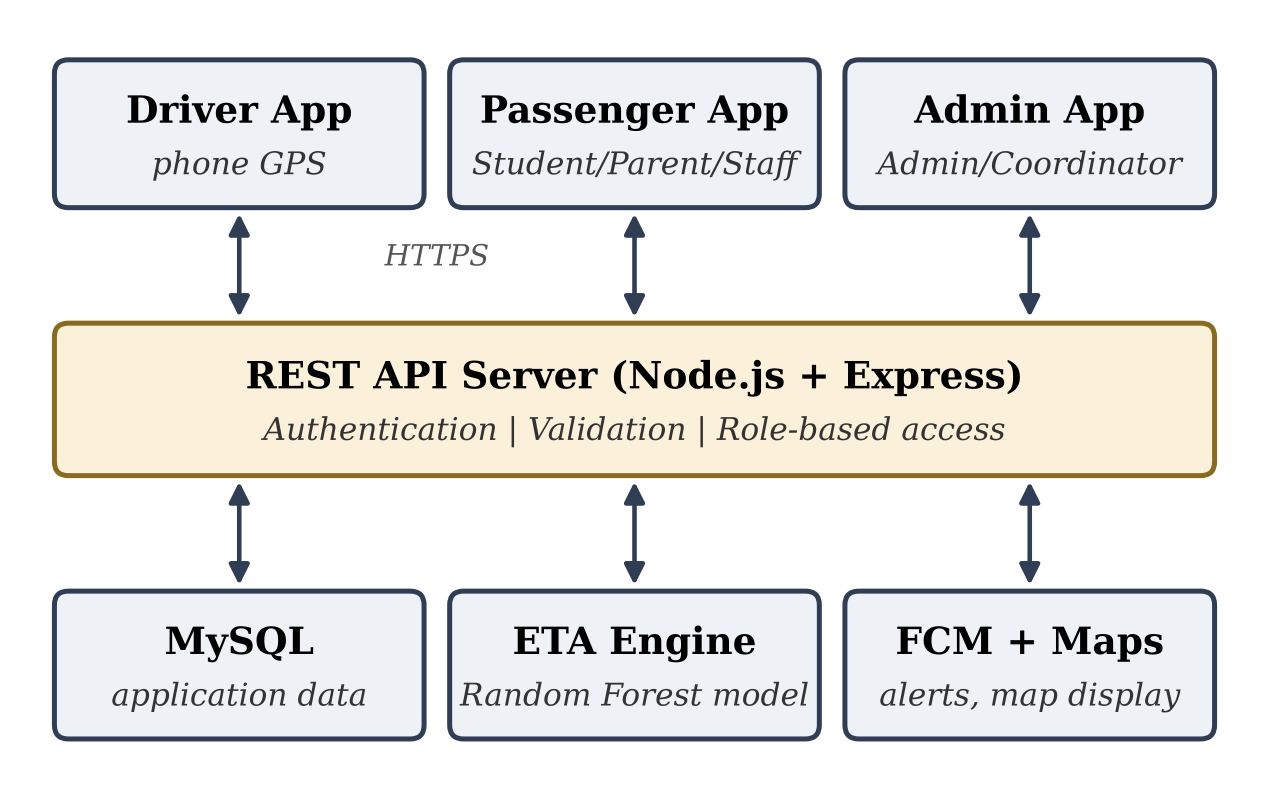
Figure 1 shows the architecture. The React Native client communicates over HTTPS with a Node.js/Express REST API that authenticates users, validates data and enforces role-based access. Application data are stored in a MySQL database. A Python/scikit-learn ETA engine uses stored trip history to estimate arrival times, Google Maps is used for map display, and Firebase Cloud Messaging (FCM) delivers push notifications.
4.3Location collection
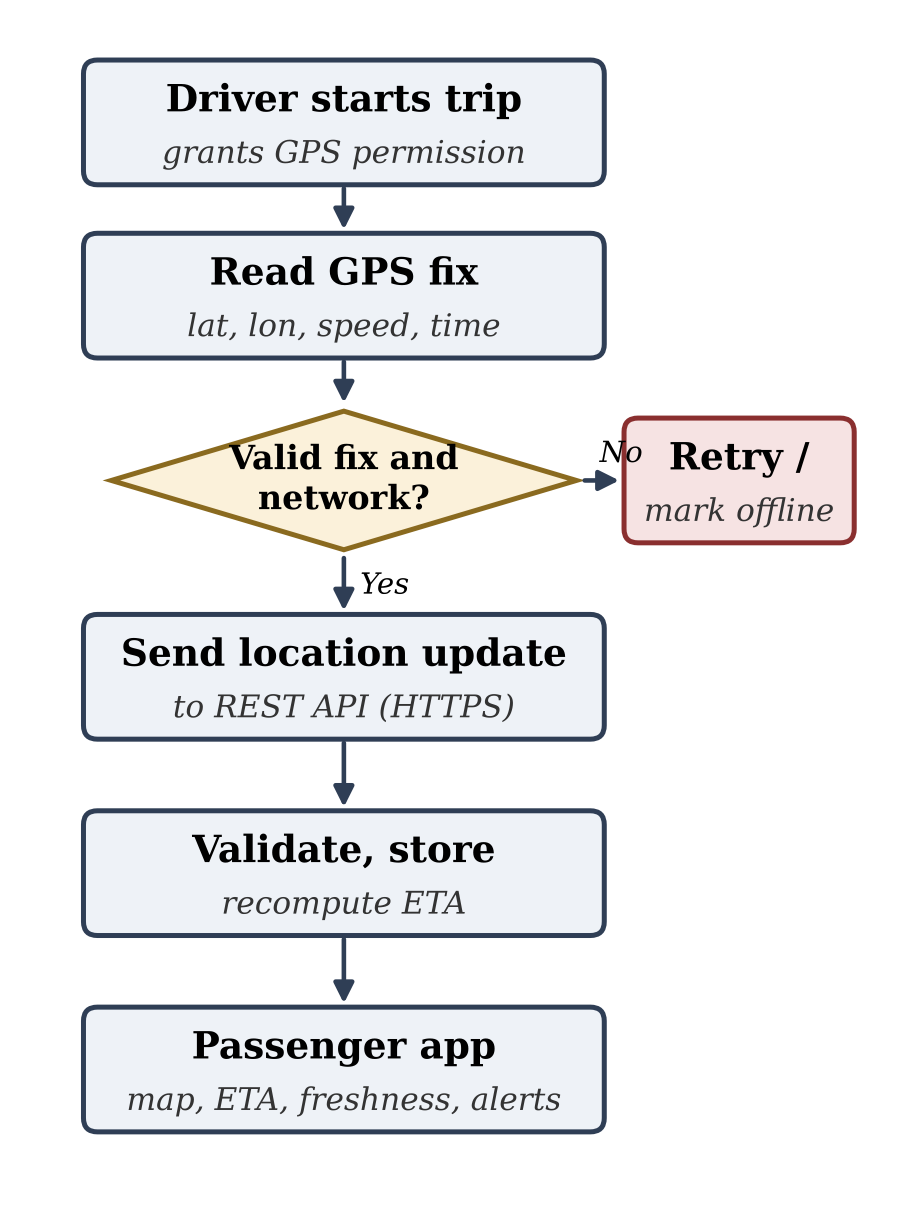
While a trip is active, the driver app periodically obtains latitude, longitude, speed and capture time and sends them with the bus identifier. The server rejects malformed or out-of-range coordinates and unknown bus identifiers. The update interval balances responsiveness, battery use and mobile-data cost. If the network or GPS is unavailable, the app reports an offline state instead of silently showing an old position as current.
4.4Back end and database
The back end accepts updates, checks their structure, stores the latest known position and serves authorised read requests. Core entities include User, Bus, Route, Stop, RouteStop, Trip, LocationUpdate, Report, LostFound, FeePhoto and Notification. Timestamps are stored in one consistent format, and the time a position was captured is kept separate from the time it was received by the server, which makes freshness and transmission delay measurable.
4.5Passenger interface and alerts
Students and parents select a route or bus, view its position, inspect stops and read the ETA. The map always shows the last-update time, and a warning such as “Location not updated recently” appears when the data are older than a configured threshold. Every ETA is labelled as an estimate and is hidden when its input data are too old or incomplete. FCM notifications inform users about approaching stops, delays and SOS or breakdown events.
4.6Lost & Found, reports and fee photo upload
The Lost & Found module lets users record lost and found items so that they can be matched. The report module lets users submit reports that the Bus Coordinator and Admin can review. With fee photo upload, a student uploads a photo of the bus-fee proof, which is stored on the server and can be viewed only by its owner and authorised roles.
5System workflow
Figure 2 shows the data flow from GPS capture to passenger display. The driver app obtains a location fix and checks coordinate validity and connectivity. A valid update is sent to the server, which verifies the sender, stores the record and recomputes the ETA. The passenger app then retrieves the latest position, ETA and freshness status. If a fix is invalid or the network is down, the app retries and the bus is shown as offline rather than live.
6ETA estimation methods
6.1Baseline distance–speed estimate
The baseline estimates the remaining time from the remaining route distance and an expected speed:
where Drem is the remaining distance measured along the bus route rather than the straight line, and Vexp is the expected speed taken from recent movement or historical segment speeds. Segment speeds can be refreshed by exponential smoothing so that recent trips carry more weight [1]. The method is easy to explain but degrades when traffic changes quickly or updates are sparse. It is used both as the fallback and as the benchmark for the learned model.
6.2Random Forest model
The AI-based ETA uses a Random Forest regressor, an ensemble of decision trees that handles non-linear relations and mixed tabular inputs with limited tuning; Random Forest models have performed well in several bus arrival-time studies [25–28]. The input features are remaining distance, current speed, hour of day, day of week, route and segment, and historical segment duration; the target is the time in seconds until arrival at the next stop. The model is trained with scikit-learn on historical trip records collected by the system. Training and test sets are separated by trip or by date, so that observations from one journey never appear in both sets, and the model is compared with the baseline and with linear regression.
6.3Evaluation metrics
ETA quality is measured with mean absolute error (MAE), root mean squared error (RMSE), which penalises large errors more strongly, and, where suitable, mean absolute percentage error (MAPE). Location freshness is the age of the latest update, and reliability is the fraction of expected updates actually received. Every reported result must state the number of trips, the route, the dates, the update interval, the train/test split and the baseline performance.
7Requirements
Functional: user registration and role-based login; route and bus selection; route and stop display; driver-side location transmission; server validation and storage; retrieval of the latest location; ETA shown only when available; stop, delay and SOS alerts; Lost & Found; report submission; bus-fee photo upload; admin management of buses, routes and users; and clear status messages for stale or missing data.
Non-functional: usability on common Android phones; reasonable response time; secure communication; controlled access to driver and admin functions; reliable handling of connectivity loss; maintainable route and stop data; and limited collection and retention of personal information.
8Testing and evaluation plan
Testing covers unit, integration, system and usability levels. Unit tests check coordinate parsing, timestamps, distance calculation and ETA logic. Integration tests confirm that a location captured on the driver’s phone reaches the database and the passenger app. System tests cover a moving bus, a stationary bus, GPS disabled, network disconnected, an invalid location, repeated updates, stale records and API failure. Usability tests ask users to find a route, identify a bus and interpret the ETA and the stale-location warning. Field trials on at least one known route record the actual arrival time and the ETA shown at fixed observation points. Representative test cases are listed in Table 4.
| Test case | Expected behaviour |
|---|---|
| Valid GPS update | Server accepts and stores the location with its timestamp. |
| No network | Client retries or shows offline state; never a false live status. |
| Old location record | Passenger screen marks the location as stale. |
| Unknown bus identifier | Server rejects the update with a controlled error. |
| Unauthorised user | Driver/admin functions are refused for other roles. |
| Fee photo upload | Image is stored and visible only to its owner and authorised roles. |
| ETA unavailable | App shows “ETA unavailable” instead of inventing a time. |
9Security and privacy
A bus-tracking system holds location and operational data that can reveal movement patterns. The design therefore uses HTTPS for all traffic, authenticates every user, and applies role-based access so that only drivers publish locations and only admins change routes. Passwords are stored as salted hashes, passenger location is not collected, unnecessary driver personal details are hidden, access to uploaded fee photos is restricted, and logs are kept only as long as needed for troubleshooting or approved analysis.
10Limitations
ETA accuracy depends on the amount and quality of historical trip data, and the model must be validated on the college’s own routes before its accuracy can be stated. GPS and ETA may be delayed by weak signal, network interruption, route diversion or missing history, and the system relies on the driver’s phone being charged, carrying mobile data and running the app. This paper describes the design and the evaluation method; measured field-trial results are not reported, and no accuracy figure is claimed.
11Future scope
Planned improvements include better ETA through more trip data and traffic-aware prediction. Once enough trips are recorded, sequence models such as the multi-scale LSTM of [23] can be compared with the Random Forest and the baseline, and ETA ranges instead of single values, as in [24], can be considered. Seat-availability information, which several campus applications provide [3, 5, 6], can be added once a driver-safe collection method is chosen, since manual accept/deny requests to a driver who is driving have been noted as hazardous [5]. A chatbot for route and schedule questions, as in [13], is another possible extension. Further work includes analytics dashboards for administrators, route-change and service-disruption alerts, accessibility and multilingual support, and expansion of the platform to multiple colleges.
12Conclusion
This paper presented Where Is My Bus?, a software-only, role-based mobile system for college bus tracking that combines live GPS location, a Random Forest ETA with a baseline fallback, push alerts and operational modules. It uses established tracking techniques in a college-scale design that needs only the driver’s smartphone, shows location freshness, handles failures explicitly, controls access and can be evaluated with clear metrics. The next step is to collect real trip data, run field trials, and report measured MAE and RMSE against the baseline.
Acknowledgment
The authors thank their project guide, Ms. Kajal Bohara, and the Department of Computer Science and Engineering, Sanjay Ghodawat Institute, Atigre, for their guidance and support.
References
- [1]Meng L, Li P, Wang J, Zhou Z. Research on the prediction algorithm of the arrival time of campus bus. In: Proceedings of the International Conference on Information Technology and Intelligent Manufacturing (ITIM). Atlantis Press; 2017. p. 31–33. https://doi.org/10.2991/itim-17.2017.8
- [2]Md Noor R, Rasyidi NBG, Nandy T, Kolandaisamy R. Campus shuttle bus route optimization using machine learning predictive analysis: A case study. Sustainability. 2021;13(1):225. https://doi.org/10.3390/su13010225
- [3]Mokhsin @ Misron M, Mohd Jais AN, Inche Zulkifli MDA, Ibrahim SNR, Ruzauddin NF, Nafrizan AN. Bussin: A bus tracker apps using mobile application development lifecycle model. Multidisciplinary Applied Research and Innovation. 2022;3(4):57–64. https://doi.org/10.30880/mari.2022.03.04.009
- [4]Jafni MIN, Mohd Zin NA. The development of UTHM bus tracking mobile application using an object-oriented approach. Applied Information Technology and Computer Science. 2023;4(2):1486–1502. https://doi.org/10.30880/aitcs.2023.04.02.084
- [5]Gonzales AT, Thamadharan K, Jothi N. Efficient campus shuttle tracking and management mobile application for college campus. In: Proceedings of the International Conference on Artificial Life and Robotics (ICAROB); 2024; Oita, Japan. p. 482–486.
- [6]Waskito D, Syarifah DF, Ardiansyah MI, Yassar AT, Brillian GA, Aprilianto RA, et al. Rancang bangun Campus Shuttle Tracker Universitas Negeri Semarang berbasis modul GPS smartphone. Edu Elektrika Journal. 2025;12(2):12–18.
- [7]Khamis N, Li KKK. User experience evaluation for a bus tracking apps in smart campus initiative. Bulletin of Electrical Engineering and Informatics. 2021;10(4):2254–2262. https://doi.org/10.11591/eei.v10i4.3112
- [8]Sridevi K, Jeevitha A, Kavitha K, Sathya K, Narmadha K. Smart bus tracking and management system using IoT. Asian Journal of Applied Science and Technology. 2017;1(2):148–150.
- [9]Hing JTU, Lee HJ. Development of bus tracking system using radio frequency identification (RFID) and artificial intelligence (AI) implementation. In: Proceedings of the IEEE Symposium on Industrial Electronics & Applications (ISIEA); 2024. https://doi.org/10.1109/ISIEA61920.2024.10607271
- [10]Athira Krishnan TR, Neha R, Sreehari C, Zenaani, Kishor KK, Balamurugan V. Android-based transport tracking and monitoring system. In: ICMEM 2023. AIJR Publisher; 2023.
- [11]Prashanth HS, Adithya M, Achyutha UN, Aditya V, Mudambi AM. Real-time transportation tracking: A GPS enabled mobile application framework. Int J Advanced Research in Computer and Communication Engineering. 2025;14(12):133–139. https://doi.org/10.17148/IJARCCE.2025.141220
- [12]Rekkawar A, Gedam A, Waghamare H. Implementation the college bus location tracking system using GPS for college student and developing Android application. International Journal of Engineering Research & Technology (IJERT). 2026;15(5):IJERTV15IS052757.
- [13]Ravi Kumar S, Arun Kumar Naik R, Mansoor P, Sravani G. Smart college bus tracking using hybrid GPS and AI chatbot. In: Proceedings of the 1st International Conference on Computational and Cognitive Systems Science (ICCCSS 2025). Vol. 3. SciTePress; 2025. p. 888–894. https://doi.org/10.5220/0014908600005024
- [14]Chauhan Y, et al. Vahan Samvedak: A comprehensive real-time college bus tracking and safety system. Scientific Reports. 2026;16:17770. https://doi.org/10.1038/s41598-026-48862-z
- [15]Scalable tracking system for public buses using IoT technologies. In: Proceedings of the International Conference on Emerging Trends & Innovation in ICT (ICEI); 2017; Pune, India. https://doi.org/10.1109/ETIICT.2017.7977019
- [16]Akter S, Islam T, Olanrewaju RF, Binyamin AA. A cloud-based bus tracking system based on internet-of-things technology. In: Proceedings of the 7th International Conference on Mechatronics Engineering (ICOM); 2019; Putrajaya, Malaysia. https://doi.org/10.1109/ICOM47790.2019.8952037
- [17]Sinn M, Yoon JW, Calabrese F, Bouillet E. Predicting arrival times of buses using real-time GPS measurements. In: Proceedings of the 15th International IEEE Conference on Intelligent Transportation Systems (ITSC); 2012; Anchorage, AK, USA. p. 1227–1232. https://doi.org/10.1109/ITSC.2012.6338767
- [18]Jeong R, Rilett LR. Prediction model of bus arrival time for real-time applications. Transportation Research Record. 2005;1927:195–204. https://doi.org/10.3141/1927-23
- [19]Yu B, Yang ZZ, Chen K, Yu B. Hybrid model for prediction of bus arrival times at next station. Journal of Advanced Transportation. 2010;44(3):193–204. https://doi.org/10.1002/atr.136
- [20]Kumar BA, Jairam R, Arkatkar SS, Vanajakshi L. Real time bus travel time prediction using k-NN classifier. Transportation Letters. 2019;11(7):362–372. https://doi.org/10.1080/19427867.2017.1366120
- [21]Achar A, Bharathi D, Kumar BA, Vanajakshi L. Bus arrival time prediction: A spatial Kalman filter approach. IEEE Transactions on Intelligent Transportation Systems. 2020;21(3):1298–1307. https://doi.org/10.1109/TITS.2019.2909314
- [22]Kumar BA, Vanajakshi L, Subramanian SC. Bus travel time prediction using a time-space discretization approach. Transportation Research Part C: Emerging Technologies. 2017;79:308–332. https://doi.org/10.1016/j.trc.2017.04.002
- [23]Liu R, Yin X, Zhou J, Ma C, Li C. A multi-scale traffic-state gated attention network for bus arrival time prediction. ICCK Transactions on Intelligent Systematics. 2026;3(3):196–208. https://doi.org/10.62762/TIS.2026.906270
- [24]Tigani S. Geo-statistics and deep learning-based algorithm design for real-time bus geo-location and arrival time estimation features with load resiliency capacity. AI. 2025;6(7):142. https://doi.org/10.3390/ai6070142
- [25]Li J. Bus arrival time prediction based on random forest. In: Proceedings of the 5th International Conference on Frontiers of Manufacturing Science and Measuring Technology (FMSMT 2017). Atlantis Press; 2017. p. 867–872. https://doi.org/10.2991/fmsmt-17.2017.167
- [26]Yu B, Wang H, Shan W, Yao B. Prediction of bus travel time using random forests based on near neighbors. Computer-Aided Civil and Infrastructure Engineering. 2018;33(4):333–350. https://doi.org/10.1111/mice.12315
- [27]Reda H, Mohapatra SK, Das TK, Dash SK. Electric bus arrival and charging station placement assessment using machine learning techniques. International Journal of Sustainable Engineering. 2024;17(1):1–17. https://doi.org/10.1080/19397038.2024.2333563
- [28]Coban S, Sanchez-Anguix V, Aydogan R. Predicting shuttle arrival time in Istanbul. In: Herrera F, Matsui K, Rodríguez-González S, editors. Distributed Computing and Artificial Intelligence. Advances in Intelligent Systems and Computing, vol. 1003. Cham: Springer; 2020. p. 44–51. https://doi.org/10.1007/978-3-030-23887-2_6
- [29][Reference details not supplied in the manuscript (gradient boosting for stop arrival times from archived GPS data); authors to provide.]
- [30][Reference details not supplied in the manuscript (separate models for dwell and running segments); authors to provide.]
- [31]Mansurova A, Mansurova A, Sakhipov A. Bus arrival time prediction via hybrid LSTM using GPS-derived run and dwell times. In: Proceedings of the 11th International Conference on Vehicle Technology and Intelligent Transport Systems (VEHITS). Vol. 1. SciTePress; 2025. p. 514–519. https://doi.org/10.5220/0013349200003941