Reliability and Advanced Engineering Methods
Advanced Engineering Management for Public Services: Strategic Planning for India’s Infrastructure Expansion, Asset Safety, Energy Efficiency, and Community Service Availability
Electrical Maintenance Division, Indian Institute of Technology Bombay, Powai, Mumbai, India
Published November 2026
Abstract
India is rapidly expanding infrastructure to support electrification, industry and industrialization, roads, water supply, agriculture, transport, sanitation, and other public services. As this investment creates a larger and more interconnected public asset base, its contribution to national development depends on safe operation, efficient use, reliable service, and timely maintenance. This paper develops an advanced engineering management framework that links service availability, asset safety, energy performance, condition monitoring, lifecycle cost, and long-range planning. It builds on the author's public-works concept note [1], whose core proposals are zone-wise service mapping, utility system inventories, integrated monitoring, a coordinating agency, cost comparison, future demand assessment, and a sample-village pilot. Drawing on digital utility management and procurement readiness approaches, the framework connects verified asset and service data to risk-based maintenance, coordinated work planning, efficient energy use, timely procurement, and future investment decisions. It proposes indicators for continuity, response, safety, energy, resource losses, maintenance, utilization, cost, and public feedback. Because the concept note provides no national baseline or measured outcome dataset, this paper does not claim quantified improvements. It instead shows how agencies can measure performance, protect asset safety, improve utilization of public investment, and test the approach through a pilot before scaling it.
Keywords: public works; engineering management; public utilities; service availability; street safety; energy efficiency; asset management; strategic planning
1Introduction
The planning baseline in this paper is qualitative: infrastructure investment is expanding across connected sectors, while agencies must protect public value throughout the asset lifecycle. The paper does not assign a national investment total or performance statistic because those figures are not present in the underlying concept note. It instead sets out a measurement-led management model for local and regional agencies to populate with verified asset, service, energy, cost, and safety records.
India's expanding economy is driving large-scale investment in electrification, industry, roads, water supply, agriculture support, transport, sanitation, and other public infrastructure. This expansion creates a long-lived public asset base whose value depends on safe operation, high utilization, energy-efficient performance, and timely maintenance. Public works and service agencies therefore need to manage infrastructure not only as construction output, but as an operating portfolio that supports planned national development and reliable community services. The underlying concept note identifies the essential service groups and assigns public works divisions responsibility for their development, planning, and maintenance [1].
Advanced engineering management offers a way to manage this complexity. It combines engineering design and operations with data governance, risk management, lifecycle costing, workforce planning, and public accountability. The management objective is not simply to install more infrastructure. It is to maintain reliable and accessible services, reduce avoidable hazards and resource losses, and prepare infrastructure for future demand and climate or technology changes.
This paper proposes a planning and delivery model for local and regional public agencies. It uses the concept note as the basis for the service scope and management concepts, then develops an implementation framework around three outcomes: dependable community service availability, safer streets and work zones, and lower energy and resource intensity. It also defines a phased strategy for learning from a small pilot before wider deployment.
2Conceptual basis and planning problem
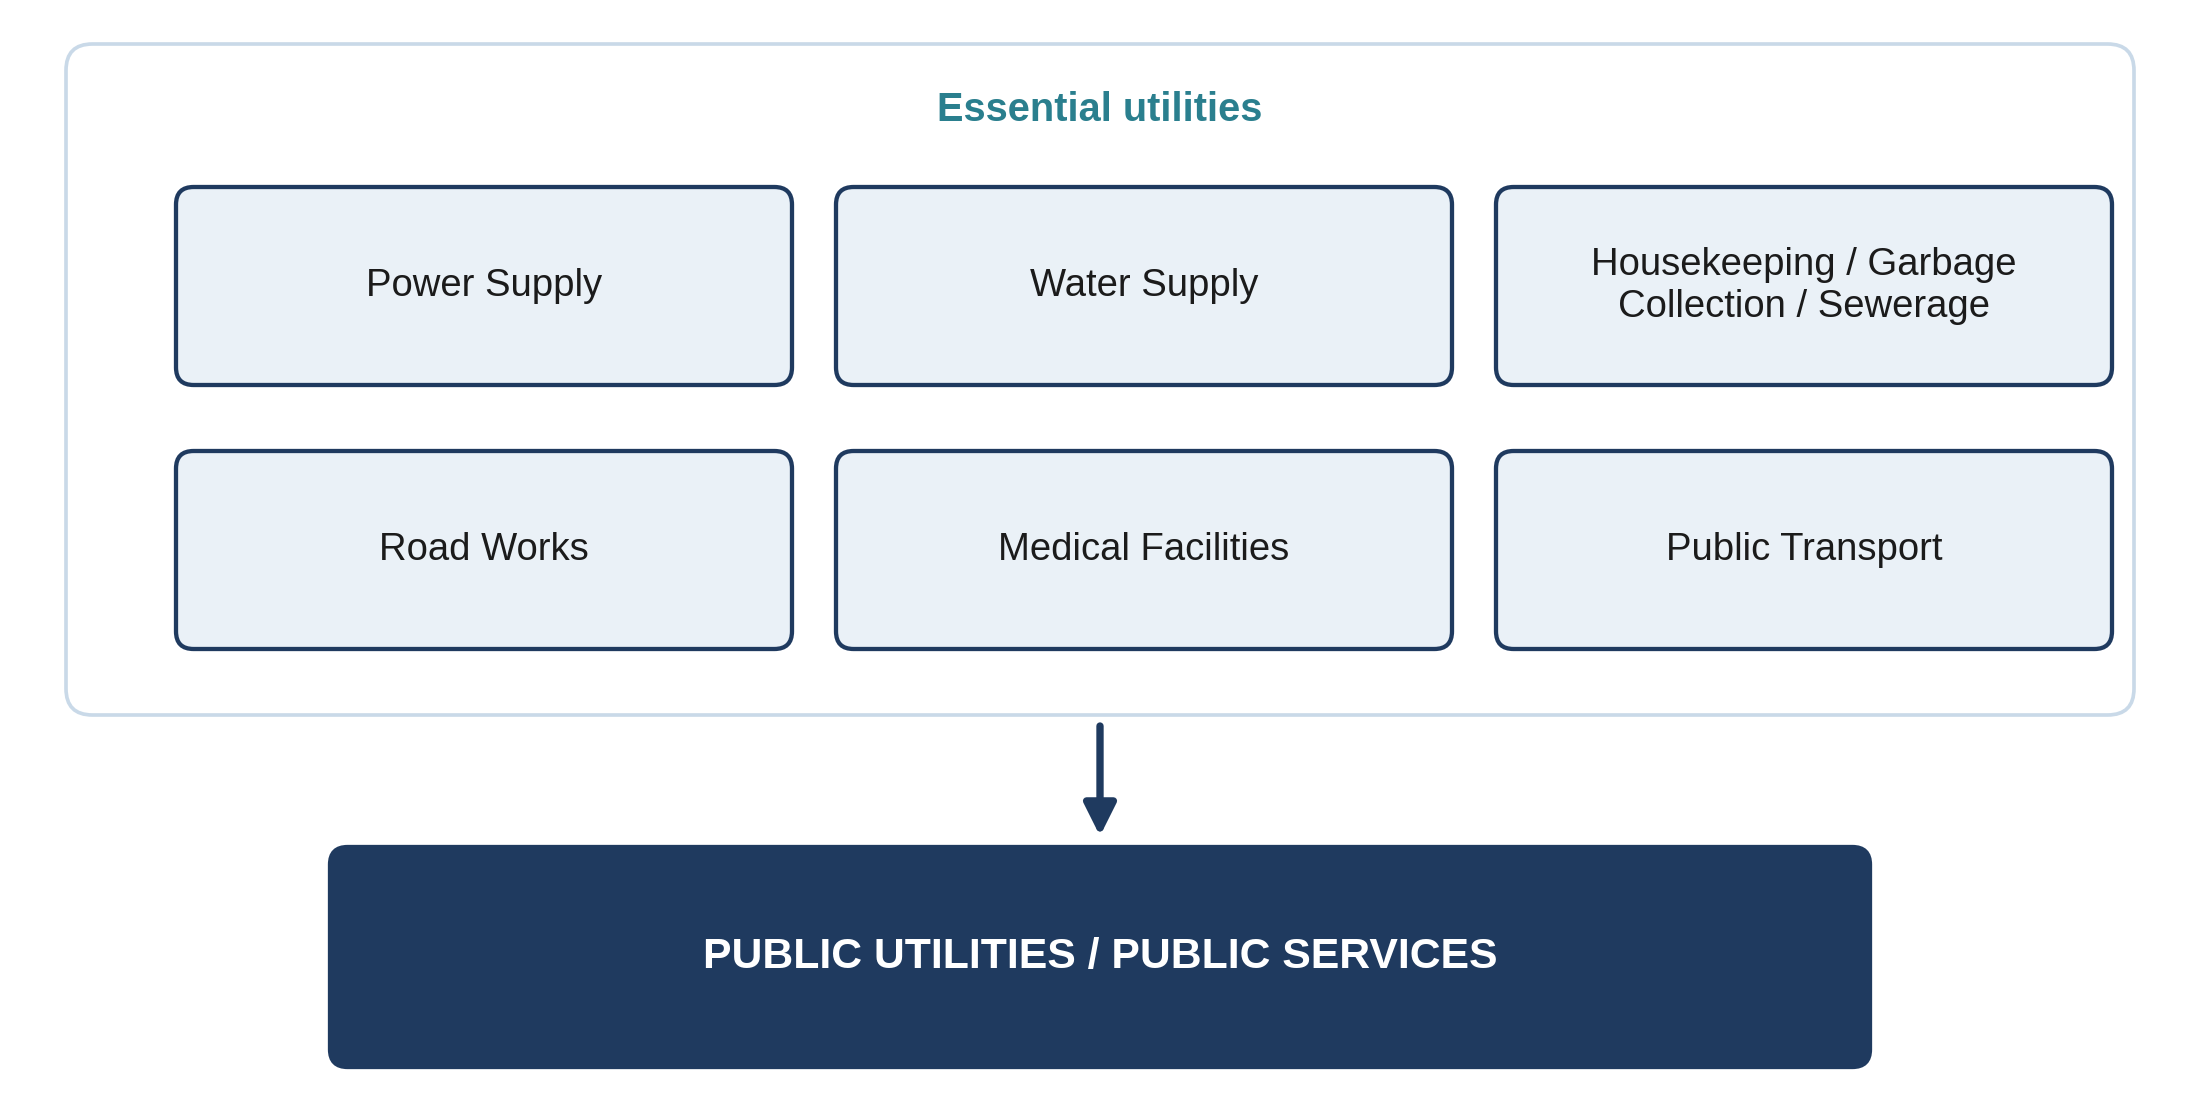
The concept note identifies a broad service portfolio: electric supply, water, drainage and sewerage, garbage collection, transport, street lights, roads and public spaces, and medical facilities. It recommends dividing services by zone, understanding utility systems such as substations and pumping facilities, preparing cost comparisons, considering online monitoring, coordinating road and drainage work, studying loads and future requirements, and testing a proposed model in a sample village. Its proposed monitoring model includes shared data, a single-screen view, a nodal agency, streamlined excavation, and identification of energy and reliability upgrades [1]. Figure 1 groups these essential services into the public-utilities portfolio that the framework addresses.
The concept note is a conceptual proposal rather than a measured case study. It lists data categories but provides no service volumes, budgets, outage records, safety incident counts, energy baselines, or pilot results. Accordingly, the framework below preserves its propositions without presenting invented measurements. Each agency should populate the baseline from its own verified records and field inspections.
3Engineering management framework
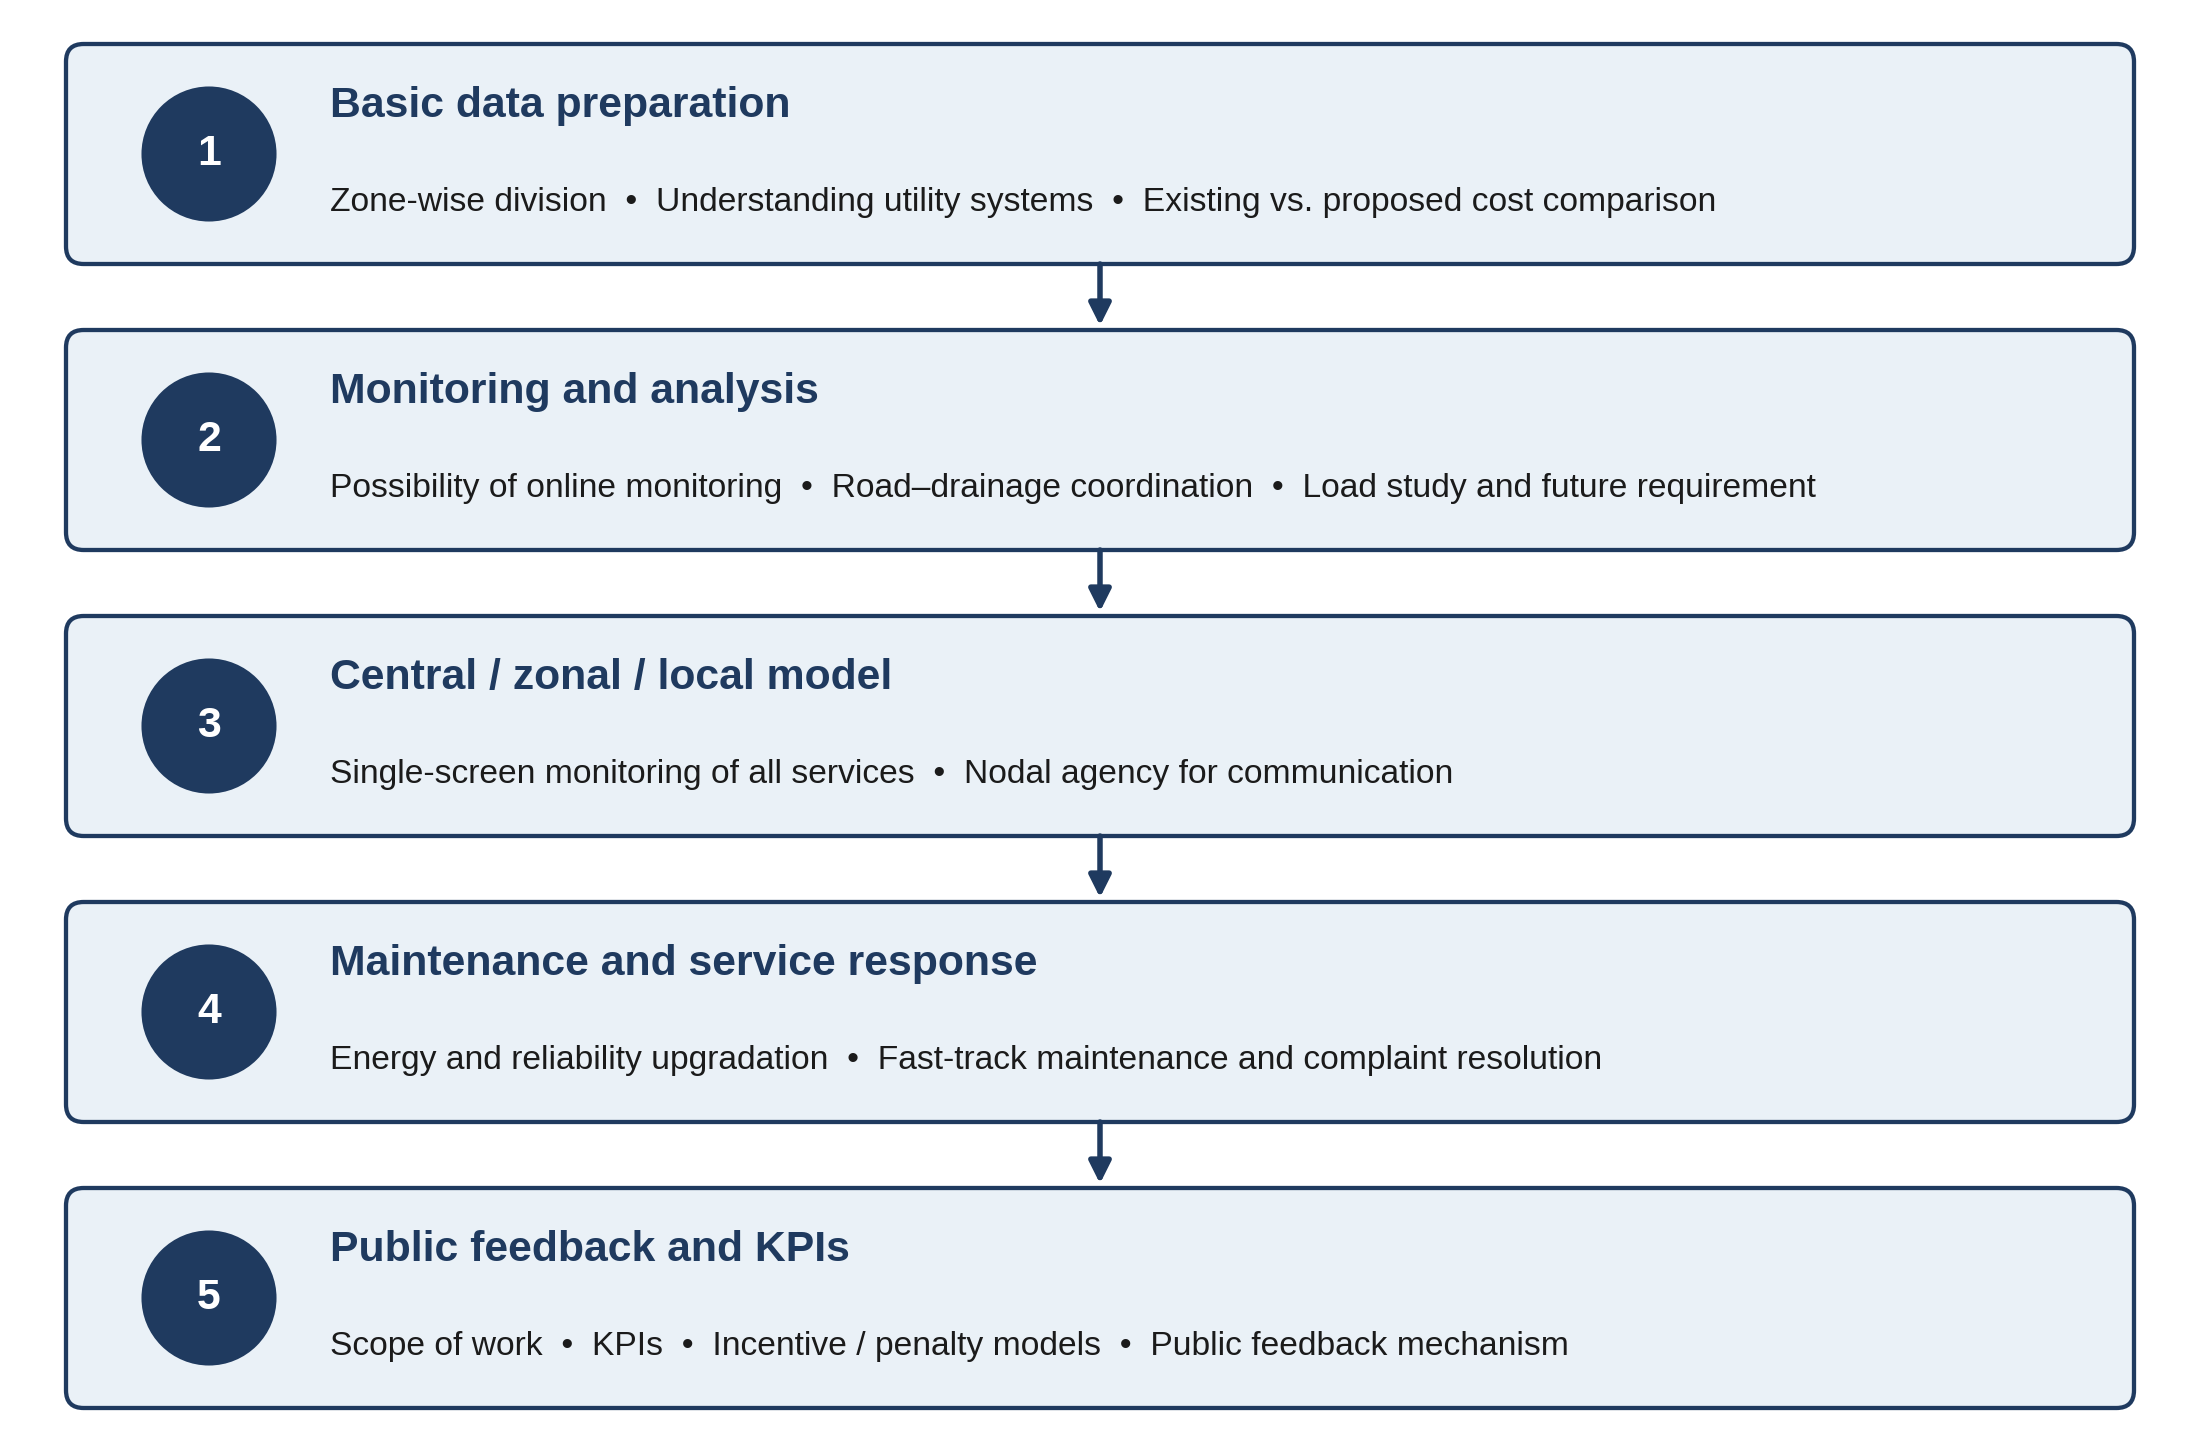
The framework follows the management sequence shown in Figure 2, which runs from baseline data preparation through monitoring and analysis, a central-zonal-local coordination model, maintenance and service response, and public feedback with performance indicators. The subsections below describe the elements of this sequence in turn.
3.1Build a shared service and asset baseline
Create a zone-based register that links each service to its assets, service area, responsible owner, condition, capacity, maintenance history, energy use, and critical dependencies. The register should include power assets, water supply and pumping, sewer and drainage networks, waste collection routes and facilities, public transport, roads, street lights, health facilities, and public spaces. A geographic information system can provide the spatial layer, while a common identifier links the asset to work orders, complaints, inspections, and costs.
Data should have defined owners, update intervals, validation rules, and access controls. The first baseline can be modest: critical assets and high-consequence service locations should be mapped before the agency attempts complete digitization. Field verification matters because old drawings and departmental inventories may disagree.
3.2Prioritize risk, equity, and service criticality
An engineering management team should rank interventions using a transparent multi-criteria method. Factors can include safety exposure, number and vulnerability of people affected, service criticality, asset condition, failure likelihood, repair lead time, energy or water losses, and lifecycle cost. Criteria and weights should be agreed with service departments and disclosed to elected leaders and the public. This avoids allowing asset age or complaint volume alone to determine investment priorities.
3.3Coordinate operations through a nodal function
The concept note proposes a nodal agency for communication and a common monitoring view [1]. A practical model is a public works coordination office that convenes service owners but does not absorb their technical accountability. Each department retains responsibility for operating its assets; the coordination office maintains shared standards, a service dashboard, cross-utility schedules, escalation rules, and an integrated capital plan. A single-screen view should show exceptions and decisions needed, rather than merely displaying data.
3.4Manage lifecycle cost and future demand
Compare existing operating and maintenance costs with proposed interventions over the expected asset life. Include initial capital, energy, labor, consumables, inspection, renewal, outage consequences, and end-of-life costs where data allow. For major assets, test alternative demand scenarios and document assumptions. Load studies, water demand, population growth, transport access, and land development should inform capacity plans. Forecasts should be refreshed on a schedule and whenever material development or service changes occur.
3.5Digital monitoring and engineering control
A practical digital architecture should connect field sensors and meters, communication networks, supervisory platforms such as SCADA or building and utility management systems, analytics and alerts, and strategic planning. Condition data and energy accounting should share asset identifiers so that maintenance decisions can be tested against reliability and consumption outcomes. This architecture follows the integrated utility management approach described for large campuses, adapted here to zone-based public infrastructure and multiple service owners [2]. Technology selection should remain proportional to service criticality, agency capability, interoperability, cybersecurity, and lifecycle cost; digital monitoring supports engineering judgment but does not replace inspections or maintenance crews.
4Service availability, street safety, and energy performance
4.1Service availability
Availability requires more than counting assets. Agencies should monitor continuity, geographic coverage, time to restore service, maintenance backlog, repeat failures, and access for vulnerable users. Critical facilities such as clinics, schools, water points, and transit connections should be identified explicitly. Planned maintenance should be scheduled to reduce disruption and communicated in formats residents can use.
4.2Street and work-zone safety
Street safety should be built into asset planning and work execution. Agencies should inventory lighting coverage, pedestrian and cycling routes, crossing points, drainage hazards, road defects, and crash or near-miss records where available. Before excavation or road renewal, utility owners should coordinate permits, underground asset records, traffic management, pedestrian detours, barriers, and restoration responsibilities. Work-zone inspections and public reporting channels can catch hazards that are not visible in central systems. Safety improvements should be evaluated by exposure and risk, not only by the number of projects completed.
4.3Energy and resource savings
Energy management begins with a verified baseline for facilities, pumps, treatment systems, transport operations, and street lighting. Metering and operational data can identify abnormal consumption, inefficient schedules, losses, or equipment operating outside its intended range. Agencies can then assess control upgrades, efficient equipment, maintenance, and renewable supply where technically and financially suitable. Water losses, pumping energy, sewage flow and treatment, and waste route efficiency should be considered together because operational choices in one service affect resource use in another. Savings should be calculated against a documented baseline and adjusted for changes in service volume or operating conditions.
5Data and performance measurement
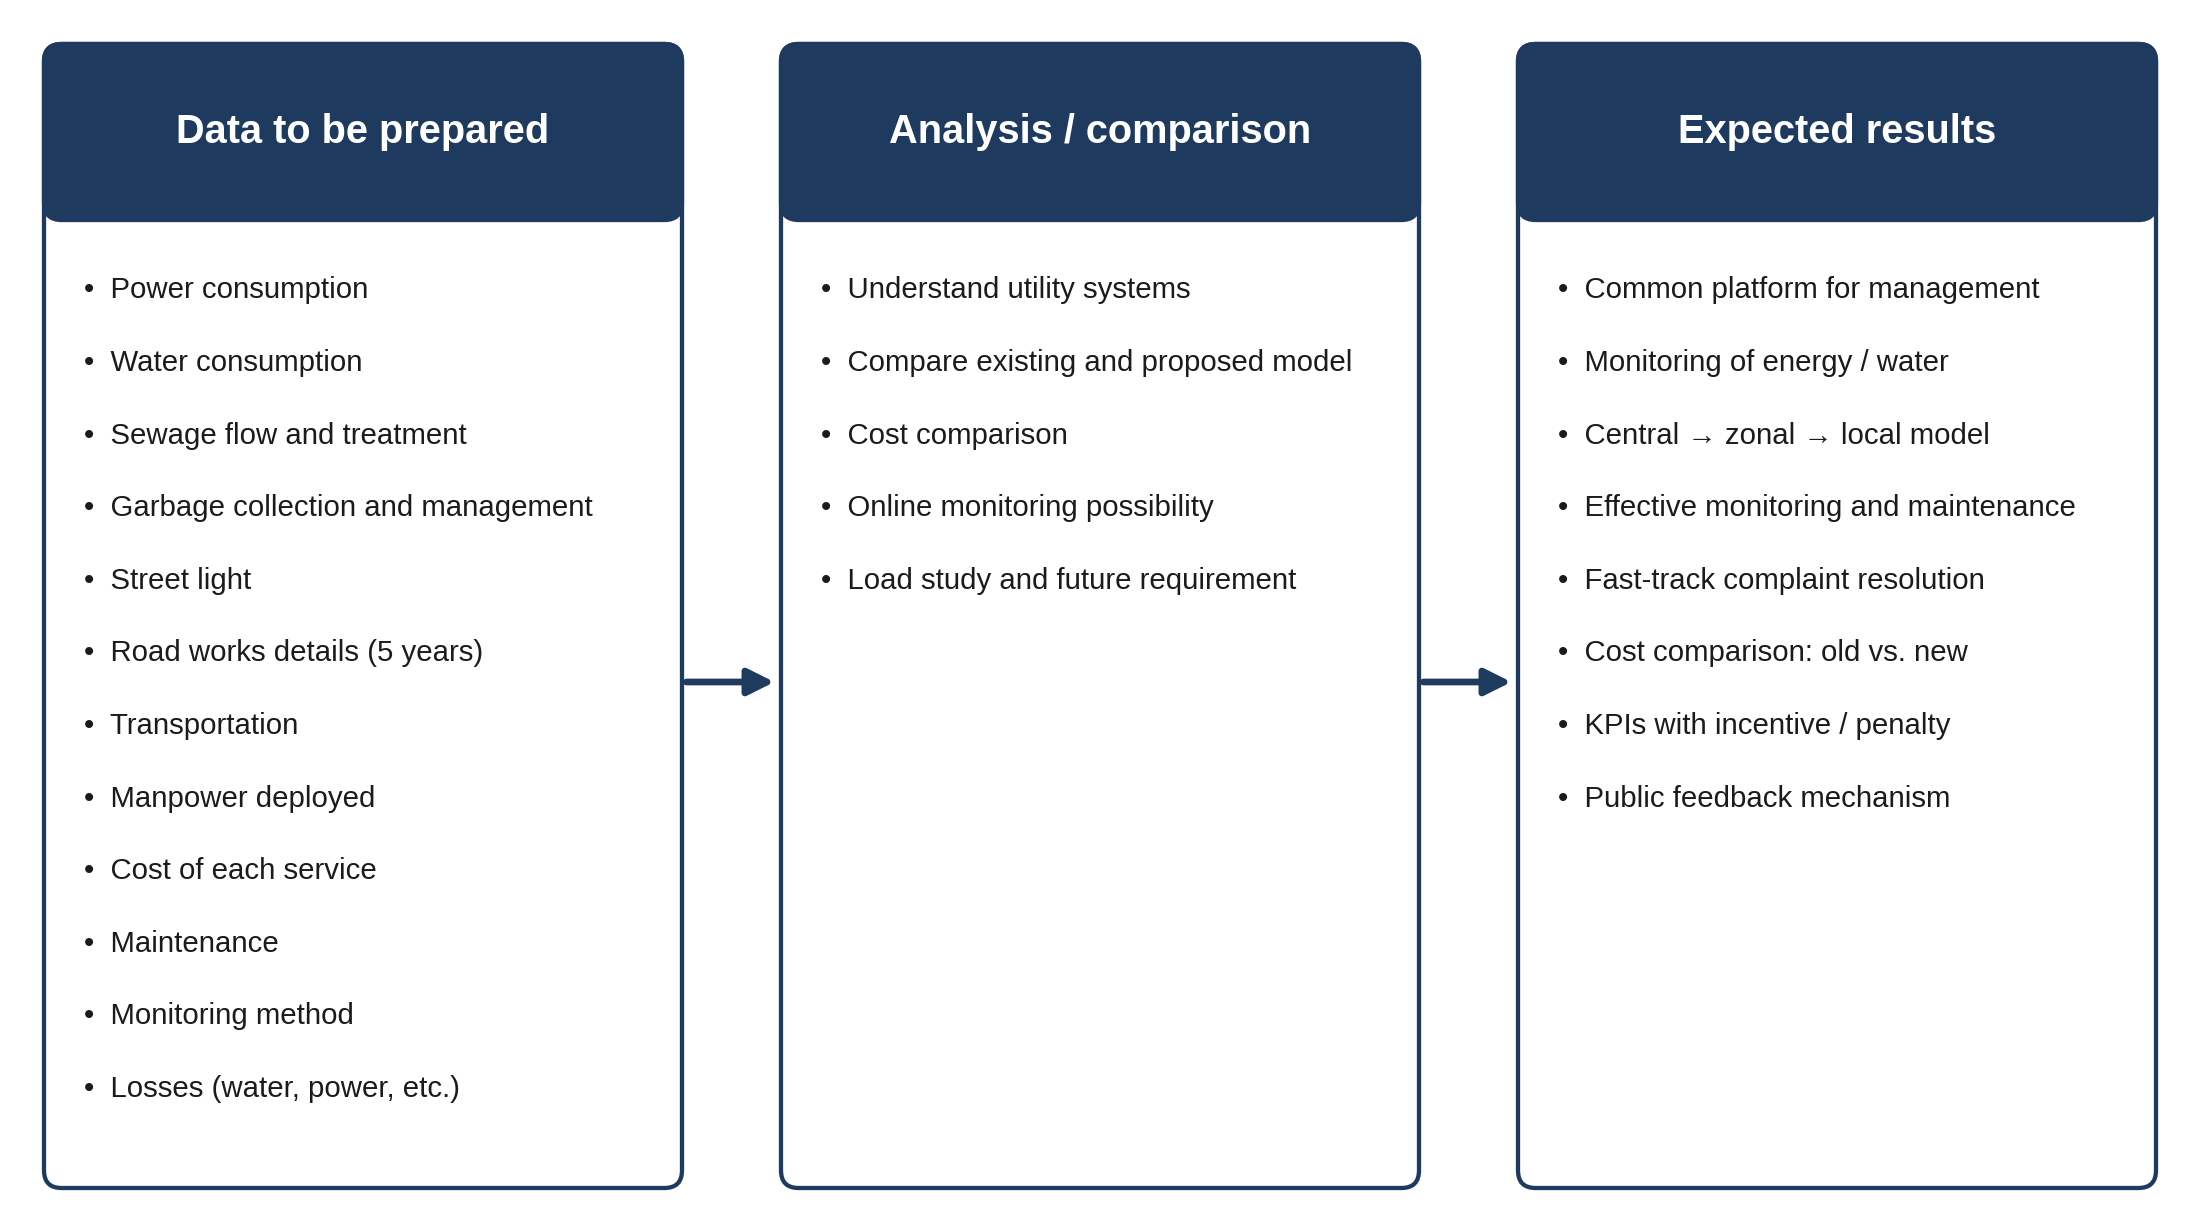
The concept note lists current power consumption, water consumption, sewage flow and treatment, waste management, street lighting, road works, transportation, staffing, service costs, maintenance methods, and losses as required data [1]. Table 1 translates these categories into an operational baseline and adds proposed outcome measures. Measures should be disaggregated by zone and, where lawful and feasible, by service population characteristics so that average performance does not conceal areas with poor access. Figure 3 traces how these data categories feed analysis and comparison and, in turn, the expected results.
| Domain | Baseline data to collect | Proposed management indicator |
|---|---|---|
| Power and lighting | Consumption, outage logs, feeder and lighting assets, operating hours | Energy per service unit; outage duration; share of priority streets meeting lighting standard |
| Water and sanitation | Consumption, source and pump assets, flow, treatment, leakage and overflow records | Hours of supply; non-revenue water or measured loss; treatment compliance; energy per volume |
| Roads and street safety | Road condition, works history, lighting, crashes or hazards, work-zone inspections | Critical defect closure time; hazard recurrence; safe pedestrian access during works |
| Waste and transport | Collection routes, missed pickups, fleet use, ridership and service coverage | On-time collection; route energy or fuel per service unit; access to essential destinations |
| Maintenance and cost | Work orders, labor, contractor roles, unit costs, backlog, response times | Preventive maintenance share; mean time to restore; lifecycle cost variance |
| Community experience | Complaints, channel, location, response and resolution, satisfaction feedback | Acknowledgement and resolution time; repeat complaint rate; resident-reported access |
Indicators must be defined consistently. For example, restoration time should start and end at agreed operational events; a closed complaint should mean the reported condition was addressed or a documented explanation was given. Data quality, coverage, and missingness should be reported with performance results. Targets should be set after a baseline period and reviewed with service owners and community representatives.
The public value measurement model should track both service output and asset utilization. Utilization must be interpreted in context: a reserve asset can be valuable for resilience even when its routine loading is low.
6Implementation and strategic future planning
6.1Phase one: Prepare and select a pilot
Select a representative village or service zone, as proposed in the concept note, with clear boundaries and a manageable set of participating departments. Agree on the outcomes to test, baseline period, service map, data owners, safety protocols, and community feedback channels. Select a pilot that includes meaningful cross-utility dependencies rather than an unusually simple site.
6.2Phase two: Integrate monitoring and work planning
Establish a shared asset register and work-order process. Introduce a common dashboard that displays service interruptions, high-risk assets, maintenance due dates, energy and water exceptions, road works, and unresolved community reports. Run coordination reviews on a fixed cadence. For each intervention, record the issue, alternatives considered, cost and risk rationale, accountable owner, expected service outcome, and follow-up date.
6.3Phase three: Evaluate and scale
Compare pilot performance with its own documented baseline and, where feasible, a similar non-pilot zone. Evaluate service availability, safety, energy and water use, cost, maintenance completion, and resident experience. Separate measured change from external influences such as weather, demand shifts, or new assets. Scale only the practices that show reliable operational value and can be supported by staffing, data governance, and budget.
6.4Plan for future conditions
Strategic plans should consider population and land-use change, aging assets, extreme weather, technology obsolescence, cybersecurity, supply-chain constraints, and workforce succession. Scenario planning can test whether current capacity and emergency arrangements remain adequate under plausible future conditions. Capital projects should be sequenced with maintenance and renewal needs so that new construction does not create unfunded operating obligations. Annual plan reviews should update assumptions and reprioritize projects using current performance evidence.
6.5Procurement readiness for recurring maintenance
Monitoring creates work: alerts and inspections must lead to the right people, materials, and services arriving on time. Agencies should forecast recurring requirements from asset criticality, failure history, preventive maintenance schedules, approved designs, and stores inventory. A procurement plan can define technically vetted specifications, quality checks, delivery expectations, and a pool of eligible sources where allowed by applicable procurement rules. For each work instance, record the scope, site, quantity, urgency, estimated cost, available framework or contract route, comparative evaluation, approval, inspection, and payment evidence. The long-term procurement framework reference proposes vendor availability, competitive rate comparison, just-in-time delivery, quality controls, and an indicative SOP for repeated utility requirements [3]. Any framework or call-off must be reviewed against current applicable procurement rules and the organization's delegated authority; the model here is an engineering workflow, not legal advice.
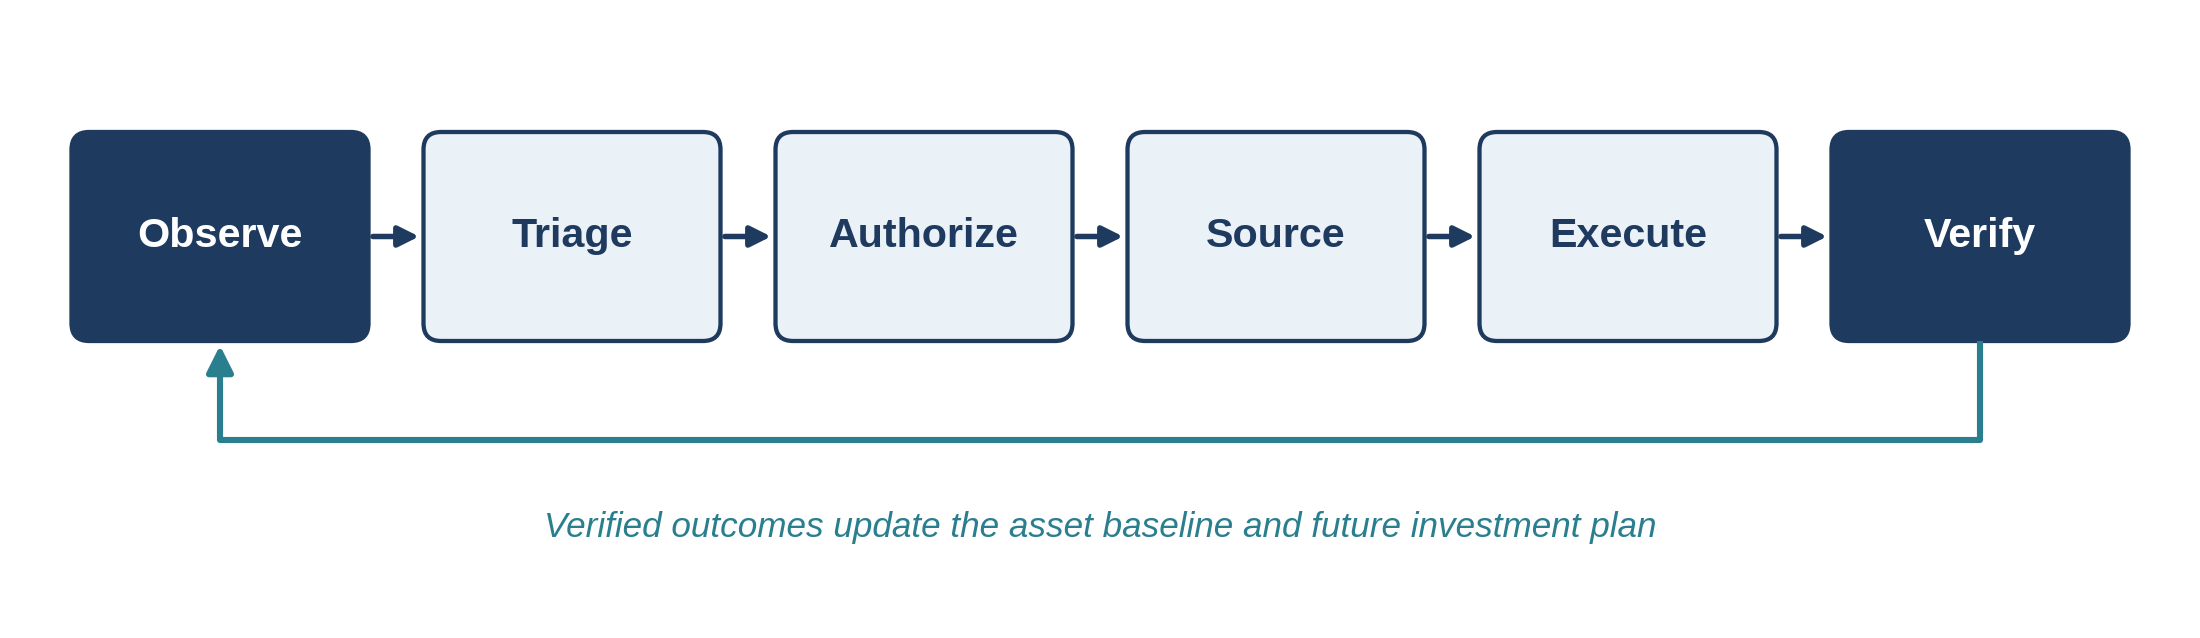
Figure 4 connects field condition evidence to service restoration and future investment planning. Each transition should produce a traceable record linked to the asset and zone.
The following control sequence (Table 2) combines the concept note's coordination model with the digital monitoring and procurement-readiness references [1-3]. The responsible authority and procurement route must be adapted to local rules and organizational delegations.
| Step | Accountable role | Required action | Record / control |
|---|---|---|---|
| 1 Detect and log | Operator, sensor platform, or public works desk | Capture the alert, complaint, inspection finding, location, asset ID, time, and evidence. | Timestamped ticket; data-quality and duplicate check |
| 2 Triage risk | Service engineer and safety focal point | Assess service impact, public exposure, criticality, and urgency; set a response class. | Risk classification; immediate hazard controls |
| 3 Scope and authorize | Asset owner; finance / delegated approver as required | Define repair or service requirement, technical scope, estimate, and approval route. | Approved work order; cost estimate; authority record |
| 4 Confirm procurement readiness | Procurement and stores with technical owner | Check stock, framework eligibility, specification, competition / quotation need, vendor capacity, and delivery lead time. | Procurement route; comparison or justification; purchase record |
| 5 Execute and coordinate | Contractor / crew; nodal coordination office | Schedule service interruption and excavation coordination; use traffic, pedestrian, and work-zone controls. | Permit; work plan; safety checklist; daily progress |
| 6 Inspect and restore | Engineer / quality inspector; service operator | Verify material, workmanship, testing, reinstatement, and service restoration before closure. | Inspection and test record; as-built update; handover |
| 7 Verify outcome and learn | Asset owner and performance analyst | Close the ticket only after evidence; review repeat faults, energy / loss change, response, and user feedback. | Verified closure; KPI update; corrective or capital action |
7Governance and accountability
The proposed model depends on clear decision rights. Service departments own technical standards and asset data; the coordinating function maintains integration and escalation; finance validates lifecycle and budget assumptions; procurement embeds performance and safety requirements in contracts; and community channels provide localized evidence. Performance agreements can define scope, service levels, reporting cadence, and remedies. Incentives or penalties, as suggested in the concept note, should be tied to controllable and auditable results, with safeguards against gaming or neglect of difficult-to-serve areas.
Public reporting should explain what is measured, how often data are updated, where gaps remain, and what action is underway. Personally identifying complaint data should be protected, and operational technology should be secured according to its risk. Governance should include procedures for correcting inaccurate asset records, resolving cross-department disputes, and escalating urgent safety or service risks.
8Expected benefits and limitations
If implemented with reliable data and sustained coordination, the framework can help agencies identify service gaps sooner, reduce duplicate excavation and unplanned maintenance, target upgrades to high-risk assets, improve visibility of energy and water losses, and connect public feedback to work orders. It can also improve the quality of long-term investment choices by comparing lifecycle cost and service outcomes across zones. These are expected mechanisms, not measured results.
The approach has limitations. Integrated monitoring depends on compatible records, staff capacity, data quality, and clear responsibility. Technology alone cannot replace field inspections, skilled maintenance, or adequate operating budgets. Small agencies may need a staged approach and shared regional services. KPI targets also require local calibration; applying a single threshold across different settlement patterns or service conditions may misstate performance.
9Conclusion
India's fast-growing infrastructure portfolio is essential to electrification, industrial and agricultural development, mobility, water access, and community services. The value of this public investment depends on more than construction: agencies must monitor and maintain assets so they remain safe, energy-efficient, reliable, and well utilized throughout their service life. This paper develops the public-works concept note into a repeatable management cycle of asset and service baseline preparation, risk-based prioritization, coordinated maintenance, procurement readiness, outcome verification, and strategic renewal. Digital monitoring should connect field conditions and energy use to accountable work orders, while lifecycle planning should align operating capacity, maintenance resources, and future demand. Public agencies should begin with a representative pilot, establish verified baselines and transparent indicators, and scale practices after evaluating service and community outcomes. Consistent monitoring and timely maintenance can help protect the safety of infrastructure, improve the utilization of invested public money and time, and sustain the services needed for India's planned development.
References
- [1]Rajendra Prasad N. Future of public works management: a guide for benchmarking the public utilities for developed nation. Unpublished concept note. Mumbai: Electrical Maintenance Division, IIT Bombay; 2026.
- [2]Rajendra Prasad N, Kalvacherla S. Integrated utility management for large campuses: a digital framework for reliability improvement and energy conservation. Iconic Research and Engineering Journals. 2026;10(3):3740–3756. https://doi.org/10.64388/IREV10I3-1723537
- [3]Rajendra Prasad N, Dhangar S, Acharya N. A long-term procurement framework for repeated public utility services: a model for timely, competitive and quality-oriented procurement. Iconic Research and Engineering Journals. 2026;10(4):158–167. https://doi.org/10.64388/IREV10I4-1723615